
10-1© 2000 McGraw-Hill Ryerson Limited
C H A P T E R T E N
MARKET SEGMENTATION,TARGETING, AND POSITIONING

10-2© 2000 McGraw-Hill Ryerson Limited
AFTER READING THIS CHAPTER YOU SHOULDAFTER READING THIS CHAPTER YOU SHOULDBE ABLE TO:BE ABLE TO:
� Explain what market segmentation is, when to use it, and thefive steps involved in segmentation.
� Recognize the different dimensions used to segment consumerand organizational markets.
� Develop a market-product grid to use in segmenting andtargeting a market.
� Interpret a cross tabulation to analyze market segments.
� Understand how marketing managers position products inthe marketplace.
10-3© 2000 McGraw-Hill Ryerson Limited
Sneakers Story: From Little Skirmishes to All-out WarSneakers Story: From Little Skirmishes to All-out War
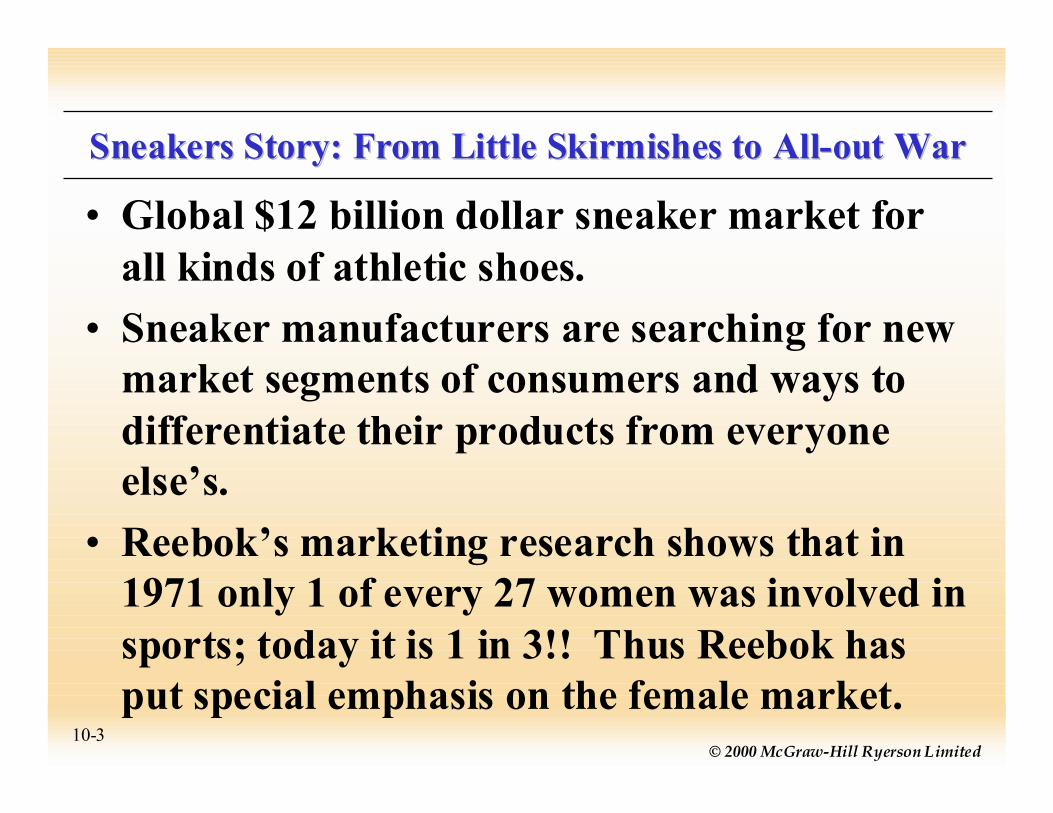
� Global $12 billion dollar sneaker market forall kinds of athletic shoes.
� Sneaker manufacturers are searching for newmarket segments of consumers and ways todifferentiate their products from everyoneelse�s.
� Reebok�s marketing research shows that in1971 only 1 of every 27 women was involved insports; today it is 1 in 3!! Thus Reebok hasput special emphasis on the female market.

10-4© 2000 McGraw-Hill Ryerson Limited
Market Segmentation DefinedMarket Segmentation Defined
Market segmentation involves aggregatingprospective buyers into groups that:
1. Have common needs and
2. Will respond similarly to the marketing action.
The groups that result from the
market segmentation process are
called market segments, a relatively
homogeneous collection of prospective buyers.

10-5© 2000 McGraw-Hill Ryerson Limited
Product Differentiation DefinedProduct Differentiation Defined
Product differentiation, in the broadest sense,involves a firm�s using different marketing mixactivities, such as product features and advertising,to help consumers perceive the product as beingdifferent and better than competing products. Theperceived differences may involve physical ornonphysical features, such as image or price.
In a narrower sense, product differentiation involvesa firm�s selling two or more products with differentfeatures targeted to different market segments.

10-6© 2000 McGraw-Hill Ryerson Limited
PP10-1 Market Segmentation Links Market Needs to PP10-1 Market Segmentation Links Market Needs to an Organization�s Marketing Program an Organization�s Marketing Program
Identify marketneeds
Benefits in termsof:
�Product Features�Expense�Quality�Savings in timeand convenience
Process ofsegmenting andtargeting markets
Execute marketing program
A marketing mix in terms of:�Product�Price�Promotion�Place

10-7© 2000 McGraw-Hill Ryerson Limited
PP10-2 Reebok Market-Product GridMarket Segment Product
GROUP Running Aerobic Tennis Basketball Children�s Walking Cross Step Athletic Golf WITH Shoes Shoes Shoes Shoes Shoes Shoes Train�g Train�g clothing shoes
General NEED 1981 1982 1984 1984 1984 1986 1988 1991 1993 1997
runners P P
Performance- aerobic P p
conscious dancers
consumers tennis P P
(athletes) players
basketball P P
players
step S P
exercisers
golfers P P
Fashion- comfort & S S S S S S S
conscious style
consumers conscious
(nonathletes) walkers S S S S P P
children P
KEY: P=Primary Market S=Secondary Market

10-8© 2000 McGraw-Hill Ryerson Limited
When To SegmentWhen To Segment
1. One Product & Multiple
Market Segments
2. Multiple Products & Multiple
Market Segments
3. Segments of One: Mass
Customization

10-9© 2000 McGraw-Hill Ryerson Limited
Concept CheckConcept Check
1. Market segmentation involvesaggregating prospective buyers intogroups that have two keycharacteristics. What are they?
2. What is product differentiation?
3. The process of segmenting andtargeting markets is a bridge betweenwhat two marketing activities?

10-10© 2000 McGraw-Hill Ryerson Limited
PP10-3 Five Steps in Segmenting and Targeting MarketsPP10-3 Five Steps in Segmenting and Targeting Markets
Identifymarketneeds
Steps in segmenting andtargeting markets�Form prospective buyersinto segments
�Form products to be soldinto groups
�Develop a market-productgrid and estimate size ofmarkets
�Select target markets�Take marketing actions toreach target markets
Execute
marketing
program

10-11© 2000 McGraw-Hill Ryerson Limited
Criteria to Use in Forming Market SegmentsCriteria to Use in Forming Market Segments
1. 1. Potential for increased profit and ROI.Potential for increased profit and ROI.
2.2. Similarity of needs of potential buyers within aSimilarity of needs of potential buyers within a
segment.segment.
3.3. Difference of needs of buyers among Difference of needs of buyers among segments.segments.
4.4. Feasibility of marketing action to reach a Feasibility of marketing action to reach a segment.segment.
5.5. Simplicity and cost of assigning potential buyersSimplicity and cost of assigning potential buyers
to segments.to segments.

10-12© 2000 McGraw-Hill Ryerson Limited
MAIN DIMENSION SEGMENTATION TYPICAL
VARIABLES BREAKDOWNSCUSTOMER CHARACTERISTICS
Geographic
Demographic
RegionCity or CensusMetropolitan area(CMA) sizeDensityClimate
Atlantic, Quebec, Ontario, Prairies, British ColumbiaUnder 5,000; 5,000-19,999; 20,000-49,999; 50,000-99,999; 100,000-249,999; 250,000-499,999; 500,000-999,999; 1,000,000 or more
Urban; suburban; small town; ruralEast; West
GenderAge
RaceLife StageIncome
Family sizeHome ownershipEducation
Male; female
Under 6; 6-11; 12-17; 18-24; 25-34; 35-44; 45-54; 55-64; 65-74; 75 and over
White; Black; Asian; Native; otherYoung single; young married; older married; etc.Under $10,000; 10,000-19,9999; 20,000-29,999; 30,000-39,999 40,000-54,999; 55,000-74,999; $75,000+
1; 2; 3; 4; 5 or moreOwn home; rent homeGrade school or less; some high school; high school graduate;some college; college graduate
PP10-4a Canadian Consumer Market Segmentation VariablesPP10-4a Canadian Consumer Market Segmentation Variables

10-13© 2000 McGraw-Hill Ryerson Limited
PP10-4b Canadian Consumer Market Segmentation VariablesPP10-4b Canadian Consumer Market Segmentation Variables
MAIN DIMENSION SEGMENTATION TYPICAL
VARIABLES BREAKDOWNS
CUSTOMER CHARACTERISTICS
Behavioural
Psychographic
Benefits soughtUsage rateUser statusLoyalty status
Quality; service; low cost Light user; medium user; heavy user
Non-user; ex-user; prospect; first-time user; regular user None; medium; strong
Personality
Lifestyle (GoldFarbSegments)
Gregarious; compulsive; extroverted; introverted
Structured; discontented; fearful; assured;resentful; caring
10-14© 2000 McGraw-Hill Ryerson Limited
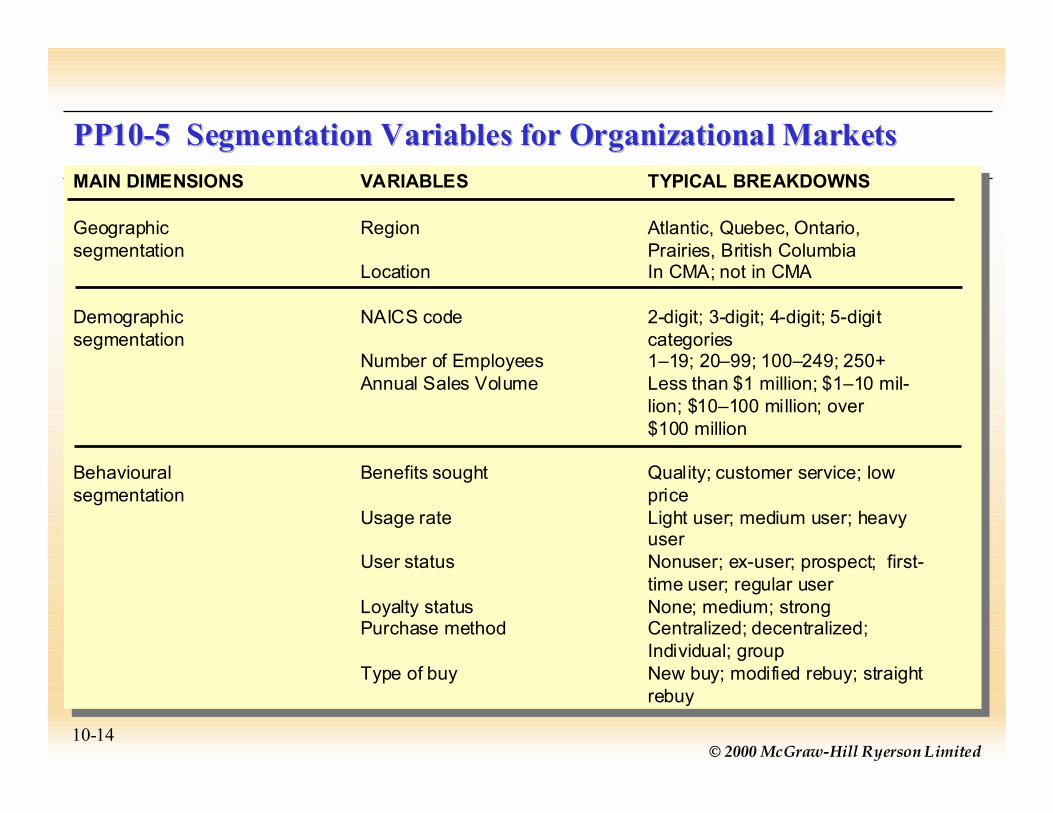
MAIN DIMENSIONS VARIABLES TYPICAL BREAKDOWNS
Geographic Region Atlantic, Quebec, Ontario,segmentation Prairies, British Columbia
Location In CMA; not in CMA
Demographic NAICS code 2-digit; 3-digit; 4-digit; 5-digitsegmentation categories
Number of Employees 1�19; 20�99; 100�249; 250+Annual Sales Volume Less than $1 million; $1�10 mil-
lion; $10�100 million; over$100 million
Behavioural Benefits sought Quality; customer service; lowsegmentation price
Usage rate Light user; medium user; heavyuser
User status Nonuser; ex-user; prospect; first-time user; regular user
Loyalty status None; medium; strongPurchase method Centralized; decentralized;
Individual; groupType of buy New buy; modified rebuy; straight
rebuy
PP10-5 Segmentation Variables for Organizational MarketsPP10-5 Segmentation Variables for Organizational Markets

10-15© 2000 McGraw-Hill Ryerson Limited
PP10-6 Selecting a Target Market for your Fast-Food RestaurantPP10-6 Selecting a Target Market for your Fast-Food Restaurant Next to an Urban University Next to an Urban University
PRODUCTS: MEALS
BETWEEN- AFTER- BREAK- MEAL DINNER
MARKETS FAST LUNCH SNACK DINNER SNACK
STUDENTDormitoryApartmentDay Commuter Night Commuter
NONSTUDENTFaculty or StaffLive in areaWork in area
0 1 3 0 31 3 3 2 10 3 2 1 00 0 1 3 2
0 3 1 1 00 1 2 2 11 3 0 1 0
Key: 3 Large market; 2 meduim market; 1 small market; 0 no market
10-16© 2000 McGraw-Hill Ryerson Limited
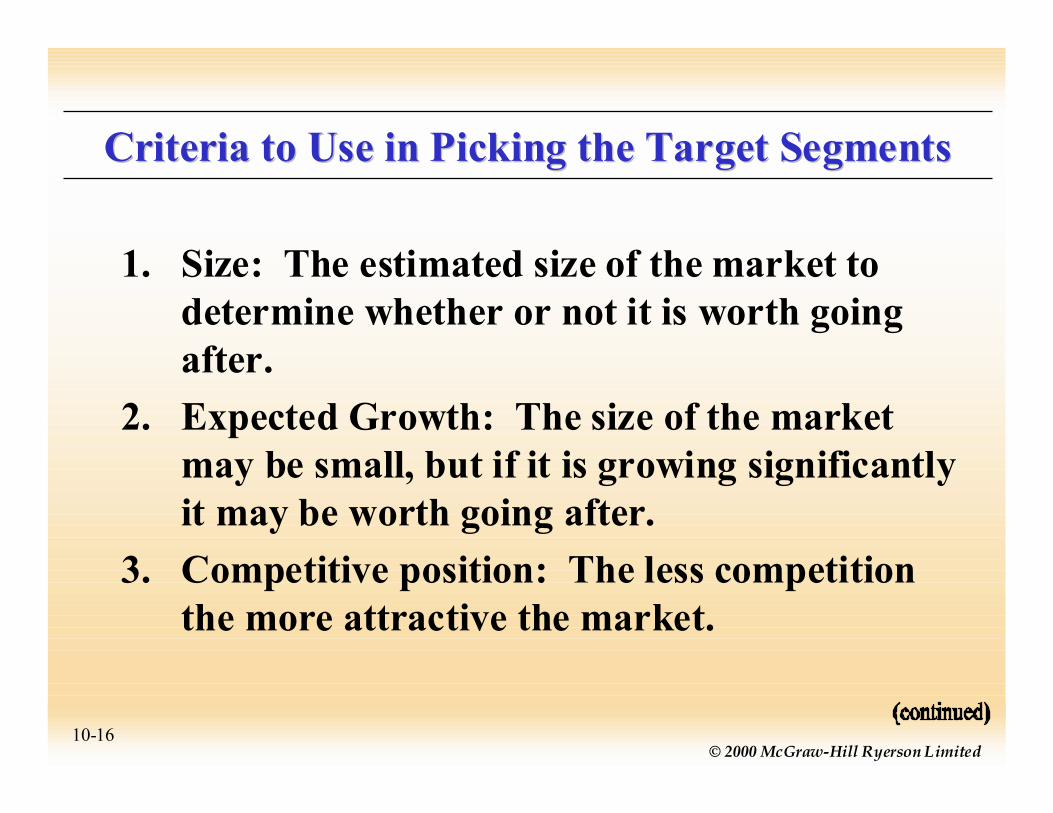
Criteria to Use in Picking the Target SegmentsCriteria to Use in Picking the Target Segments
1. Size: The estimated size of the market to determine whether or not it is worth going after.
2. Expected Growth: The size of the market may be small, but if it is growing significantlyit may be worth going after.
3. Competitive position: The less competition the more attractive the market.

10-17© 2000 McGraw-Hill Ryerson Limited
Criteria to Use in Picking the Target SegmentsCriteria to Use in Picking the Target Segments
4. Cost of reaching the market: Is the market
accessible to a firm�s marketing actions?
If not it should not be pursued.
5. Compatibility with the organization�s
objectives and resources.

10-18© 2000 McGraw-Hill Ryerson Limited
PP10-7 Advertising Actions to Reach Specific Student SegmentsPP10-7 Advertising Actions to Reach Specific Student Segments
PRODUCTS: MEALS
BETWEEN- AFTER- MEAL DINNER
MARKETS LUNCH SNACK DINNER SNACK
Dormitory studentsApartment studentsDay Commuter students Night Commuter students
1 3 0 33 3 1 13 2 1 00 1 3 2
Ads in buses; flyersunder windshield wipers
of cars in parking lots
Ad campaign:�Ten percent off allpurchases between2:00 and 4:30 P.M.
during winter quarter�
Ad on flyer underwindshield wipers
of cars in nightparking lots: �Free
Frosty with thiscoupon when youbuy a hamburgerand french fries�

10-19© 2000 McGraw-Hill Ryerson Limited
PP10-MNN Apple�s Segmentation Strategy
MARKETS PRODUCTS (PERSONAL COMPUTERS)
EDUCATION
COMMERICAL
SECTOR
Consumer/ household
Primarythrough OAC
Community College and University
Small business
Large business
Design and Publishing
SEGMENT
Family/ Games
StudentsFaculty/ administrationStudentsFaculty/ administration
Owners/ employeesAdministration/ technicalMedia/graphics/ InternetDesktop publishing
POWERMACINTOSH
G3
√√
√
√
√
√√
POWERBOOKG3
√√
√
√
√
√√
IMAC
√
√
√
POWERMACINTOSHG3 SERVER
√
√
√
√
√√

10-20© 2000 McGraw-Hill Ryerson Limited
Concept CheckConcept Check
1. What are some of the variables used to
segment customer markets?
2. What are some criteria used to decide
which segments to choose for targets?
3. Why is usage rate important in
segmentation studies?

10-21© 2000 McGraw-Hill Ryerson Limited
Definition of Cross TabulationDefinition of Cross Tabulation
A cross tabulation, or �cross-tab� is . . . .A cross tabulation, or �cross-tab� is . . . .
a method of presenting and relating data having two or
more variables. Cross tabs are used to analyze and
discover relationships in the data.
An important aspect of cross tabulations is deciding
which two variables should be paired together for
analysis.
a method of presenting and relating data having two or
more variables. Cross tabs are used to analyze and
discover relationships in the data.
An important aspect of cross tabulations is deciding
which two variables should be paired together for
analysis.

10-22© 2000 McGraw-Hill Ryerson Limited
PP10-8 Cross TabulationsPP10-8 Cross Tabulations
AGE OFHEAD OF ONCE 2 OR 3 ONCEHOUSEHOLD A WEEK TIMES A MONTH(YEARS) OR MORE A MONTH OR LESS TOTAL
FREQUENCY
24 or less 25 to 3940 or overTotal
144 52 19 21546 58 29 13382 69 87 238272 179 135 586
A. ABSOLUTE FREQUENCIES
B. ROW PERCENTAGES: RUNNING PERCENTAGES HORIZONTALLY AGE OFHEAD OF ONCE 2 OR 3 ONCEHOUSEHOLD A WEEK TIMES A MONTH(YEARS) OR MORE A MONTH OR LESS TOTAL
24 or less 25 to 3940 or overTotal
67.0% 24.2 8.8 100.0%34.6 43.6 21.8 100.034.4 29.0 36.6 100.046.4% 30.6% 23.0% 100.0%

10-23© 2000 McGraw-Hill Ryerson Limited
The Value of Cross TabulationsThe Value of Cross Tabulations
�� The most widely used technique forThe most widely used technique for
organizing and presenting marketingorganizing and presenting marketing
data.data.
�� The simple format allows directThe simple format allows direct
interpretation and an easy means ofinterpretation and an easy means of
communicating data to management.communicating data to management.

10-24© 2000 McGraw-Hill Ryerson Limited
The Value of Cross TabulationsThe Value of Cross Tabulations
�� They have great flexibility and can beThey have great flexibility and can beused to summarize experimental,used to summarize experimental,observational, and questionnaire data.observational, and questionnaire data.
�� The ultimate value of cross tabulations toThe ultimate value of cross tabulations toa marketing manager lies in obtaining aa marketing manager lies in obtaining abetter understanding of the wants andbetter understanding of the wants andneeds of buyers andneeds of buyers and targeting keytargeting keysegments.segments.
10-25© 2000 McGraw-Hill Ryerson Limited
Product PositioningProduct Positioning
Product Positioning refers to the place an offeringoccupies in consumers� minds on importantattributes relative to competitive offerings.
2 Approaches to Product Positioning:
1. Head-to-Head Positioning: involves competing directly with competitors on similar attributes inthe same target market.
2. Differentiation Positioning: involves seeking a less competitive, smaller market niche in which to locate a brand.
10-26© 2000 McGraw-Hill Ryerson Limited
Perceptual MapsPerceptual MapsA key to positioning a product effectively is theperceptions of consumers. In determining abrand�s position and the preferences ofconsumers, companies obtain three types of datafrom consumers:
1. Evaluations of the important attributes for aproduct class.
2. Judgments of the existing brands with the important attributes.
3. Ratings of an �ideal� brand�s attributes.

10-27© 2000 McGraw-Hill Ryerson Limited
Perceptual MapsPerceptual Maps
From these data, it is possible
to develop a perceptual map, a
means of displaying via two
dimensions the location products
or brands occupy in the minds of
consumers.

10-28© 2000 McGraw-Hill Ryerson Limited
PP10-9 GM�s Strategy to Reposition Its Major Car BrandsPP10-9 GM�s Strategy to Reposition Its Major Car Brands
A. Consumer perceptions in 1982 [o] and GM goals for 1990 [�]
B. Potential change in goals from 1990 [�] to 2002
High Price
Low Price
Family/Conservative
Personal/Expressive
�Cadillac o �Buick o
Chevrolet o �
o Pontiac �
� Saturn (1990)
� Oldsmobile o
High Price
Low Price
Family/Conservative
Personal/Expressive
Cadillac �
Buick �
Oldsmobile
?
?
?
??
Chevrolet �
�
� Saturn
�Pontiac

10-29© 2000 McGraw-Hill Ryerson Limited
RepositioningRepositioning
Repositioning involves changing
the place an offering occupies in a
consumer�s mind relative to
competitive offerings.

10-30© 2000 McGraw-Hill Ryerson Limited
Concept CheckConcept Check
1. What is cross tabulation?
2. What are some advantages of cross
tabulations?
3. Why do marketers use perceptual
maps in product positioning
decisions?

10-31© 2000 McGraw-Hill Ryerson Limited
SLN10-1SLN10-1 Market-Product Grid Showing Size of Markets for Market-Product Grid Showing Size of Markets for Pillows for Three Different Segments of SleepersPillows for Three Different Segments of Sleepers
Products
Medium
Markets Soft Pillow Pillow Firm Pillow
Stomach Sleepers L M S
Back Sleepers M L M
Side Sleepers S M L
KEY: L, Large Market; M, medium market; S, small market
L
L
L

![[PPT]Chapter 8 Market Segmentation, Targeting, and …faculty.unlv.edu/npomirleanu/Chapter 07.ppt · Web viewChapter 7 Segmenting and Targeting Markets * * * * Chapter 7 Segmenting](https://static.documents.pub/doc/80x56/5ad027c67f8b9aca598d5376/pptchapter-8-market-segmentation-targeting-and-07pptweb-viewchapter-7-segmenting.jpg)


