
Market Structure and Media Diversity1
Scott J. Savage, Donald M. Waldman, Scott Hiller
University of Colorado at Boulder
Department of Economics
Campus Box 256
Boulder, CO 80309-0256
Abstract
We estimate the demand for local news service described by the offerings from
newspapers, radio, television, the Internet, and Smartphone. The results show that the
representative consumer values diversity in the reporting of news, more coverage of
multicultural issues, and more information on community news. About two-thirds of consumers
have a distaste for advertising, which likely reflects their consumption of general, all-purpose
advertising delivered by traditional media. Demand estimates are used to calculate the impact
on consumer welfare from a marginal decrease in the number of independent television stations
that lowers the amount of diversity, multiculturalism, community news, and advertising in the
market. Welfare decreases, but the losses are smaller in large markets. For example, small-market
consumers lose $53 million annually while large-market consumers lose $15 million. If the
change in market structure occurs in all markets, total losses nationwide would be about $830
million.
September 25, 2012
Key words: market structure, media diversity, mixed logit, news, welfare
JEL Classification Number: C9, C25, L13, L82, L96
1 The Federal Communications Commission (FCC) and the Time Warner Cable (TWC) Research Program on
Digital Communications provided funding for this research. We are grateful to Jessica Almond, Fernando
Laguarda, Jonathan Levy, and Tracy Waldon for their assistance during the completion of this project. Yongmin
Chen, Nicholas Flores, Jin-Hyuk Kim, David Layton, Edward Morey, Gregory Rosston, Bradley Wimmer, and
seminar participants at the University of California, University of Colorado, SUNY and attendees at the
Conference in Honor of Professor Emeritus Lester D. Taylor at Jackson Hole provided helpful comments and
contributions. Any opinions expressed here are those of the authors and not those of the FCC or TWC.
1
1. INTRODUCTION
Information on news and current affairs can raise political awareness and promote a
range of ideas. With the assumption that unregulated media markets supply too little variety,
many societies have charged regulators with ensuring there are sufficient opportunities for
different, new, and independent viewpoints (which we shall refer to as “diversity” below), and
that media respond to the interests of their local communities (“localism”). In the U.S., the
Federal Communications Commission (FCC) has traditionally limited the amount of common-
and cross-ownership of newspapers, radio and television (TV) stations. Recently, the FCC
relaxed ownership rules and refocused their attention on market forces; for example, consumer
preferences and new media, such as satellite, the Internet, and Smartphone, in order to deliver
their diversity and localism goals. Given the increase in choices through new media, supporters
of greater ownership concentration argue that traditional media should be free to consolidate
and use the efficiencies to provide more diverse and local news programming. Opponents
question whether such efficiencies are achievable, and argue that large, consolidated media
corporations are not flexible enough to serve the interests of local and minority communities.
Evaluation of these arguments requires, among other things, measurement of the
expected societal benefits that arise from increased media diversity and localism, and how these
benefits change with regulatory interventions that shape media market structure. In this paper,
we estimate consumer preferences for their local news and current affairs service (“news service”)
described by the offerings from newspapers, radio, TV, the Internet, and Smartphone. News
service characteristics are diversity of opinion in the reporting of information, coverage of
multiculturalism issues, amount of information on community news and events, and amount of
space or time devoted to advertising. We use our demand estimates to calculate the impact on
2
consumer welfare from a change in media market structure that reduces the number of
independent TV stations in the market. Specifically, we employ the willingness-to-pay (WTP)
construct to measure the welfare effects between the news service supplied to the consumer
before the change in market structure and the service supplied after the change. We focus on
broadcast TV stations because they are the main source of news for most households and
because the FCC has direct oversight of their ownership structure.2 By relating consumer
valuations of news service to a measure of TV market structure, it is possible to indirectly
assess the extent to which ownership rules address the policy goals of diversity and localism.
We estimate our demand model with discrete choice data obtained from a nationwide
survey of U.S. households during March, 2011. Results show that diversity of opinion,
community news, and advertising are important characteristics of local news services. The
representative consumer is willing to pay from $21 to $25 per month for an increase in
diversity of opinion (and approximately the same for community news) from a low to a
medium level (defined in Table 1), but only an additional $6 to $7 to move to a high level of
diversity of opinion (or community news). The representative consumer also values an
improvement in information that reflects the interests of women and minorities from low to
medium ($7) more than an improvement from low to high ($4). Many consumers have a
distaste for advertising, which likely reflects their consumption of general, all-purpose
advertising from traditional media such as radio and TV. The representative consumer is
willing to pay about $5 to avoid a movement from a low to a medium level of advertising, but
the much higher amount of $17 to avoid a movement from a medium to a high level.
2 At 2010, 58 percent of the public turned on the TV for news, 44 percent used the Internet or their cellular
telephone, 34 percent turned on the radio, and 31 percent read the newspaper (Pew Research Center; 2010).
3
Using FCC (2011) data on media market structure, we present evidence that indicates
the amount of diversity, localism, and advertising in the news services supplied to consumers is
lower following a marginal decrease in the number of independent TV stations. As a result, the
average “small market” (i.e., five or fewer TV stations) consumer loses $0.99 per month,
whereas the average “large market” (i.e., 20 or more TV stations) consumer loses $0.44 per
month. These losses are equivalent to $53 million annually for all small-market households in
the U.S. and $15 million for large-market households. If the change in market structure occurs
in all markets, aggregate losses nationwide would be about $830 million.
Other studies have measured the relationship between information on news and current
affairs and market structure. However, these studies measure supply from just one of the media
sources that comprise the consumer’s news service; for example, Milyo (2007), Gentzkow
(2007) and Gentzkow and Shapiro (2010) for newspapers, and Siegelman and Waldfogel
(2001) and Crawford (2007) for radio and TV. Our research is also related to studies that
quantify the relationship between quality and market structure for different industries. For
example, Mazzeo (2003) shows that average flight delays are longer in more concentrated
airline markets. Goolsbee and Petrin (2004) estimate that cable TV channel capacity, number
of over-the-air channels and number of premium movie channels increased in response to
satellite entry. Matsa (2011) finds that supermarkets facing more intense competition have
more products available on their shelves, while Olivares and Cachon (2009) show that the
inventories of General Motors dealerships increases with the number of competitors. In
contrast, Domberger and Sherr (1989) find no correlation between the threat of new entry and
customer’s satisfaction with their attorney used for home purchases.3 Because we measure the
3 Some papers exploit a law or regulatory change to document the effect of a change in market structure on the
supply of media and telecommunications services. Berry and Waldfogel (2001) show that, following the

4
change in market structure by reducing the number of independent TV stations, our paper is
also related to structural models of differentiated oligopoly that predict the price effects from a
simulated merger. For example, Nevo (2000) for breakfast cereals, Pinske and Slade (2004) for
U.K. brewing, and Ivaldi and Verboven (2005) for car manufacturing.
Relative to these literatures our study makes several contributions. First, we offer new
evidence from media markets by examining the welfare effects from a news service bundled
from newspapers, radio, TV, the Internet, and Smartphone. Second, the prediction of non-price
effects appears to be novel in the simulated merger literature. Finally, by looking at a vector of
non-price effects we are able to document a new and interesting tradeoff between the diversity
and localism characteristics of news service, and advertising. That is, the amount of diversity
and localism declines following a decrease in the number of independent TV stations, which is
a cost to the typical consumer, but so too does the amount of advertising, which is a benefit to
the typical consumer. This finding should be interesting to antitrust officials and policy makers
because it highlights an additional potential benefit for consideration during the analysis of a
media market merger. It also provides a new angle from which to assess the efficacy of media
ownership rules.
The remainder of this paper is organized as follows. Section 2 outlines the empirical
model. Data are described in Section 3. Section 4 presents demand estimates and calculates
consumer valuations for the diversity, localism and advertising characteristics of a news
service. Section 5 presents estimates of the impact on consumer welfare from a change in
market structure, and Section 6 concludes.
Telecommunications Act of 1996 (“Act”), consolidation reduced radio station entry and increased product variety.
Economides et al. (2008) show that following the Act, households benefited more from the new plan and quality
differences offered by entrants into local telephone markets than from price decreases.

5
2. EMPIRICAL MODEL
We examine the relationship between market structure and media diversity by asking
two questions: what are the expected societal benefits that arise from increased media diversity
and localism, and how do these benefits change with regulatory interventions that shape media
market structure? We employ a three-step empirical approach to answer these questions. In
step one we estimate a mixed logit model of the demand for local news service with discrete
choice data. The estimated preferences from the representative household’s utility function are
used to calculate consumer’s WTP for each of the non-price characteristics of their news
service. In step two we estimate the relationship between the number of TV stations in the
market and the amount of diversity, localism and advertising supplied within each household’s
news service with data from the FCC (2011). In step three, we use the estimated demand and
supply response parameters from steps one and two, respectively, to calculate the impact on
consumer welfare from a change in media market structure that reduces the number of
independent TV voices by one.
2.1 Step one: the demand for news services
There are several problems when estimating demand for news service with market data.
First, households consume a bundle of entertainment and news services from the offerings from
newspapers, radio, TV, the Internet, and Smartphone, but data on these bundles, their non-price
characteristics and prices are not readily available. Second, even when available, these data are
unlikely to exhibit sufficient variation for the precise estimation of demand parameters. For
example, the levels for the diversity and localism characteristics are often highly, positively
correlated. Third, news services are a mixture of private and public goods and many households,

6
e.g., those who bundle broadcast radio and TV stations, make no direct payment for consumption.
Because detailed data on the amount of advertising within household bundles are not available, it
is not possible to accurately measure the full cost of news services.
We overcome these problems by using an indirect valuation method, similar to that used
in the environmental and transportation choice literature, that employs market and experimental
data. The market data is the news service households currently consume. The experimental data
is a set of constructed news services. We design a choice set that manipulates the characteristics
of the constructed news services to obtain the optimal variation in the data needed to estimate
the demand parameters precisely. Respondents choose between a pair of constructed news
services, and then between that choice and their actual news service at home. Because our
design exogenously determines the levels of the characteristics of each news service, and
randomly assigns the levels across respondents, we limit measurement and collinearity
problems. Furthermore, by asking respondents to complete eight such choice occasions, we
increase parameter estimation precision, and reduce sampling costs by obtaining more
information on preferences for each respondent.
The conditional indirect utility function for household n from news service alternative j
on choice occasion t is assumed to be:
njtnjtnjtnnjt xU '* (1)
where βn is a vector of consumer-specific marginal utility coefficients, xnjt is a vector of
observed non-price and price characteristics of entertainment and news service, ξnjt is the utility
from unobserved entertainment services and from other dimensions of news not included in xnjt,
and εnjt is an unobserved random error term that is independently and identically distributed
7
extreme value. The density of the distribution for βn is f(βn|θ) with θ measuring the mean and
covariance parameters of βn. Assuming βn = b + ηn, utility can be re-written as:
njtnjtnjtnnjtnjt xxbU ''* (2)
where b is the population mean marginal utility and ηn is the individual consumer’s deviation
from this mean. Given ε is distributed extreme value, and assuming an appropriate distribution
for βn, mixed logit estimation of equation 2 is possible by simulated maximum likelihood
(Revelt and Train, 1998; Brownstone and Train, 1999). In our choice scenario described in
Section 3, the consumer chooses between three alternatives in each choice occasion that differ
in their levels of xnjt only. By holding all other dimensions of entertainment and news services
in equation 2 constant so that ξnjt = ξn, the model controls for potential correlation between
price and quality that is not observed by the researcher.
Table 1 describes the levels of the characteristics that comprise the elements of the
vector xnjt. DIVERSITY OF OPINION is the extent to which the information on news and
current affairs in the household’s news service reflects different viewpoints.
MULTICULTURALISM is the amount of information on news and current affairs in the
household’s news service that reflects the interests of women and minorities. COMMUNITY
NEWS is the amount of information on community news and events in the household’s news
service. ADVERTISING is the amount of space and/or time devoted to advertising in the
household’s news service. COST is the dollar amount the household pays per month for their
news service. That is, the total of monthly subscriptions to all media sources, plus any
contributions to public radio or public TV stations.
Since they do not have an understandable metric, it is convenient to convert the
estimated marginal utilities for changes in xnjt into WTP. For example, the WTP for a one unit

8
increase in diversity of opinion (WTPd) is defined as how much more the news service would
have to be priced to make the consumer just indifferent between the old (cheaper but with only
one viewpoint) service and the new (more expensive but with a few different viewpoints)
service. This can be calculated from our estimates as:
WTPd = -2/1 (3)
where β1 is the marginal disutility of COST and β2 is the marginal utility of DIVERSITY OF
OPINION.4 This approach to estimating consumer valuations is used for all other non-price
characteristics of local news service.
2.2 Step two: the supply of news services
Previous studies of media markets typically use academic and industry databases from
BIA Financial Networks, Neilson Media Research and ProQuest Newsstand to measure the
quantity and quality of news provided by newspapers, radio and TV stations. For example,
Yan and Napoli (2006) and Crawford (2007) count the minutes of local programming provided
by TV stations, while Gentzkow and Shapiro (2010) measure diversity with an index that
measures the similarity of a newspaper’s language to that of a congressional Republican or
Democrat. Because we are investigating a household’s news services from all of their media
sources, similar measures are not practical for this study. Instead, we use information on
consumer’s news service at home to measure the characteristics supplied by news service
alternatives in different TV markets.
4 The discrete-choice model actually estimates 2/σ and 1/σ, where σ is the scale parameter. The WTP calculation
is not affected by the presence of the scale parameter because –(2/σ)/(1/σ) = -2/1.

9
Consider a reduction in the number of independent TV voices in a market as it impacts
the single news service characteristic diversity of opinion (d). A simple representation of the
diversity of opinion produced by alternative j for consumer n in television market m is:
njmjnmmmmnjm vZYSTATIONSVOICESSTATIONSVOICESd )(321
* (4)
where *
njmd is the unobserved continuous index of respondent n’s diversity of opinion
characteristic, VOICESm is the number of independent TV voices in the market, STATIONSm is
the number of TV stations in the market, Yn is a vector of consumer-specific demographic
controls, Zj is a vector of news service controls, the δ’s, φ and γ are parameters to be estimated,
and v is an independently and identically normally distributed error term with zero mean and
constant variance σv2. The interaction term is included to measure the different impacts from a
change in market structure in small- versus large-TV markets.
The respondent reports one of three possible levels for the diversity of opinion feature,
low, medium or high, based upon her or his level of *
njmd :
{
(5)
where µ is the normalized unknown level of *
njmd above which respondents report a high level
for diversity of opinion. Given v is normally distributed, equation’s 4 and 5 represent the
conventional ordered probit model, which can be estimated by maximum likelihood (Zavoinia
and McElvey, 1975). We estimate equation 4 to obtain the relationships between the number
of TV stations in the market and the four non-price characteristics of news service, and use
these estimates to approximate the supply-side responses from media outlets.
10
2.3 Step three: estimating consumer benefits from a change in market structure
It is tempting to multiply the estimated δ1 and δ3 from equation 4 by the estimated 2
from equation 2, to calculate the value to society from a change in the number of independent
TV voices that affects the market’s provision of diversity of opinion. However, this would
result in an estimate of v
mSTATIONS
312 .
, where σv is the standard deviation of the errors in
equation 4, and not the actual effect that we are interested in. The problem is that we cannot
observe the scale of diversity of opinion. Instead, we apply a new technique to our estimates,
explained below, which takes advantage of the fact that we do not need to estimate the scale of
diversity of opinion. This alternative approach uses our sample estimates from equations 2 and
4 to predict how changes in the number of independent TV voices affect consumer’s expected
benefit from the amount of diversity of opinion supplied in their local news service.
For ease of notation, we let X = VOICES and drop all subscripts that indicate
consumers, alternatives, markets, etc. The representative consumer’s expected benefit from the
diversity of opinion in their local news service is:
E[Bd(X)] = PdL(X)bdL* + PdM(X)bdM
* + PH(X)bdH
* (6)
where PdL(X) is the probability that the consumer will be in the low diversity of opinion state,
PdM(X) is the probability that the consumer will be in the medium state, PdH(X) is the
probability that the consumer will be in the high state, and bdL*, bdM
* and bdH
* are consumer
valuations for low, medium and high diversity of opinion.
We do not observe bdL*, bdM
* and bdH
*. However, we are able to estimate from step one
the consumer’s WTP for a change from low to medium diversity of opinion (ΔbdM), and the
WTP for a change from low to high diversity (ΔbdH). Writing bdM* = bdL
* + ΔbdM and
substituting this expression into the consumer’s expected benefit equation 6 gives

11
E[Bd(X)] = PdL(X)bdL* + PdM(X)(bdL
* + ΔbdM) + PdH(X)(bdL
* + ΔbdH). The effect of a change in
X on the expected benefit from diversity of opinion is:
( )
b
(b
Δb )
(b
Δb )
(
)b
Δb
Δb
Δb
Δb (7)
where
and
measure the effects of a change in X on the predicted probability of
being in the medium and the high diversity of opinion states, and
= 0,
which follows from the requirement that the three probabilities sum to one. The derivation of
this result shows clearly that the change in expected consumer welfare is a function of only
WTP for a change out of the low level of diversity and the changes in probability for the supply
of medium and high levels of diversity.
Equation 7 provides the basis for calculating the value to society from a change in
market structure that affects the provision of diversity of opinion in local media markets.
Estimates of ΔbdM and ΔbdH for the typical consumer are obtained from the demand estimates
and marginal WTP calculations in step one. Estimates of
and
for each individual
consumer are obtained from the ordered probit model of media supply responses in step two.
In step three, we use our estimated coefficients from the ordered probit model and the sample
data to calculate the predicted probability distributions for low, medium and high diversity of
opinion in the “before” environment. Holding all other things constant, we then reduce the
number of independent TV voices by one in the sample data to approximate the change in
market structure, and re-calculate the predicted probability distributions for low, medium and
12
high diversity of opinion in the “after” environment. The difference in before-and-after
predicted probabilities are used to form the change in probabilities,
and
. These
calculations are repeated for the multiculturalism, community news, and advertising
characteristics of news service, and then aggregated to reflect the general population.
3. DATA
3.1 Experimental design
The WTP for local media environment features are estimated with data from an online
survey questionnaire employing repeated discrete-choice experiments. The questionnaire
begins with the cognitive buildup section that describes the respondent’s local news service in
terms of the offerings from newspapers, radio, TV, the Internet, and Smartphone. Respondents
are asked questions about their media sources, how much information they consume from each
source, the cost of their media sources, and the levels of the four different characteristics of
their news service described in Table 1.5
Cognitive buildup is followed by the choice scenario. Information from the cognitive
buildup questions is used to summarize each respondent’s actual entertainment and news
service at home with respect to their media sources, the levels of the non-price characteristics
of their service, DIVERSITY OF OPINION, MULTICULTURALISM, COMMUNITY NEWS and
ADVERTISING, and their COST. A table summarizing the sources and characteristics of the
respondent’s actual media environment at home is presented before the choice scenario. The
respondent is then instructed to answer eight choice occasions. In each occasion, they choose
5 Respondents were asked to consider what is available in their local media environment, rather than what they
usually view or listen to. This represents a statement about the amount and quality of information programming
being produced by media sources for their consumption.
13
between their actual news service at home and two constructed new service alternatives,
labeled A and B, that differ by their levels of DIVERSITY OF OPINION,
MULTICULTURALISM, COMMUNITY NEWS, ADVERTISING and COST.
We used market data from newspapers, radio and TV stations, Internet and mobile
telephone service providers, a pilot study and three focus groups to test and refine our
descriptions of the characteristics for news service alternatives (See Savage and Waldman –
2011 – for more discussion). Measures developed by Huber and Zwerina (1996) were used to
generate an efficient non-linear optimal design for the levels of the constructed news
characteristics. A fractional factorial design created 72 paired descriptions of A and B news
services that were grouped into nine sets of eight choice questions. The nine choice sets were
rebalanced to ensure that each household faced a range of costs that realistically portrayed the
prices for media sources in their local market. For example, a respondent who indicated that
they pay nothing for their news source was exposed to a range of costs that included zero
dollars per month.6 The nine choice sets, along with the order of the eight A-B pair choice
alternatives within each choice set, were randomly distributed across all respondents.
3.2 Survey administration
Knowledge Networks Inc. (KN) administered the online survey. Panel members are
recruited through national random samples, almost entirely by postal mail. For incentive, they
are rewarded with points for participating in surveys, which can be converted to cash or other
rewards.7 During the week of March 7, 2011, KN randomly contacted a gross sample of 8,621
6 Upon completion of their cognitive buildup questions, an online algorithm calculated each individual’s total cost
of their local entertainment and news service and assigned the appropriate cost range for their choice occasions. 7 KN recruitment uses dual sampling frames that includes both listed and unlisted telephone numbers, telephone
and non-telephone households, and cellphone-only households, as well as households with and without Internet
14
panel members to inform them about the survey. The survey was fielded from March 11 to
March 21. A total of 5,548 respondents from all 50 states and the District of Columbia
completed survey questionnaires. Because of incomplete survey responses, we trimmed the
sample by 417 respondents. The median completion time for our sample of 5,131 respondents
with complete information was about 16 and three-quarter minutes.
Table 2 presents a selection of demographics for the U.S. population, for all KN’s panel
members, and for panel members who were invited to participate in this survey (United States
Census Bureau, 2009; Knowledge Networks, Inc., 2010). The demographics for all KN panel
members are similar to those reported by the Census Bureau. Casual inspection of column four
and column five of Table 2 also show that, apart from race and employment status, the
demographics for the gross sample of panel members invited to participate in this study and the
final sample of respondents who completed questionnaires are also similar to those reported by
the Census Bureau. However, estimates from the probit model that compares respondent’s
characteristics between the gross sample and the final sample also indicate potential differences
in age, gender, education, and Internet access between our final sample and the population. We
remedy this possible source of bias in our results from step one and step two by estimating with
weighted maximum likelihood. See Savage and Waldman (2011) for the probit model
estimates and the procedures used to develop the post-stratification weights.
3.3 Media sources and news service
Table 3 presents summary statistics for respondent’s media sources. Columns two and
three show that about 94 percent of sample respondents watch TV, 81 percent listen to the
access. If required, households are provided with a laptop and free Internet access to complete surveys, but they do
not participate in the incentive program.

15
radio, and 80 percent use the Internet. About 45 percent of respondents read a paper or online
newspaper regularly, and 24 percent of sample respondents own a Smartphone.8 On average,
TV viewers spend about 1.9 hours on a typical day watching TV to get information on news
and current affairs, radio listeners spend 1.4 hours listening to the radio to get information on
news and current affairs, and Internet users spend one hour online (e.g., MSN, Yahoo, radio
and TV station web sites, journalists’ blogs) to get information on news and current affairs.
Newspaper readers also spend about one hour on a typical day reading the newspaper, while
Smartphone owners use their phone to go online for 0.6 hours to get information on news and
current affairs online. The most popular media source combinations are radio, TV and the
Internet, about 30 percent of sample respondents, and newspaper, radio, TV and the Internet,
about 26 percent of sample respondents.
Summary statistics for news service characteristics are presented in Table 4. These data
indicate that, on average, the levels of the DIVERISTY OF OPINION, MULTICULTURALISM,
COMMUNITY NEWS and ADVERTISING characteristics were about “medium.” About 58
percent of respondents indicated that they bundled their subscription TV service with the
Internet and/or telephone service. The price (or, COST) for the typical media combination
ranged from zero to $447 per month, with an average of $111.20 per month. Interestingly,
about ten percent of the sample indicated that they have contributed $117, on average, to public
radio and/or TV stations during the past twelve months. This is reasonably close to the
combined annual costs of membership at 2011. For example, Rocky Mountain PBS offers an
annual membership for $40 and Colorado Public Radio for $120. These membership costs
vary between states.
8 Complementary data from the Neilson Company (2010) and the U.S. Census Bureau (2011) indicate that about
93 percent of persons watch TV, 82 percent listen to the radio, and 77 percent use the Internet. About 67 percent of
respondents read a newspaper regularly, and 25 percent of sample respondents own a Smartphone.

16
Because they are self-reported, there may be some concern about the accuracy of the
data describing the news service characteristics in our sample. We alleviate these concerns by
testing the relationships between our measures of diversity and localism and alternative
measures from the FCC (2011) and Gentzkow and Shapiro (2010). Table 5 reports the
estimates from a simple ordered-probit model of DIVERISTY OF OPINION,
MULTICULTURALISM or COMMUNITY NEWS, on these various alternative measures of
diversity and localism for radio, TV and newspapers. In general, the evidence indicates that the
information reported by survey respondents is a reasonably good proxy for the diversity of
news service alternatives in U.S. markets. For example, columns one and two show a positive
correlation between the number of TV stations broadcasting multiple channels and DIVERSITY
OF OPINION, positive correlations between the number of non-commercial radio and TV
stations and DIVERSITY OF OPINION, and a positive correlation between the number of
different radio formats and DIVERSITY OF OPINION. Column three shows a negative
correlation between the Gentzkow-Shapiro measure of newspaper slant and DIVERSITY OF
OPINION. Columns four and five show positive correlations between the number of stations
with female or minority ownership and MULTICULTURALISM. Columns six and seven show
negative, albeit insignificant, relationships between the number of stations with non-local
ownership and COMMUNITY NEWS.
3.4 Market structure
We use data from the FCC (2011) to measure media market structure. The important
variables of interest are the number of full-power independent TV stations in the market
(VOICES) and the total number of full-power independent and non-independent TV stations in

17
the market (STATIONS). VOICES is measured by first combining all the TV outlets within
each market. The listing of the unique parent company identifiers of all attributable owners of
an outlet (“voiceprint”) is then created, sorted alphabetically, and duplicate voiceprints are
eliminated. The parent identifier is then used to count the number of voices in the voiceprint
for each outlet. Voiceprints composed of a single voice are added to the voice count of the
market, while any voiceprint that includes one of the voices counted at the previous stage of the
calculation are eliminated. These are voices that are not independent because their voice has
been heard on another outlet. This process is sequentially repeated based on the number of
voices in the voiceprint. Table 6 describes the remaining market structure variables considered
in this analysis.
Table 7 presents summary statistics. Our sample covers 203 of the nation’s 210
television markets.9 As of December, 2009, the total number of newspaper, radio, and TV
outlets ranged from four to 291, with an average of 139 per market. On average, about 81
percent of media outlets are radio stations, which partially reflects the geographical definition
of a TV market which can include several radio markets. When examining the market structure
data at the 75th
percentile, we observe that most markets are served by about 182 or fewer
media outlets. The bottom panel in Table 6 shows a similar pattern for small TV markets with
five or fewer stations. At December, 2009, the total number of newspaper, radio and TV
outlets in small markets ranged from four to 86, with an average of 47 per market. On average,
9 Television Market Area or “market” is a geographical region where all households receive the same offerings
from TV stations. The seven markets outside our sample are: Bend, OR; Fairbanks, AK; Grand Junction, CO;
Missoula, MT; North Platte, NE; Ottumwa, IA – Kirksville, MO; and Presque, ME. All seven are small markets
with five or fewer TV stations. As shown in Table 6, the remaining small markets in our sample cover 8.43 percent
of households. FCC (2011) data show that 8.37 percent of population households were in small markets at
December, 2009.
18
about 82 percent of media outlets in small markets are radio stations, and as indicated by the
75th
percentile, most small markets are served by about 57 or fewer media outlets.
The survey provided the household data used to construct the control variable vectors Yn
and Zj in supply equation 4. The Y vector measures the head of the household’s age (AGE = 1
if 18 - 24 years; 2 if 25 - 34; 3 if 35 - 44; 4 if 45 - 54; 5 if 55 - 64; 6 if 65 - 74; 7 if 75 years or
over), education (EDUC = 1 if less than high school; 2 if high school; 3 if some college; 4 if
bachelor’s degree or more), gender (GENDER = 1 if female; 0 otherwise), household income
(INCOME = 1 if less than $10,000; 2 if $10,000 - $24,999; 3 if 25,000 - $49,999; 4 if $50,000 -
$74,999; 5 if $75,000 or more), and race (RACE = 1 if white; 0 otherwise.). The Z vector
includes dummy variables to control for the 16 different media source combinations in our
sample that are comprised from newspapers, radio, TV, the Internet, and Smartphone.10
4. DEMAND ESTIMATES
The choice data described in Section 3.1 are used to estimate a discrete-choice model of
household utility from their local news service. Because 29 respondents do not have
geographical identifiers and could not be assigned to their appropriate TV market in Section 5,
they are dropped from the final sample of 5,131. Since each of the choice scenarios represent
information on preferences from three alternatives, A, B, and actual news service at home, the
sample size for econometric estimation is 5,102×8×3 = 122,448. Table 2 showed some
demographic differences between our final sample and the population. We remedy this
possible source of bias in our results by estimating the discrete-choice model by weighted
10
For a robustness check, we specified an alternative set of dummy variables that also controlled for subsets of
radio (i.e., satellite and broadcast radio) and TV (i.e., cable, satellite and broadcast TV). Ordered probit estimates
of media supply responses, and estimates of the impacts on consumer welfare from a change in market structure,
not reported here, are similar to those presented in Tables 10 and 11 below.
19
maximum likelihood, where the contribution to the log likelihood is the post-stratification
weight times the log of the choice probability for the choice occasion.
Table 8 reports weighted maximum likelihood estimates of household utility. Because
consumers may have heterogeneous preferences for unmeasured aspects of news service, we
estimate utility with an alternative-specific constant to capture differences in tastes between the
actual and new (A and B) news services. For purpose of comparison, in model (i) we begin by
reporting estimates from a standard conditional logit model with fixed marginal utility
parameters. Model (ii) displays estimates from a mixed logit model specification where the
four non-price marginal utility parameters are assumed to be independently normally
distributed.11
Preferences may be correlated, for example, consumers who like more diversity
of opinion may also like more information on women and minorities. Accordingly, the mixed
logit model (iii) permits correlation between the non-price parameters. Model (iv) reports
estimates from a mixed logit model specification with correlated non-price parameters plus
COST×MED_INCOME and COST×HIGH_INCOME. The additional observed consumer
characteristics are MED_INCOME equals one when household income is greater than $25,000
and less than $50,000 and zero otherwise, and HIGH_INCOME equals one when household
income is greater than $50,000 and zero otherwise.12
13
The data fit all model specifications reasonably model well as judged by the sign and
statistical significance of most parameter estimates. We focus our discussion on the results
from model (iv) because that model permits the marginal disutility of cost to vary by income.
11
All mixed logit models were estimated by simulation using 100 Halton draws. For robustness, we estimated
several model specifications using 500 draws and the results are similar. 12
Low-income households (INCOME < $25,000) comprise 20.5 percent of the sample, medium-income
households ($25,000 ≤ INCOME < $50,000) comprise 24.6 percent, and high-income households ($50,000 ≤
INCOME) comprise 54.9 percent. 13
We also estimated a variant of model (iv) that included an additional interaction between an indicator of college
education and COST. This additional interaction was not statistically significant at conventional levels and the
results, not reported, are similar to those reported in Table 8.
20
The mean of each of the random marginal utility parameters for DIVERSITY OF OPINION,
MULTICULTURALISM and COMMUNITY NEWS are positive and significant at the one
percent level, while the mean of the random parameter for ADVERTISING is negative and
significant. These estimates imply that the representative consumer’s utility increases when
there is more diversity in the reporting of news, more information on women and minorities,
more information on community news, and less space and/or time devoted to advertising. The
fixed parameter for COST is negative and the corresponding parameters for
COST×MED_INCOME and COST×HIGH_INCOME are positive. These estimates imply that
consumer’s utility decreases when the dollar amount paid for their news service increases but
that the effect diminishes with increases in household income.
The standard deviations of each of the random marginal utility parameters are
significant at the one percent level, indicating that tastes vary in the population. Together, the
estimated means and standard deviations of the random parameters provide useful policy
information on the percentage of the population that place a positive value on the non-price
characteristics of news service. The mean and standard deviation of the parameter estimator
for DIVERSITY OF OPINION are 0.443 and 0.801, respectively. Using the cumulative normal
distribution, this implies that about 70 percent of the population prefer more different
viewpoints in the reporting of news and 30 percent prefer fewer viewpoints. Similar
calculations show that about 80 percent of the population prefer more community news, and
more news that reflects the interests of women and minorities is preferred by about one-half of
the population. Approximately two-thirds of the population prefer having less advertising.
Although our description of advertising does not measure content, it does measure the
amount of space on a newspaper or web page, or the amount of air time devoted to commercial
21
advertising on radio or TV. Given this definition and information on public news consumption
from the Pew Research Center (2010), we use our demand estimates to shed light on the value
of informative vs. non-informative advertising. Given that 58 percent of the U.S. public get
their news from the TV, the estimated negative valuations for ADVERTISING likely reflect the
consumption of general, all-purpose advertising delivered by traditional media such as radio
and TV. In other words, most consumers will indicate their distaste for non-informative
advertisements because they do not want to view them or listen to them. In contrast, the
estimated positive valuations likely reflect the consumption of more informative, targeted
advertisements delivered by new media such as the Internet, Smartphone and Video-on-
Demand. Here, consumers indicate their preference for advertisements because they are
positively informed about something specific to their needs and/or they have some choice in the
advertisements they actually view.14
In this discussion the coding of the four non-price features in the household utility
function is linear, which implies that the marginal utilities are the same when moving from low
to medium and from medium to high. We now relax this restriction by replacing each of the
four non-price characteristics with a pair of dichotomous variables. For example, MEDIUM
DIVERISTY OF OPINION equals one when DIVERISTY OF OPINION equals “medium” and
zero otherwise, and HIGH DIVERISTY OF OPINION equals one when DIVERISTY OF
OPINION equals “high” and zero otherwise. Here, the estimated parameter on MEDIUM
DIVERISTY OF OPINION measures the change in utility from moving from information on
news and current affairs in the household’s overall news service reflecting only one viewpoint
(low diversity) to a few different viewpoints (medium diversity). The estimated parameter on
14
For example, Comcast targets specific customer types through its Video-on-Demand service and then permits
the customer to select the advertisements she or he wants to view with their remote control. See
http://www.comcastspotlight.com/advertising-solutions/on-demand.
22
HIGH DIVERISTY OF OPINION measures the change in utility from moving from information
on news and current affairs reflecting only one viewpoint to many different viewpoints (high
diversity). This approach to estimating non-linear consumer valuations is used for all other
non-price characteristics of the local news service.
Mixed logit estimates of the utility model with non-linear preferences are presented in
Table 8. Model (v) reported estimates with correlated non-price parameters plus
COST×MED_INCOME and COST×HIGH_INCOME. Focusing on the means of each of the
random marginal utility parameters, the results indicate declining marginal utility for the
representative consumer with respect to diversity of opinion, multiculturalism and community
news. Accompanying WTP calculations by household income are reported in the bottom panel
of Table 9. For comparison, WTP calculations from the linear estimates of utility are reported
in the top panel. In column three we observe that the representative medium-income consumer
is willing to pay $20.82 per month for an improvement in diversity of opinion from low to
medium, but only another $6.76 per month for an additional improvement to high diversity of
opinion. Similarly, the representative medium-income household is willing to pay $24.88 per
month for an initial improvement in information on community news and events from low to
medium, but only another $6.18 per month for an additional improvement to high. The
marginal utility estimates for multiculturalism indicate that households value an improvement
in information that reflects the interests of women and minorities from low to medium (i.e.,
WTP = $7.04) more than an improvement from low to high (i.e., WTP = $4.09). In other
words, the representative medium-income household wants more, but not a lot more
information reflecting the interests of women and minorities. The marginal utility estimates for
advertising indicate a similar pattern to diversity of opinion and community news, albeit in

23
reverse. The representative household is willing to pay about $15.87 per month for a move
from high to medium advertising, but would pay only an additional $4.70 per month to move
from medium to low advertising.15
5. IMPACT ON WELFARE FROM A CHANGE IN MARKET STRUCTURE
The demand estimates provide information on the expected societal benefits from
increased media diversity and localism. The question of interest now is how do these benefits
change with regulatory interventions that shape media market structure? We shed light on this
question by estimating the relationships between the number of TV stations in the market and
the amount of diversity, localism and advertising supplied within each household’s news
service. The resulting supply response parameters are then combined with WTP calculations to
measure the impact on consumer welfare from a change in media market structure that reduces
the number of independent TV voices by one.
5.1 The supply of news services
Because unobserved cost and demand factors affect both media market structure and the
supply of news service characteristics, the estimated coefficient on VOICES in equation 4 is
likely to suffer from omitted variable bias. For example, a market with higher unobserved
costs of producing advertising will be less profitable and will attract fewer TV stations. This
market may also have more advertising because stations need additional revenue to cover their
15
There are no systematic biases towards a specific alternative within the choice scenario. Consumers chose their
actual news service at home 29.1 percent of the time, news service alternative A 34.4 percent of the time, and
news service alternative B 36.5 percent of the time. The number of seconds it took respondents to answer each
choice occasion remained essentially constant over the eight choice occasions. Because some of our data are from
repeated choices, we also need to be concerned with survey fatigue (Savage and Waldman, 2008). For a robustness
check, we estimated all model specification’s (i) through (v) on the data for the first four choice questions versus
the second four questions. The results, not reported, show reasonably similar estimates for the two subsamples of
data. There is no systematic pattern that could be taken as evidence of survey fatigue.
24
higher costs. A standard ordered probit model would bias the estimated relationship between
ADVERTISING and VOICES in a negative direction. We account for this endogeneity with a
two-stage selection model similar to Mazzeo (2002), Singh and Zhu (2008), and Chen and
Savage (2011). In the first stage, we estimate the latent profits of market m with an ordered
probit model that predicts the number of independent TV stations in the market. Estimated
parameters from the first stage are used to construct a modified error correction term ( m
^
)
similar to the inverse Mills ratio in Heckman’s (1979) sample selection model. In the second
stage, we estimate equation 4 with an ordered probit model of the non-price news characteristic
of interest, DIVERISTY OF OPINION, MULTICULTURALISM, COMMUNITY NEWS or
ADVERTISING, on VOICES, STATIONS, VOICES×STATIONS, Y, Z and ^
. Since unobserved
factors are controlled for by the correction term, the estimated relationship between the supply
of news service characteristics and the number of independent TV stations in the market will be
consistent.
For the first stage, we specify the representative independent TV station’s latent profits
to be a function of market size, variable profits per TV household, and fixed costs.16
All
variables are measured with market-level data from the FCC (2011) and the National Climatic
Data Center (2011) and are described in Table A1 of the appendix. The market size variables
are the number of TV households (TV_HOUSES) and the projected annual average population
growth (POP_GROWTH). The variables that comprise variable profit are median household
income (MEDIUM_INCOME), the number of years of education for the population over 25
16
Because they are not observed, latent profits are approximated by the number of independent TV voices in the
market (VOICES). Moreover, because there are independent and non-independent TV voices in the market, this is
a simplified description of market structure. An alternative specification could follow Mazzeo (2002) by modeling
entry from independent and non-independent TV voices and using the predicted probabilities to form correction
terms for both firm types. This is an area of ongoing research for this study.

25
years of age (EDUC_YEARS), median age of the population (MEDIUM_AGE), percentage of
the population that is female (FEMALE_SHARE), percentage of the population that is white
(WHITE_SHARE), and population per square mile (DENSITY). Fixed costs are approximated
by measures of severe climate that increase the expense of building and maintaining a TV
broadcast antenna. They are annual average snowfall (SNOW), annual number of days with the
temperature below freezing (FREEZE), and SNOW×FREEZE.
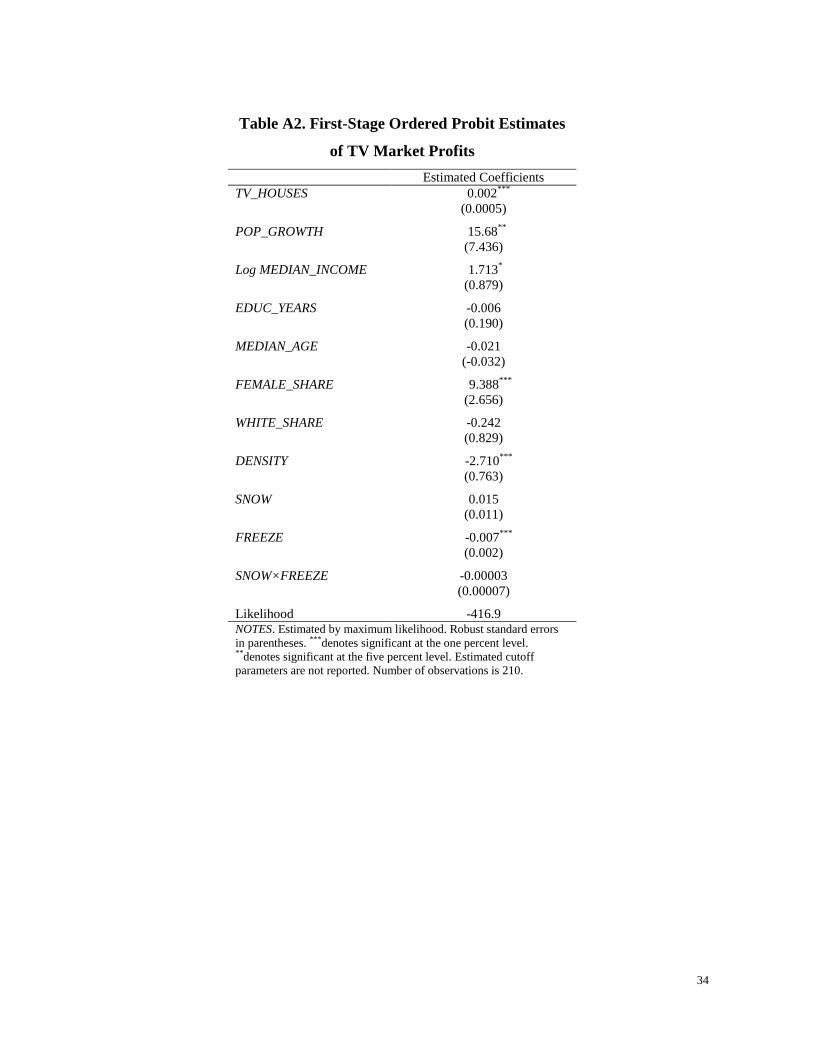
Ordered probit estimates of the first-stage profits are presented in Table A2 of the
appendix. The estimated coefficients on TV_HOUSES and POP_GROWTH indicate that
profits are higher in larger markets and that these markets can support more independent TV
stations. Household income and the share of female population also have a positive impact on
profits, while profits are lower in more densely populated markets. The latter result may be due
to the higher cost of marketing and/or the rental price of land in urban and inner-city locations.
Profits are higher in markets with more snowfall although the estimated parameter on SNOW is
marginally insignificant. This suggests that the fixed cost effect may be offset by the demand
effect. Specifically, because their households spend more time indoors and have stronger
preferences for TV viewing, markets with more snow earn more revenue and can support more
independent TV stations. The estimated coefficients on FREEZE and SNOW×FREEZE are
both negative. Snow, sleet and freezing rain can lead to ice buildup and the eventual collapse
of the broadcast antennae. Because the fixed costs of constructing and maintaining a more
durable antennae are higher in markets with a lot of snow and freezing weather, expected
profits are lower.
The estimated cutoff parameters and linear prediction from the first-stage ordered probit
model of profits are used to construct the modified correction term:
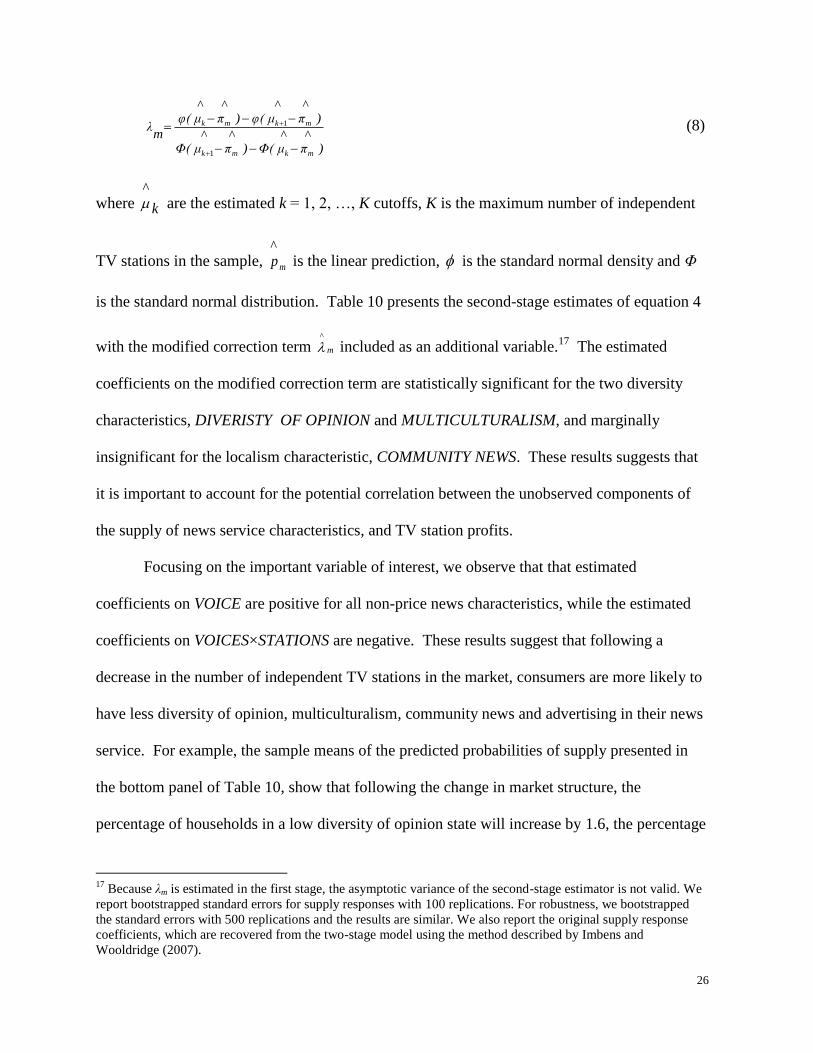
26
)^π
^μΦ()
^π
^μΦ(
)^π
^μφ()
^π
^μφ(
mλ
mkmk
mkmk
1
1 (8)
where k
^ are the estimated k = 1, 2, …, K cutoffs, K is the maximum number of independent
TV stations in the sample, mp^
is the linear prediction, is the standard normal density and Φ
is the standard normal distribution. Table 10 presents the second-stage estimates of equation 4
with the modified correction term m
^
included as an additional variable.17
The estimated
coefficients on the modified correction term are statistically significant for the two diversity
characteristics, DIVERISTY OF OPINION and MULTICULTURALISM, and marginally
insignificant for the localism characteristic, COMMUNITY NEWS. These results suggests that
it is important to account for the potential correlation between the unobserved components of
the supply of news service characteristics, and TV station profits.
Focusing on the important variable of interest, we observe that that estimated
coefficients on VOICE are positive for all non-price news characteristics, while the estimated
coefficients on VOICES×STATIONS are negative. These results suggest that following a
decrease in the number of independent TV stations in the market, consumers are more likely to
have less diversity of opinion, multiculturalism, community news and advertising in their news
service. For example, the sample means of the predicted probabilities of supply presented in
the bottom panel of Table 10, show that following the change in market structure, the
percentage of households in a low diversity of opinion state will increase by 1.6, the percentage
17
Because λm is estimated in the first stage, the asymptotic variance of the second-stage estimator is not valid. We
report bootstrapped standard errors for supply responses with 100 replications. For robustness, we bootstrapped
the standard errors with 500 replications and the results are similar. We also report the original supply response
coefficients, which are recovered from the two-stage model using the method described by Imbens and
Wooldridge (2007).

27
of households in a medium state will increase by 3, and the percentage of households in a high
state will decrease by 1.9. The results with respect to diversity of opinion, multiculturalism and
community news are reasonably intuitive. Consolidation of TV stations is associated with the
softening of media competition and the provision of less diversity and less local news, which is
costly to produce.18
The result with respect to advertising is consistent with Crawford’s (2007)
finding that independent TV stations provide more advertising per program but charge lower
prices to advertisers.19
5.2 Step three: market structure and consumer welfare
5.2.1 Algorithm
We use our demand and supply response estimates from steps one and two to measure
the impact on consumer welfare from the change in media market structure. The procedure to
calculate the changes to consumer welfare is:
(i) With the existing sample data, use the estimated coefficients from Table 10 to
predict each respondent’s before probability distribution of low, medium and high
values for each of the four non-price news service characteristics. Let PL0 be the
before probability of a low level of the characteristics, PM0 is the before probability
of a medium level, and PH0 is the before probability of a high level.
(ii) Approximate the change in media market structure by reducing the number of
independent TV stations in the sample by one, all other things held constant. Use the
18
By definition, a reduction in the number of independent TV stations means there are fewer viewpoints in the
market, and as a result, less diversity of opinion. 19
Brown and Alexander (2004) find a positive correlation between TV market concentration and the price of
advertising per viewer. They argue that when consumer’s elasticity of viewing with respect to advertising is weak,
a decrease in the fraction of broadcast time devoted to advertising can lead to a decrease in the overall amount of
advertising supplied and an increase in the price to advertisers (Cunningham and Alexander, 2004).
28
estimated coefficients from Table 10 to predict each respondent’s after probability
distribution of low, medium and high values for each of the four news service
characteristics. Let PL1 be the after probability of a low level of the characteristic,
PM1 is the after probability of a medium level, and of the feature; and PH1 is the after
probability of a high level.
(iii) Use the probabilities in (i) and (ii) to form, for each respondent,
,
and
, for
each news service characteristics, where ΔPL = PL1 - PL0, ΔPM = PM1 - PM0,
ΔPH = PH1 - PH0, and ΔX = ΔVOICES = -1.
(iv) Use the estimates of marginal WTP in the bottom panel of Table 9 and the change in
predicted probabilities in (iii) above to evaluate equation 7 for each respondent and for
each non-price news service characteristic.
(v) Sort the expected welfare changes in (iv) for each respondent by the number of TV
stations, ranging from five to 20. Calculate the mean expected welfare change per
month for all respondents in a market with five stations, six stations, … , and 20
stations.
(vi) Use the FCC (2011) data to count the number of population households in a television
market with five stations, six stations, … , and 20 stations.
(vii) Calculate the aggregate annual change in consumer welfare for each market size by
multiplying (v) by 12 by (vi) for each level of the number of television stations, i.e.,
five stations, six stations, … , and 20 stations.

29
5.2.2 Estimates of Consumer Welfare
Table 11 and Figure 1 present estimates of the impact on consumer welfare from a
marginal decrease in the number of independent TV stations for all market sizes ranging from five
to 20 TV stations. Columns three through six of Table 11 report average consumer welfare per
month and columns seven through twelve report annual aggregate welfare.20
The first interesting
observation is that the average welfare effects per month depend on market size, with smaller
markets having larger effects in absolute terms. The intuition for this finding is clear. The
impact from the loss of an independent voice in the market will be more acute when there are
fewer competitors to fill the void. As a result, the average consumer in a small market loses
$0.99 per month, whereas the average consumer in a large market loses $0.44 per month.
These losses are equivalent to about $53 million annually for all small-market households in
the U.S. and $15 million for all large-market households.21
If the change in market structure
occurs in all markets, for example, if two of the “big four” networks ABC, CBS, FOX or NBC
consolidated, annual aggregate losses nationwide would be about $830 million. For
comparison, this represents about seven percent of the total operating costs for CBS in 2010.22
Given the WTP estimates in Table 9, it is not surprising that the average welfare losses
per month from DIVERSITY OF OPINION and COMMUNITY NEWS are greater than
MULTICULTURALISM in almost all markets. However, while DIVERSITY OF OPINION
continues to have significant negative impacts in both small (-$0.61) and large (-$0.38)
20
The reported standard errors are calculated using a bootstrapping method. For example, for row one, we
construct the benefit equation 7 for each respondent in markets with five TV stations. We then draw marginal
utility values from the multivariate normal distribution implied by the mean and covariance parameters reported in
column’s eight and nine of Table 7. These values are used to evaluate equation 7 for each respondent and to obtain
an estimate of the mean consumer welfare effect per month. We run this simulation 500 times and report the mean
and standard error of the sampling distribution for consumer welfare per month. 21
There are 90,193,905 population households in markets from five to 20 TV stations. Total annual aggregate
welfare for small markets is -$53.36 million = (0.050×90,193,905)×12×-0.99. Total annual aggregate welfare for
large markets is -$15.51 million = (0.032×90,193,905)×12×-0.44. 22
See CBS Corporation income statements at http://ycharts.com/financials/CBS/income_statement/annual.
30
markets, the effect for COMMUNITY NEWS quickly dissipates from -$0.45 to -$0.09 as the
number of stations in the market increases. MULTICULTURALISM follows a similar trend to
DIVERSITY OF OPINION, losing about 40 percent of its negative impact from small (-$0.23)
to large (-$0.14) markets. ADVERTISING also follows a similar trend to DIVERSITY OF
OPINION and MULTICULTURALISM losing about 40 percent of its positive impact from
small ($0.30) to large ($0.17) markets.
A final interesting observation is the potential tradeoff between the amount of diversity
and localism in news service, and the amount of space and time devoted to advertising.
Consumers lose from the consolidation of two independent TV stations because there is less
diversity of opinion, less coverage of multiculturalism issues and less community news, but
they gain because there is less space and time devoted to advertising.23
Specifically, columns
three through six of Table 11 show that, on average, about 24 percent of the annual monthly
losses to consumers from less diversity and localism in each market are offset by less exposure
to advertising. This illustrates an important feature of the news service experience in our data;
the first-order effects from consolidation are, potentially, not all bad for consumers.
Nevertheless, consumers and policy makers should be concerned about the impacts from a
“virtual merger” where TV stations combine their news operations with joint operating and
marketing agreements without actually merging. Since a virtual merger is likely to result in
less diversity and localism but not less advertising, the welfare reductions in Table 11 would be
23
The reduction in advertising does not mean that that the two merged firms will be worth less. Profits are
expected to increase as a result of higher advertising rates and/or cost efficiencies in the production of news
programming.
31
even more pronounced. For example, column twelve shows that if the virtual merger occurred
in all markets, annual aggregate losses nationwide would be about $1.1 billion.24
6. CONCLUSIONS
This study examined market structure and media diversity. A differentiated product model
was used to estimate consumer demand for their local news service, described by the offerings
from newspapers, radio, TV, the Internet, and Smartphone. The model captures both private
and public good aspects of news service by including the amount of advertising in the household’s
full cost of consumption, and by characterizing service in terms of diversity of opinion in the
reporting of information, coverage of multiculturalism issues, and the amount of information on
community news and events. The empirical results show that the representative consumer
values diversity in the reporting of news, more information on women and minorities, and more
information on community news. Many consumers, however, have a distaste for advertising,
which likely reflects their consumption of general, all-purpose advertising from traditional
media.
The demand estimates are used to calculate the impact on consumer welfare from a
marginal decrease in the number of independent TV stations that lowers the amount of
diversity, localism and advertising in the market. The prediction of non-price effects is
appropriate for media markets, where some households make no direct payment for
consumption, and appears to be novel in the simulated merger literature. Our results show that
24
The FCC use several measures of market structure when discussing ownership rules. For robustness, we
examined how sensitive our results are to an alternative specification of the media supply response equation 4 that
controls for the number of daily newspapers in the market (NEWSPAPERS) and the number of radio stations
(RADIO STATIONS). The estimates of the two-stage ordered probit model of supply, and the estimates of the
impacts on consumer welfare from a change in market structure, not reported here, are similar to those presented
in Tables 10 and 11.

32
consumer welfare decreases following the change in media market structure, and that the losses
are smaller in large markets. For example, small-market consumers lose $53 million annually
while large-market consumers lose $15 million. If the change in market structure occurs in all
markets, total losses would be about $830 million.
We make no claims as to whether media ownership rules should be relaxed or
tightened. We note that the estimated total losses of $830 million approximates the extreme
case of consolidation between two major national media players and, as such, is an upper-
bound calculation. The large consumer losses in small TV markets relative to large markets is
potentially important. The tradeoff between diversity and localism, and advertising, is also
interesting because it highlights an additional benefit for consideration during the analysis of a
media market merger. It also provides a new angle from which to assess the efficacy of media
ownership rules.

33
APPENDIX
Table A1. Television Market Profit Variables
Variable
Description and data source
Mean
(s.d.)
TV_HOUSES
Number of households (in 1000’s) in the market that own a TV set at 2009.
Source: FCC (2011).
547.0
(835.7)
POP_GROWTH
Projected average annual population growth in the market. Source: FCC
(2011).
0.007
(0.012)
MEDIAN_INCOME
Median household income (in $1,000’s) in the market at 2008. Source: FCC
(2011).
46.42
(8.451)
EDUC_YEARS
Mean number of years of schooling for the population over 25 years of age in
the market (five-year estimate 2005-2009). Source: FCC (2011).
13.29
(0.647)
MEDIUM_AGE
Median years of age of the population in the market (five-year estimate 2005-
2009). Source: FCC (2011).
37.07
(3.122)
FEMALE_SHARE
Fraction of the market population that is female at 2009. Source: FCC (2011)
.
0.497
(0.028)
WHITE_SHARE
Fraction of the market population that is white at 2009. Source: FCC (2011).
0.800
(0.130)
DENSITY
Total population (in 1000’s) per square mile in the market (five-year estimate
2005-2009). Source: FCC (2011).
0.152
(0.210)
SNOW
Annual average total inches of snowfall, including ice pellets and sleet, in the
market or closest weather recording station to the market (30-year estimate
1971-2000). Source: National Climatic Data Center (2011).
24.75
(27.62)
FREEZE
Annual average number of days with minimum temperature of 32 degrees
Fahrenheit or less in the market or closest weather recording station to the
market (30-year estimate 1971-2000). Source: National Climatic Data Center
(2011).
91.88
(57.35)
NOTES. s.d. is standard deviation.
34
Table A2. First-Stage Ordered Probit Estimates
of TV Market Profits
Estimated Coefficients
TV_HOUSES 0.002***
(0.0005)
POP_GROWTH 15.68**
(7.436)
Log MEDIAN_INCOME 1.713*
(0.879)
EDUC_YEARS -0.006
(0.190)
MEDIAN_AGE -0.021
(-0.032)
FEMALE_SHARE 9.388***
(2.656)
WHITE_SHARE -0.242
(0.829)
DENSITY -2.710***
(0.763)
SNOW 0.015
(0.011)
FREEZE -0.007***
(0.002)
SNOW×FREEZE -0.00003
(0.00007)
Likelihood -416.9 NOTES. Estimated by maximum likelihood. Robust standard errors
in parentheses. ***denotes significant at the one percent level.
**denotes significant at the five percent level. Estimated cutoff
parameters are not reported. Number of observations is 210.
35
REFERENCES
Berry, S., and Waldfogel, J. 2001. “Do Mergers Increase Product Variety? Evidence from
Radio Broadcasting.” Quarterly Journal of Economics, 116(3), 1009-1025.
Brown, K., and Alexander, P. 2004. “Market Structure, Viewer Welfare, and Advertising Rates
in Local Broadcast Markets.” Economic Letters, 86(3), 331-337.
Brownstone, D., and K. Train. 1999. “Forecasting New Product Penetration with Flexible
Substitution Patterns.” Journal of Econometrics, 89(1), 109-129.
Chen, Y., and Savage, S. 2011. “The Effects of Competition on the Price for Cable Modem
Internet Access.” The Review of Economics and Statistics, 93(1), 201-217.
Crawford, G. 2007. “Television Station Ownership Structure and the Quantity and Quality of
TV Programming,” FCC Media Ownership Study #3, Washington, D.C., FCC.
Cunningham, B., and Alexander, P. 2004. “A Theory of Broadcast Media Concentration and
Commercial Advertising.” Journal of Public Economic Theory, 6(4), 557-575.
Domberger, S., and Sherr, A. 1989. “The Impact of Competition on Pricing and Quality of
Legal Services.” International Review of Law and Economics, 9, 41-56.
Economides, N., Seim, K., and Viard, B. 2008. “Quantifying the Benefits of Entry into Local
Phone Service.” RAND Journal of Economics, 39(3), 699-730.
FCC. 2011. Government Furnished Information on Media Market Structure. February 17,
Media Bureau, FCC, Washington, D.C.
Gentzkow, M. 2007. “Valuing New Goods in a Model with Complementary Online
Newspapers.” American Economic Review, 97(3), 713-744.
Gentzkow, M., and Shapiro, J. 2010. “What Drives Media Slant? Evidence from U.S. Daily
Newspapers.” Econometrica, 78(1), 35-71.
Goolsbee, A. and Petrin, A. 2004. “The Consumer Gains from Direct Broadcast Satellites and
the Competition with Cable TV.” Econometrica, 72(2), 351-81.
Heckman, J. 1979. “Sample Selection Bias as a Specification Error.” Econometrica, 47(1),
153–61.
Huber J., and Zwerina, K. 1996. “The Importance of Utility Balance in Efficient Choice
Designs. Journal of Marketing Research, 33, 307–317.
Imbens, G., and Wooldridge, J. 2007. “Control Function and Related Methods.” Lecture Notes
6 for What’s New in Econometrics? NBER.
Ivaldi, M., and Verboven, F. 2005. “Quantifying the Effects from Horizontal Mergers in
European Competition Policy.” International Journal of Industrial Organization, 23(9/10),
669-691.
Knowledge Networks Inc. 2010. KnowledgePanel®Demographic Profile January 2010.
Government and Academic Research, Knowledge Networks.
Matsa, D. 2011. “Competition and Product Quality in the Supermarket Industry.” Quarterly
Journal of Economics, 126(3), 1539-1591.
Mazzeo, M. 2002. “Competitive Outcomes in Product-Differentiated Oligopoly.” The Review
of Economics and Statistics, 84(4), 716-728.
Mazzeo, M. 2003. “Competition and Service Quality in the US Airline Industry.” Review of
Industrial Organization, 22(4), 275-296.
Milyo, J. 2007. “The Effects of Cross-Ownership on the Local Content and Political Slant of
Local Television News.” FCC Media Ownership Study #6, Washington, D.C., FCC.

36
National Climatic Data Center. 2011. Climate Data Online. Washington, D.C.: U.S.
Department of Commerce, http://www.ncdc.noaa.gov/cdo-web/.
Nevo, A. 2000. “Mergers With Differentiated Products: The Case of the Ready to Eat Cereal
Industry.” Rand Journal of Economics, 31(3), 395-421.
Nielson Company. 2010. “iPhone, Android Show Growth,”
http://www.marketingcharts.com/wp/wp-content/uploads/2010/08/nielsen-smartphone-
penetration-q2-10-august-2010.JPG.
Olivares, M., and Cachon, G. 2009. “Competing Retailers and Inventory: An Empirical
Investigation of General Motors’ Dealerships in Isolated U.S. Markets.” Management
Science, 55(9), 1586–1604.
Pew Research Center. 2010. “Ideological News Sources: Who Watches and Why?” Pew
Research Centre Publication, Accessed on August 14, 2012 at http://www.people-
press.org/files/legacy-pdf/652.pdf.
Pinkse, J., and Slade, M. 20004. “Mergers, Brand Competition and the Price of a Pint.”
European Economic Review, 48(3), 617-643.
Revelt, D., and K. Train. 1998. “Mixed Logit with Repeated Choices: Households' Choices of
Appliance Efficiency Level.” The Review of Economics and Statistics, 80(4), 647-657.
Savage, S., and Waldman, D. 2008. “Learning and Fatigue During Choice Experiments: A
Comparison of Online and Mail Survey Modes,” Journal of Applied Econometrics 23(3),
351-371.
Savage, S., and Waldman, D. 2011. “Consumer Valuation of Media as a Function of Local
Market Structure.” FCC Media Ownership Study #2, Washington, D.C.: FCC.
Siegelman, P., and Waldfogel, J. 2001. “Race and Radio: Preference Externalities, Minority
Ownership, and the Provision of Programming to Minorities.” In Baye, M., and Nelson, J.,
eds., Advances in Applied Microeconomics, Vol. 10: Advertising and Differentiated Products,
Elsevier, Amsterdam.
Singh, V., and Zhu, T. 2008. “Pricing and Market Concentration in Oligopoly Markets.”
Marketing Science, 27(6), 1020-1035.
United States Census Bureau. 2009. American Factfinder. Washington, D.C.: United States
Census Bureau.
United States Census Bureau. 2011. Statistical Abstract of the United States: 2012 (131st
Edition). Washington, D.C.: , 2011; United States Census Bureau.
Yan, M., and Napoli, P. 2006. “Market Competition, Station Ownership, and Local Public
Affairs Programming on Broadcast Television,” Journal of Communications, 56(1), 795-812.
Zavoina, R. and W. McKelvey. 1975. “A Statistical Model for the Analysis of Ordinal Level
Dependent Variables.” Journal of Mathematical Sociology, 103-120.

37
Table 1. Summary of News Service Characteristics
Characteristic Levels
COST
The total of monthly subscriptions to all of the household’s media sources,
plus any contributions to public radio or public TV stations (ranging from $0
to $250 per month).
DIVERSITY OF OPINION
The extent to which the information on news and current affairs in the
household’s overall media environment reflects different viewpoints.
Low: only one viewpoint.
Medium: a few different viewpoints.
High: many different viewpoints.
COMMUNITY NEWS
The amount of information on community news and events in the
household’s overall media environment.
Low: very little or no information on community news and events.
Medium: some information on community news and events.
High: much information on community news and events.
MULTICULTURALISM
The amount of information on news and current affairs in the household’s
overall media environment that reflects the interests of women and
minorities.
Low: very little or no information reflecting the interests of women and
minorities.
Medium: some information reflecting the interests of women and minorities.
High: much information reflecting the interests of women and minorities.
ADVERSTISING
The amount of space and/or time devoted to advertising in the household’s
overall media environment.
Low: barely noticeable.
Medium: noticeable but not annoying.
High: annoying.
NOTES. The upper limit of $250 per month for COST is the total cost for a media environment with a seven-day
subscription to a premium newspaper, such as the New York Times or San Francisco Chronicle ($25), a “All of XM”
subscription to satellite radio ($20), a premier subscription to cable or satellite television ($110), a subscription to very-fast
Internet service ($45), an unlimited data subscription for a Smartphone ($30), and $10 monthly memberships to both NPR
and PBS. Detailed descriptions of the characteristics as they appeared in the survey questionnaire are available in Savage
and Waldman (2011).
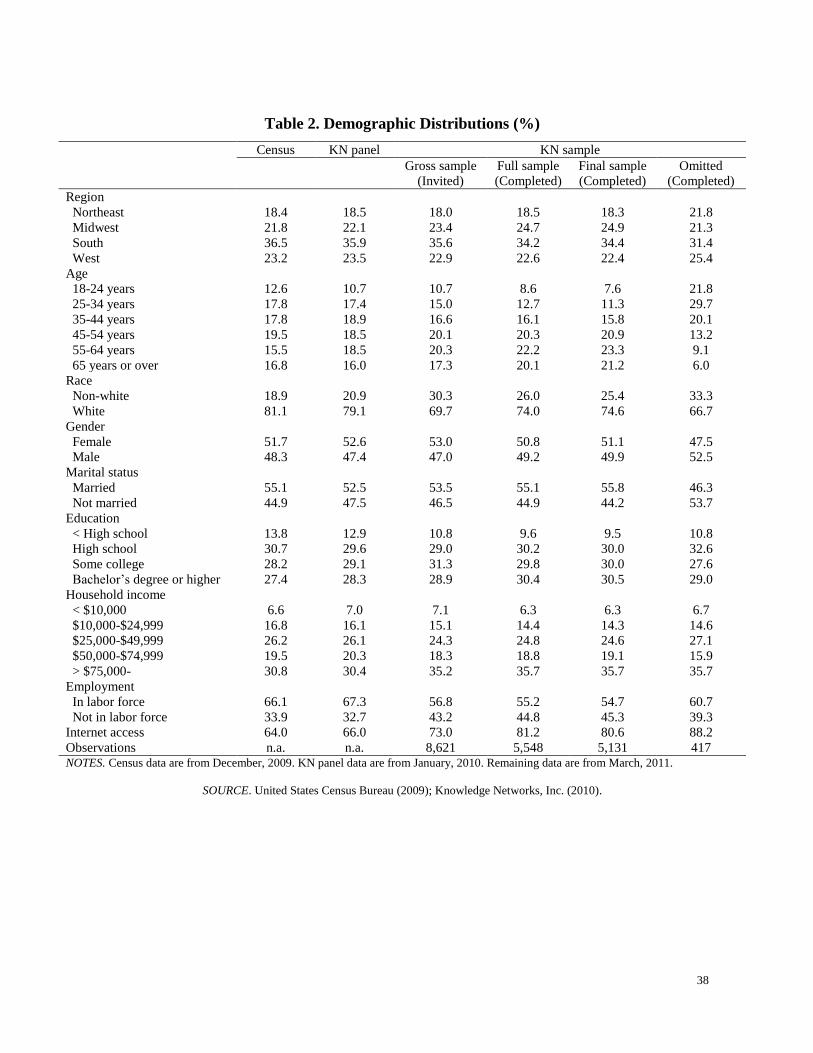
38
Table 2. Demographic Distributions (%)
Census KN panel KN sample
Gross sample
(Invited)
Full sample
(Completed)
Final sample
(Completed)
Omitted
(Completed)
Region
Northeast 18.4 18.5 18.0 18.5 18.3 21.8
Midwest 21.8 22.1 23.4 24.7 24.9 21.3
South 36.5 35.9 35.6 34.2 34.4 31.4
West 23.2 23.5 22.9 22.6 22.4 25.4
Age
18-24 years 12.6 10.7 10.7 8.6 7.6 21.8
25-34 years 17.8 17.4 15.0 12.7 11.3 29.7
35-44 years 17.8 18.9 16.6 16.1 15.8 20.1
45-54 years 19.5 18.5 20.1 20.3 20.9 13.2
55-64 years 15.5 18.5 20.3 22.2 23.3 9.1
65 years or over 16.8 16.0 17.3 20.1 21.2 6.0
Race
Non-white 18.9 20.9 30.3 26.0 25.4 33.3
White 81.1 79.1 69.7 74.0 74.6 66.7
Gender
Female 51.7 52.6 53.0 50.8 51.1 47.5
Male 48.3 47.4 47.0 49.2 49.9 52.5
Marital status
Married 55.1 52.5 53.5 55.1 55.8 46.3
Not married 44.9 47.5 46.5 44.9 44.2 53.7
Education
< High school 13.8 12.9 10.8 9.6 9.5 10.8
High school 30.7 29.6 29.0 30.2 30.0 32.6
Some college 28.2 29.1 31.3 29.8 30.0 27.6
Bachelor’s degree or higher 27.4 28.3 28.9 30.4 30.5 29.0
Household income
< $10,000 6.6 7.0 7.1 6.3 6.3 6.7
$10,000-$24,999 16.8 16.1 15.1 14.4 14.3 14.6
$25,000-$49,999 26.2 26.1 24.3 24.8 24.6 27.1
$50,000-$74,999 19.5 20.3 18.3 18.8 19.1 15.9
> $75,000- 30.8 30.4 35.2 35.7 35.7 35.7
Employment
In labor force 66.1 67.3 56.8 55.2 54.7 60.7
Not in labor force 33.9 32.7 43.2 44.8 45.3 39.3
Internet access 64.0 66.0 73.0 81.2 80.6 88.2
Observations n.a. n.a. 8,621 5,548 5,131 417 NOTES. Census data are from December, 2009. KN panel data are from January, 2010. Remaining data are from March, 2011.
SOURCE. United States Census Bureau (2009); Knowledge Networks, Inc. (2010).

39
Table 3. Summary Statistics for Media Sources
Media source Obs. Sample
share (%)
Mean s.d. Min Max
Newspaper 2,342 45.6 1.015 1.766 0 24
Radio 4,154 81.2 1.423 1.873 0 24
Satellite radio 558 10.9 1.522 2.221 0 24
Television 4,856 94.6 1.953 2.172 0 24
Cable television 2,736 53.4 1.976 2.210 0 24
Satellite television 1,381 27.0 2.071 2.197 0 24
Own Internet 4,135 80.6 1.074 1.659 0 24
Smartphone 1,270 24.8 0.580 1.344 0 24
NOTES. Obs. is the number of observations. Sample share is the percentage of the sample that uses the
media source. s.d. is standard deviation. Min is minimum value. Max is maximum value. Own Internet is
home Internet service not provided by KN.
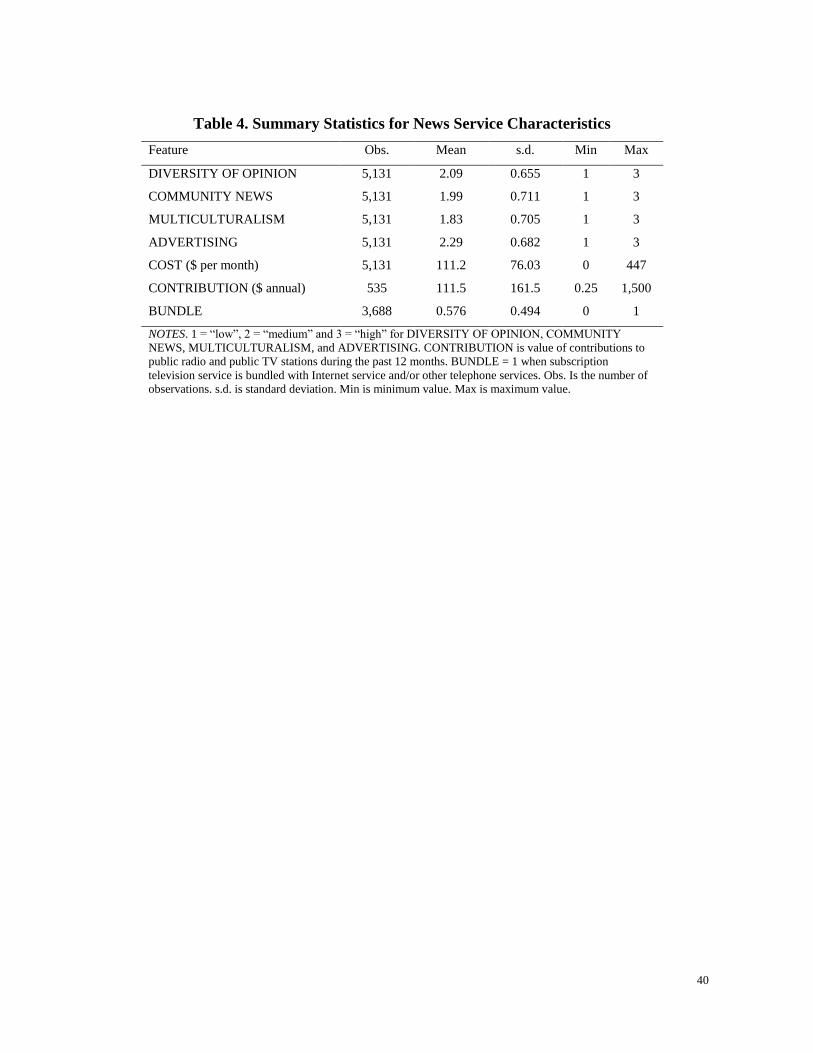
40
Table 4. Summary Statistics for News Service Characteristics
Feature Obs. Mean s.d. Min Max
DIVERSITY OF OPINION 5,131 2.09 0.655 1 3
COMMUNITY NEWS 5,131 1.99 0.711 1 3
MULTICULTURALISM 5,131 1.83 0.705 1 3
ADVERTISING 5,131 2.29 0.682 1 3
COST ($ per month) 5,131 111.2 76.03 0 447
CONTRIBUTION ($ annual) 535 111.5 161.5 0.25 1,500
BUNDLE 3,688 0.576 0.494 0 1
NOTES. 1 = “low”, 2 = “medium” and 3 = “high” for DIVERSITY OF OPINION, COMMUNITY
NEWS, MULTICULTURALISM, and ADVERTISING. CONTRIBUTION is value of contributions to
public radio and public TV stations during the past 12 months. BUNDLE = 1 when subscription
television service is bundled with Internet service and/or other telephone services. Obs. Is the number of
observations. s.d. is standard deviation. Min is minimum value. Max is maximum value.
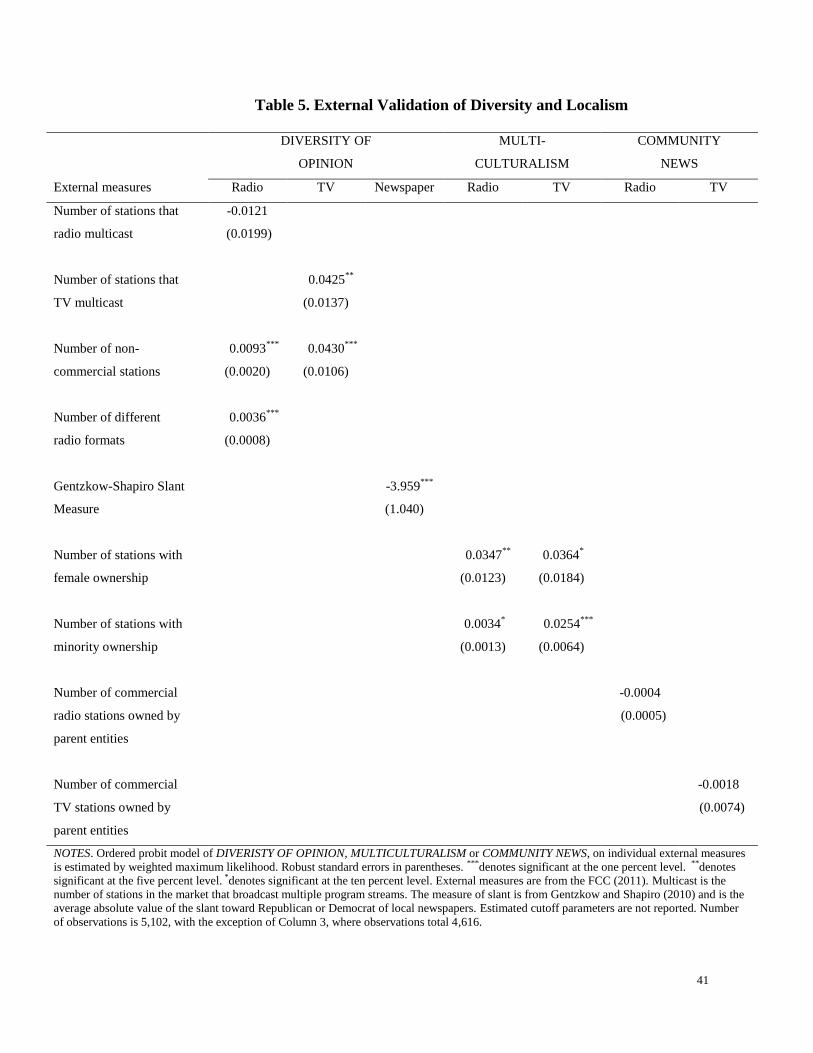
41
Table 5. External Validation of Diversity and Localism
DIVERSITY OF
OPINION
MULTI-
CULTURALISM
COMMUNITY
NEWS
External measures Radio TV Newspaper Radio TV Radio TV
Number of stations that
radio multicast
-0.0121
(0.0199)
Number of stations that
TV multicast
0.0425**
(0.0137)
Number of non-
commercial stations
0.0093***
(0.0020)
0.0430***
(0.0106)
Number of different
radio formats
0.0036***
(0.0008)
Gentzkow-Shapiro Slant
Measure
-3.959***
(1.040)
Number of stations with
female ownership
0.0347**
(0.0123)
0.0364*
(0.0184)
Number of stations with
minority ownership
0.0034*
(0.0013)
0.0254***
(0.0064)
Number of commercial
radio stations owned by
parent entities
-0.0004
(0.0005)
Number of commercial
TV stations owned by
parent entities
-0.0018
(0.0074)
NOTES. Ordered probit model of DIVERISTY OF OPINION, MULTICULTURALISM or COMMUNITY NEWS, on individual external measures
is estimated by weighted maximum likelihood. Robust standard errors in parentheses. ***denotes significant at the one percent level. **denotes
significant at the five percent level. *denotes significant at the ten percent level. External measures are from the FCC (2011). Multicast is the
number of stations in the market that broadcast multiple program streams. The measure of slant is from Gentzkow and Shapiro (2010) and is the
average absolute value of the slant toward Republican or Democrat of local newspapers. Estimated cutoff parameters are not reported. Number
of observations is 5,102, with the exception of Column 3, where observations total 4,616.

42
Table 6. Media Market Structure
Variable Description
HOUSEHOLDS Number of households in the market.
NEWSPAPERS Number of daily newspapers with a city of publication located in a county in the market.
RADIO STATIONS Number of radio stations in the market.
STATIONS Number of full-power TV stations in the market.
MEDIA OUTLETS NEWSPAPERS plus RADIO STATIONS plus STATIONS.
NEWSPAPER VOICES Number of parent entities owning a daily newspaper in the market.
RADIO VOICES Number of independent radio voices in the market.
VOICES Number of independent TV voices in the market.
MEDIA VOICES NEWSPAPER VOICES plus RADIO VOICES plus VOICES.
TV-NEWSPAPER VOICES Number of independent newspaper and TV voices in the market.
TV-RADIO VOICES Number of independent radio and TV voices in the market.
SOURCE. FCC (2011).
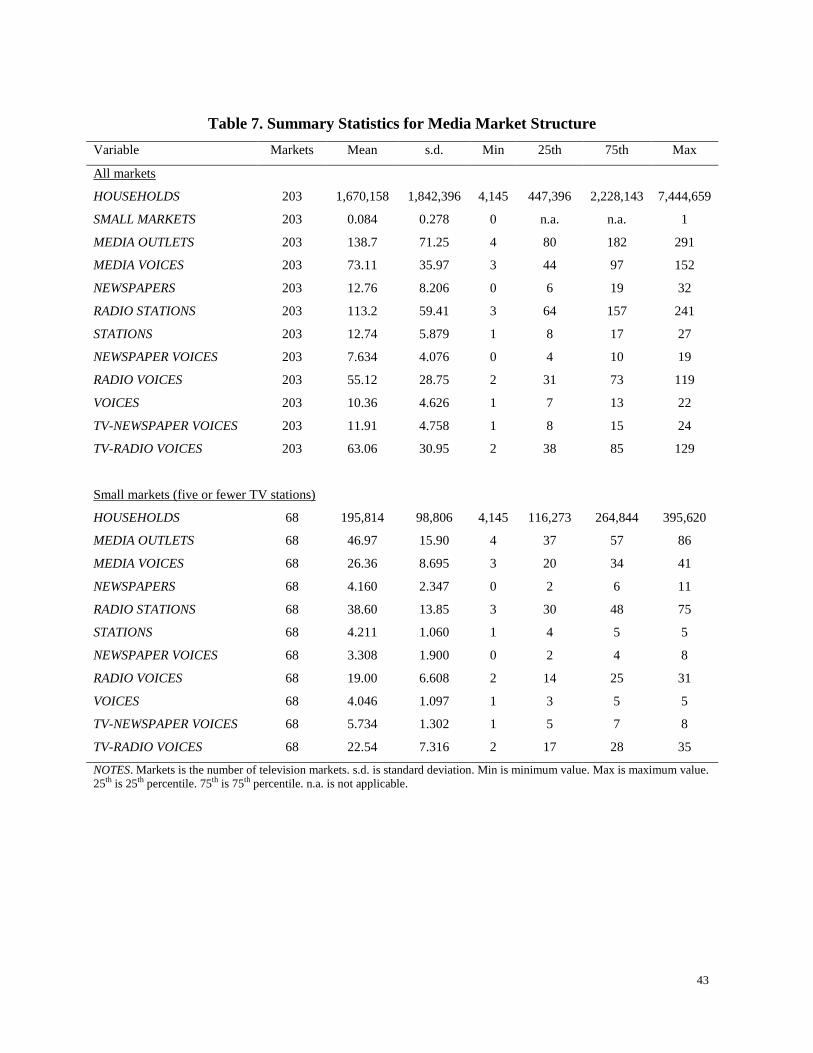
43
Table 7. Summary Statistics for Media Market Structure
Variable Markets Mean s.d. Min 25th 75th Max
All markets
HOUSEHOLDS 203 1,670,158 1,842,396 4,145 447,396 2,228,143 7,444,659
SMALL MARKETS 203 0.084 0.278 0 n.a. n.a. 1
MEDIA OUTLETS 203 138.7 71.25 4 80 182 291
MEDIA VOICES 203 73.11 35.97 3 44 97 152
NEWSPAPERS 203 12.76 8.206 0 6 19 32
RADIO STATIONS 203 113.2 59.41 3 64 157 241
STATIONS 203 12.74 5.879 1 8 17 27
NEWSPAPER VOICES 203 7.634 4.076 0 4 10 19
RADIO VOICES 203 55.12 28.75 2 31 73 119
VOICES 203 10.36 4.626 1 7 13 22
TV-NEWSPAPER VOICES 203 11.91 4.758 1 8 15 24
TV-RADIO VOICES 203 63.06 30.95 2 38 85 129
Small markets (five or fewer TV stations)
HOUSEHOLDS 68 195,814 98,806 4,145 116,273 264,844 395,620
MEDIA OUTLETS 68 46.97 15.90 4 37 57 86
MEDIA VOICES 68 26.36 8.695 3 20 34 41
NEWSPAPERS 68 4.160 2.347 0 2 6 11
RADIO STATIONS 68 38.60 13.85 3 30 48 75
STATIONS 68 4.211 1.060 1 4 5 5
NEWSPAPER VOICES 68 3.308 1.900 0 2 4 8
RADIO VOICES 68 19.00 6.608 2 14 25 31
VOICES 68 4.046 1.097 1 3 5 5
TV-NEWSPAPER VOICES 68 5.734 1.302 1 5 7 8
TV-RADIO VOICES 68 22.54 7.316 2 17 28 35
NOTES. Markets is the number of television markets. s.d. is standard deviation. Min is minimum value. Max is maximum value.
25th is 25th percentile. 75th is 75th percentile. n.a. is not applicable.

44
Table 8. Mixed Logit Estimates of the Demand for Local News Service
Model (i) Model (ii) Model (iii) Model (iv) Model (v)
Mean Mean s.d. Mean s.d. Mean s.d. Mean s.d.
COST -0.020***
-0.028***
-0.028***
-0.037***
-0.042***
(0.0002) (0.0003) (0.0003) (0.001) (0.001)
COST×MED_INCOME 0.004***
0.005***
(0.001) (0.001)
COST×HIGH_INCOME 0.011***
0.013***
(0.001) (0.001)
DIVERSITY OF OPINION 0.383***
0.433***
0.810***
0.448***
0.805***
0.443***
0.801***
(0.009) (0.016) (0.019) (0.016) (0.019) (0.016) (0.019)
COMMUNITY NEWS 0.461***
0.433***
0.649***
0.450***
0.591***
0.449***
0.590***
(0.009) (0.014) (0.018) (0.014) (0.019) (0.014) (0.019)
MULTICULTURALISM- 0.012 0.015 0.685***
0.041***
0.599***
0.041***
0.604***
(0.009) (0.015) (0.019) (0.015) (0.021) (0.015) (0.021)
ADVERTISING -0.357***
-0.227***
0.695***
-0.229***
0.692***
-0.244***
0.681***
(0.010) (0.016) (0.019) (0.016) (0.020) (0.016) (0.020)
MEDIUM DIVERSITY OF OPINION 0.748***
(0.032)
1.295***
(0.043)
HIGH DIVERSITY OF OPINION 0.991***
1.076***
(0.037) (0.043)
MEDIUM COMMUNITY NEWS 0.894***
1.197***
(0.033) (0.045)
HIGH COMMUNITY NEWS 1.116***
0.510***
(0.034) (0.072)
MEDIUM MULTICULTURALISM 0.253***
0.473***
(0.027) (0.075)
HIGH MULTICULTURALISM 0.147***
0.159***
(0.032) (0.062)
MEDIUM ADVERTISING -0.169***
-0.029***
(0.023) (0.049)

45
HIGH ADVERTISING -0.739***
0.291***
(0.039) (0.081)
ALTERNATIVE SPECIFIC CONSTANT 0.769***
0.911***
0.888***
0.888***
0.816***
(0.018) (0.021) (0.021) (0.022) (0.026)
Likelihood -59,453 -32,714 -32,477 -32,303 -32,523 NOTES. Estimated by simulated weighted maximum likelihood. (i) is estimated with the conditional logit model. (ii) though (v) are estimated with the mixed logit model. Mean and s.d. are the
estimated means and standard deviations of the random marginal utility parameters. Covariance’s of correlated random parameters are not reported but are available from the authors upon
request. ALTERNATIVE SPECIFIC CONSTANT equals one for actual news service alternative at home and zero for news service alternatives A and B. Robust standard errors in parentheses. ***denotes significant at the one percent level. **denotes significant at the five percent level. *denotes significant at the ten percent level. Number of observations is 122,448.
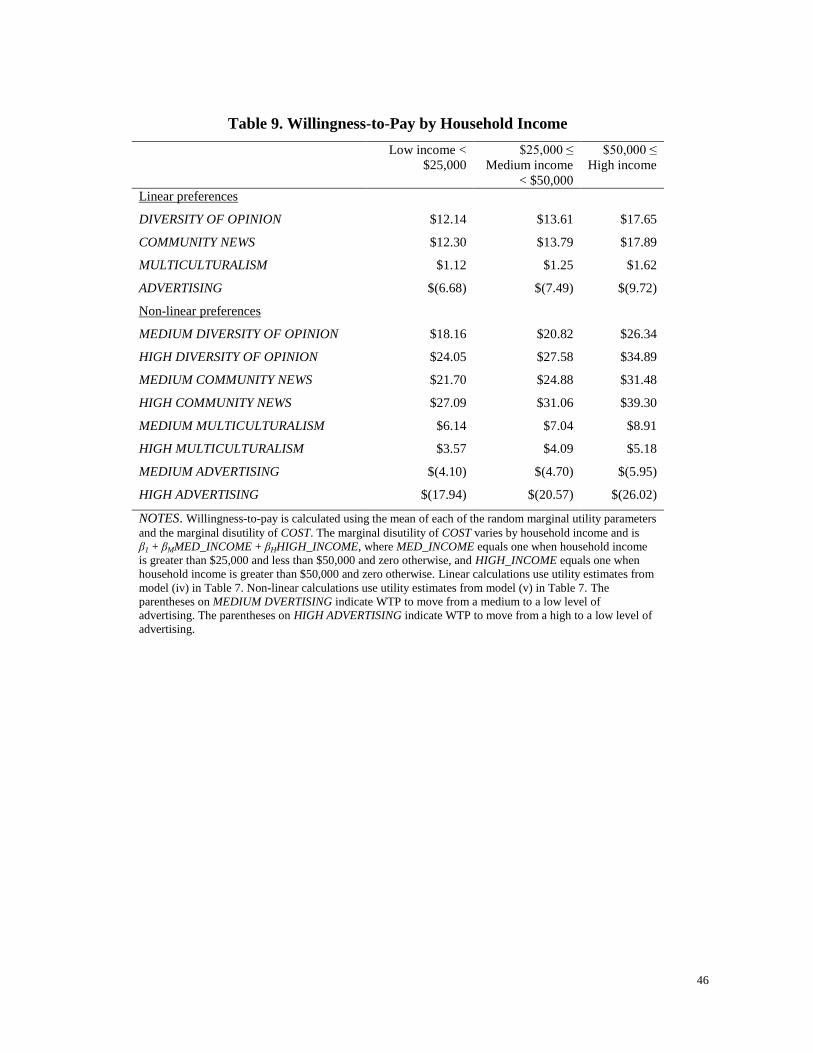
46
Table 9. Willingness-to-Pay by Household Income
Low income <
$25,000
$25,000 ≤
Medium income
< $50,000
$50,000 ≤
High income
Linear preferences
DIVERSITY OF OPINION $12.14 $13.61 $17.65
COMMUNITY NEWS $12.30 $13.79 $17.89
MULTICULTURALISM $1.12 $1.25 $1.62
ADVERTISING $(6.68) $(7.49) $(9.72)
Non-linear preferences
MEDIUM DIVERSITY OF OPINION $18.16 $20.82 $26.34
HIGH DIVERSITY OF OPINION $24.05 $27.58 $34.89
MEDIUM COMMUNITY NEWS $21.70 $24.88 $31.48
HIGH COMMUNITY NEWS $27.09 $31.06 $39.30
MEDIUM MULTICULTURALISM $6.14 $7.04 $8.91
HIGH MULTICULTURALISM $3.57 $4.09 $5.18
MEDIUM ADVERTISING $(4.10) $(4.70) $(5.95)
HIGH ADVERTISING $(17.94) $(20.57) $(26.02)
NOTES. Willingness-to-pay is calculated using the mean of each of the random marginal utility parameters
and the marginal disutility of COST. The marginal disutility of COST varies by household income and is
β1 + βMMED_INCOME + βHHIGH_INCOME, where MED_INCOME equals one when household income
is greater than $25,000 and less than $50,000 and zero otherwise, and HIGH_INCOME equals one when
household income is greater than $50,000 and zero otherwise. Linear calculations use utility estimates from
model (iv) in Table 7. Non-linear calculations use utility estimates from model (v) in Table 7. The
parentheses on MEDIUM DVERTISING indicate WTP to move from a medium to a low level of
advertising. The parentheses on HIGH ADVERTISING indicate WTP to move from a high to a low level of
advertising.
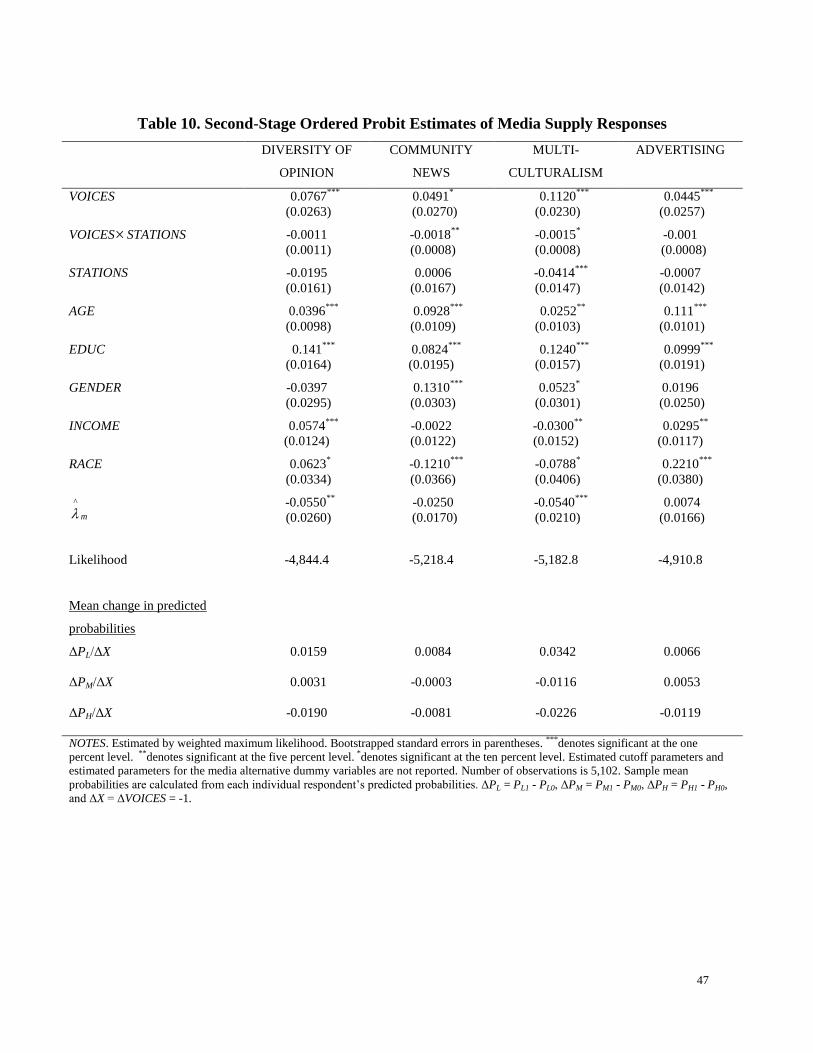
47
Table 10. Second-Stage Ordered Probit Estimates of Media Supply Responses
DIVERSITY OF
OPINION
COMMUNITY
NEWS
MULTI-
CULTURALISM
ADVERTISING
VOICES 0.0767***
(0.0263)
0.0491*
(0.0270)
0.1120***
(0.0230)
0.0445***
(0.0257)
VOICESSTATIONS -0.0011
(0.0011)
-0.0018**
(0.0008)
-0.0015*
(0.0008)
-0.001
(0.0008)
STATIONS -0.0195
(0.0161)
0.0006
(0.0167)
-0.0414***
(0.0147)
-0.0007
(0.0142)
AGE 0.0396***
(0.0098)
0.0928***
(0.0109)
0.0252**
(0.0103)
0.111***
(0.0101)
EDUC 0.141***
(0.0164)
0.0824***
(0.0195)
0.1240***
(0.0157)
0.0999***
(0.0191)
GENDER -0.0397
(0.0295)
0.1310***
(0.0303)
0.0523*
(0.0301)
0.0196
(0.0250)
INCOME 0.0574***
(0.0124)
-0.0022
(0.0122)
-0.0300**
(0.0152)
0.0295**
(0.0117)
RACE 0.0623*
(0.0334)
-0.1210***
(0.0366)
-0.0788*
(0.0406)
0.2210***
(0.0380)
m
^
-0.0550
**
(0.0260)
-0.0250
(0.0170)
-0.0540***
(0.0210)
0.0074
(0.0166)
Likelihood -4,844.4 -5,218.4 -5,182.8 -4,910.8
Mean change in predicted
probabilities
ΔPL/ΔX
0.0159 0.0084 0.0342 0.0066
ΔPM/ΔX
0.0031 -0.0003 -0.0116 0.0053
ΔPH/ΔX
-0.0190 -0.0081 -0.0226 -0.0119
NOTES. Estimated by weighted maximum likelihood. Bootstrapped standard errors in parentheses. ***denotes significant at the one
percent level. **denotes significant at the five percent level. *denotes significant at the ten percent level. Estimated cutoff parameters and
estimated parameters for the media alternative dummy variables are not reported. Number of observations is 5,102. Sample mean
probabilities are calculated from each individual respondent’s predicted probabilities. ΔPL = PL1 - PL0, ΔPM = PM1 - PM0, ΔPH = PH1 - PH0,
and ΔX = ΔVOICES = -1.

48
Table 11. Impact on Consumer Welfare From a Change in Market Structure
Size Pop.
Share
DIV MCULT ADV CNEWS DIV MCULT ADV CNEWS Total Total less
ADV
Average consumer welfare per month
(Dollars per month)
Annual aggregate welfare in market
(Dollars in millions)
5 0.050 -0.61 -0.23 0.30 -0.45 -32.87 -12.58 16.49 -24.40 -53.36 -69.85
(0.05) (0.07) (0.04) (0.03) (2.87) (3.60) (2.13) (1.67)
6 0.061 -0.59 -0.22 0.29 -0.42 -38.84 -14.72 19.19 -27.51 -61.87 -81.06
(0.07) (0.09) (0.05) (0.04) (4.36) (5.69) (3.36) (2.44)
7 0.091 -0.59 -0.23 0.29 -0.40 -57.83 -22.67 28.55 -39.29 -91.24 -119.8
(0.06) (0.07) (0.04) (0.03) (5.57) (7.20) (3.91) (2.84)
8 0.081 -0.57 -0.22 0.28 -0.37 -49.66 -19.47 24.49 -32.84 -77.47 -102.0
(0.06) (0.07) (0.04) (0.03) (4.99) (6.11) (3.57) (2.36)
9 0.095 -0.54 -0.21 0.27 -0.35 -55.97 -21.94 28.06 -36.21 -86.06 -114.1
(0.05) (0.07) (0.04) (0.03) (5.46) (7.28) (4.30) (2.76)
10 0.056 -0.55 -0.21 0.27 -0.34 -33.08 -12.90 16.20 -20.59 -50.38 -66.57
(0.06) (0.09) (0.04) (0.03) (3.91) (5.30) (2.69) (1.75)
11 0.099 -0.53 -0.21 0.26 -0.32 -57.29 -22.36 28.33 -34.51 -85.83 -114.2
(0.05) (0.06) (0.03) (0.02) (5.49) (6.76) (3.70) (2.29)
12 0.069 -0.52 -0.20 0.25 -0.30 -38.83 -15.00 18.40 -22.13 -57.57 -75.97
(0.06) (0.08) (0.04) (0.03) (4.23) (5.63) (2.80) (1.89)
13 0.024 -0.51 -0.20 0.24 -0.28 -13.31 -5.12 6.31 -7.31 -19.43 -25.74
(0.09) (0.12) (0.06) (0.03) (2.34) (3.07) (1.44) (0.88)
14 0.093 -0.47 -0.17 0.24 -0.26 -47.76 -17.06 23.77 -26.01 -67.05 -90.83
(0.05) (0.06) (0.03) (0.02) (4.64) (6.43) (3.14) (1.80)
15 0.03 -0.48 -0.18 0.22 -0.24 -15.57 -5.99 7.24 -7.72 -22.04 -29.28
(0.08) (0.12) (0.05) (0.03) (2.74) (3.77) (1.70) (1.00)
16 0.079 -0.45 -0.16 0.23 -0.23 -38.73 -14.06 19.58 -19.41 -52.62 -72.20
(0.05) (0.07) (0.03) (0.02) (4.62) (6.21) (2.93) (1.55)
17 0.072 -0.45 -0.16 0.21 -0.20 -34.85 -12.56 16.45 -15.83 -46.79 -63.24
(0.06) (0.08) (0.03) (0.02) (4.29) (6.10) (2.72) (1.39)
18 0.043 -0.45 -0.17 0.21 -0.19 -21.00 -8.03 9.67 -8.74 -28.10 -37.77
(0.07) (0.10) (0.05) (0.02) (3.38) (4.71) (2.19) (1.05)
19 0.026 -0.44 -0.19 0.21 -0.17 -12.44 -5.35 5.90 -4.87 -16.76 -22.66
(0.08) (0.11) (0.05) (0.02) (2.23) (3.17) (1.43) (0.60)
20 0.032 -0.38 -0.14 0.17 -0.09 -13.26 -4.98 5.93 -3.20 -15.51 -21.44
(0.03) (0.04) (0.02) (0.01) (1.01) (1.50) (0.62) (0.19)
Total 1 -0.52 -0.20 0.25 -0.31 -561.3 -214.8 274.6 -330.6 -832.1 -1,107
(0.01) (0.01) (0.01) (0.01) (15.35) (15.35) (10.46) (6.82)
NOTES. Bootstrapped standard errors in parentheses. The change in market structure is a one-unit reduction in the number of
independent TV voices in the market, all other things held constant. There are 90,193,905 population households in markets from five
to 20 TV stations (FCC, 2011). Pop. share is the number of population households in the market divided by population households.
DIV is diversity of opinion in the reporting of information, MCULT is coverage of multiculturalism issues, ADV is amount of space or
time devoted to advertising, and CNEWS is amount of information on community news and events. Total losses of $832.1 million are
the sum of the individual market losses.
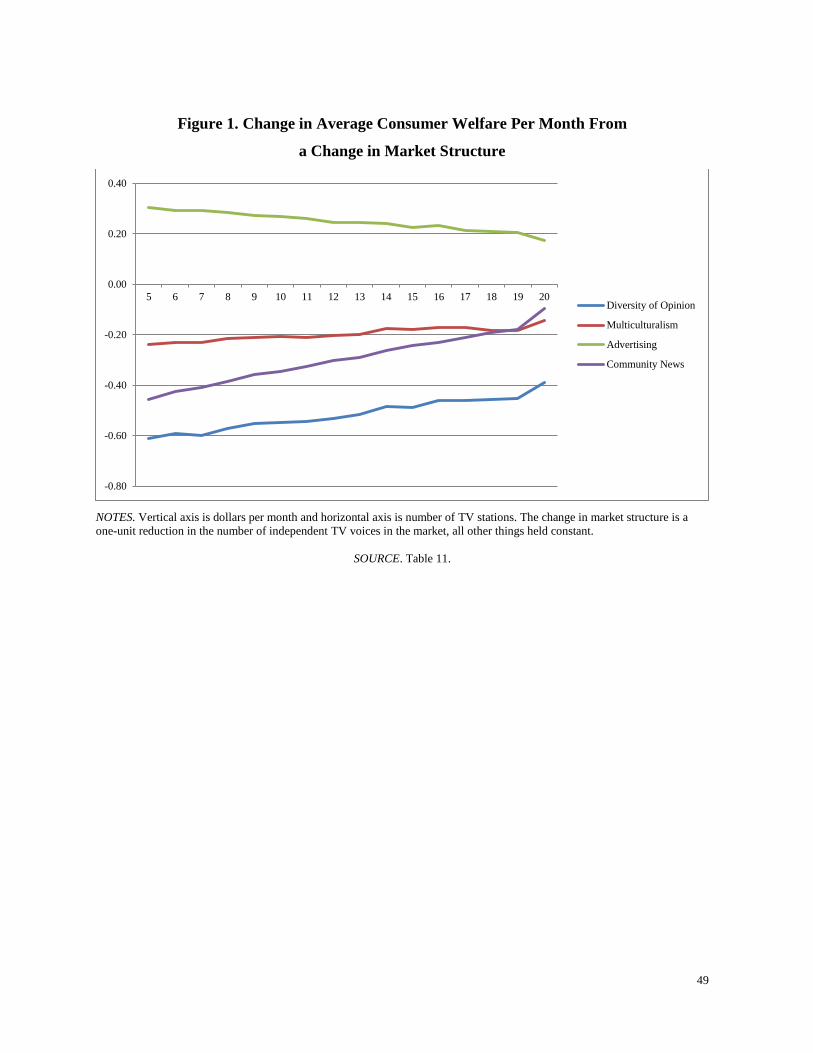
49
Figure 1. Change in Average Consumer Welfare Per Month From
a Change in Market Structure
NOTES. Vertical axis is dollars per month and horizontal axis is number of TV stations. The change in market structure is a
one-unit reduction in the number of independent TV voices in the market, all other things held constant.
SOURCE. Table 11.
-0.80
-0.60
-0.40
-0.20
0.00
0.20
0.40
5 6 7 8 9 10 11 12 13 14 15 16 17 18 19 20Diversity of Opinion
Multiculturalism
Advertising
Community News


