

Mass Spectrometry and ProteomicsMass Spectrometry and Proteomics
Professor Xudong YaoBioanalytical Chemistry
Spring 2007

• Proteomics and “-omics”
• Roles of mass spectrometry
• Comparative proteomics
• Chemical proteomics
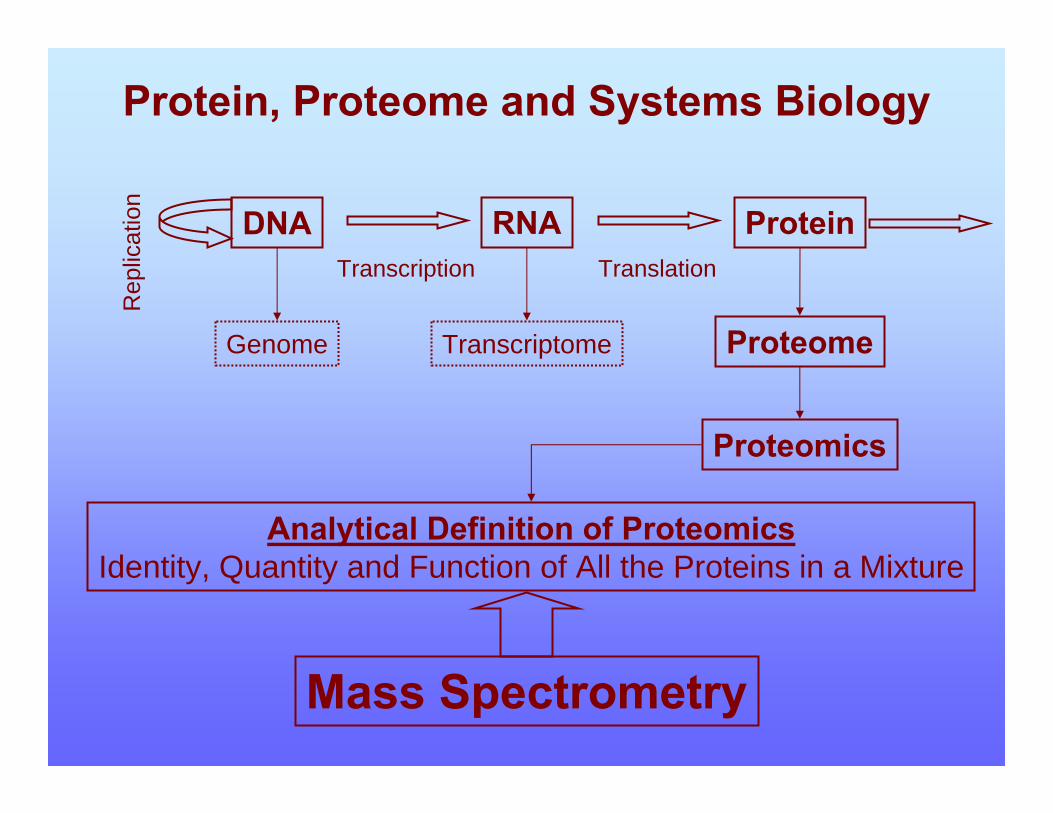
Protein, Proteome and Systems Biology
DNA RNA ProteinTranscription Translation
Rep
licat
ion
Genome Transcriptome Proteome
Proteomics
Analytical Definition of ProteomicsIdentity, Quantity and Function of All the Proteins in a Mixture
Mass Spectrometry

Objectives of Proteomics
Function• Interaction
• Activity
Quantity
Time
Time-Dependence
Identity
Proteome
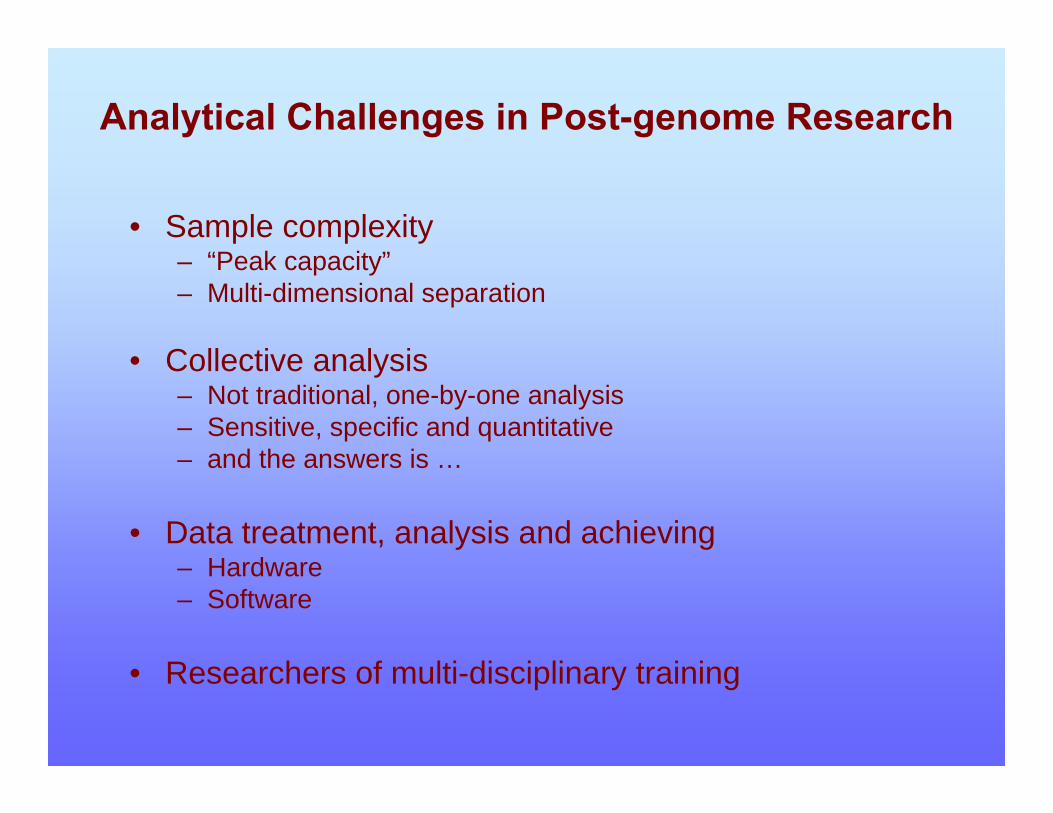
Analytical Challenges in Post-genome Research
• Sample complexity– “Peak capacity”– Multi-dimensional separation
• Collective analysis– Not traditional, one-by-one analysis– Sensitive, specific and quantitative– and the answers is …
• Data treatment, analysis and achieving– Hardware– Software
• Researchers of multi-disciplinary training
m / z1 5 0 2 0 0 2 5 0 3 0 0 3 5 0 4 0 0 4 5 0 5 0 0 5 5 0 6 0 0 6 5 0 7 0 0 7 5 0 8 0 0 8 5 0 9 0 0 9 5 0 1 0 0 0
%
0
1 0 0
%
0
1 0 0
T im e50.00 100.00 150.00 200.00 250.00 300.00 350.00 400.00 450.00 500.00
%
0
100
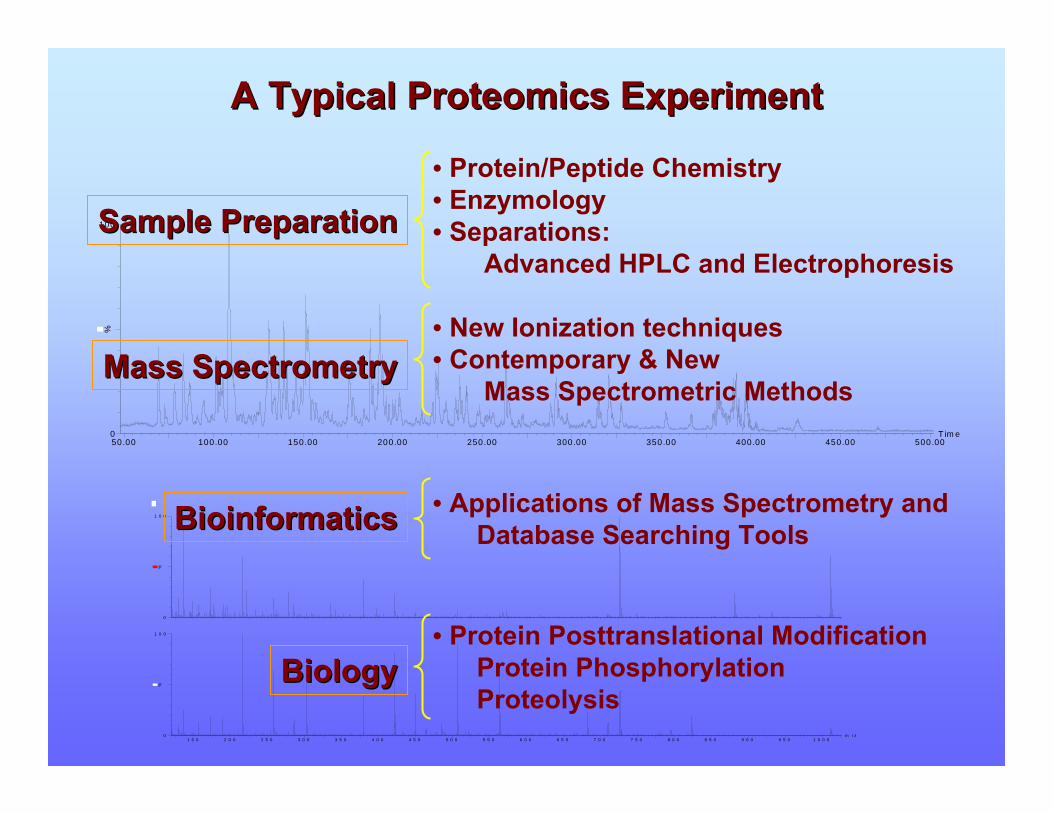
A Typical Proteomics ExperimentA Typical Proteomics Experiment
Sample PreparationSample Preparation
Mass SpectrometryMass Spectrometry
BioinformaticsBioinformatics
• Protein/Peptide Chemistry• Enzymology• Separations:
Advanced HPLC and Electrophoresis
• New Ionization techniques• Contemporary & New
Mass Spectrometric Methods
• Applications of Mass Spectrometry andDatabase Searching Tools
BiologyBiology• Protein Posttranslational Modification
Protein PhosphorylationProteolysis

Roles of Mass Spectrometry

The mass analysis processThe mass analysis processas compared to the dispersion of light by a prismas compared to the dispersion of light by a prism
Siuzdak, 2003

Mass Spectrometry
Mass Analyzer Ion Detector
Data System
Ion Source(ESI, MALDI)
Sample Introduction
m/z
Intensity
Mass Spectrum
Vacuum

• Separate ions by mass/charge
• Common types– Quadrupole mass filter (Q), Time-of-Flight (TOF), Ion
Trap (IT), Fourier Transform Ion Cyclotron Resonance (FTICR)
• Tandem mass spectrometry– Spatial, such as Q-q-TOF, TOF-TOF, Q-q-Q– Temporal, such as IT, FTICR– Spatial and Temporal, such as IT-FTICR, Q-q-FTICR,
IT-TOF
Mass Analyzer

Soft Ionizations of Soft Ionizations of BiomoleculesBiomolecules
1. Matrix-Assisted Laser Desorption/Ionization (MALDI)
2. Electrospray Ionization (ESI)
Nobel Prize in 2002

MatrixMatrix--Assisted Laser Desorption/Ionization Assisted Laser Desorption/Ionization (MALDI) Generates Singly(MALDI) Generates Singly--Charged IonsCharged Ions
+
+ +
+
+
+
++
+
+ +
+ ++
+
+
+
Sample probe
Laser beam
Light-absorbing matrixAnalyte molecule
+
++
Analyte ion
Matrix ion
__
_
_
MH+

Electrospray Ionization (ESI) Generates MultiplyElectrospray Ionization (ESI) Generates Multiply--Charged IonsCharged Ions

Tandem MS: Basic ConceptsTandem MS: Basic Concepts
MS-1MS-2
Mass-selectedprecursor
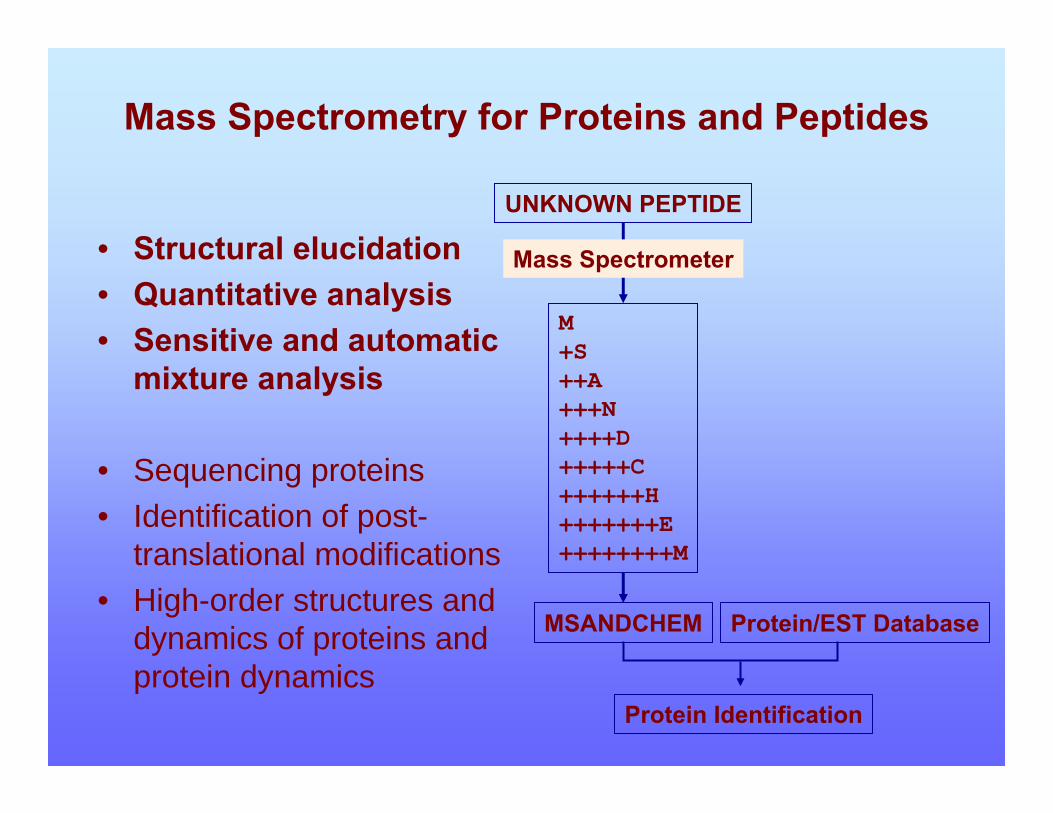
Mass Spectrometry for Proteins and Peptides
• Structural elucidation• Quantitative analysis• Sensitive and automatic
mixture analysis
• Sequencing proteins• Identification of post-
translational modifications• High-order structures and
dynamics of proteins and protein dynamics
M+S++A+++N++++D+++++C++++++H+++++++E++++++++M
MSANDCHEM
UNKNOWN PEPTIDE
Mass Spectrometer
Protein/EST Database
Protein Identification

Comparative Proteomics
Gel or Non-gelLabel or Non-label
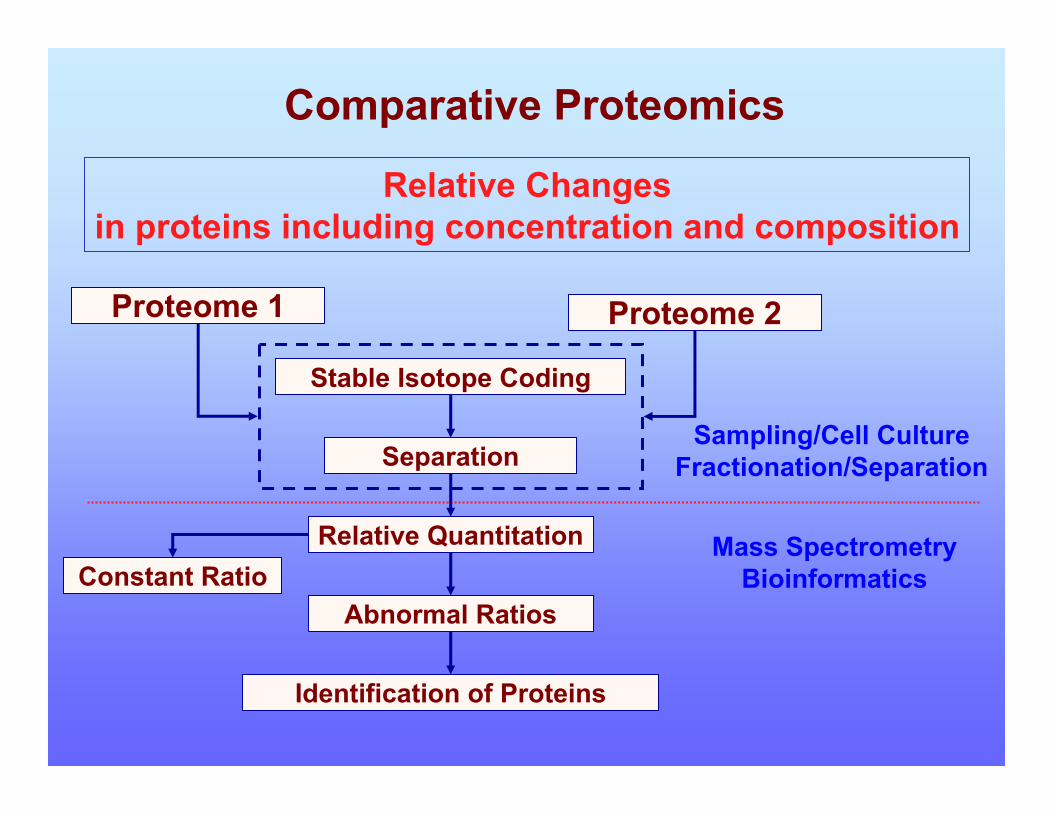
Comparative Proteomics
Proteome 2
Stable Isotope Coding
Proteome 1
Relative QuantitationConstant Ratio
Abnormal Ratios
Identification of Proteins
SeparationSampling/Cell Culture
Fractionation/Separation
Mass SpectrometryBioinformatics
Relative Changesin proteins including concentration and composition

1. Tween/DOC Extraction (Nuclear Fraction) (Prolactin)2. Tween/DOC Extraction (Nuclear Fraction) (Control)3. Triton X-100 Extraction (Membrane/Organelle Fraction) (Prolactin)4. Triton X-100 Extraction (Membrane/Organelle Fraction) (Control)5. Digitonin Extraction (Cytosolic Fraction) (Prolactin)6. Digitonin Extraction (Cytosolic Fraction) (Control)7. Protein Ladder
1 2 3 4 5 6 7
30K
50K
Reduce sample complexity at the protein Reduce sample complexity at the protein level: DDF (Differential Detergent level: DDF (Differential Detergent
Fractionation)Fractionation)T47D Cells
Pellet
Digitonin Extract
Digitonin
Supernatant
Pellet
Triton X-100 Extract
Supernatant
Triton X-100
Tween/DOC Extract
T47D Cells
Pellet
Digitonin Extract
Digitonin
Supernatant
Pellet
Triton X-100 Extract
Supernatant
Triton X-100
Tween/DOC Extract

GEL: 2-Dimensional Electrophoresis (2-DE)
A Pandey; M Mann, Nat. Biotechnol. 2000
• Difficulties with: extreme pI proteins, low abundance, proteins, hydrophobic proteins• Inefficient in-gel digestion of proteins for MS analysis • Labor extensive

NONNON--GEL: GEL: MudPITMudPIT Analysis of Protein ComplexAnalysis of Protein Complex
• Easier separation• Easier automation• “Problematic” proteins
– Small, large, hydrophobic, low abundance
• Easier sample preparation for MS analysis
• Computational capacity•• Quantitative capabilityQuantitative capability
Link et al. Nat. Biotechnol. 1999

A Glance at Proteomic BioinformaticsA Glance at Proteomic Bioinformatics

ShotgunShotgun2 2 Collision Induced DissociationCollision Induced DissociationMass SpectrometryMass Spectrometry
In-source Shotgun(CID)
In-collision-cell Shotgun(CID)
ShotgunShotgun22(CID)(CID)
CID of [M+3H]3+
CID of [M+2H]2+
****
11
22
3 3 = 1 + 2= 1 + 2InIn--SourceSource

Comparative Proteomics
Proteome 2
Stable Isotope Coding
Proteome 1
Relative QuantitationConstant Ratio
Abnormal Ratios
Identification of Proteins
SeparationSampling/Cell Culture
Fractionation/Separation
Mass SpectrometryBioinformatics
Relative Changesin proteins including concentration and composition

• Large differences in concentration– Direct ESI/MALDI MS
• Small differences in protein concentration– Stable isotope dilution: inherent choice
Label: MS-Based Relative Quantitation
m/z
Intensity

Introduction of Stable Isotopes
• Criteria for isotope internal standards– Ideally behaving the same before mass analysis
• Metabolic labeling during biosynthesis/bioprocess• Post-biosynthesis/bioprocess labeling: chemical
and enzymatic– Functional groups on side chains: -SH, -OPO3H3
– Termini: N-terminal, C-terminal– Active/Binding sites: Chemical Proteomics
(A1A2A3…An)iH2N COOHCoding Module

Advantages of Modular Design
• Isotope Coding • Universal
•Important to small proteins• Specific• Efficient• Minimal Structural Modification
•Chromatographic co-elution•Stable during separation
• Separation• Portable to all separation platforms,including affinity separation
(A1A2A3…An)iH2N COOHSeparation Module Coding Module

Tryptic Incorporation of Two 18O Atoms into Peptide C-Terminus
EHC
R
CHN
OHC
R
C *OH
O
+ H2*O H2N+
*

Adenovirus as Model System
• Minimal real system– DNA + Proteins
• Known genome/proteome– Predictable proteolytic peptides
• Defined architecture– Predictable protein expression
• Comparative quantitation of Ad2/Ad5 proteins• Dynamic range of 600-fold
– Capsid protein modeling membrane/hydrophobic proteins
• Mutations modeling post-translational modifications
Shenk T. In Fundamental Virology, 1996

CombinedIsotope-Coded Peptides
H218O Trypsin H2
16O
Ad2 Virion
3
Ad5 Virion
1
Most of peptidesAd2:Ad5 = 3:1
MALDI-FTICR MS
Protein Identification and Quantitation
Lys-C
Theoretical MW of Ad Tryptic Peptides

MALDI-FTICR Mass Spectrum of Combined Digests
Rel
ativ
e In
tens
ity
218O
218O
218O1603.83, Protein VII
TTVDDAIDAVVEEAR1597.78, Protein V
TSTEVQTDPWFR
1628.96, Protein V
VLRPGTTVVFTPGER

Controversies and Challengesin Proteolytic Labeling
• Reported controversies in tryptic 18O labeling– One 18O incorporation for K-terminated peptides– Low efficient incorporation of two 18O for short peptides– Two 18O in each new peptides
• Capabilities of endoproteases for 18O labeling– Two 18O incorporation by trypsin, Lys-C, and Glu-C only – One 18O incorporation by chymotrypsin…
• Challenges for automated, large-scale application – Amount and cost of H2
18O

Decoupling Proteolytic 18O Labeling from Protein Digestion
Proteins in solution prior to digestionPeptide labeling in small volume of H2
18OSeparate optimization of digestion and labeling
Automatic, high-throughput, large-scale applications

EHC
R
CHN
OHC
R
CHN
O
NH2
H2*OHC
R
C OH
O
H2*O
H2O
HC
R
C OH
O
+ .
½*
½* .
*
* .HC
R
C OH
O*
* +
HO EHO EHO
EHOEHO
H2*O
Amide Bond Cleavage
Carboxyl Oxygen Exchange
Dissection of Proteolytic Incorporation of Two 18O
HC
R
C OH
O½*
½* + EHO
Yao, Afonso, Fenselau. J. Proteom. Res. 2003, 2, 147.

Molecular Basis for Cleavage and Exchange
Protease catalyzes exchange TWO 18O INCORPORATION
P3 P1P2 P3’P2’P1’
S1S2S3 S3’S2’S1’
Native Peptide Substrate
CONHP5 P4
S4S5
S2’
P1
S1 S3’S1’
COOH
Truncated Peptide Substrate
P3 P2
S2S3
P5 P4
S4S5
Exchange
Cleavage

16O-to-18O Exchange Studied by MALDI-FTICR MS
0.5 min
12.0 min730.34 732.34 734.34
YGGFMR(16O2)
YGGFMR(16O18O)
YGGFMR(18O2)
m/zRel
ativ
e In
tens
ity
Time

Determination of Reaction Initial Rates
),,,,,(][][
4242 MMMIIIIIRR
oototal
oo=

Kinetics Comparison in R- and K-Peptides
YGGFMKYGGFMR
kcat/KM
(µM-1min-1)
KM
(µM)
Kcat
(min-1)
4400±7001300±300
0.64±0.142.6±0.9
2800±3003500±500

Simultaneous Mass Spectrometric Determination ofKinetics for Trypsin-Catalyzed 16O-to-18O Exchange
Complete Exchange for Mixture
Exch
ange
Rat
e
R R

Enzymatic 18O Labeling
• Universal two 18O labeling of proteolytic peptides by protease-catalyzed exchange– Both K- and R-terminated peptides– Chymotrypsin and pepsin for two 18O labeling, in
addition to trypsin, Lys-C, Glu-C, …– Both short and long peptides
• 4 Da mass increase at the C-terminus of proteolytic peptides to be differentiated in mass spectrometry

Mass Spectrometry of Peptide-16O2/18O2 Pairs
• 18O-labeling enabled mass spectrometric quantitation
• Effect of peak resolution on quantitation
• Analysis on different mass analyzer configurations
• More than relative quantitation from differential oxygen labeling
(A1A2A3…An)iH2N COOHCoding ModuleSeparation Module

Relative QuantitationUsing Paired Isotope Clusters
0
25
50
75
100
0
25
50
75
100
I4
I2
I0 M0
M2
M4
Theoretical natural isotopic distribution
Observed isotopic distribution of 1:1 mixture of 18O and 16O samples
Mass/Charge
Rel
ativ
e In
tens
ity
⎥⎥⎦
⎤
⎢⎢⎣
⎡−−⎟⎟
⎠
⎞⎜⎜⎝
⎛+⎟⎟
⎠
⎞⎜⎜⎛
−+=o
4
o
22
o
2
o
2
o
2
o
4
MM
MM
MM
II
MM1
IIRatio
1
5
II

Correlation of ESI Quantitation with Peptide UV Quantitation
0 2 4 6 8 100
2
4
6
8
10Peptide FVNQHLCGSHLVE
MS
Rat
io o
f [18
O]/[
16O
]
slope: 0.94±0.03r2: 0.997
UV Ratio of [18O]/[16O]
Reynolds, Yao, Fenselau. J. Proteom. Res. 2003, 1, 27.
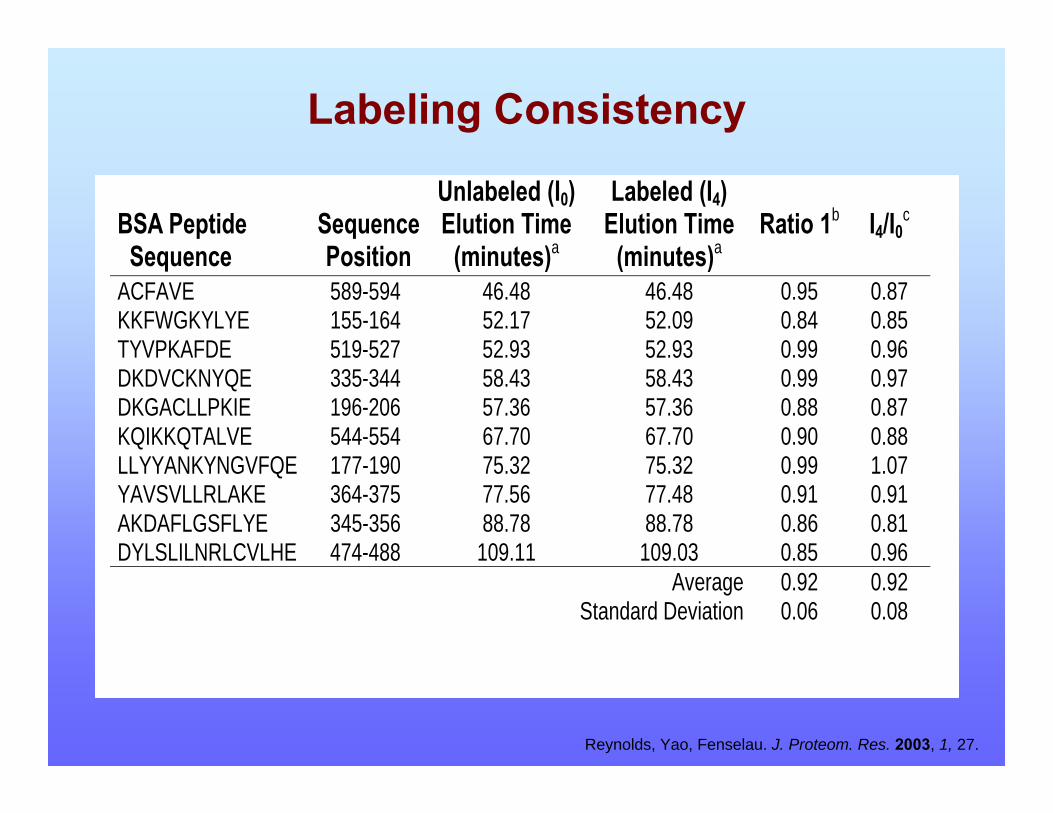
Labeling Consistency
BSA Peptide Sequence
Sequence Position
Unlabeled (I0) Elution Time
(minutes)a
Labeled (I4) Elution Time
(minutes)a Ratio 1b I4/I0c
ACFAVE 589-594 46.48 46.48 0.95 0.87 KKFWGKYLYE 155-164 52.17 52.09 0.84 0.85 TYVPKAFDE 519-527 52.93 52.93 0.99 0.96 DKDVCKNYQE 335-344 58.43 58.43 0.99 0.97 DKGACLLPKIE 196-206 57.36 57.36 0.88 0.87 KQIKKQTALVE 544-554 67.70 67.70 0.90 0.88 LLYYANKYNGVFQE 177-190 75.32 75.32 0.99 1.07 YAVSVLLRLAKE 364-375 77.56 77.48 0.91 0.91 AKDAFLGSFLYE 345-356 88.78 88.78 0.86 0.81 DYLSLILNRLCVLHE 474-488 109.11 109.03 0.85 0.96 Average 0.92 0.92 Standard Deviation 0.06 0.08
Reynolds, Yao, Fenselau. J. Proteom. Res. 2003, 1, 27.
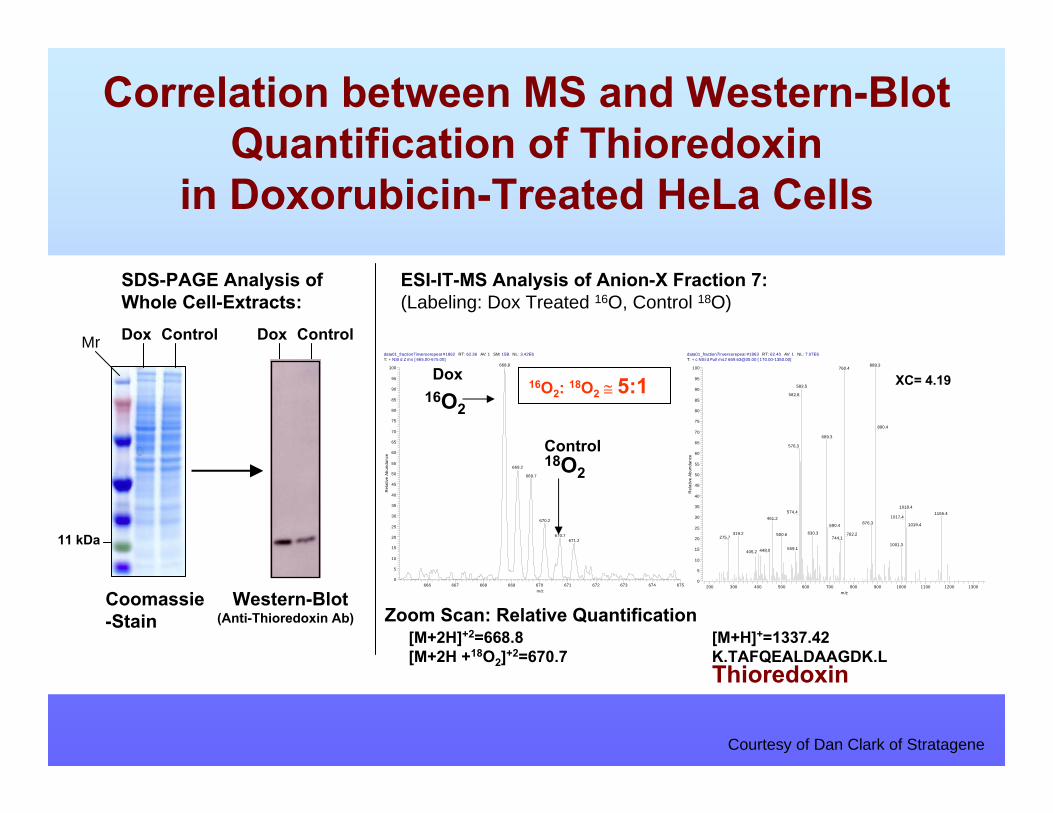
MS2 Scan: Identification
Correlation between MS and Western-Blot Quantification of Thioredoxin
in Doxorubicin-Treated HeLa Cells
data01_fraction7inverserepeat #1862 RT: 62.36 AV: 1 SM: 15B NL: 3.42E6T: + NSI d Z ms [ 665.00-675.00]
666 667 668 669 670 671 672 673 674 675m/z
0
5
10
15
20
25
30
35
40
45
50
55
60
65
70
75
80
85
90
95
100
Rel
ativ
e A
bund
ance
668.8
669.2
669.7
670.2
670.7671.2
data01_fraction7inverserepeat #1863 RT: 62.40 AV: 1 NL: 7.07E6T: + c NSI d Full ms2 [email protected] [ 170.00-1350.00]
200 300 400 500 600 700 800 900 1000 1100 1200 1300m/z
0
5
10
15
20
25
30
35
40
45
50
55
60
65
70
75
80
85
90
95
100
Rel
ativ
e Ab
unda
nce
889.3760.4
583.5
582.8
890.4
689.3
576.3
1018.4574.4 1165.4
1017.4461.2876.3 1019.4690.4
630.3319.2 762.2500.6275.7 744.11001.3
559.1448.0405.2
ESI-IT-MS Analysis of Anion-X Fraction 7:(Labeling: Dox Treated 16O, Control 18O)
Coomassie-Stain
Western-Blot(Anti-Thioredoxin Ab)
ControlDox
Zoom Scan: Relative Quantification
XC= 4.19Dox
Control
[M+H]+=1337.42K.TAFQEALDAAGDK.L
18O2
16O2
Thioredoxin
16O2: 18O2 ≅ 5:1
11 kDa
ControlDox
[M+2H]+2=668.8[M+2H +18O2]+2=670.7
SDS-PAGE Analysis of Whole Cell-Extracts:
Mr
Courtesy of Dan Clark of Stratagene

Effect of Peak Resolution on 18O/16O Ratio (I)
18O2
1603.83, Protein VIITTVDDAIDAVVEEAR
1597.78, Protein VTSTEVQTDPWFR
1628.96, Protein VVLRPGTTVVFTPGER
18O2
18O2
2.6 ±0.33.3±0.53.0±0.53.7±0.42.9±0.3Relative Intensity
0.10.331460% wt
TerminalVIIIIXVIIIIProtein
MALDI-FTICR
Yao, Freas, Ramirez, Demirev, Fenselau. Anal. Chem. 2001, 73, 2836.
Effect of Peak Resolution on 18O/16O Ratio (II)
1922.7 1926.8
m/z
APC3_Human: 0.94
961.83963.84
m/z
2+
APC3_Human: 0.87
894.3 898.3
m/z
APC2_Human: 0.91
m/z
2112.92116.9
A1AH_Human: 0.94
705.00 706.23
m/z
3+
A1AH_Human: 1.3
447.70 449.68
m/z
2+
APC2_Human: 1.2
MALDI-TOF
ESI-IT
Heller, Mattou, Menzel, Yao. JASMS 2003, 14, 704.

Effect of Isolation Window Width on Quantitation Using 16O/18O y-Ion Pairs on IT MS
984.
60
988.
49
983 985 987 989 991 m/z
984.
62 988.
60
983 985 987 989 991 m/z
689.
85
686 688 690 692 694 m/z
689.
87 691.
82
686 688 690 692 694 m/z
MS
MS/MS
MS
MS/MS
Isolation of Io = 689.93 Isolation of I4 = 691.93
MH22+ MH2
2+
y10+ y10
+
691.
83
Heller, Mattou, Menzel, Yao. JASMS 2003, 14, 704.

Protein Sequence IonsGenerated by Tandem Mass Spectrometry
H2N C C
A1
HN
O
C C
A2
HN
O
C C
A3
HN
O
C C
A4
HN
O
C C
A5
OH
OH H H H H
x1 y1 z1
a4 b4 c4
x2 y2 z2
a3 b3 c3
x3 y3 z3
a2 b2 c2
x4 y4 z4
a1 b1 c1
Mass Analyzer1
Mass Analyzer2
Fragmentingthe Selection Ion

Masses of Amino Acid ResiduesMasses of Amino Acid Residues

Yao, Freas, Ramirez, Demirev, Fenselau. Anal. Chem. 2001, 73, 2836.
Quantitation Based on MS/MS Spectrum (y-Ions)
m/z
MTVEPGLEPEVR
678 680 682 6840
100
Rel
ativ
e In
tens
ity
m/z
16O2
18O2
350 400 450 500 550 600 650 700 750
0
20
40
60
80
100
Rel
ativ
e In
tens
ity
H2N C C
A1
HN
O
C C
A2
HN
O
C C
A3
HN
O
C C
A4
HN
O
C C
A5
OH
OH H H H H
y1
b4
y2
b3
y3
b2
y4
b1

16O/18O Paired Peptides Facilitate and Validate Peptide Sequencing
N-terminal mass470.1 Da
QqTOF MS/MS
IT MS/MS
m/z400 500 600 700 800 900 1000 1100 1200
Q D A Y V SC-terminal mass575.3 Da
Rel
ativ
e In
tens
ity

Advantages of Modular Design
• Isotope Coding • Universal
•Important to small proteins• Specific• Efficient• Minimal Structural Modification
•Chromatographic co-elution•Stable during separation
• Separation• Portable to all separation platforms:LC/LC, solution IEF, affinity separation
(A1A2A3…An)iH2N COOHSeparation Module Coding Module

Protein Pools of Digitonin Extract of MCF-7 Cells
Modified according to “Ramsby, Makowski Method Mol. Biol., 112, 1999.
• Digitonin fraction– cytosolic – soluble cytoskeletal proteins
• Properties– functional proteins– soluble proteins
Cancer Cells
Pellet
5,000xg
Digitonin Extract
Digitonin Extraction
Supernatant
120,000xg
C4 Fractionation

LC-MS of Peptides from MCF-7 Digitonin Fraction
4 0 6 0 8 0 1 0 0 1 2 0
Rel
. Int
.
Base peak chromatography of total peptide mixture
Time (min)
Rel
. Int
.
0.5 1.0 1.5 2.0 2.5 3.00
10
20
30
40
Freq
uenc
y
MelR/WT
• Protein Ratio (MelR/WT) = 1.1• I0/I4 Ratio (MelR/WT) = 1.1 ± 0.3• 83% (184/223) peptides in 1.1 ± 0.3
m/z600 650 700 900 950 1000
TOF MS at 78 min
m/z600 650 700 900 950 1000
TOF MS at 78 min
Yao, Fenselau. ASMS Annual Conference, 2001

Protein Expression Changes in MCF-7 CellsUpon Acquisition of Melphalan Resistance
[Most Proteins in a Ratio (MelR/WT) of 1.1]
784 786 788
(K)LLPQLTYLDGYDR(E)PHAPI2b /April proteinpI = 4.0MelR/WT = 2.0
654 656 658 660
(R)GIVTNWDDMEK(I)602308605F1 NIH_MGC_88 Homo sapiens cDNA cloneMelR/WT = 2.6
m/z
Re l
ati v
e In
ten s
ity
Yao, Fenselau. ASMS Annual Conference, 2001

Analysis of Human Plasma Sample: Example 1
Abundance Protein Depletion
Denaturing SEC Small Proteins
Large Proteins RPFraction X
Tryptic Digestion
Human Plasma
1x Peptide Pool 1 1x Peptide Pool 2
Enzymatic 16O-Labeling Enzymatic 18O-Labeling
2x MG 16O-Peptides 1x MG 18O-Peptides
Combine Differentially-Labeled Peptides
µ-RP-HPLC ESI-MS/MSMALDI-MS/MS
SCX
Heller, Mattou, Menzel, Yao. JASMS 2003, 14, 704.

LC-MALDI & LC-ESI MS Analysis ofDifferentially 18O/16O-Labeled Peptides
Present in Human Plasma
LC-nanoESI-MS (QTOF)748.43
752.47
570.29 571.63
748.42
752.42
570.32 571.65
LC-ESI-MS (IT)
LC-MALDI-MS (TOF)1708.5 1712.5
748.3
752.3
Rel. Int.
m/zHeller, Mattou, Menzel, Yao. JASMS 2003, 14, 704.

Analysis of Human Plasma Sample: Example 2
Qian et. al., Smith MCP 2005, March 7

Coupling 16O/18O-Labeling and Solution Isoelectric Focusing for Peptide Analysis
An, Fu, Gutierrez, Fenselau. J. Proteom. Res. 2005, 4, 2126.
─ Comparative investigation of insoluble nuclear subproteome─ Sample separation after combining differentially-labeled peptides

Isotope-Coded Affinity Tag (ICAT)
• Unique Chemistry for -SH• Affinity Tag• Isotope-Coded Linker
Gygi et al. Nat Biotechnol. 1999

Assembling Separation Module and Coding Module
O -16
O -18
Mass/Charge
Rel
ativ
e In
tens
ity
O
O
NH O O NH
OS
NHNH
I
H218/16O
16/18O2
16/18O216/18O2
16/18O2
16/18O2
CH2
S
OH
O16/18
O
Biotin
(A1A2A3…An)iH2N COOHCoding ModuleSeparation Module
ProteinGlu-C
16/18
–16O2–18O2
FVNQHLCGSHLVE
Biotin

16O/18O-Labeling and Affinity Enrichment to Quantitate Proteins
Liu, Qian, Strittmatter, Camp, Anderson, Thrall, Smith. Anal. Chem. 2004, 76, 5345.


