
Mata kuliah Analisis dan Desain Sistem Informasi
Data Flow Diagram{Diagram Arus Data}
Arif Akbarul Huda, S.Si, M.Eng
3
● DFDs describe the flow of data or information into and out of a system– what does the system do to the data?
● A DFD is a graphic representation of the flow of data or information through a system
Data Flow Diagrams (DFD)
Flow chart shows “ flow of Control “ . DFD shows “ flow of Data The flowchart describes boxes that
describe computations, decisions, interactions & loops.
It is important to keep in mind that data flow diagrams are not flowcharts and should not include control elements .
DFD is not a “flow chart”
TYPES OF DFD
Data flow diagrams (DFDs) are categorized as either logical or physical. 1) LOGICAL DFD:- A logical DFD focuses on the business and how the business operates. It describes the business events that take place and the data required and produced by each event.
2) PHYSICAL DFD:- A physical DFD shows how the system will be implemented.
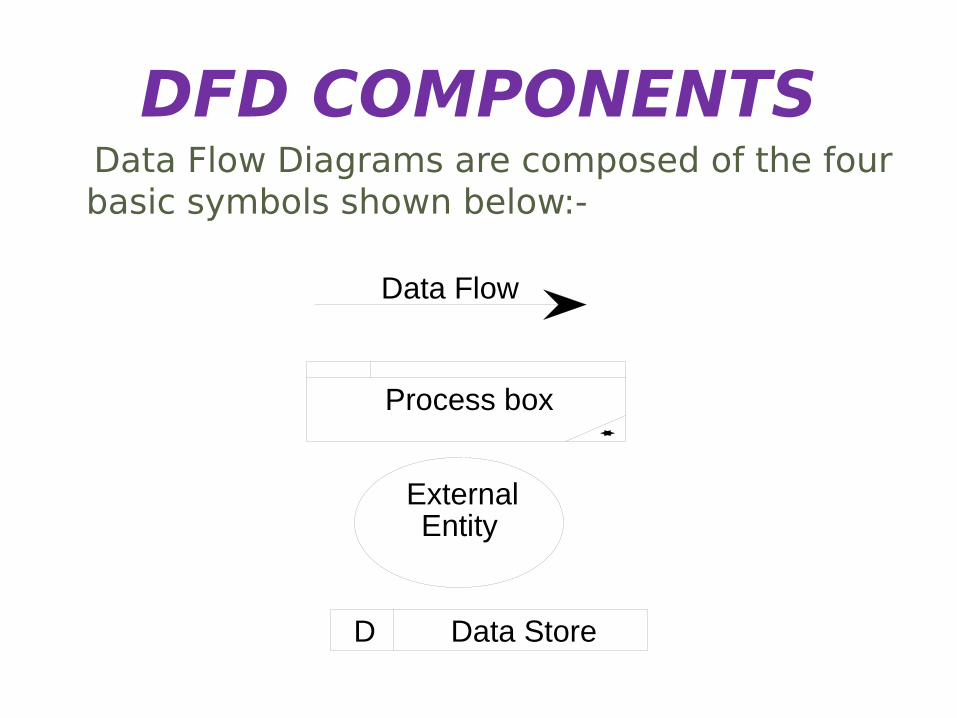
DFD COMPONENTS Data Flow Diagrams are composed of the four
basic symbols shown below:-
Process box
D Data Store
ExternalEntity
Data Flow
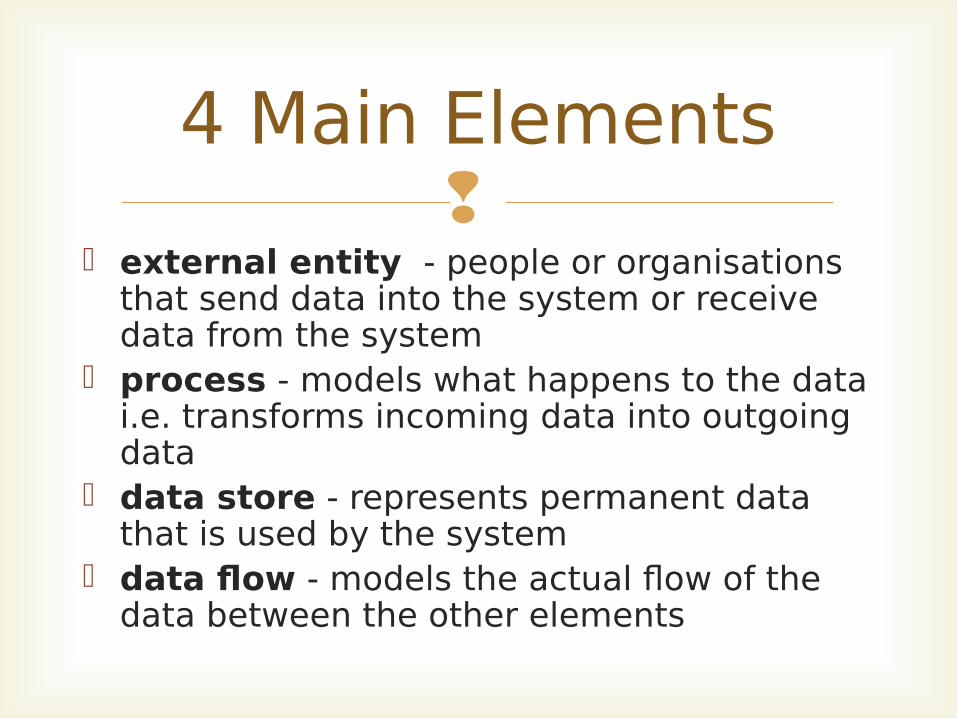
external entity - people or organisations
that send data into the system or receive data from the system
process - models what happens to the data i.e. transforms incoming data into outgoing data
data store - represents permanent data that is used by the system
data flow - models the actual flow of the data between the other elements
4 Main Elements
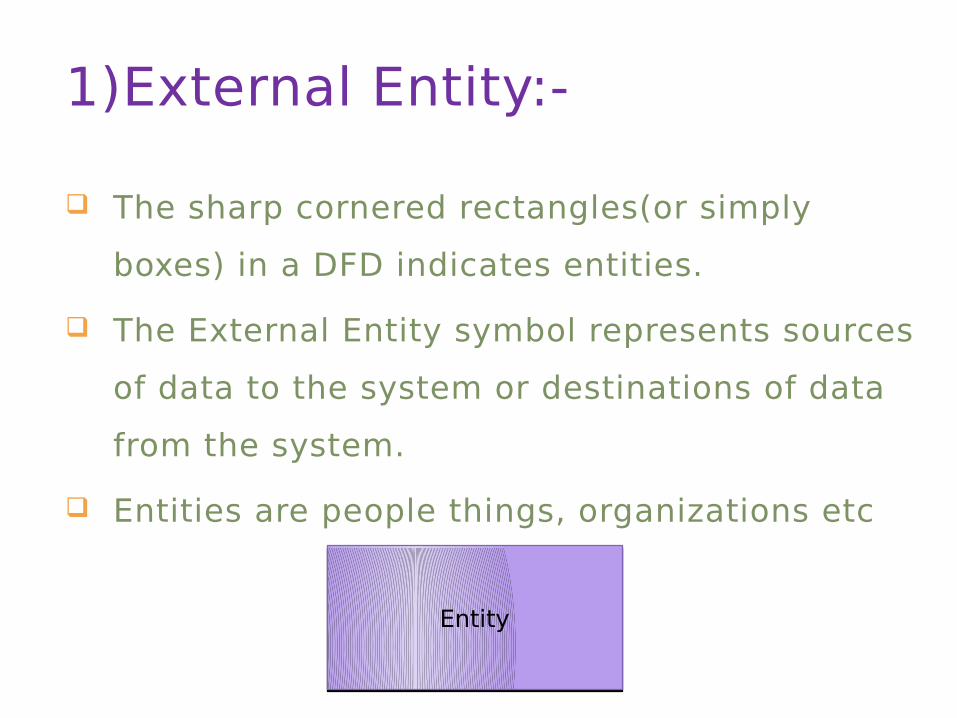
1)External Entity:-
The sharp cornered rectangles(or simply
boxes) in a DFD indicates entities.
The External Entity symbol represents sources
of data to the system or destinations of data
from the system.
Entities are people things, organizations etc
EntityEntity
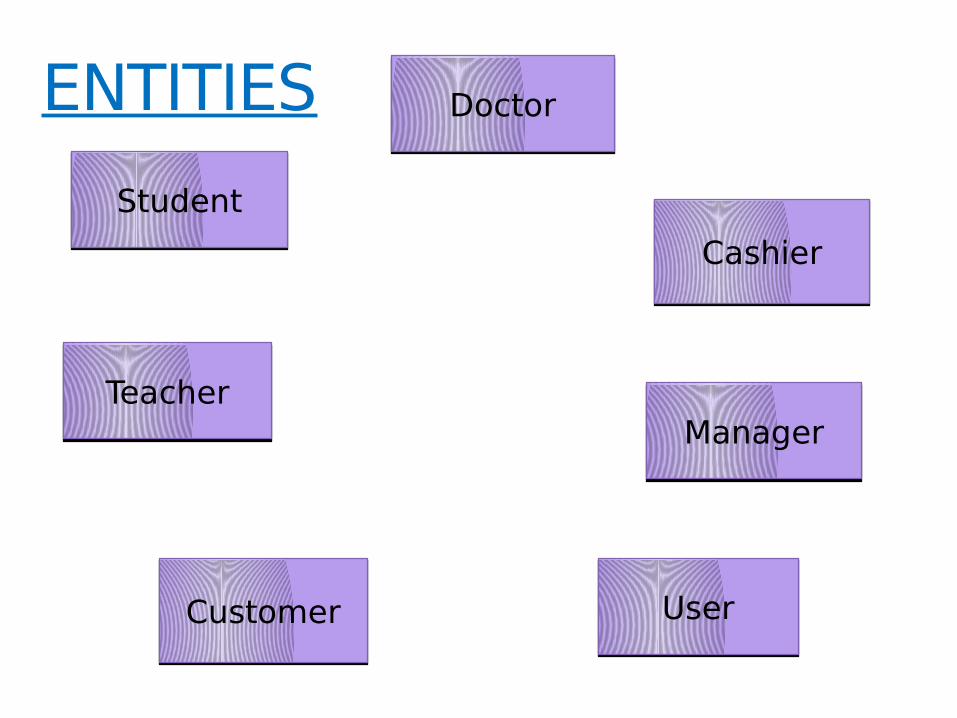
ENTITIES
StudentStudent
DoctorDoctor
TeacherTeacherManagerManager
CashierCashier
UserUserCustomerCustomer
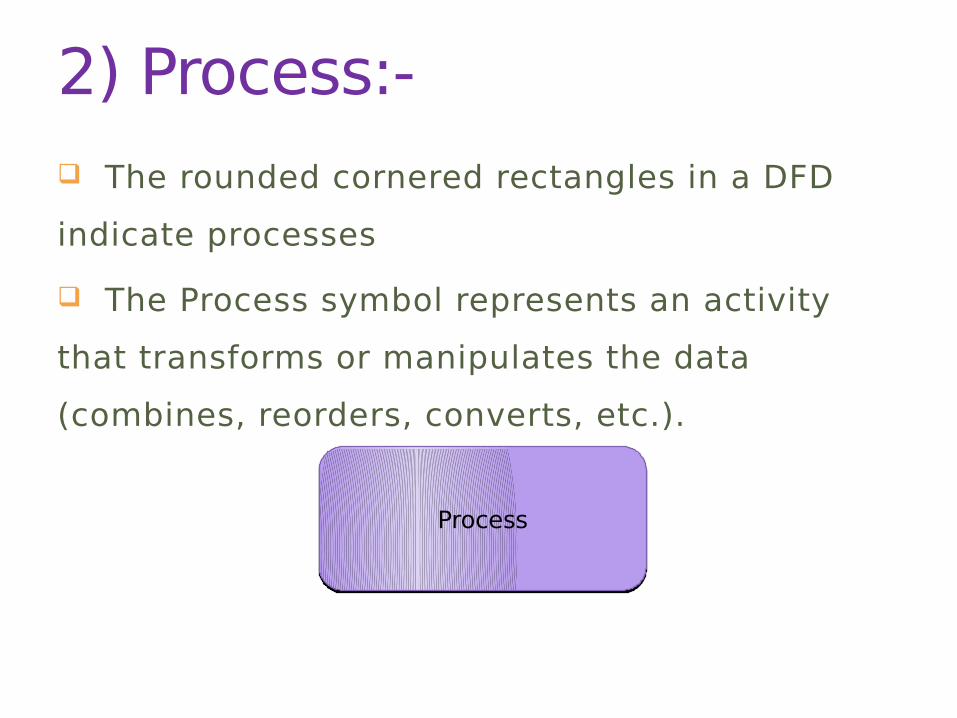
The rounded cornered rectangles in a DFD
indicate processes
The Process symbol represents an activity
that transforms or manipulates the data
(combines, reorders, converts, etc.).
2) Process:-
ProcessProcess
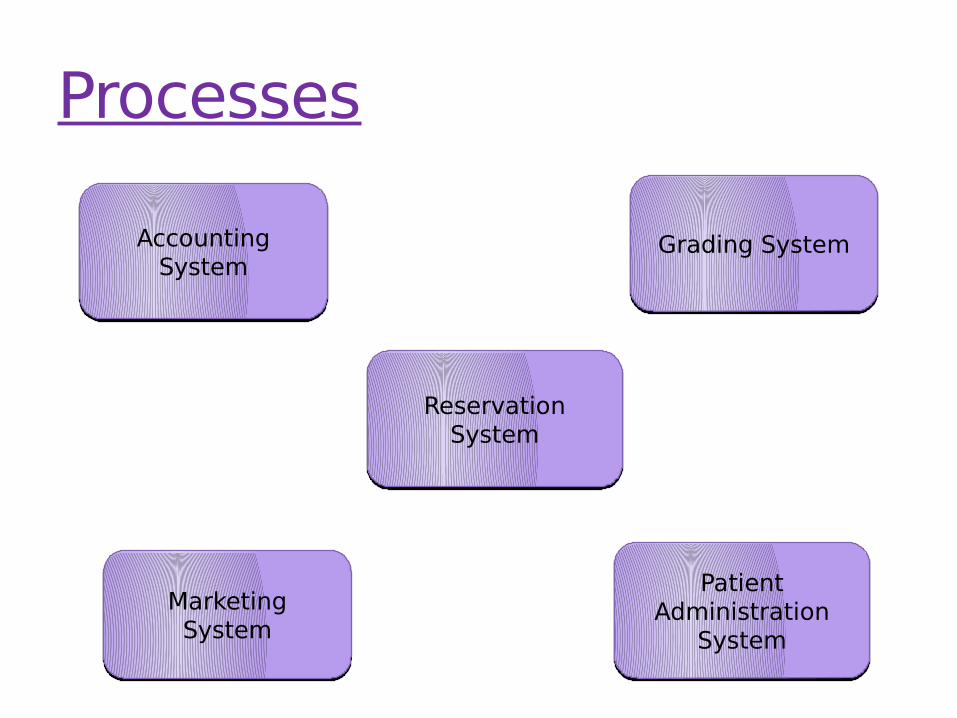
Processes
Accounting System
Accounting System
Grading SystemGrading System
Reservation System
Reservation System
Patient Administration
System
Patient Administration
System
Marketing System
Marketing System
3) Data Store:-
Opened sided rectangles in DFD indicates data store.
The Data Store symbol represents data that is not moving (delayed data at rest).
A Data Store is a repository of data.
Data can be written into the data store. This is depicted by an incoming arrow.
Two data stores cannot be connected by a data flow.
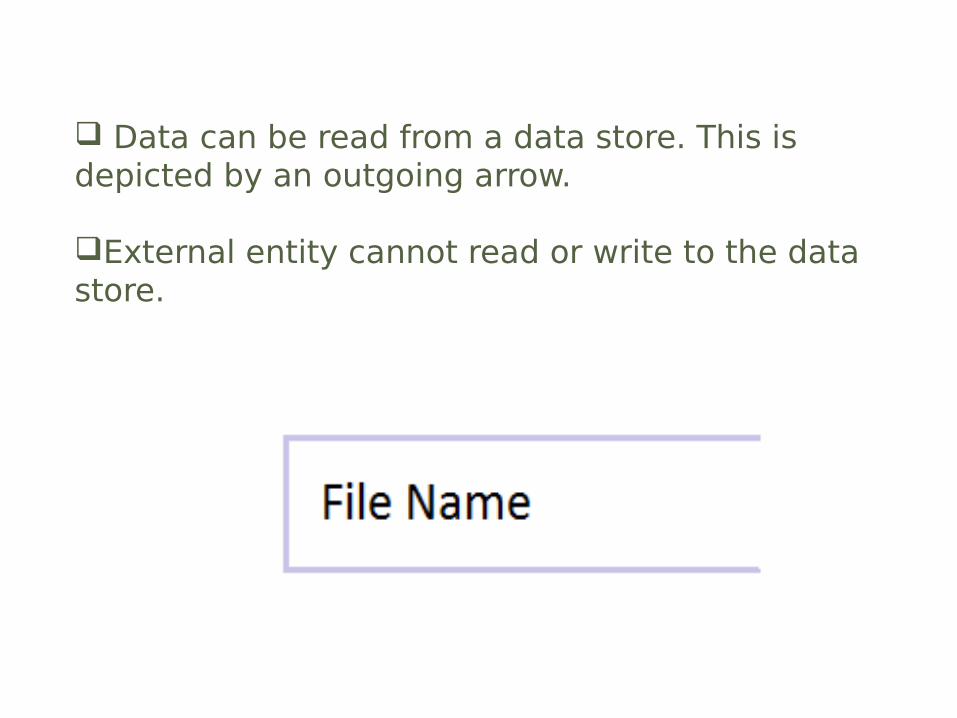
Data can be read from a data store. This is depicted by an outgoing arrow.
External entity cannot read or write to the data store.
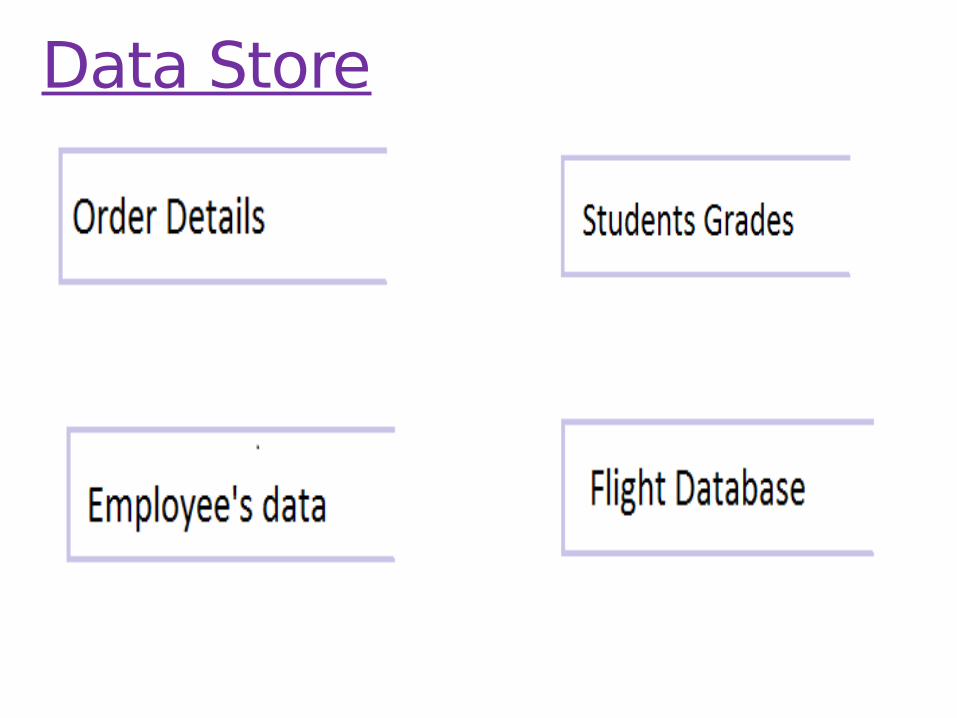
Data Store
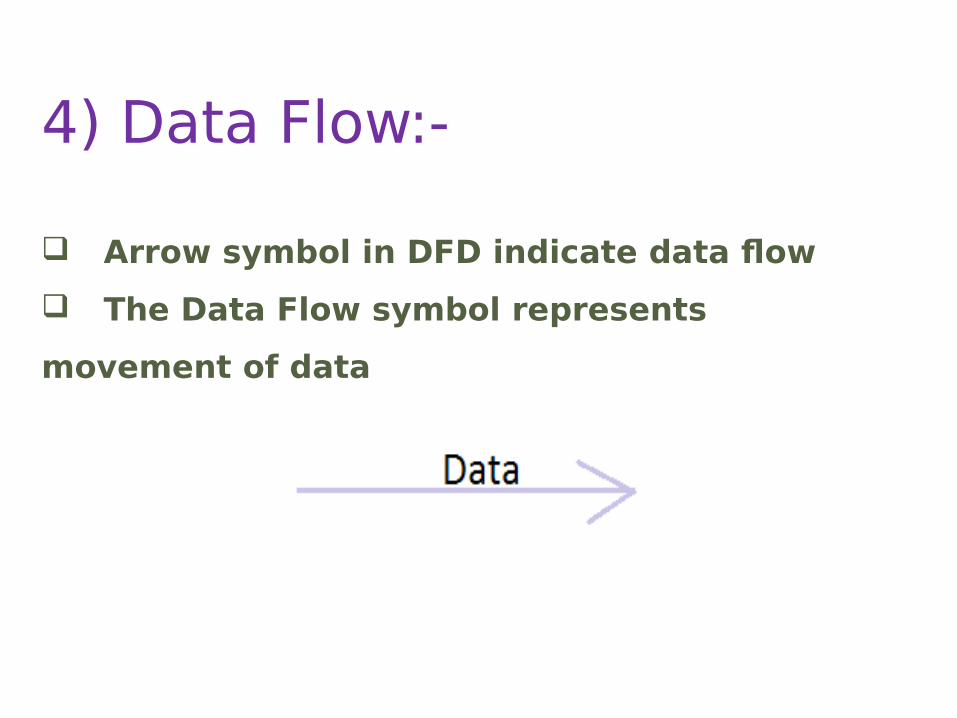
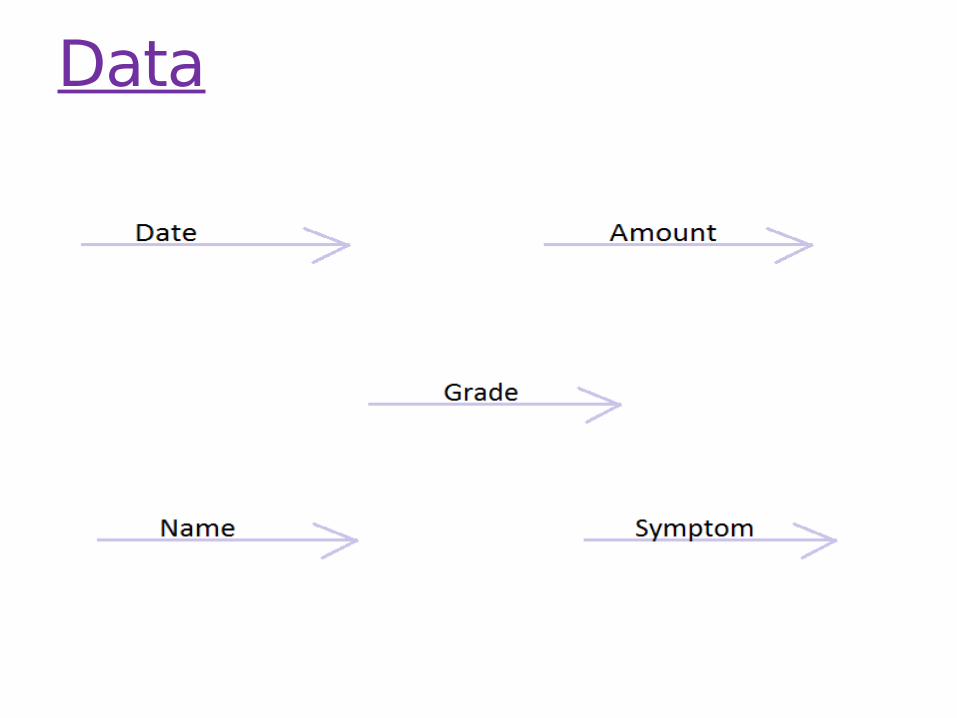
4) Data Flow:-
Arrow symbol in DFD indicate data flow
The Data Flow symbol represents
movement of data
Data
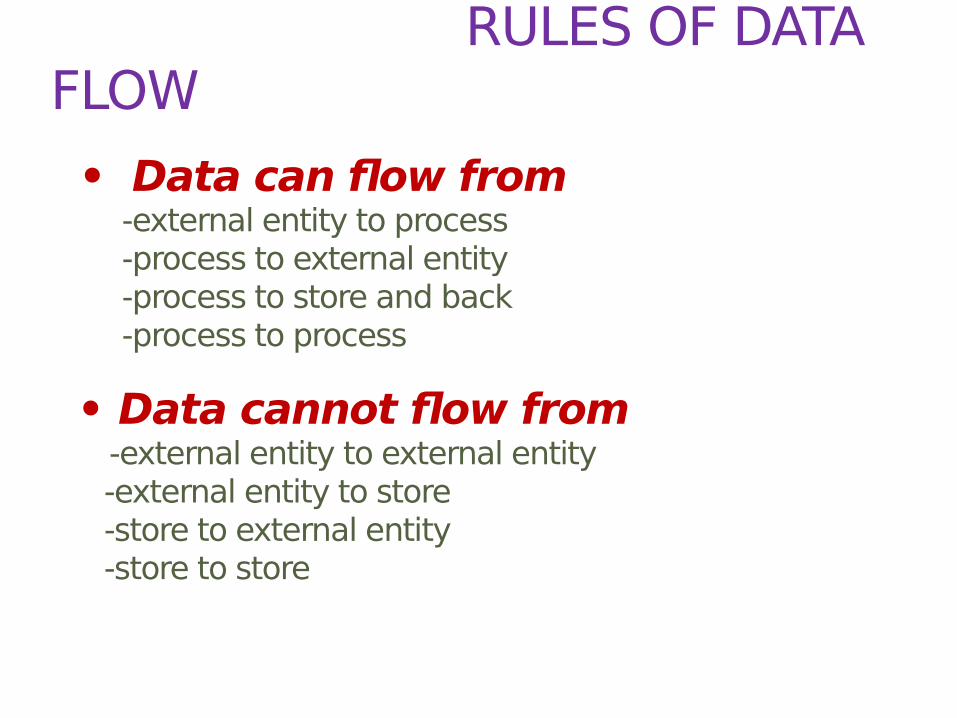
RULES OF DATA FLOW
• Data can flow from -external entity to process -process to external entity -process to store and back -process to process
• Data cannot flow from -external entity to external entity -external entity to store -store to external entity -store to store
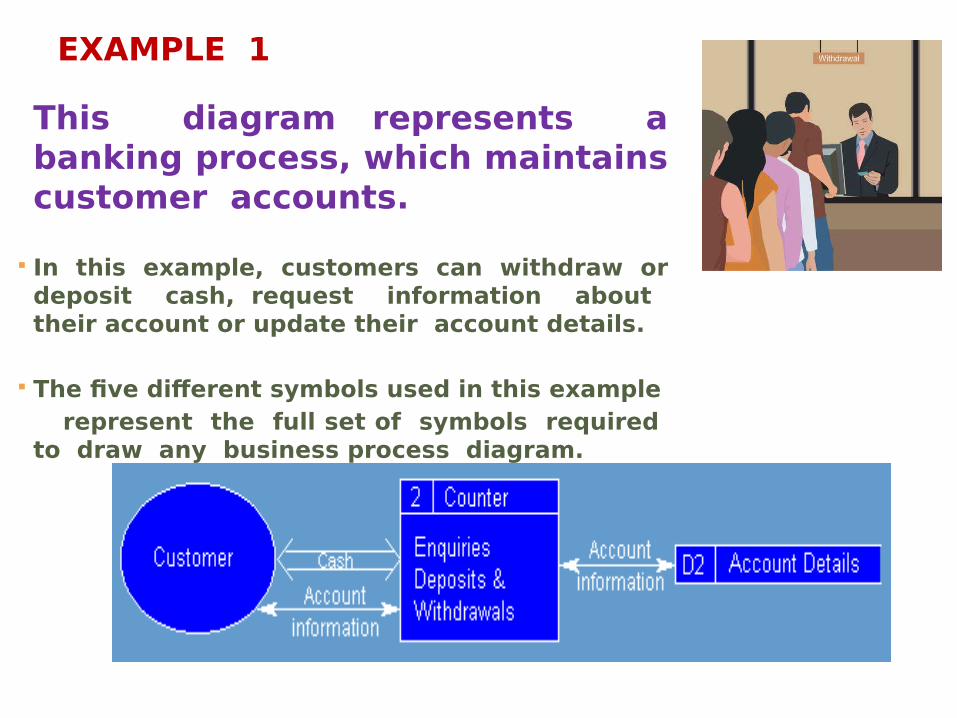
This diagram represents a banking process, which maintains customer accounts.
In this example, customers can withdraw or deposit cash, request information about their account or update their account details.
The five different symbols used in this example represent the full set of symbols required to draw any business process diagram.
EXAMPLE 1
Level 0 DFD• The level 0 DFD (also known as the
context level DFD ) is the simplest DFD.• The outermost level (Level 0) is
concerned with how the system interacts with the outside world.
• This level basically represents the input and output of the entire system.
LEVELS OF DFD LEVELS OF DFD
1. Identify your main system
2. Identify the external people who interact with
the system
3. Decide what data these entities will enter into
the system
4. Determine what these entities expect as
output from the system
How to create Level 0 DFD
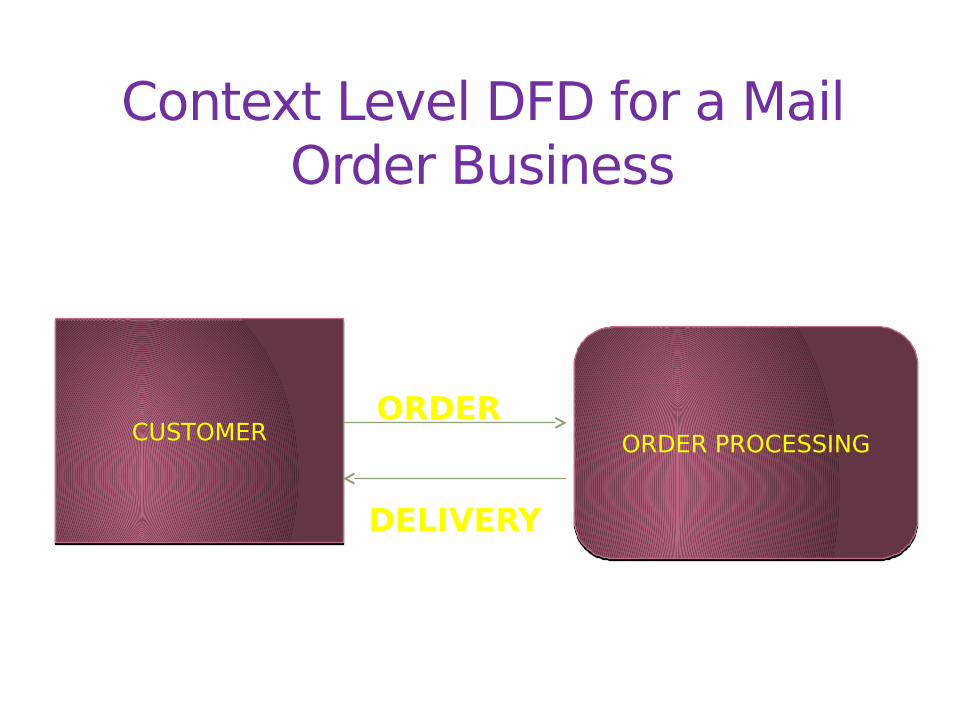
Context Level DFD for a Mail Order Business
ORDER PROCESSINGORDER PROCESSINGCUSTOMERCUSTOMERORDER
DELIVERY
The basic module of the system are
represented in this phase and how data
moves through different module is shown.
The level 1 DFD provides a high –level view
of the system that identifies the major
processes and data stores.
Level 1 DFD
1. Focus on your process and break it into 2
or more sub-processes
2. Identify what data flows between these
processes and between the entities
3. Identify What permanent data files are
used in this system
4. Note that no new entities can be
introduced
How to create Level 1 DFD
Delivery
Credit
Status
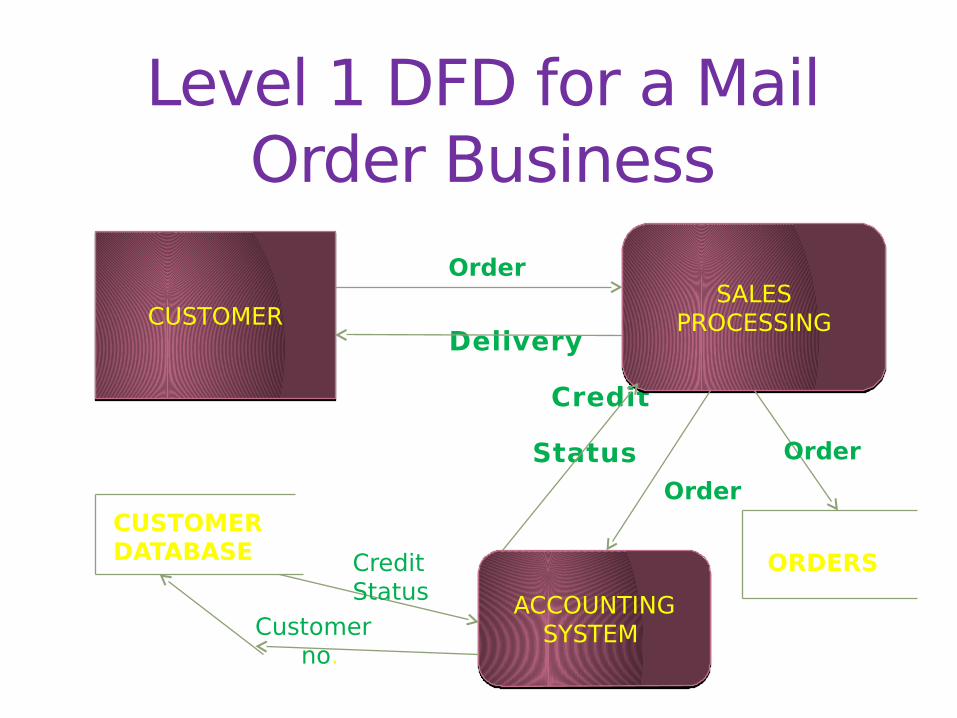
Level 1 DFD for a Mail Order Business
CUSTOMERCUSTOMERSALES
PROCESSINGSALES
PROCESSING
ACCOUNTING SYSTEM
ACCOUNTING SYSTEM
CUSTOMER DATABASE
Customer no.
Credit Status
ORDERS
Order
Order
Order
Each process from level 1 is exploded even
more into sub processes. This decomposition
continues for each level.
The number of levels possible depends on the
complexity of the system
2-Level DFD and other level of DFD
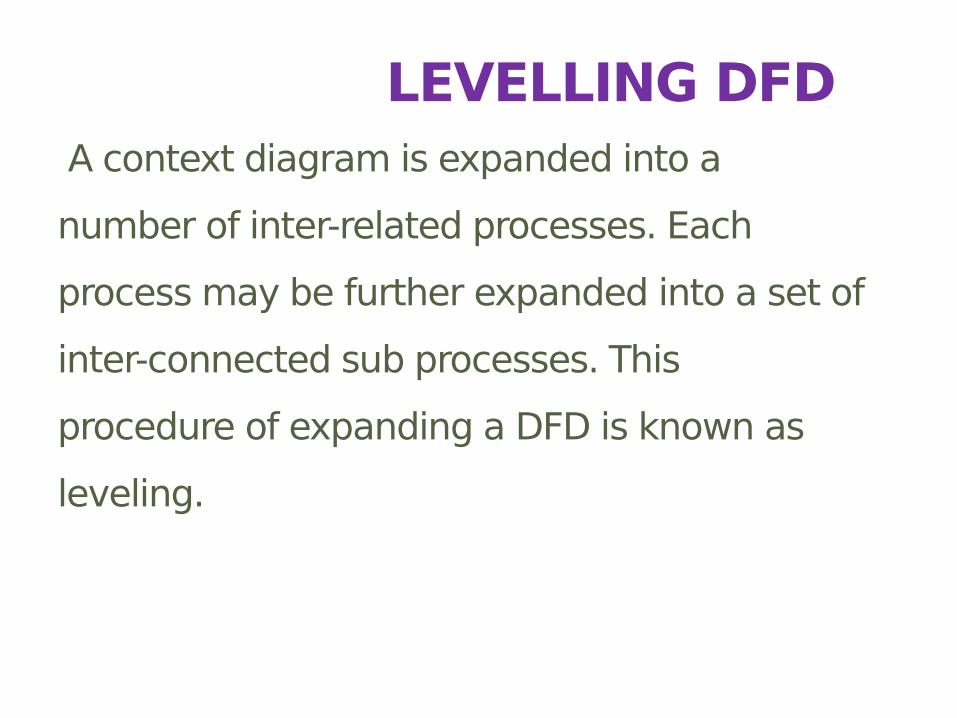
LEVELLING DFD A context diagram is expanded into a
number of inter-related processes. Each
process may be further expanded into a set of
inter-connected sub processes. This
procedure of expanding a DFD is known as
leveling.
1. With a dataflow diagram, users are able to visualize how the system will operate, what the system will accomplish, and how the system will be implemented
2. Data flow diagrams can be used to provide the end user with physical idea of how the data they input ultimately has an effect upon the structure of the whole system.
3. The old system’s dataflow diagrams can also be drawn up and compared with the new system’s dataflow diagrams to draw comparisons in order to help implement a more efficient system.
The value of a DFD
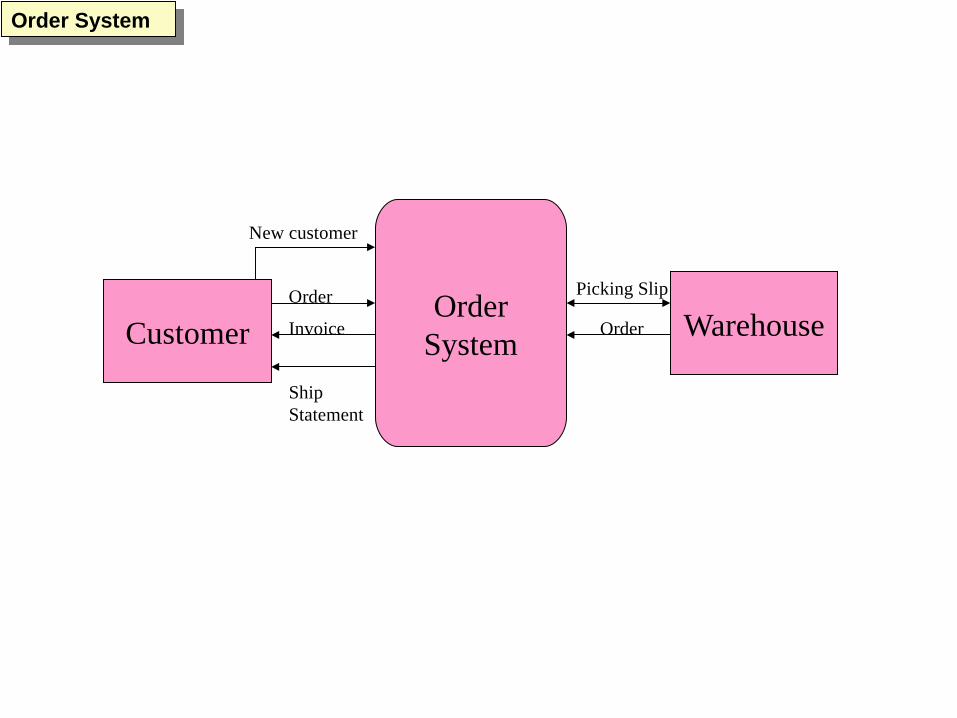
Order SystemOrder System
OrderSystemCustomer Warehouse
Order
Invoice
New customer
Picking Slip
Order
Ship Statement
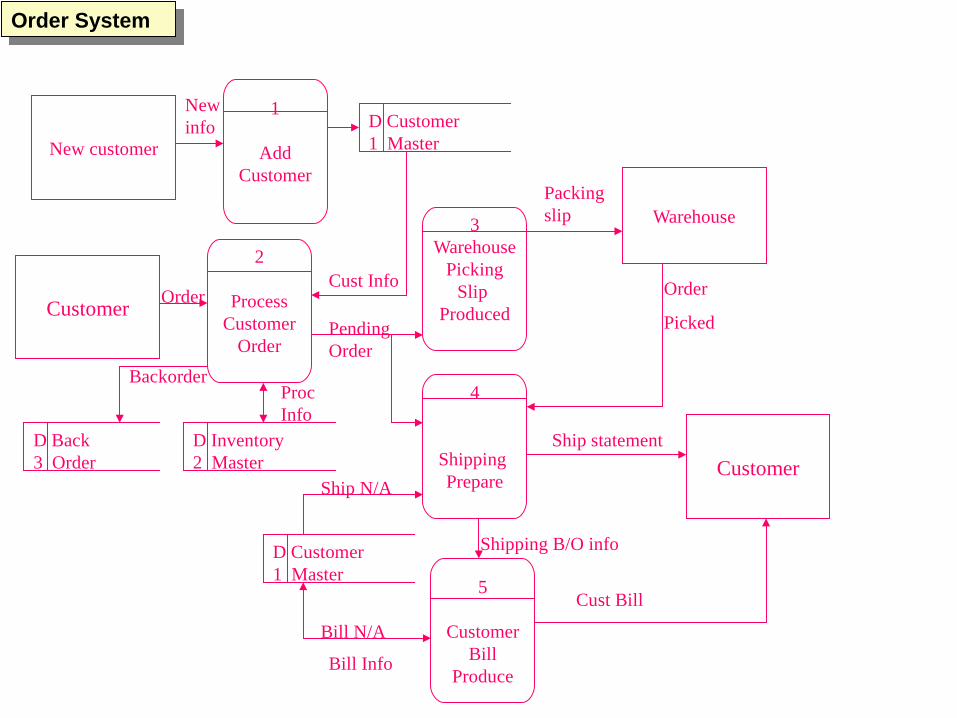
New customer
Order SystemOrder System
1
AddCustomer
New info D Customer
1 Master
Customer
2
ProcessCustomer
Order
OrderCust Info
D Back 3 Order
D Inventory 2 Master
BackorderProc Info
3Warehouse Picking
Slip Produced
Pending Order
Packing slip Warehouse
4
Shipping Prepare
D Customer 1 Master
Ship N/A
5
CustomerBill
Produce
Bill N/A
Bill Info
Shipping B/O info
Order
Picked
CustomerShip statement
Cust Bill
Customer
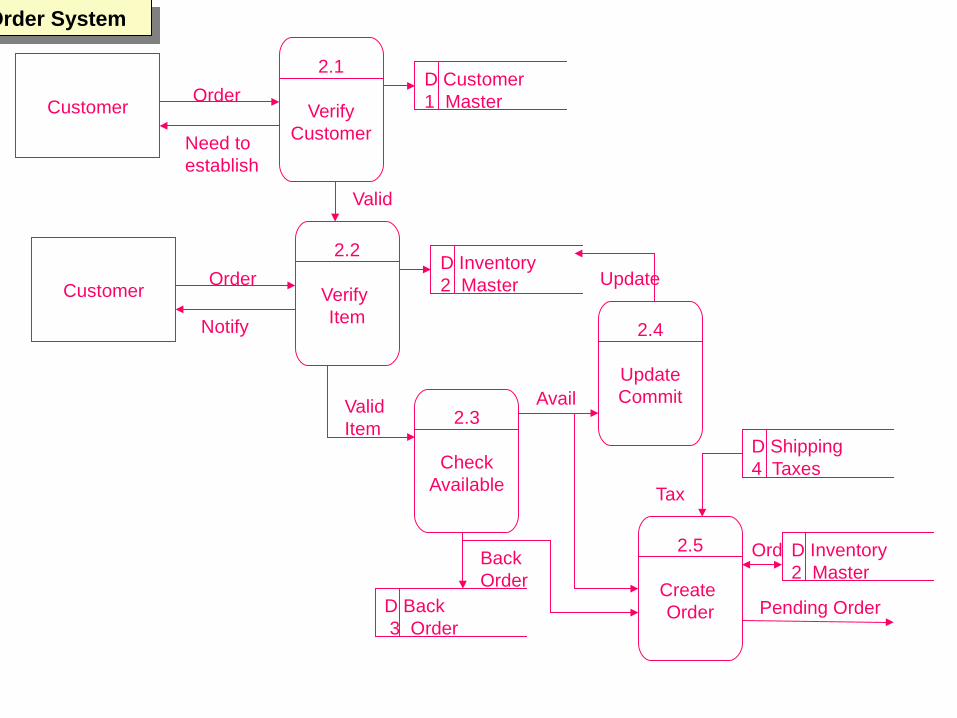
2.1
VerifyCustomer
OrderD Customer 1 Master
Need to establish
Customer
2.2
Verify Item
OrderD Inventory 2 Master
Notify
Valid
2.3
CheckAvailable
2.4
UpdateCommit
2.5
Create Order
D Inventory 2 Master
D Shipping 4 Taxes
D Back 3 Order
Valid Item
Order SystemOrder System
Back Order
Avail
Update
Tax
Ord
Pending Order

Questions ?

Your Assignment
http://en.wikipedia.org/wiki/Physical_Data_Flow
http://www.visual-paradigm.com/product/bpva/tutorials/dfd.jsphttp://www.civil.utm.my/staff/file/141/file/CIMLectureNotes2011.pdfhttp://spot.colorado.edu/~kozar/DFDtechnique.html
http://www.fbk.eur.nl/PRJ/MEETEYEES/dfd.htm
Http://ratandon.mysite.syr.edu/cis453/notes/DFD_over_Flowcharts.pdfhttp://www.slideshare.net/mohit4192/dfd-examples
http://ecourses.vtu.ac.in/nptel/courses/Webcoursecontents/IIScBANG/System%20Analysis%20and%20Design/pdf/module5.pdf
References


