

Buenos Aires – 5 to 9 September, 2016 Acoustics for the 21st Century…
PROCEEDINGS of the 22nd International Congress on Acoustics
Materials for Noise Control: Paper ICA2016-490
Comparison of the acoustic behaviour of porous materials in compressed and uncompressed
conditions
Umberto Berardi (a), Ramani Ramakrishnan (b)
(a) Department of Architectural Science, Ryerson University, Toronto (Canada), [email protected] (b) Department of Architectural Science, Ryerson University, Toronto (Canada), [email protected]
Abstract
Conventional methods to evaluate the absorption coefficient of materials use either a large
reverberation room or wave guides such as standing-wave tubes or impedance tubes. These last
methods have recently been extended so that other material properties such as airflow resistivity
can also be evaluated using the same tubes. An advantage of the impedance tubes is that they
can also be used to measure the acoustical and non-acoustical properties when the materials are
under compression. The current study investigates the differences between two-microphone
systems and three-microphone systems, and assess both the absorption coefficient and the flow
resistivity of porous materials such as rock wool and fibreglass in both compressed and
uncompressed conditions. Finally, the results of the study are discussed.
Keywords: sound absorption, flow resistivity, porous materials, impedance tube, compressed materials.
2
22nd International Congress on Acoustics, ICA 2016 Buenos Aires – 5 to 9 September, 2016
Acoustics for the 21st Century…
Comparison of the acoustic behaviour of porous materials in compressed and uncompressed
conditions
1 Introduction
Porous fibrous materials such as rock wool and fiberglass are usually used for thermal
insulation purposes as well as passive sound absorbers in wall sections or in HVAC systems
ducts [1].The porous materials, in situ, may be compressed, either due to high loads or while
trying to fit into obstructions or while wrapping HVAC pipes. And hence, many construction
guidelines such as that by Oak Ridge National Laboratory and the US Department of Energy,
discuss the problems of insulation layers being compressed [2,3]. Similar to the R-value
reduction, the sound absorption coefficient of the porous material is also supposed to
decrease under compression. However, the effect of compression on the acoustical
properties of porous materials has not been fully investigated, and only a few studies are
available [4-6].
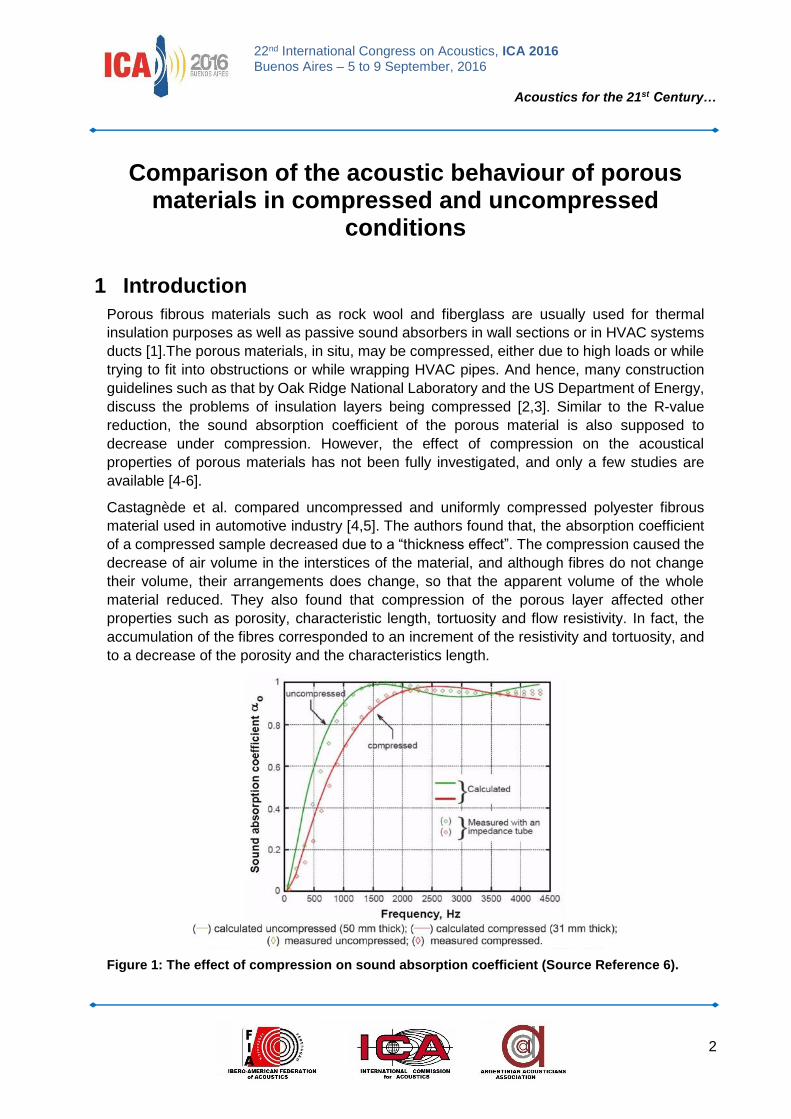
Castagnède et al. compared uncompressed and uniformly compressed polyester fibrous
material used in automotive industry [4,5]. The authors found that, the absorption coefficient
of a compressed sample decreased due to a “thickness effect”. The compression caused the
decrease of air volume in the interstices of the material, and although fibres do not change
their volume, their arrangements does change, so that the apparent volume of the whole
material reduced. They also found that compression of the porous layer affected other
properties such as porosity, characteristic length, tortuosity and flow resistivity. In fact, the
accumulation of the fibres corresponded to an increment of the resistivity and tortuosity, and
to a decrease of the porosity and the characteristics length.
Figure 1: The effect of compression on sound absorption coefficient (Source Reference 6).

3
22nd International Congress on Acoustics, ICA 2016 Buenos Aires – 5 to 9 September, 2016
Acoustics for the 21st Century…
Iannace et al. showed that the non-uniform compression of a 50 mm thick polyester fiber to a
31 mm sample resulted in a clear decrease in the absorption coefficient below 1500 Hz as
shown in Figure 1 [6].
The aim of the current paper is to discuss the effects of compression on the absorption
coefficient and flow resistivity of two porous fibrous material, fiberglass and rock wool. The
details are described below.
2 Methodology
Sound absorption coefficient at normal incidence was measured following the procedure
described in ISO Standard 10534-2 [8]. This method allows the measurement of acoustic
parameters by using small samples that are easy to assemble and disassemble in Kundt's
tubes. Two properties, the absorption coefficient and the airflow resistivity, were evaluated in
this study. The flow resistivity is the pressure drop across a sample when it is exposed to a
steady laminar airflow, and it can be measured by numerous means [9], among which
researchers have recently proposed the use of modified impedance tubes.
The impedance tube is an easy and fast way to measure direct (i.e., sound absorption
coefficient, sound transmission loss, effective density and effective bulk modulus) and indirect
(i.e., static airflow resistivity, tortuosity, viscous and thermal characteristic lengths) acoustic
properties of a material [10-12]. On the other hand, some of the limits of using the impedance
tube for acoustic measurements are sample cutting, positioning, and fitting inside the tube. In
addition, the method may be affected by sample resonance, and low or high frequency
variability. As said, the impedance tubes can also be used to find non-acoustic parameters.
Doutres et al. outlined a straightforward application to determine the non-acoustic properties
of a sound absorbing porous material using an indirect method based on a three-microphone
impedance tube, as shown in Fig.2a [13]. Alternatively, Tao et al. proposed a method for the
evaluation of the static air-flow resistivity without modifying the tube or changing the sensor
location but positioning the sample at a distance from the rigid end as shown in Fig.2b [14].
a)
b)
Figure 2: Sketches of two impedance tubes for the determination of the airflow resistivity.
4
22nd International Congress on Acoustics, ICA 2016 Buenos Aires – 5 to 9 September, 2016
Acoustics for the 21st Century…
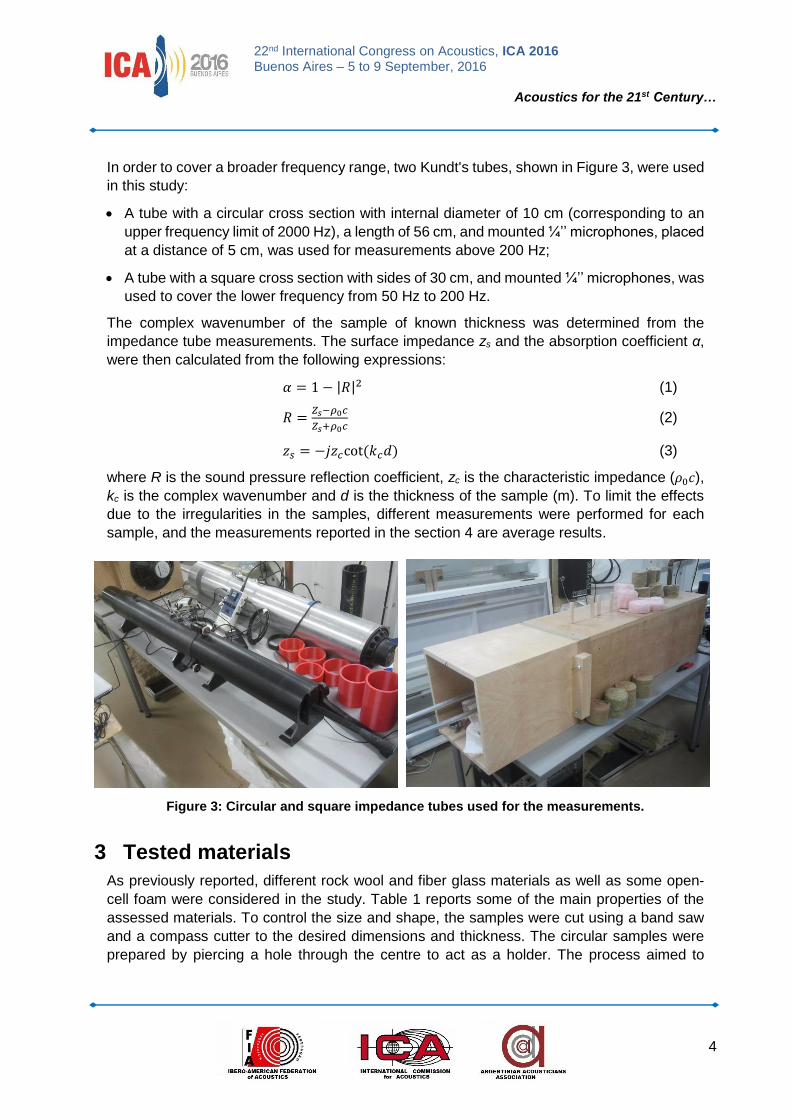
In order to cover a broader frequency range, two Kundt's tubes, shown in Figure 3, were used
in this study:
A tube with a circular cross section with internal diameter of 10 cm (corresponding to an
upper frequency limit of 2000 Hz), a length of 56 cm, and mounted ¼’’ microphones, placed
at a distance of 5 cm, was used for measurements above 200 Hz;
A tube with a square cross section with sides of 30 cm, and mounted ¼’’ microphones, was
used to cover the lower frequency from 50 Hz to 200 Hz.
The complex wavenumber of the sample of known thickness was determined from the
impedance tube measurements. The surface impedance zs and the absorption coefficient α,
were then calculated from the following expressions:
𝛼 = 1 − |𝑅|2 (1)
𝑅 =𝑍𝑠−𝜌0𝑐
𝑍𝑠+𝜌0𝑐 (2)
𝑧𝑠 = −𝑗𝑧𝑐cot(𝑘𝑐𝑑) (3)
where R is the sound pressure reflection coefficient, zc is the characteristic impedance (𝜌0𝑐),
kc is the complex wavenumber and d is the thickness of the sample (m). To limit the effects
due to the irregularities in the samples, different measurements were performed for each
sample, and the measurements reported in the section 4 are average results.
Figure 3: Circular and square impedance tubes used for the measurements.
3 Tested materials
As previously reported, different rock wool and fiber glass materials as well as some open-
cell foam were considered in the study. Table 1 reports some of the main properties of the
assessed materials. To control the size and shape, the samples were cut using a band saw
and a compass cutter to the desired dimensions and thickness. The circular samples were
prepared by piercing a hole through the centre to act as a holder. The process aimed to
5
22nd International Congress on Acoustics, ICA 2016 Buenos Aires – 5 to 9 September, 2016
Acoustics for the 21st Century…
maintain uniform shape between all the samples.
Table 1: List of porous materials investigated in this paper.
Material Sample Density, kg/m3 Compression rate Fiberglass Duct liner 10 1.60
Rockwool AFB DD2 R24
45 65-100
32
1.33 1.33
1.33 and 1.22
Castagnède et al. showed that the flow resistivity of a porous material is proportional to the
1D compression rate [4]. This can be defined as the ratio between the original thickness, and
the compressed thickness. According to Castagnède et al. [4], the compression rate can
hence be used to calculate the compressed flow resistivity, as a product of the uncompressed
air flow resistivity for the compression rate.
The compression for the larger square samples was accomplished by pushing the rigid end
plunger into the sample holder. For the denser samples such as DD2 and AFB, blocks of
bricks were built up at the back of the plunger to help maintain the hold of the compressive
state. Similarly, the compression of the circular samples was achieved by wrapping the
samples using nylon stockings. The stockings were knotted at the end to keep the enclosed
samples compressed. Several variations of the compression were tested and compared to
find the best orientation. The nylon was believed to act as an acoustically transparent
membrane without causing significant resonance effects. However, uniaxial compression may
not have been properly achieved due to the difficulty of uniformly compressing the samples;
in fact, the action of knotting the end of the stocking resulted inadvertently in some bi-axial
compression.
Literature has often shown that the cutting process likely causes slight deformation in the
sample that directly affects the leakages [15,16]. As the sample is compressed, additional
edge constraint was supposed to occur with effects on the results.
4 Results
The comparison between two-microphone method and the three-microphone method is
presented first. Since the two-microphone method evaluates only the static air-flow resistivity,
Table 2 highlights only the resistivity values for the rockwool DD2 sample as well as for two
different foams of different density.
Table 2: Airflow Resistivity of porous materials.
Material Sample Condition
Two mic
method, MKS
Rayls/m
Three mic method,
MKS Rayls/m
Rockwool DD2 Uncompressed 12,000 18000
Foam Foam 2 Uncompressed 3,500 4,000
Foam 3 Uncompressed 4,000 4,500
It can been seen that the three microphone method evaluated a higher value of the static air-
flow resistivity for rockwool. However, the two methods proposed in [13] and [14] provided
6
22nd International Congress on Acoustics, ICA 2016 Buenos Aires – 5 to 9 September, 2016
Acoustics for the 21st Century…
comparable values for the open-cell foam material used for the investigation. It must be
pointed, however, that the fibrous materials did not fit tightly in the impedance tubes used for
the study.
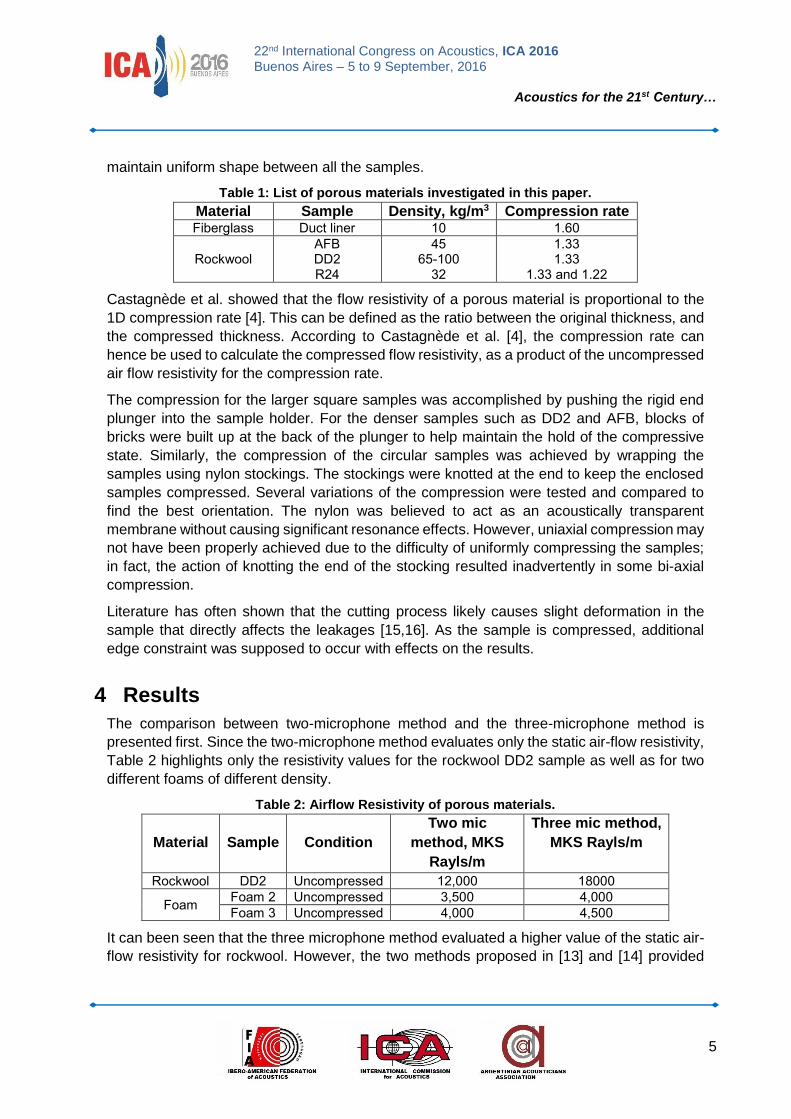
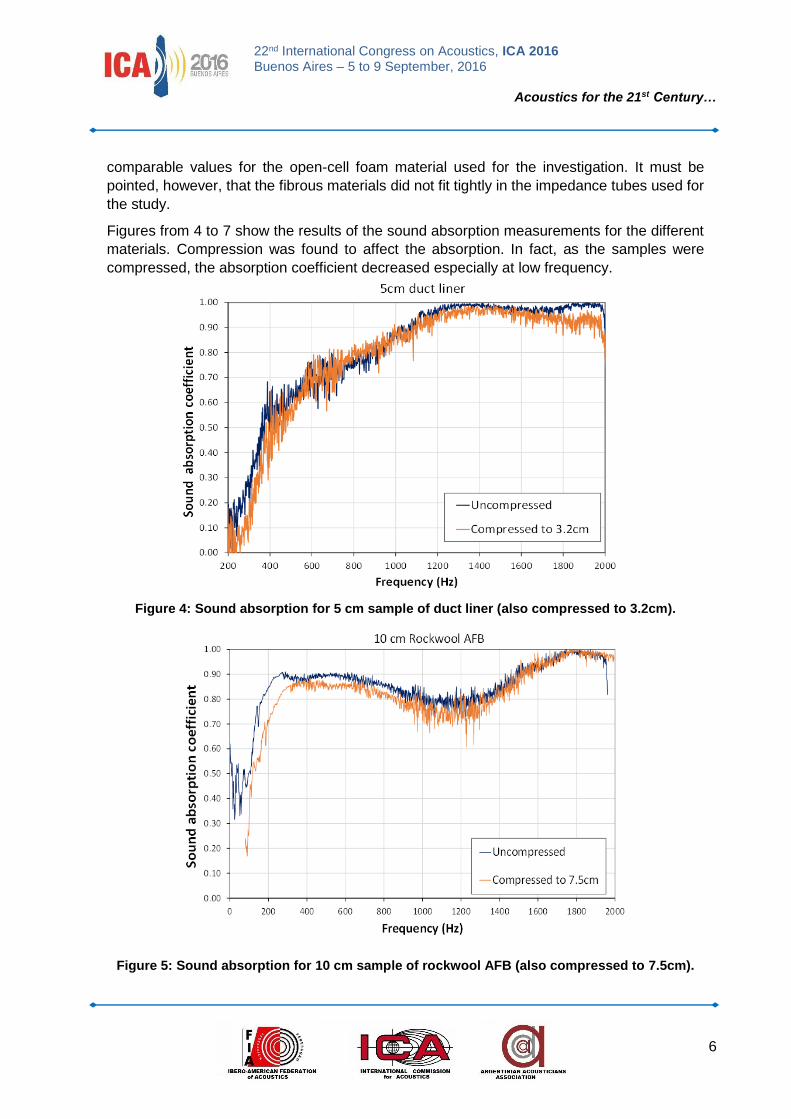
Figures from 4 to 7 show the results of the sound absorption measurements for the different
materials. Compression was found to affect the absorption. In fact, as the samples were
compressed, the absorption coefficient decreased especially at low frequency.
Figure 4: Sound absorption for 5 cm sample of duct liner (also compressed to 3.2cm).
Figure 5: Sound absorption for 10 cm sample of rockwool AFB (also compressed to 7.5cm).

7
22nd International Congress on Acoustics, ICA 2016 Buenos Aires – 5 to 9 September, 2016
Acoustics for the 21st Century…
Figure 6: Sound absorption for 10cm sample of rockwool DD2 (also compressed to 7.5cm).
Figure 7: Sound absorption for 10cm sample of rockwool R24 (also compressed to 7.5cm).

8
22nd International Congress on Acoustics, ICA 2016 Buenos Aires – 5 to 9 September, 2016
Acoustics for the 21st Century…
Figure 8: Sound absorption for 14cm sample of rockwool R24 (also compressed to 10cm).
Table 3: Sound absorption results in one third octave bands.
Freque-ncy,
Hz
Rock wool AFB
Rock wool R24 (10→37.5)
Rock wool R24 (14→10)
Rock wool DD2
Foam Duct liner
Uncompressed
Compressed
Uncompressed
Compressed
Uncompressed
Compressed
Uncompressed
Compressed
Uncompressed
Compressed
200
250
315
400
500
630
800
1000
1250
1600
2000
0.78
0.86
0.89
0.88
0.89
0.89
0.86
0.81
0.80
0.91
0.94
0.71
0.80
0.85
0.86
0.85
0.85
0.82
0.76
0.77
0.92
0.95
0.49
0.71
0.86
0.84
0.85
0.86
0.82
0.76
0.77
0.93
0.94
0.60
0.74
0.87
0.87
0.87
0.88
0.85
0.79
0.75
0.87
0.94
0.86
0.83
0.78
0.75
0.81
0.84
0.83
0.76
0.74
0.88
0.91
0.89
0.98
0.87
0.72
0.73
0.80
0.85
0.83
0.76
0.78
0.87
0.46
0.50
0.65
0.83
0.77
0.78
0.77
0.71
0.71
0.90
0.94
0.41
0.43
0.75
0.76
0.76
0.75
0.75
0.70
0.69
0.86
0.95
0.08
0.18
0.33
0.54
0.62
0.70
0.75
0.87
0.98
0.97
0.95
0.01
0.06
0.21
0.45
0.58
0.71
0.78
0.86
0.95
0.95
0.89
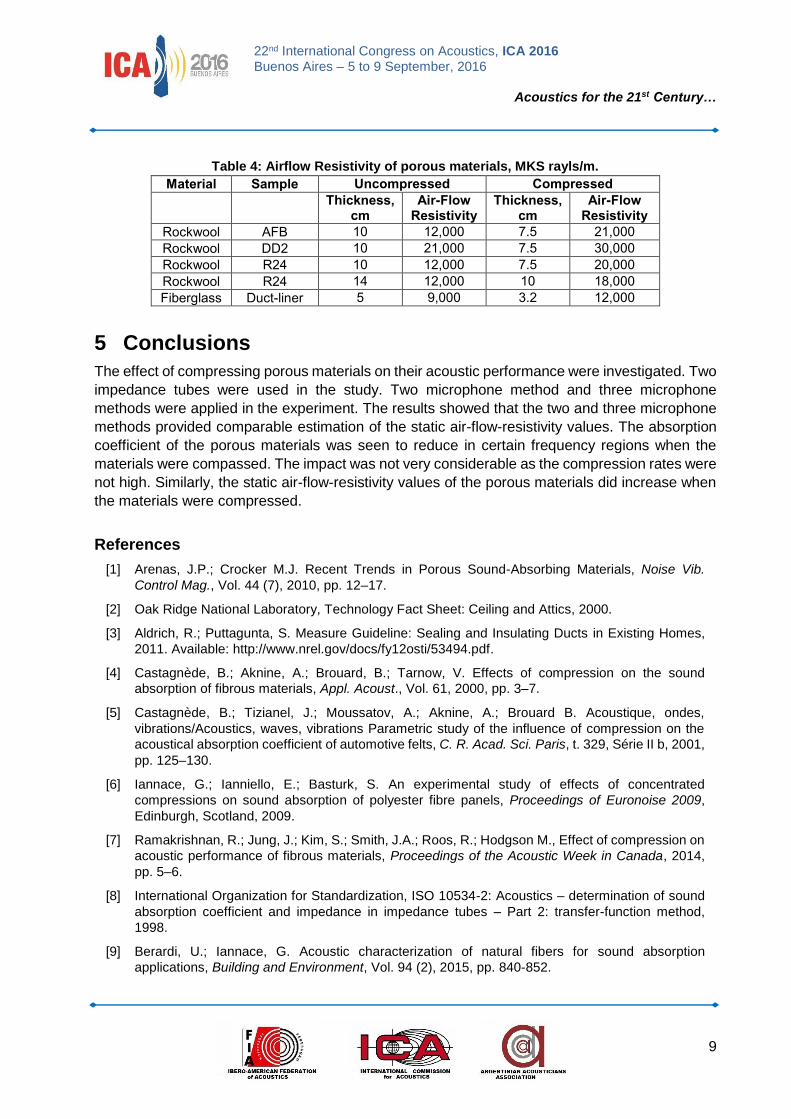
In order to compare the experimental results, an estimate of the flow resistivity of compressed
and uncompressed material was compiled. It is expected that compression will result in a
smaller and denser sample that, therefore, would experience a higher flow resistivity [9]. As
expected, the results in Table 4 showed that the flow resistivity increased when the materials
were compressed.
9
22nd International Congress on Acoustics, ICA 2016 Buenos Aires – 5 to 9 September, 2016
Acoustics for the 21st Century…
Table 4: Airflow Resistivity of porous materials, MKS rayls/m.
Material Sample Uncompressed Compressed
Thickness,
cm Air-Flow
Resistivity Thickness,
cm Air-Flow
Resistivity
Rockwool AFB 10 12,000 7.5 21,000
Rockwool DD2 10 21,000 7.5 30,000
Rockwool R24 10 12,000 7.5 20,000
Rockwool R24 14 12,000 10 18,000
Fiberglass Duct-liner 5 9,000 3.2 12,000
5 Conclusions
The effect of compressing porous materials on their acoustic performance were investigated. Two
impedance tubes were used in the study. Two microphone method and three microphone
methods were applied in the experiment. The results showed that the two and three microphone
methods provided comparable estimation of the static air-flow-resistivity values. The absorption
coefficient of the porous materials was seen to reduce in certain frequency regions when the
materials were compassed. The impact was not very considerable as the compression rates were
not high. Similarly, the static air-flow-resistivity values of the porous materials did increase when
the materials were compressed.
References
[1] Arenas, J.P.; Crocker M.J. Recent Trends in Porous Sound-Absorbing Materials, Noise Vib.
Control Mag., Vol. 44 (7), 2010, pp. 12–17.
[2] Oak Ridge National Laboratory, Technology Fact Sheet: Ceiling and Attics, 2000.
[3] Aldrich, R.; Puttagunta, S. Measure Guideline: Sealing and Insulating Ducts in Existing Homes,
2011. Available: http://www.nrel.gov/docs/fy12osti/53494.pdf.
[4] Castagnède, B.; Aknine, A.; Brouard, B.; Tarnow, V. Effects of compression on the sound
absorption of fibrous materials, Appl. Acoust., Vol. 61, 2000, pp. 3–7.
[5] Castagnède, B.; Tizianel, J.; Moussatov, A.; Aknine, A.; Brouard B. Acoustique, ondes,
vibrations/Acoustics, waves, vibrations Parametric study of the influence of compression on the
acoustical absorption coefficient of automotive felts, C. R. Acad. Sci. Paris, t. 329, Série II b, 2001,
pp. 125–130.
[6] Iannace, G.; Ianniello, E.; Basturk, S. An experimental study of effects of concentrated
compressions on sound absorption of polyester fibre panels, Proceedings of Euronoise 2009,
Edinburgh, Scotland, 2009.
[7] Ramakrishnan, R.; Jung, J.; Kim, S.; Smith, J.A.; Roos, R.; Hodgson M., Effect of compression on
acoustic performance of fibrous materials, Proceedings of the Acoustic Week in Canada, 2014,
pp. 5–6.
[8] International Organization for Standardization, ISO 10534-2: Acoustics – determination of sound
absorption coefficient and impedance in impedance tubes – Part 2: transfer-function method,
1998.
[9] Berardi, U.; Iannace, G. Acoustic characterization of natural fibers for sound absorption
applications, Building and Environment, Vol. 94 (2), 2015, pp. 840-852.

10
22nd International Congress on Acoustics, ICA 2016 Buenos Aires – 5 to 9 September, 2016
Acoustics for the 21st Century…
[10] Wang, C.N.; Kuo, Y.M.; Chen, S.K. Effects of compression on the sound absorption of porous
materials with an elastic frame, Appl. Acoust., Vol. 69, 2008, pp. 31–39.
[11] Seddeq, H. Factors influencing acoustic performance of sound absorptive materials, Aust. J. Basic
Appl. Sci., Vol. 3 (4), 2009, pp. 4610–4617.
[12] Oliva, D.; Hongisto V. Sound absorption of porous materials - Accuracy of prediction methods,
Appl. Acoust., Vol. 74 (12), 2013, pp. 1473–1479.
[13] Doutres, O.; Salissou, Y.; Atalla, N.; R. Panneton. Evaluation of the acoustic and non-acoustic
properties of sound absorbing materials using a three microphone impedance tube, Appl. Acoust.,
Vol. 71 (6), 2010, pp. 506–509.
[14] Tao, J.; Wang, P.; Qiu, X.; Pan, J. Static flow resistivity measurements based on the ISO 10534.2
standard impedance tube, Building and Environment, Vol 94 (2), 2015, pp. 853-858.
[15] Song, B.H.; Bolton, J.S.; Kang, Y.J. Effect of circumferential edge constraint on the acoustical
properties of glass fiber materials, J. Acoust. Soc. Am., Vol. 110 (6), 2001, pp. 2902.
[16] Muhammad, M.; Sa’at, N.; Naim, H.; Isa, M.; Yussof, H.; Yati, M. The Effect of Air Gap Thickness
on Sound Absorption Coefficient of Polyurethane Foam, Def. S. T. Tech. Bull., Vol. 5 (2), 2012,
pp. 176–187.


