
www.solidarity.co.za 0861 25 24 23*
SolidarityResearch Institute
SolidariteitBeweging
Matric Report
Compiled by the Solidarity Research Institute
December 2015
The South African labour market and the prospects for the matriculants of 2015
Table of contents 1. Introduction ................................................................................... 3
2. The South African labour market ................................................ 4
2.1 The labour market – an overview ............................................................... 4
Graph 2.1.1: South African labour market in the third quarter of 2015 ......................... 4
Graph 2.1.2: Unemployment in South Africa from 2008 to 2015 ................................. 6
Graph 2.1.3: The employment rate in South Africa from 2008 to 2015 ........................ 7
2.2 The effect of education in the labour market ............................................ 7
Graph 2.2.1: South African population older than 19 by level of education .................. 8
Graph 2.2.2: Progression of the Grade 2 class of 2004 through the school system .... 9
Graph 2.2.3: Employment rate by level of education: 2008 to 2015 ...........................11
2.3 The effect of education and age on income ............................................ 12
Graph 2.3.1: Employed population aged 19 to 64 by level of education and monthly income .......................................................................................................................13
Graph 2.3.2: Employed population by age group and monthly income .......................15
Graph 2.3.3: Employed population with matric as highest qualification by age and monthly income ..........................................................................................................16
Graph 2.3.4: Employed population with a degree as highest qualification by age and monthly income ..........................................................................................................16
Graph 2.3.5: Employed population aged 18 to 24 by educational level, income and age ............................................................................................................................17
3. Breakdown of the 2014 matric results ....................................... 19
3.1 Requirements for a pass and the value of a matric certificate .............. 19
3.2 Results of 2014’s full-time candidates – per subject .............................. 21
Graph 3.2.1: Easy subjects ........................................................................................21
Graph 3.2.2: Intermediate subjects ............................................................................22
Graph 3.2.3: Difficult subjects ....................................................................................23
Graph 3.2.4: Matriculants who achieved more than 60%, 70% and 80% in certain subjects .....................................................................................................................24
4. Conclusion .................................................................................. 26
3
1. Introduction
The matriculants of 2015 have diverse plans for their lives after matric. Some will be able to
further their studies, while the plans of others will be thwarted by poor results. Another group
will not have plans for further training, choosing instead to take a job immediately to join their
former schoolmates who had already left school before matric.
Unfortunately, the South African labour market remains in a weak state. Although
unemployment levels and other indicators change from month to month and from quarter to
quarter, there is still no significant improvement. Unemployment is generally high and even
higher among young people. Matriculants do not seem to fare much better in the labour
market than their fellow learners who left school at an earlier stage. However, the good news
is that, as in previous years, those with some form of tertiary qualification – even if it is only a
diploma or a certificate – do indeed fare much better in the labour market than those who
only have matric.
Sadly, a matric certificate does not really offer good preparation for the modern working
environment, one of the reasons being that a very small number of matriculants achieve
good results in key subjects such as Accounting, Mathematics, Life Science and Physical
Science every year. Typically, this group of matriculants constitute the group of matriculants
who do not want to enter the labour market straight after school in any case, preferring to
further their education. Income data, however, indicate that even young people entering the
labour market after completion of their studies should not immediately expect high salaries,
although the salaries of people (especially those with further education) do rise rapidly as
they grow older and gain experience.
This report presents an analysis of the South African labour market. Information gleaned
from the 2011 Census is also analysed to determine the effect on income of academic
qualification and experience. A breakdown of the 2014 matric results is also included.
4
2. The South African labour market
South Africa has been suffering the effects of extremely high unemployment for decades.
This reality often makes it difficult for young people to find jobs as the supply of workers,
especially with low levels of education and experience, significantly exceeds the current
demand.
In this section the labour market and the way in which training plays a role in it, is analysed in
more detail.
2.1 The labour market – an overview
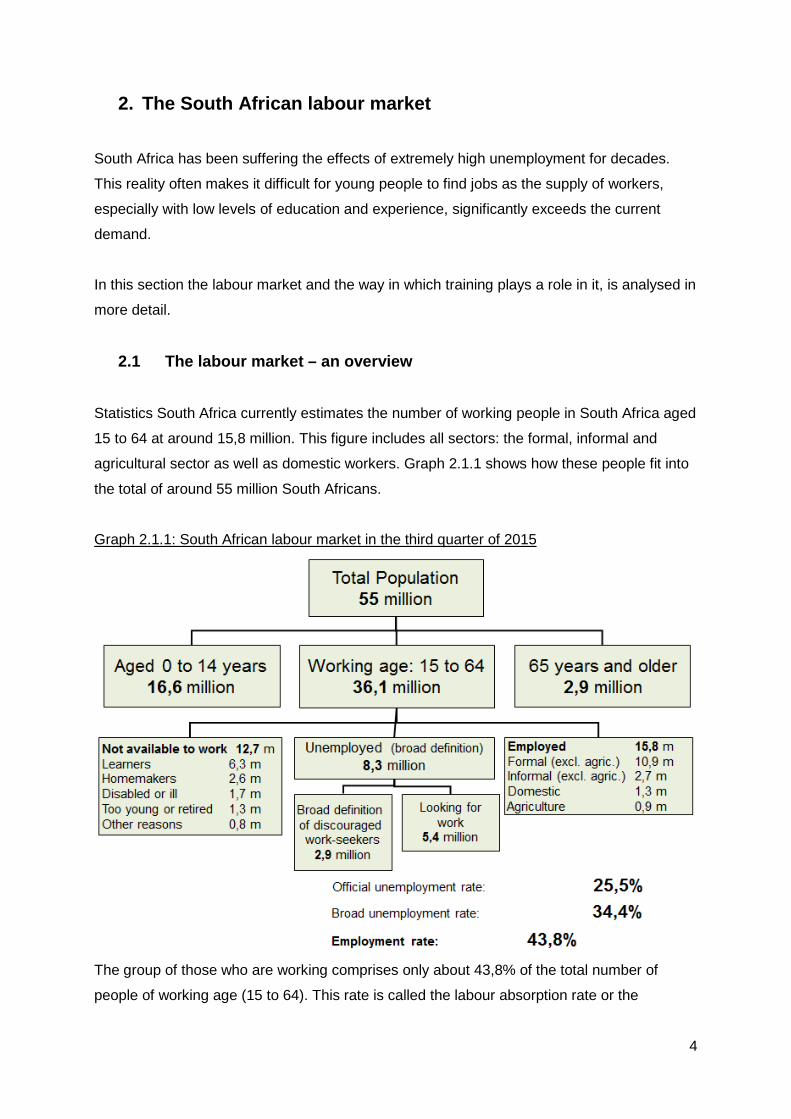
Statistics South Africa currently estimates the number of working people in South Africa aged
15 to 64 at around 15,8 million. This figure includes all sectors: the formal, informal and
agricultural sector as well as domestic workers. Graph 2.1.1 shows how these people fit into
the total of around 55 million South Africans.
Graph 2.1.1: South African labour market in the third quarter of 2015
The group of those who are working comprises only about 43,8% of the total number of
people of working age (15 to 64). This rate is called the labour absorption rate or the
5
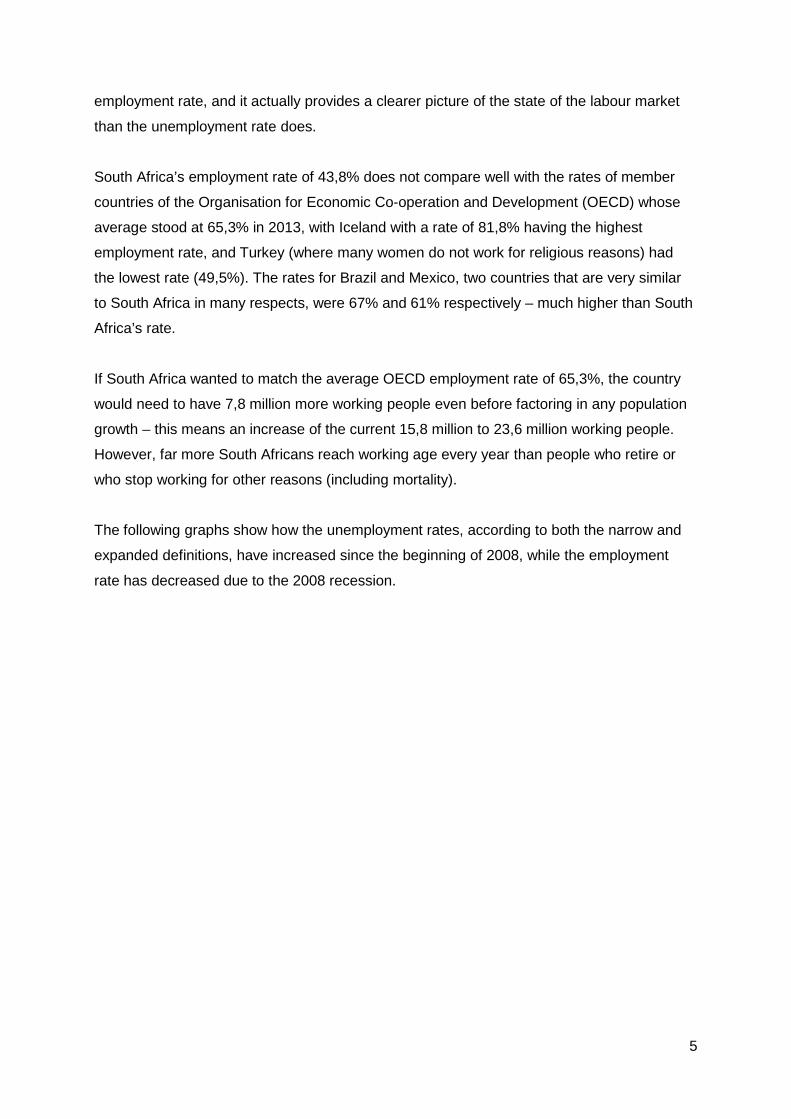
employment rate, and it actually provides a clearer picture of the state of the labour market
than the unemployment rate does.
South Africa’s employment rate of 43,8% does not compare well with the rates of member
countries of the Organisation for Economic Co-operation and Development (OECD) whose
average stood at 65,3% in 2013, with Iceland with a rate of 81,8% having the highest
employment rate, and Turkey (where many women do not work for religious reasons) had
the lowest rate (49,5%). The rates for Brazil and Mexico, two countries that are very similar
to South Africa in many respects, were 67% and 61% respectively – much higher than South
Africa’s rate.
If South Africa wanted to match the average OECD employment rate of 65,3%, the country
would need to have 7,8 million more working people even before factoring in any population
growth – this means an increase of the current 15,8 million to 23,6 million working people.
However, far more South Africans reach working age every year than people who retire or
who stop working for other reasons (including mortality).
The following graphs show how the unemployment rates, according to both the narrow and
expanded definitions, have increased since the beginning of 2008, while the employment
rate has decreased due to the 2008 recession.
6
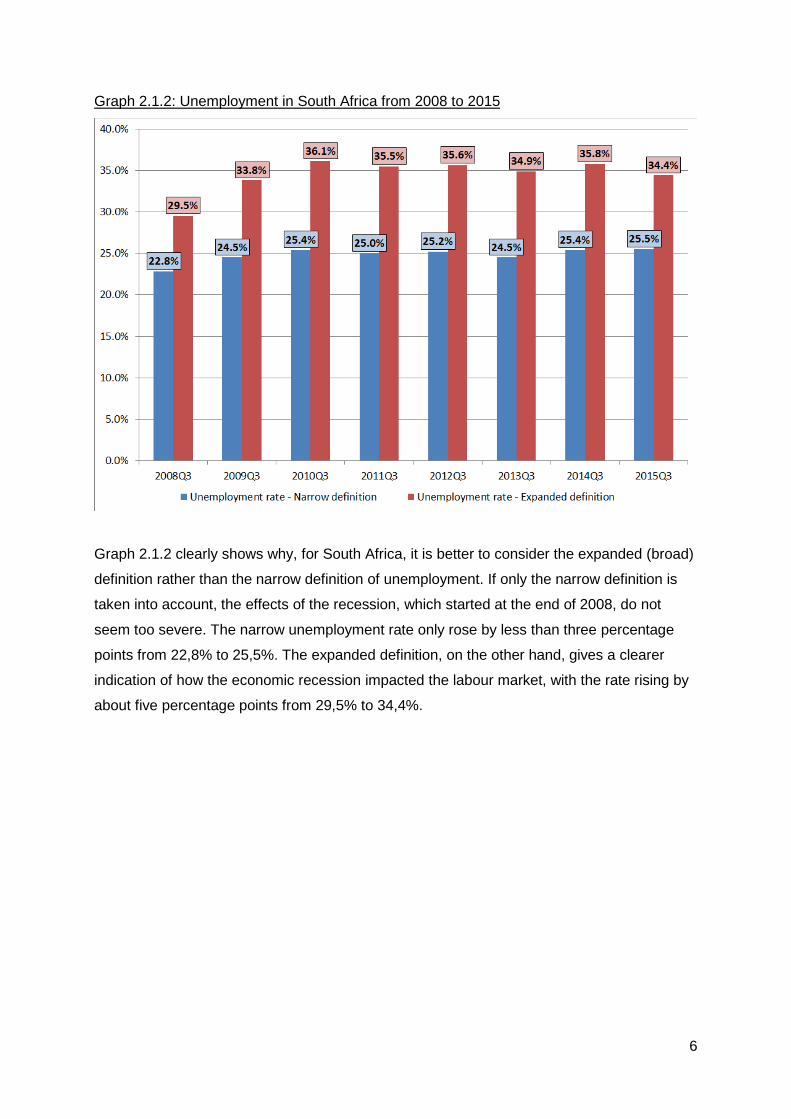
Graph 2.1.2: Unemployment in South Africa from 2008 to 2015
Graph 2.1.2 clearly shows why, for South Africa, it is better to consider the expanded (broad)
definition rather than the narrow definition of unemployment. If only the narrow definition is
taken into account, the effects of the recession, which started at the end of 2008, do not
seem too severe. The narrow unemployment rate only rose by less than three percentage
points from 22,8% to 25,5%. The expanded definition, on the other hand, gives a clearer
indication of how the economic recession impacted the labour market, with the rate rising by
about five percentage points from 29,5% to 34,4%.
7
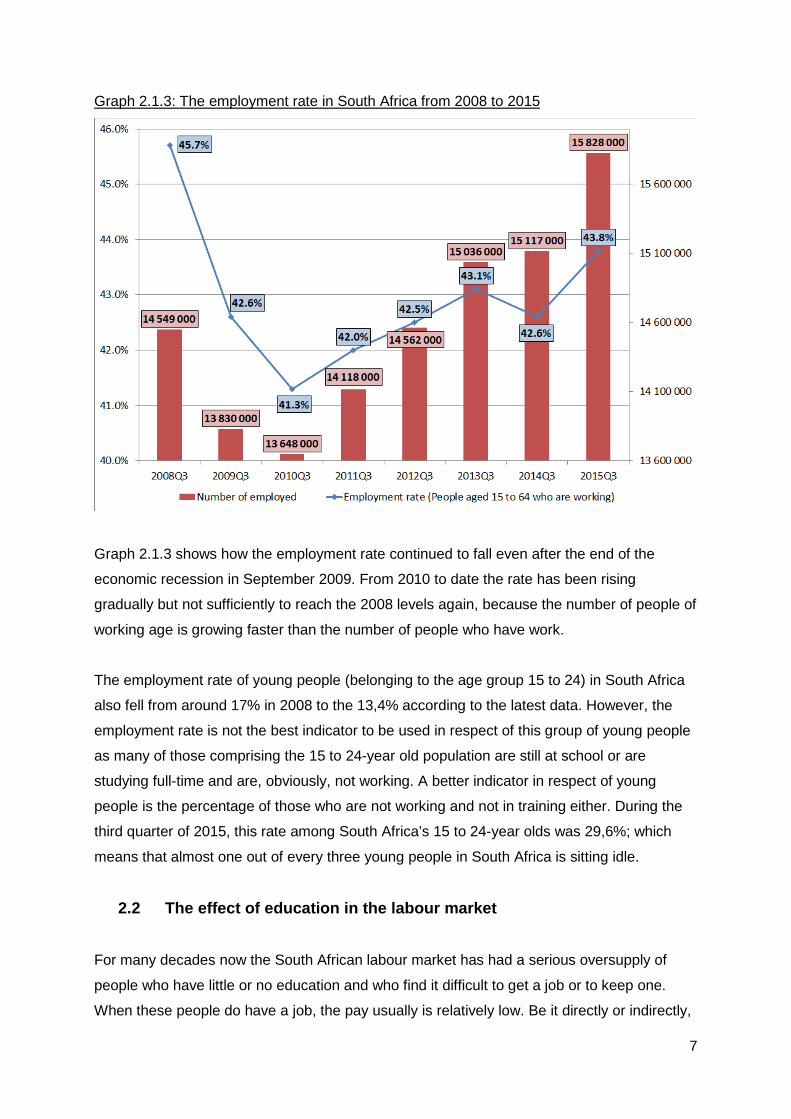
Graph 2.1.3: The employment rate in South Africa from 2008 to 2015
Graph 2.1.3 shows how the employment rate continued to fall even after the end of the
economic recession in September 2009. From 2010 to date the rate has been rising
gradually but not sufficiently to reach the 2008 levels again, because the number of people of
working age is growing faster than the number of people who have work.
The employment rate of young people (belonging to the age group 15 to 24) in South Africa
also fell from around 17% in 2008 to the 13,4% according to the latest data. However, the
employment rate is not the best indicator to be used in respect of this group of young people
as many of those comprising the 15 to 24-year old population are still at school or are
studying full-time and are, obviously, not working. A better indicator in respect of young
people is the percentage of those who are not working and not in training either. During the
third quarter of 2015, this rate among South Africa’s 15 to 24-year olds was 29,6%; which
means that almost one out of every three young people in South Africa is sitting idle.
2.2 The effect of education in the labour market
For many decades now the South African labour market has had a serious oversupply of
people who have little or no education and who find it difficult to get a job or to keep one.
When these people do have a job, the pay usually is relatively low. Be it directly or indirectly,
8
pay is inextricably linked to the value people add (productivity). It seldom happens that
people with little or no education can add the same level of value that can be added by those
with more or better education. There is thus a strong link between education and
remuneration.
Although more young people in South Africa are currently completing secondary and tertiary
education than before, many still leave the school system before finishing matric. This means
that education levels in the labour market have not changed as rapidly as might otherwise
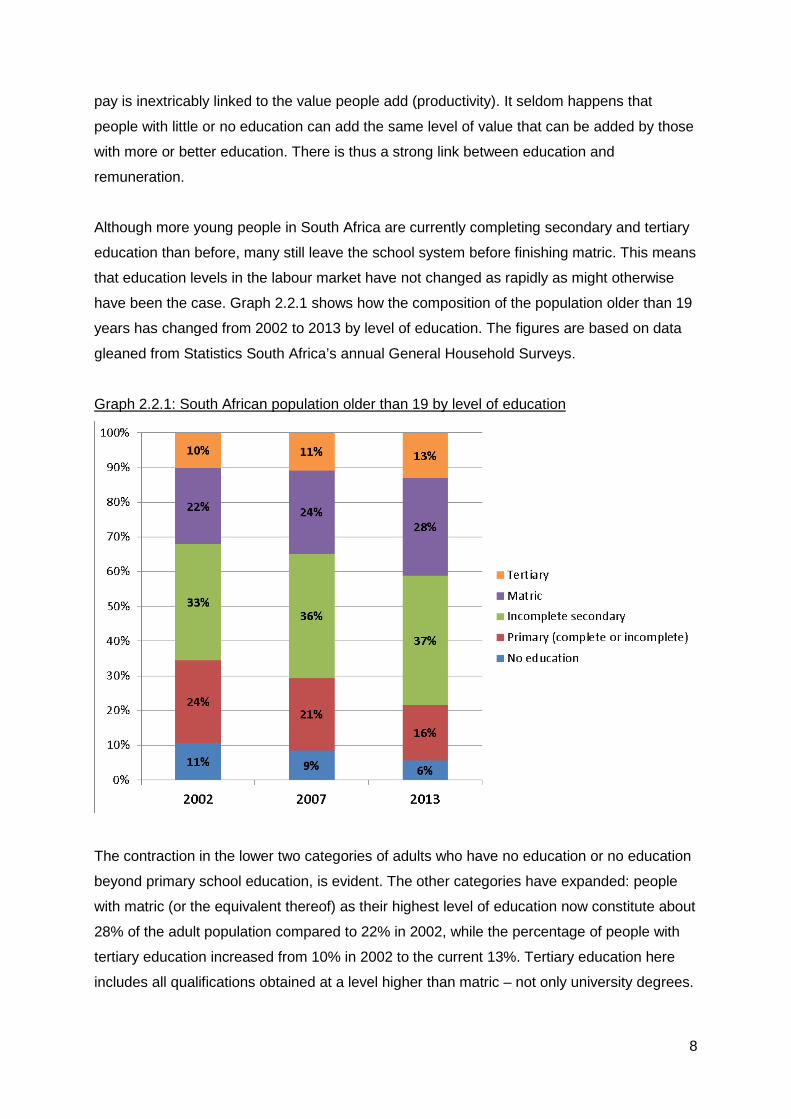
have been the case. Graph 2.2.1 shows how the composition of the population older than 19
years has changed from 2002 to 2013 by level of education. The figures are based on data
gleaned from Statistics South Africa’s annual General Household Surveys.
Graph 2.2.1: South African population older than 19 by level of education
The contraction in the lower two categories of adults who have no education or no education
beyond primary school education, is evident. The other categories have expanded: people
with matric (or the equivalent thereof) as their highest level of education now constitute about
28% of the adult population compared to 22% in 2002, while the percentage of people with
tertiary education increased from 10% in 2002 to the current 13%. Tertiary education here
includes all qualifications obtained at a level higher than matric – not only university degrees.
9
This improvement in education levels of the South African adult population is positive, though
sadly it is happening at a very slow rate. The 13% of adults with any kind of tertiary education
is still far too low.
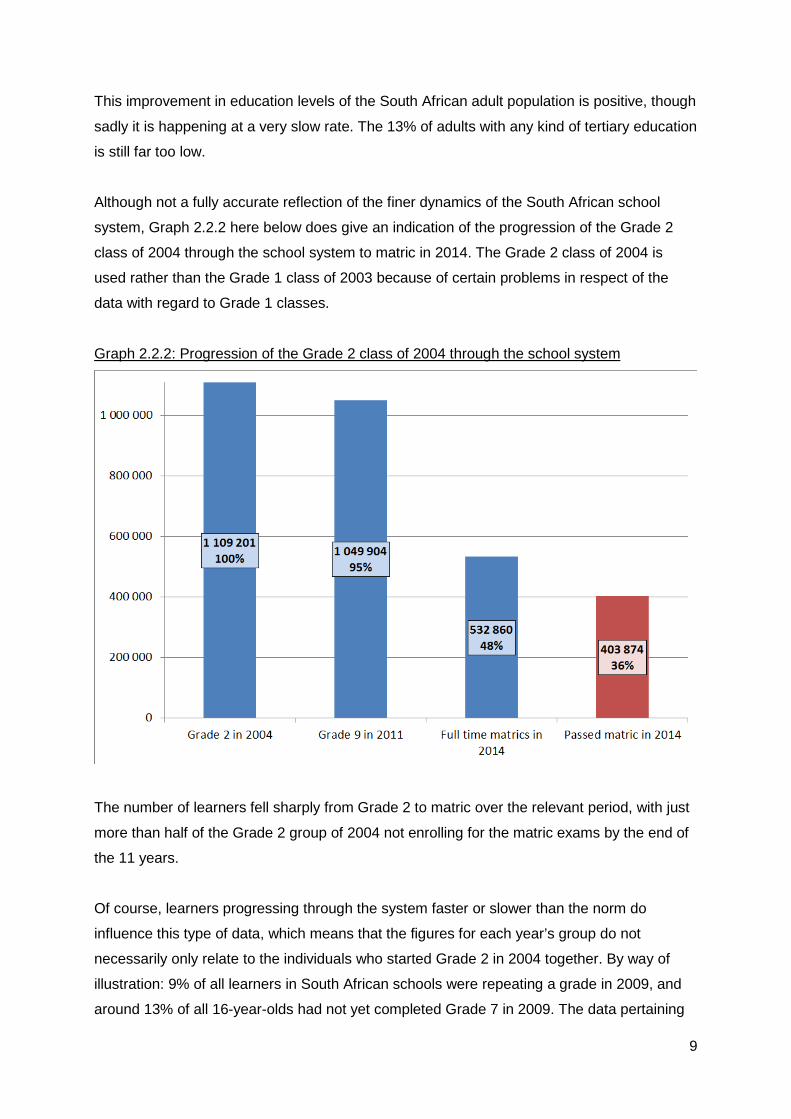
Although not a fully accurate reflection of the finer dynamics of the South African school
system, Graph 2.2.2 here below does give an indication of the progression of the Grade 2
class of 2004 through the school system to matric in 2014. The Grade 2 class of 2004 is
used rather than the Grade 1 class of 2003 because of certain problems in respect of the
data with regard to Grade 1 classes.
Graph 2.2.2: Progression of the Grade 2 class of 2004 through the school system
The number of learners fell sharply from Grade 2 to matric over the relevant period, with just
more than half of the Grade 2 group of 2004 not enrolling for the matric exams by the end of
the 11 years.
Of course, learners progressing through the system faster or slower than the norm do
influence this type of data, which means that the figures for each year’s group do not
necessarily only relate to the individuals who started Grade 2 in 2004 together. By way of
illustration: 9% of all learners in South African schools were repeating a grade in 2009, and
around 13% of all 16-year-olds had not yet completed Grade 7 in 2009. The data pertaining
10
to the size of each year’s group are also affected by factors such as learners who leave the
school system permanently because of illness, disability, emigration or death. Conversely,
immigration adds learners to the group through the years.
Despite these reservations about the data, it still indicates that only a small group – fewer
than four out of every ten of the original Grade 2 class – indeed managed to obtain a matric
certificate within the minimum period. This trend explains why the composition of the South
African population by level of education is changing so slowly. A large number of people are
dropping out of school too soon, although those who drop out of totally dysfunctional schools
cannot really be blamed for failing to see the value of education.
Nevertheless, people with matric as their highest qualification do indeed constitute a growing
proportion of the adult population. Regrettably, in the labour market a matric certificate in
itself does not offer much value. A matric certificate is certainly not a passport to a job that
offers better remuneration than unskilled manual labour. This is partly due to the fact that
more people currently hold matric certificates than a few decades ago. A larger supply of
people with matric necessarily leads to a decline in its relative value, even if there is no
change in standards at an individual level.1
In Graph 2.2.3 the employment rate (discussed in section 2.1 above) is shown by level of
education.
1 Of course, changes in education standards can also have an influence, but whether it improved or deteriorated in South African schools during the past decade or two, falls outside the scope of this report.
11
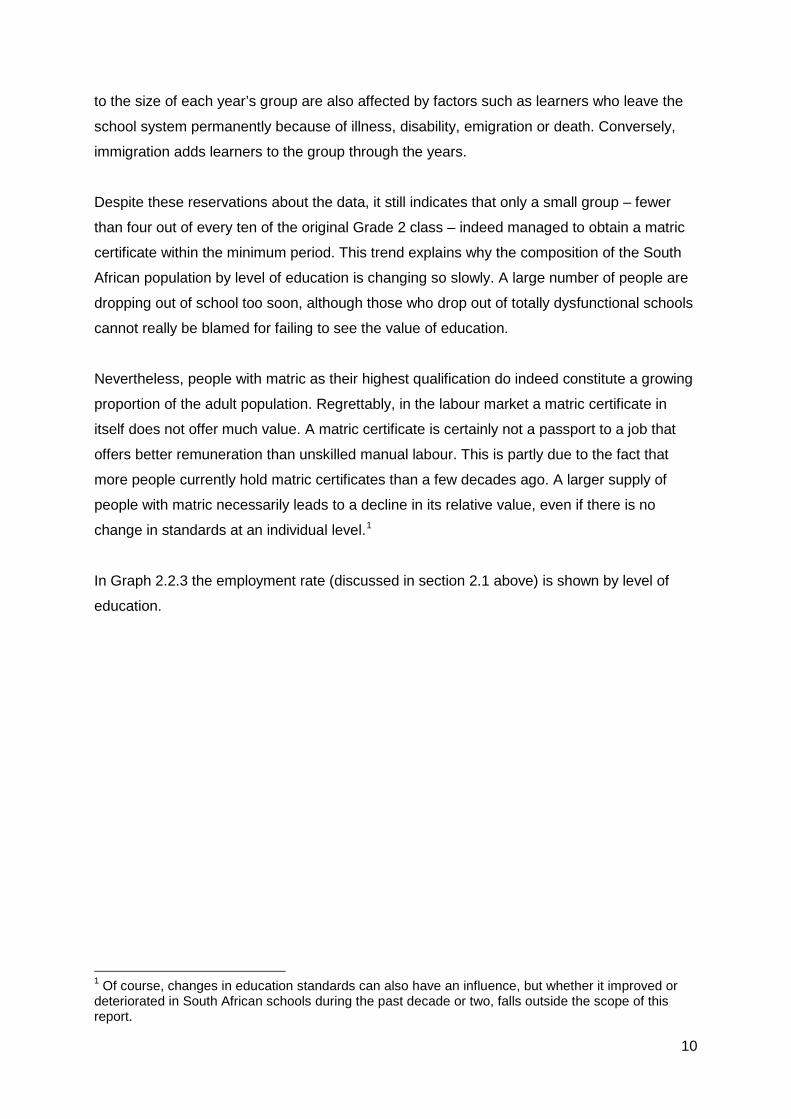
Graph 2.2.3: Employment rate by level of education: 2008 to 2015
The negligible difference between those who at least completed Grade 7 (the green line on
the graph); those who progressed as far as Grade 11 (the purple line); and those without any
formal education (the dotted blue line) is clearly evident. For the past six years the data for
those three groups remain close to one another throughout with an employment rate of
around 30% to 35%. Therefore, any qualification lower than matric is practically of no value
for someone’s chances of having a job.
However, those who do hold a matric certificate as their highest qualification only fare slightly
better with an employment rate stuck at around 50%. These figures are in fact slightly
skewed, because on any given date, a number of people who hold a matric certificate as
their highest qualification are not yet working because they have opted to further their
studies. However, even with this detail factored in, the employment rate for matriculants
would not rise much higher.
A meaningful difference can be seen at tertiary level. Approximately 75% to 80% of all
people with some or other form of tertiary education do indeed have work. Tertiary education
improves a person’s chances of having employment to a large extent – much more than a
matric certificate alone does.
12
Moreover, tertiary education increases potential earnings because a person who has more
knowledge and the ability to apply such knowledge is able to add more value. Human society
is founded on knowledge – knowledge is the source of progress and improved living
conditions. People who possess the knowledge to make a further contribution towards this
improvement will always be rewarded for it. This is the reason why people are prepared to
sacrifice so much time and money as well as potential earnings in order to go to school and
to receive further training. They correctly conclude that the effort, money and time they invest
in education will ultimately yield manifold returns.
Seen against the backdrop of a modern knowledge-based economy South Africa’s high
unemployment rate is hardly surprising as only 13% of the adult population have tertiary
education.
2.3 The effect of education and age on income
The employment rate and the chances of people in South Africa to find work constitute the
one part of the question about the importance education has for an individual. The other part
concerns the influence education has on remuneration when a person does have a job.
Some of the data from the 2011 census regarding working people in South Africa have been
analysed in order to find an answer to this question. Three factors – education, age and
income – have been examined.
13
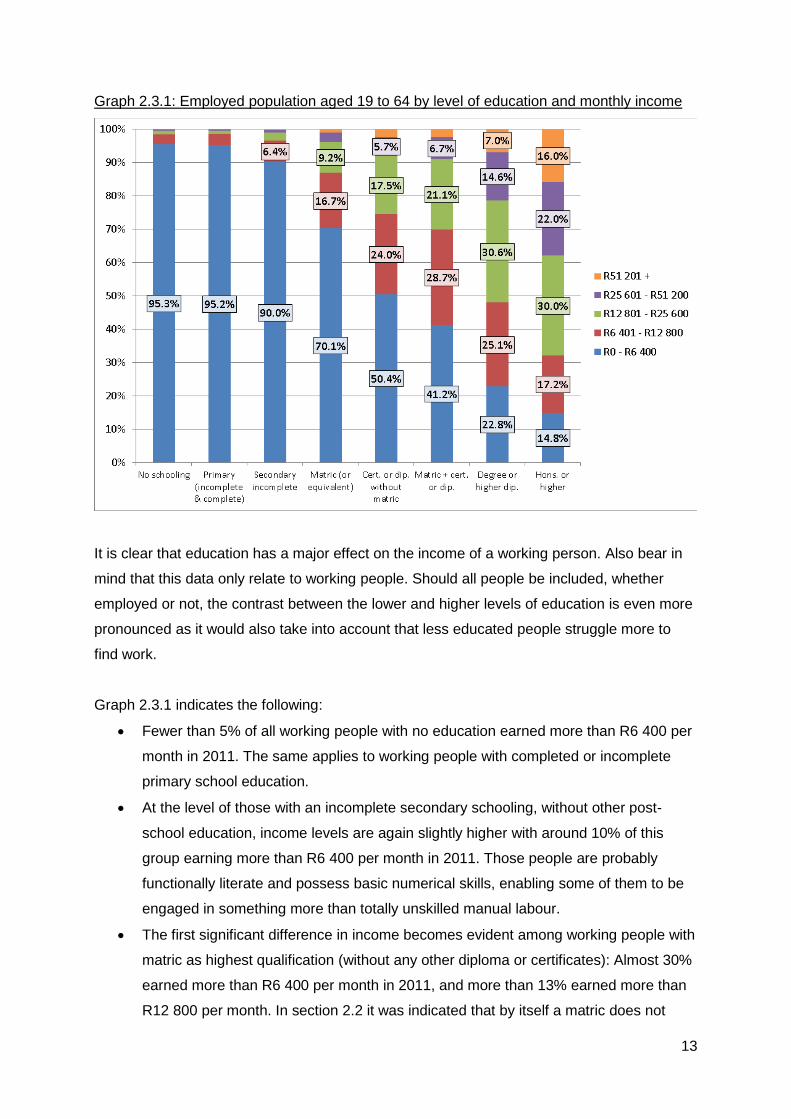
Graph 2.3.1: Employed population aged 19 to 64 by level of education and monthly income
It is clear that education has a major effect on the income of a working person. Also bear in
mind that this data only relate to working people. Should all people be included, whether
employed or not, the contrast between the lower and higher levels of education is even more
pronounced as it would also take into account that less educated people struggle more to
find work.
Graph 2.3.1 indicates the following:
• Fewer than 5% of all working people with no education earned more than R6 400 per
month in 2011. The same applies to working people with completed or incomplete
primary school education.
• At the level of those with an incomplete secondary schooling, without other post-
school education, income levels are again slightly higher with around 10% of this
group earning more than R6 400 per month in 2011. Those people are probably
functionally literate and possess basic numerical skills, enabling some of them to be
engaged in something more than totally unskilled manual labour.
• The first significant difference in income becomes evident among working people with
matric as highest qualification (without any other diploma or certificates): Almost 30%
earned more than R6 400 per month in 2011, and more than 13% earned more than
R12 800 per month. In section 2.2 it was indicated that by itself a matric does not
14
have a major impact on someone’s chances of having a job; however it is
nevertheless clear that matric does have some effect on income in this instance.
• The results for the next level may be somewhat surprising. This level pertains to
people who do not have matric, but who do hold some form of tertiary diploma or
certificate. Nearly 50% of them earned more than R6 400 per month in 2011, and
more than 25% of them earned more than R12 800 per month. A substantial group of
8,1% earned even more than R25 600 per month. Because of the differences in
quality and usefulness of the various certificates and diplomas this group has many
divergent characteristics. It does show, however, that even though they did not obtain
matric but rather another qualification, they can still have a good future. This fact is
particularly evident when this group is compared to the group with only an incomplete
secondary school career.
• The group of working people who hold a matric certificate as well as a certificate or
diploma constitutes the first group where more than 50% earn more than R6 400 per
month. The income of more than 30% exceeds R12 800 per month, and 9,1% earn
more than R25 600 per month.
• The next group, people holding university degrees, higher diplomas or equivalent
qualifications, presents the largest jump in income levels. Almost 80% of this group
earned more than R6 400 in 2011. More than half earned more than R12 800 per
month and nearly 25% earned more than R25 600 per month. A significant 7% even
earned in excess of R51 200 per month.
• The next education level – an honours degree or higher – also shows a meaningful
rise in income levels. More than 85% of this group earned more than R6 400 per
month in 2011; approximately 68% earned more than R12 800 per month; 38%
earned more than R25 600 per month; and around 16% earned more than R51 200
per month.
Generally, this data shows exactly what is to be expected. The more time (and money)
invested in education, the greater the reward for it is. Of course, there are exceptions to this
principle, but such exceptions are rare.
Education levels are one of the most important factors in determining a person’s capacity to
produce and, consequently, the amount he or she may expect in income. Experience – both
direct work experience and general experience in life – is the other very important factor.
Unfortunately, there is no large overall dataset by which to measure work experience;
however, age can be used to estimate the effect of work and life experience. A 40-year-old-
15
person can easily have more than two decades of work experience, while it is unlikely that an
18-year-old would have work experience of any significance.
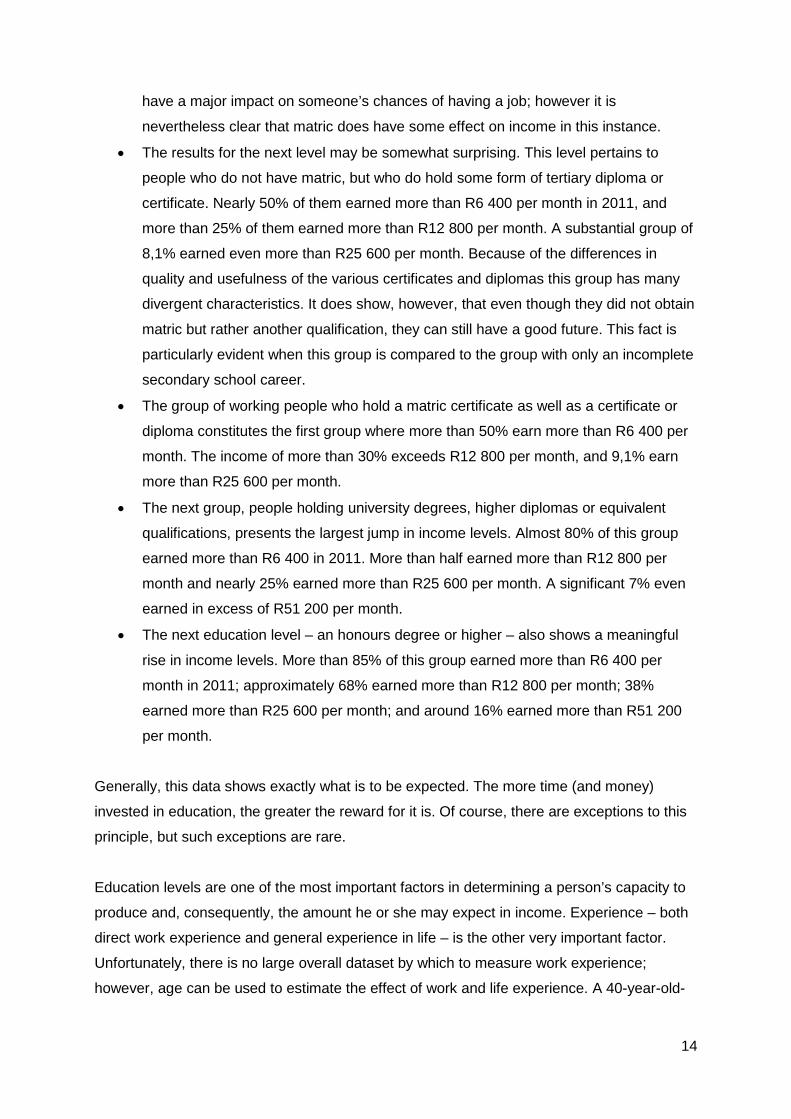
Graph 2.3.2: Employed population by age group and monthly income
This graph shows the effect of age on income. Up to and including the 40 to 49-year age
group, there is a strong progression of increasing income as people get older. This begins to
confirm what effect experience has on potential income. As this graph combines all
education levels it actually contains too much data to give a precise indication of the effect of
age and experience on income.
The next two graphs show the considerable differences brought about by education and age
together. The first graph shows only the income categories by various age groups for people
with matric as their highest qualification. The next graph shows income categories by age
groups but as they relate to people holding a degree or equivalent qualification.
16
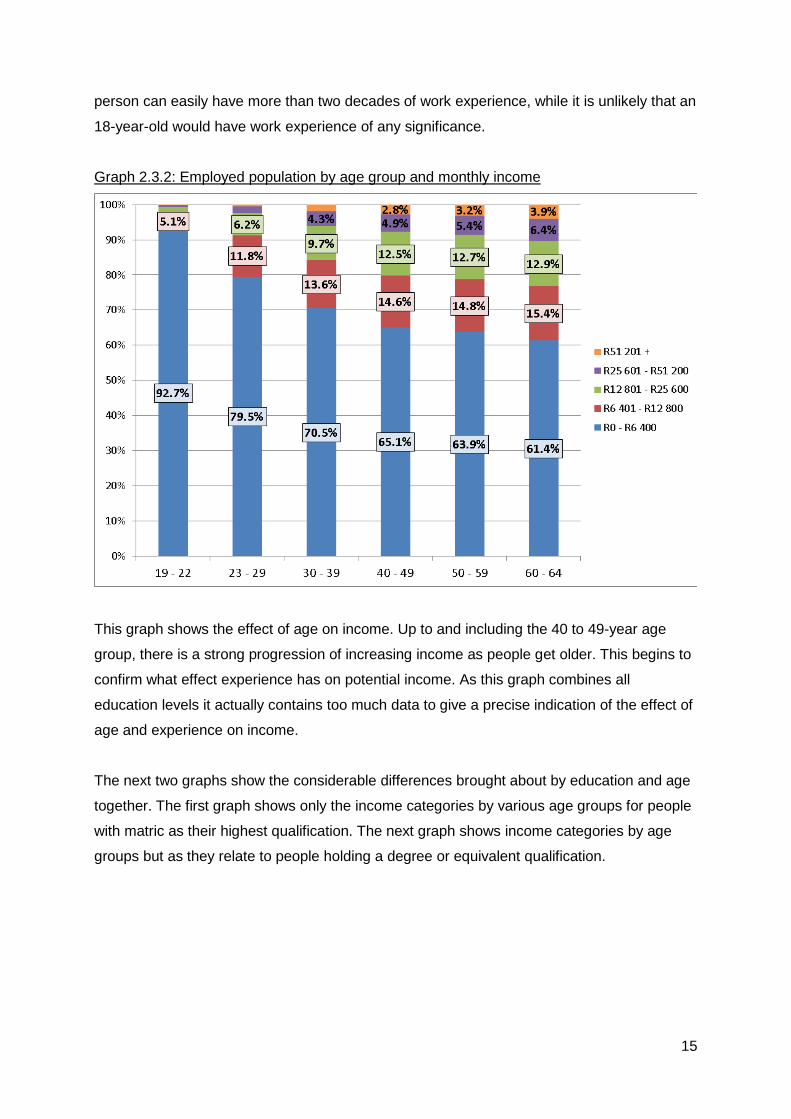
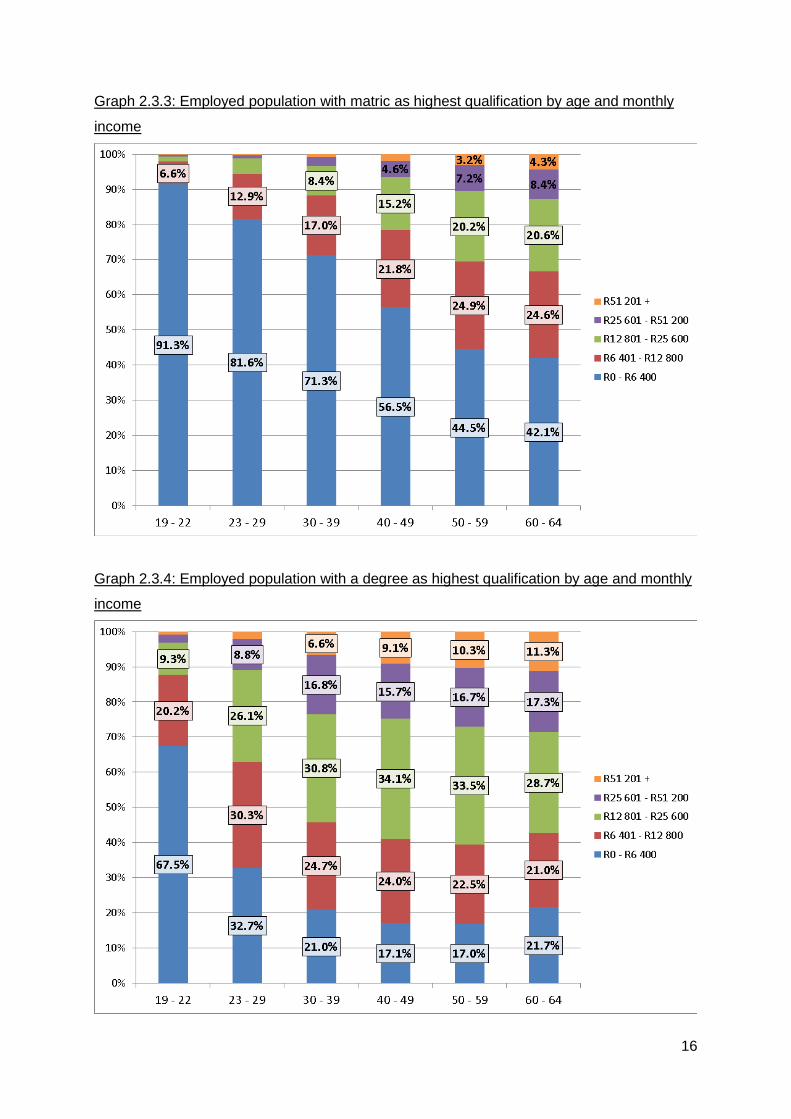
Graph 2.3.3: Employed population with matric as highest qualification by age and monthly
income
Graph 2.3.4: Employed population with a degree as highest qualification by age and monthly
income
17
In the above graphs, the contrast between the income potential a matric qualification offers
and that offered by a degree is clearly evident for each age group. For instance, in the 23 to
29 age group only about 18,4% of working people with matric as highest qualification earned
more than R6 400 per month in 2011. For the same age group, 67,3% of those with a degree
as highest qualification earned more than R6 400 per month.
Both graphs also illustrate even more clearly what effect experience can have, with not even
10% of the group of 19 to 23-year-olds with matric as highest qualification earning more than
R6 400 per month, while nearly 30% of the age group 30 to 39 with matric as highest
qualification earned more than R6 400. The contrast is even more pronounced when the
differences are considered by age in Graph 2.3.4. These trends are also manifest at the
lower age groups, and are illustrated in the next graph.
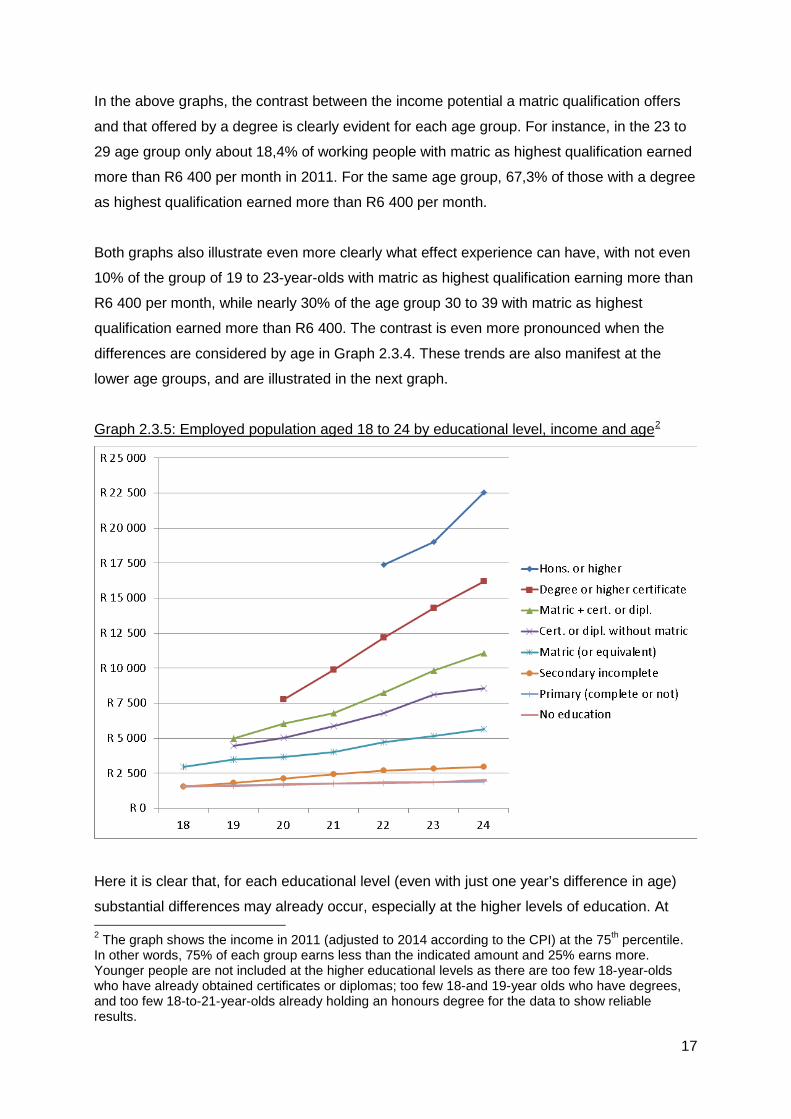
Graph 2.3.5: Employed population aged 18 to 24 by educational level, income and age2
Here it is clear that, for each educational level (even with just one year’s difference in age)
substantial differences may already occur, especially at the higher levels of education. At 2 The graph shows the income in 2011 (adjusted to 2014 according to the CPI) at the 75th percentile. In other words, 75% of each group earns less than the indicated amount and 25% earns more. Younger people are not included at the higher educational levels as there are too few 18-year-olds who have already obtained certificates or diplomas; too few 18-and 19-year olds who have degrees, and too few 18-to-21-year-olds already holding an honours degree for the data to show reliable results.
18
each level of education income rises as age (and therefore experience) increases. For
example, consider the group with matric plus a certificate or a diploma as highest
qualification (the green line). In this group, the income of working 20-year-olds at the 75th
percentile is about R6 000, but for 24-year-olds with similar qualifications it is more than
R11 000.
These results show that it is certainly worthwhile to obtain a qualification higher than matric –
even at a young age. For instance, compare the income profiles of 24-year-olds who only
have matric with the income profiles of those with matric plus a certificate or diploma. The
income of 24-year-olds who only have matric at the 75th percentile is barely more than
R5 500 per month, while those who have matric plus a certificate or diploma are earning
more than R11 000.
The data does show that recent graduates entering their first jobs should not expect to earn
the same salary as older people with more experience; however, it does show that
remuneration generally increases quite rapidly as experience is gained, especially at the
higher qualification levels.
19
3. Breakdown of the 2014 matric results
In 2014 there was a slight decline in the matric pass rate from 78,2% in 2013 to 75,8%. This
change is not very meaningful, as the percentage of matric learners who pass is in itself not
really a good measure of the real quality of the South African school system. There are other
problems that require more attention, such as the large number of learners leaving the
school system before matric; the relatively low pass requirements, and the question of
whether most matriculants who pass are indeed ready for tertiary education. It has been
pointed out in the previous section that a matric certificate does not really offer a meaningful
advantage in the labour market any longer.
3.1 Requirements for a pass and the value of a matric certificate
One of the major problems with the matric exam is that the requirements for a pass are
simply too low, robbing the certificate of much of its potential value. Matriculants only have to
pass one official language subject at home language level with 40% or higher. Two other
subjects, Life Orientation excluded, need to be passed with 40% or higher. A further three
subjects must be passed with 30% or higher, and one subject may be failed. Therefore, the
lowest simple average pass mark for a matriculant is 30%, although realistically, the lowest
actual pass mark will be closer to 40%. Even so, an average of 40% is simply too low to have
any value in the job market or to serve as preparation for tertiary studies. The fact that the
pass mark is so low engenders a lack of confidence in the standard of all the matriculants’
qualifications, including those who do achieve good marks.
The value of a matric certificate does not only vary according to the average mark obtained
but also according to the subjects taken. Each year, hardly any learners fail in what can be
termed the “easy” subjects. This shows that the content, examination and/or assessment of
the subjects concerned are at such a low standard that a pass mark is no indicator of true
aptitude or skill in the relevant field of study, regardless of the mark achieved. One of the
reasons why so many people with a matric certificate struggle to find a job or earn low
salaries when they do have a job, is simply that they either did not take the right subjects or
that they failed to reach the required standard in the right subjects for the certificate to show
that they have actually acquired something valuable during their school careers.
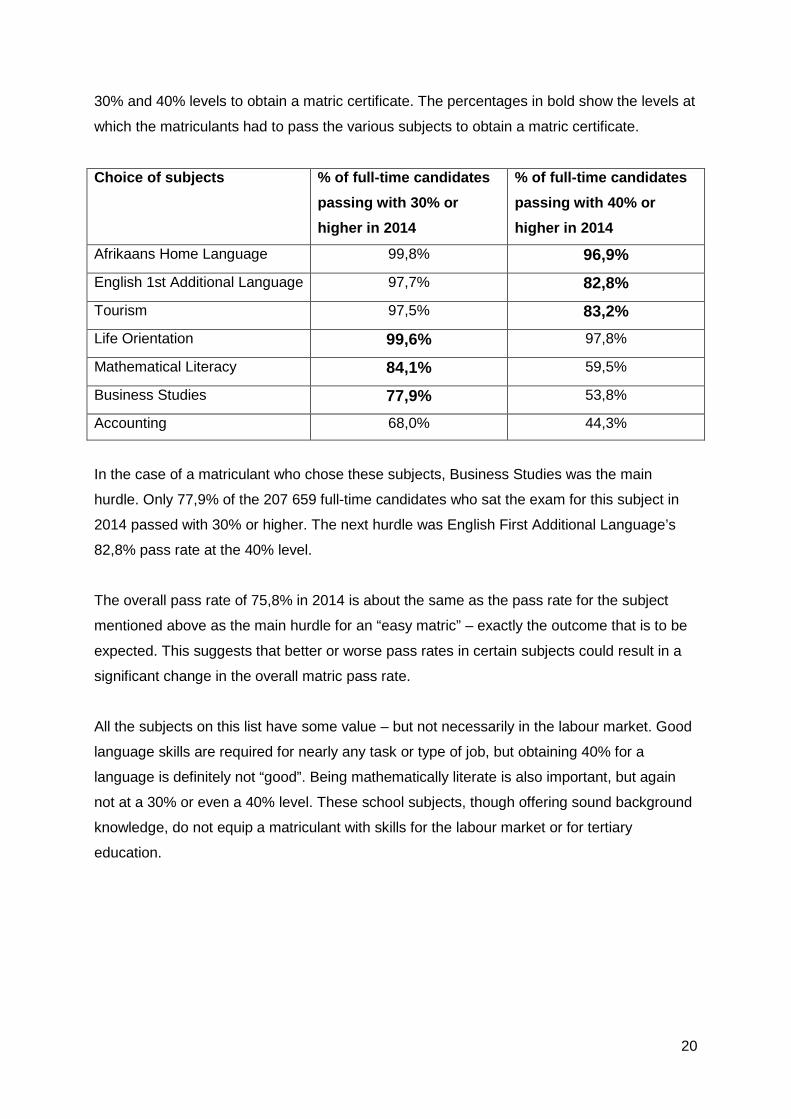
The following table illustrates the dilemma. It shows a basic subject choice for a matriculant,
as well as the pass rates of the 2014 matric candidates who had passed the subjects at the
20
30% and 40% levels to obtain a matric certificate. The percentages in bold show the levels at
which the matriculants had to pass the various subjects to obtain a matric certificate.
Choice of subjects % of full-time candidates passing with 30% or higher in 2014
% of full-time candidates passing with 40% or higher in 2014
Afrikaans Home Language 99,8% 96,9% English 1st Additional Language 97,7% 82,8% Tourism 97,5% 83,2% Life Orientation 99,6% 97,8%
Mathematical Literacy 84,1% 59,5%
Business Studies 77,9% 53,8%
Accounting 68,0% 44,3%
In the case of a matriculant who chose these subjects, Business Studies was the main
hurdle. Only 77,9% of the 207 659 full-time candidates who sat the exam for this subject in
2014 passed with 30% or higher. The next hurdle was English First Additional Language’s
82,8% pass rate at the 40% level.
The overall pass rate of 75,8% in 2014 is about the same as the pass rate for the subject
mentioned above as the main hurdle for an “easy matric” – exactly the outcome that is to be
expected. This suggests that better or worse pass rates in certain subjects could result in a
significant change in the overall matric pass rate.
All the subjects on this list have some value – but not necessarily in the labour market. Good
language skills are required for nearly any task or type of job, but obtaining 40% for a
language is definitely not “good”. Being mathematically literate is also important, but again
not at a 30% or even a 40% level. These school subjects, though offering sound background
knowledge, do not equip a matriculant with skills for the labour market or for tertiary
education.
21
3.2 Results of 2014’s full-time candidates – per subject
In the next set of graphs the results obtained in subjects taken by a significant number of
learners are analysed in more detail, covering only the results of full-time candidates. Those
learners who repeated one or two subjects are therefore not included in these figures.
There is a clear distinction between three broad groups of subjects – here distinguished as
“easy”; “intermediate”; and “difficult”.
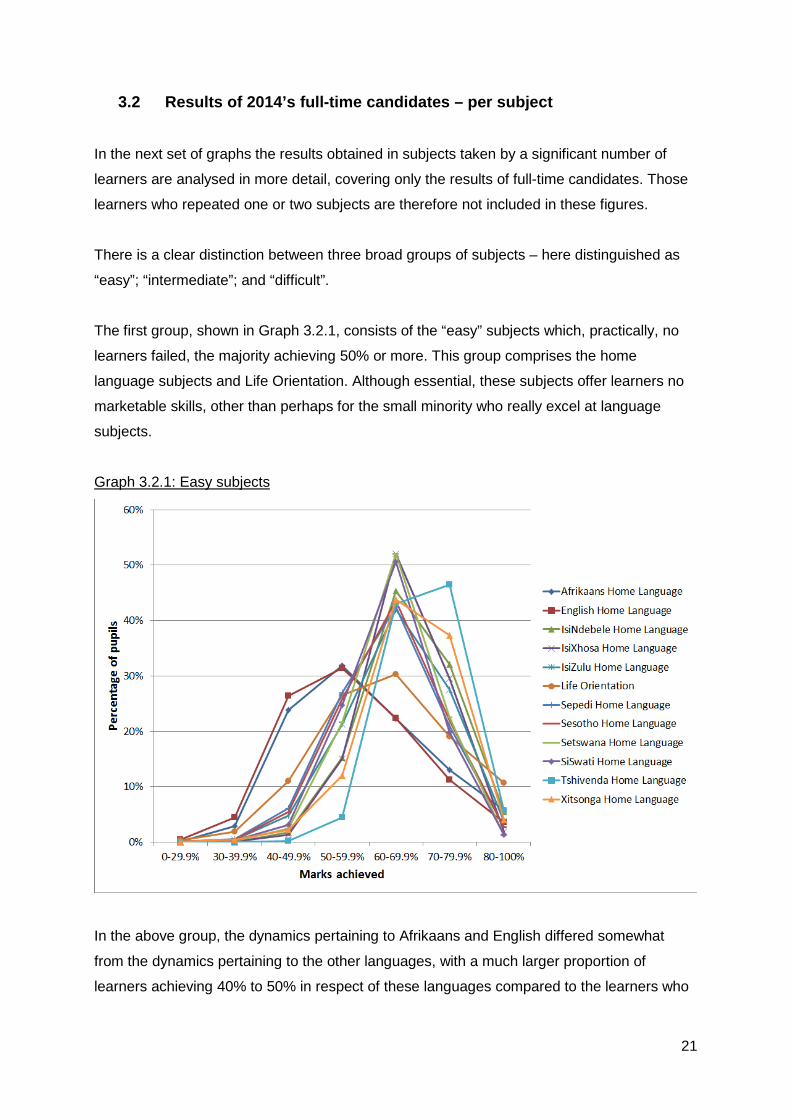
The first group, shown in Graph 3.2.1, consists of the “easy” subjects which, practically, no
learners failed, the majority achieving 50% or more. This group comprises the home
language subjects and Life Orientation. Although essential, these subjects offer learners no
marketable skills, other than perhaps for the small minority who really excel at language
subjects.
Graph 3.2.1: Easy subjects
In the above group, the dynamics pertaining to Afrikaans and English differed somewhat
from the dynamics pertaining to the other languages, with a much larger proportion of
learners achieving 40% to 50% in respect of these languages compared to the learners who
22
enrolled for the other languages. Life Orientation was another exception in which a much
higher proportion of learners achieved 80% compared to most home language subjects.
With the possible exception of Afrikaans and English, it would appear that home language
subjects are not being taught and assessed as seriously as they ought to be, as almost no
learners achieve less than 50% in these subjects. It is virtually guaranteed that all
matriculants will pass these subjects with 40% or higher.
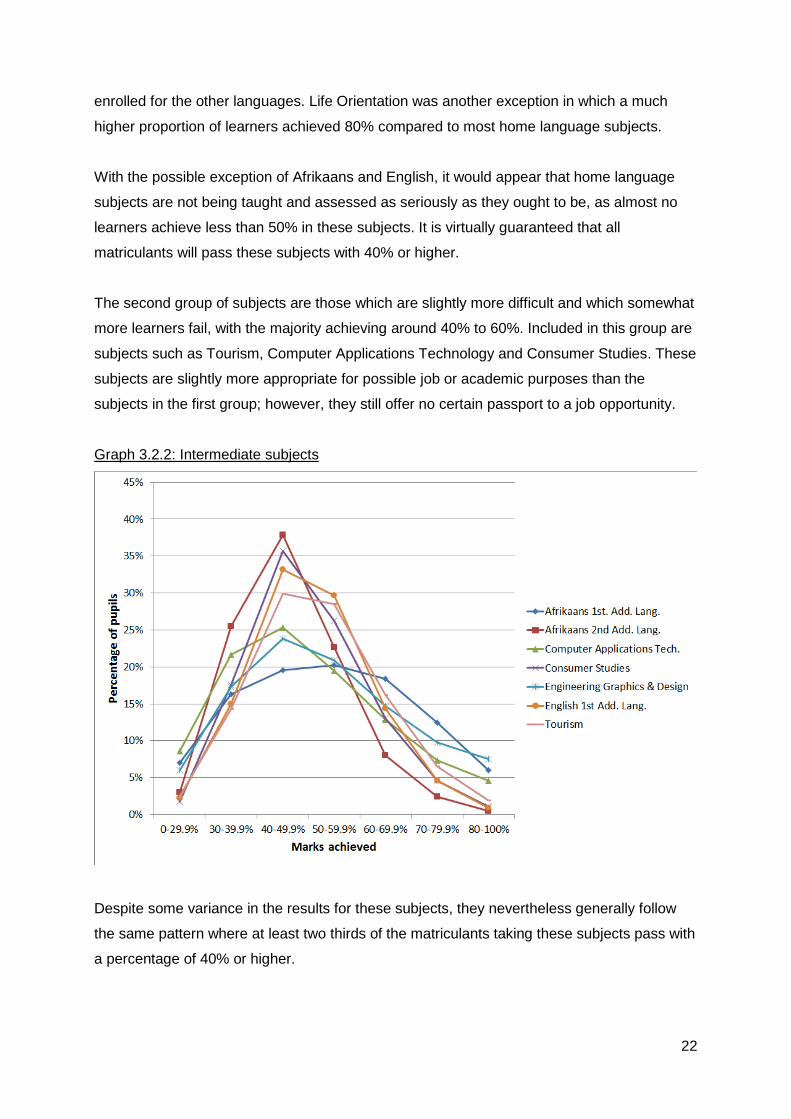
The second group of subjects are those which are slightly more difficult and which somewhat
more learners fail, with the majority achieving around 40% to 60%. Included in this group are
subjects such as Tourism, Computer Applications Technology and Consumer Studies. These
subjects are slightly more appropriate for possible job or academic purposes than the
subjects in the first group; however, they still offer no certain passport to a job opportunity.
Graph 3.2.2: Intermediate subjects
Despite some variance in the results for these subjects, they nevertheless generally follow
the same pattern where at least two thirds of the matriculants taking these subjects pass with
a percentage of 40% or higher.
23
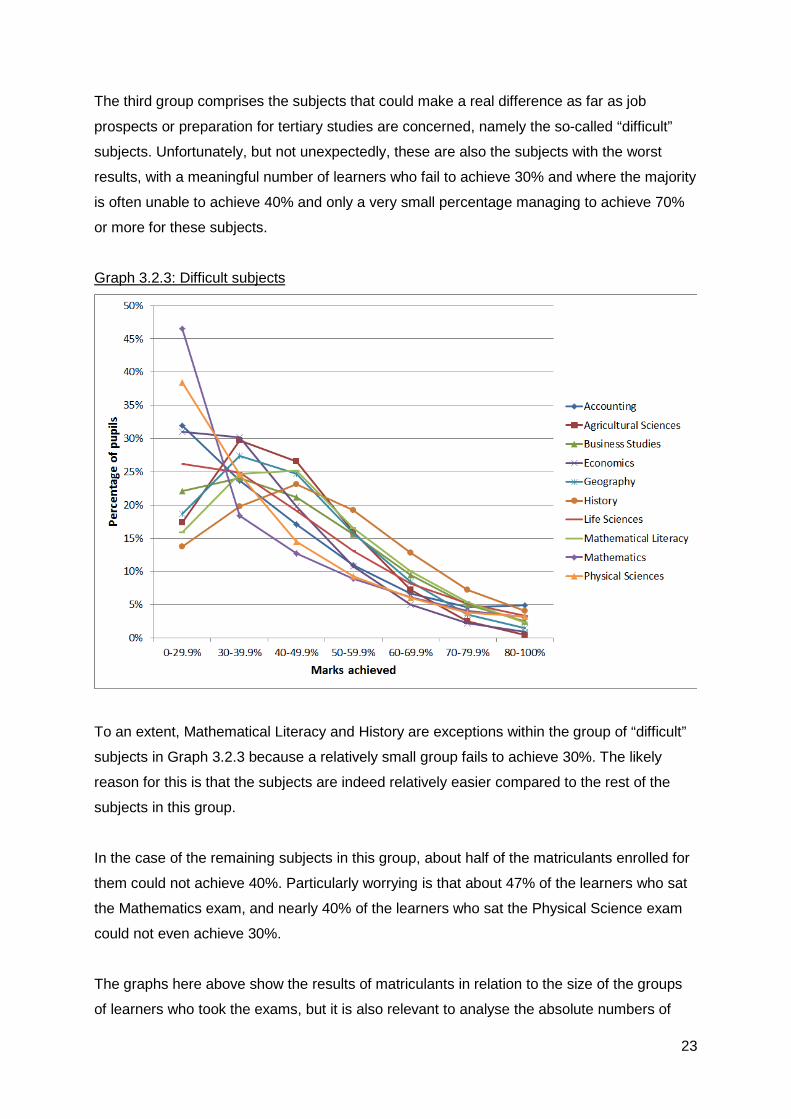
The third group comprises the subjects that could make a real difference as far as job
prospects or preparation for tertiary studies are concerned, namely the so-called “difficult”
subjects. Unfortunately, but not unexpectedly, these are also the subjects with the worst
results, with a meaningful number of learners who fail to achieve 30% and where the majority
is often unable to achieve 40% and only a very small percentage managing to achieve 70%
or more for these subjects.
Graph 3.2.3: Difficult subjects
To an extent, Mathematical Literacy and History are exceptions within the group of “difficult”
subjects in Graph 3.2.3 because a relatively small group fails to achieve 30%. The likely
reason for this is that the subjects are indeed relatively easier compared to the rest of the
subjects in this group.
In the case of the remaining subjects in this group, about half of the matriculants enrolled for
them could not achieve 40%. Particularly worrying is that about 47% of the learners who sat
the Mathematics exam, and nearly 40% of the learners who sat the Physical Science exam
could not even achieve 30%.
The graphs here above show the results of matriculants in relation to the size of the groups
of learners who took the exams, but it is also relevant to analyse the absolute numbers of
24
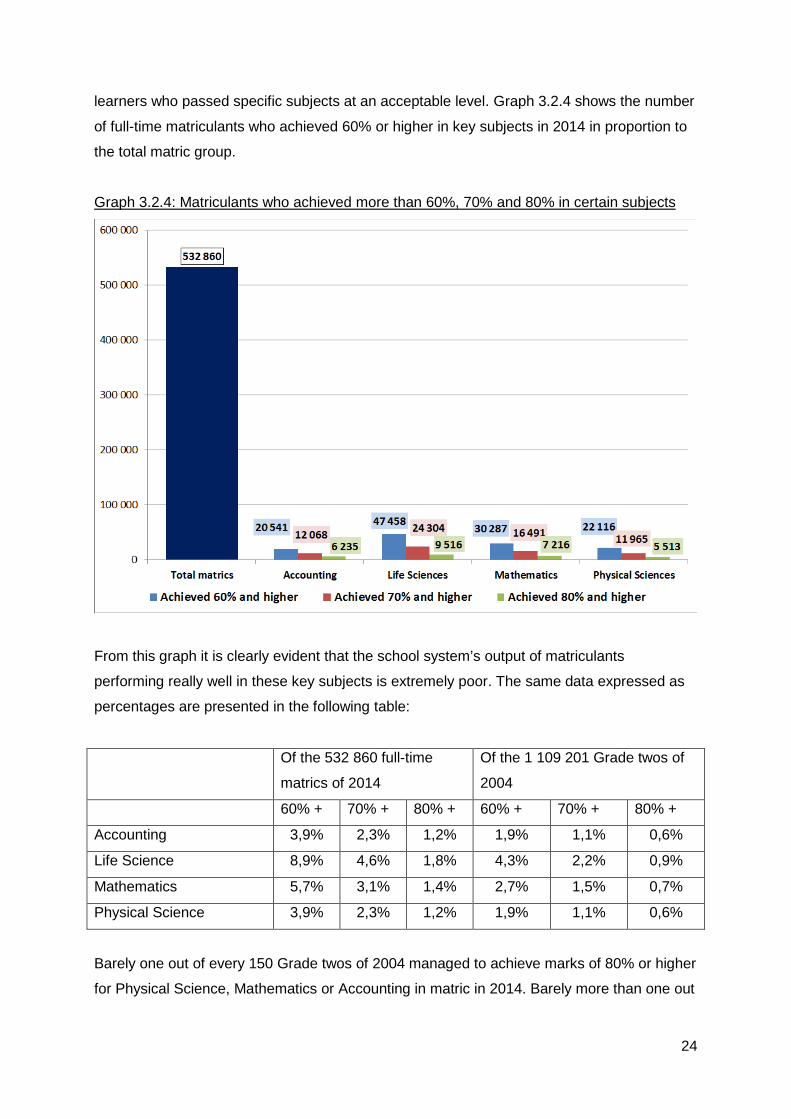
learners who passed specific subjects at an acceptable level. Graph 3.2.4 shows the number
of full-time matriculants who achieved 60% or higher in key subjects in 2014 in proportion to
the total matric group.
Graph 3.2.4: Matriculants who achieved more than 60%, 70% and 80% in certain subjects
From this graph it is clearly evident that the school system’s output of matriculants
performing really well in these key subjects is extremely poor. The same data expressed as
percentages are presented in the following table:
Of the 532 860 full-time
matrics of 2014
Of the 1 109 201 Grade twos of
2004
60% + 70% + 80% + 60% + 70% + 80% +
Accounting 3,9% 2,3% 1,2% 1,9% 1,1% 0,6%
Life Science 8,9% 4,6% 1,8% 4,3% 2,2% 0,9%
Mathematics 5,7% 3,1% 1,4% 2,7% 1,5% 0,7%
Physical Science 3,9% 2,3% 1,2% 1,9% 1,1% 0,6%
Barely one out of every 150 Grade twos of 2004 managed to achieve marks of 80% or higher
for Physical Science, Mathematics or Accounting in matric in 2014. Barely more than one out

25
of every 100 could achieve marks of 70% in these subjects. Even with the threshold for
“good performance” being lowered to 60% the situation is not much better.
Despite the recurring official euphoria over pass rates the abovementioned dismal
percentages constitute the school system’s output year after year. From this tiny pool of
matriculants every year’s intake of highly skilled people such as auditors, engineers, doctors
and people in other technical fields must be trained. While this is good news for the
matriculants who find themselves in this small group as their skills are in demand, overall it is
bad news for South Africa’s social and economic prospects.
26
4. Conclusion
Without further education, the majority of 2015’s matriculants’ certificates will unfortunately
be of little value. A matric certificate does indeed serve as an administrative requirement for
most types of tertiary studies and is also needed to gain access to some professions. Apart
from that, it is of little practical value. People with a matric certificate do find employment with
a little less difficulty than people who do not have matric, but not nearly as much as the
benefit higher qualifications give. People with a matric certificate who do have work,
generally, do not earn much more than those without matric.
The South African labour market is still not youth friendly, whether the individual concerned
has a matric or not. The modern economy demands more: more knowledge, and the ability
to apply that knowledge.
Those people who will receive their matric certificates in 2016 and who want to start working
immediately will probably struggle to find a job – especially one that offers good
remuneration. Of course, this is not meant to discourage young people from job hunting for
whatever jobs are available. Any job is better than being idle. The best option, however, is to
further one’s education. Even people who failed matric and who have no appetite for
repeating it could still obtain further education because post-school training needn’t only be
at a university. A certificate or diploma in many technical and career-orientated fields,
obtained from a credible institution, may be even more valuable than a matric certificate.


