
MEAM-446-2012-02 page 1 Copyright © 2012 by the authors
MEAM-446-2012-02 Senior Design Project - Final Report April 26, 2012
Department of Mechanical Engineering and Applied Mechanics School of Engineering and Applied Science
The University of Pennsylvania Philadelphia, Pennsylvania, USA
ROWTEK
Mylo Cheng Roshan Rai Matthew Siedman
Megan Weil Andrew Windler
Bruce Kothmann faculty advisor
Robert L. Jeffcoat PhD instructor
Department of Mechanical Engineering and Applied Mechanics, University of Pennsylvania
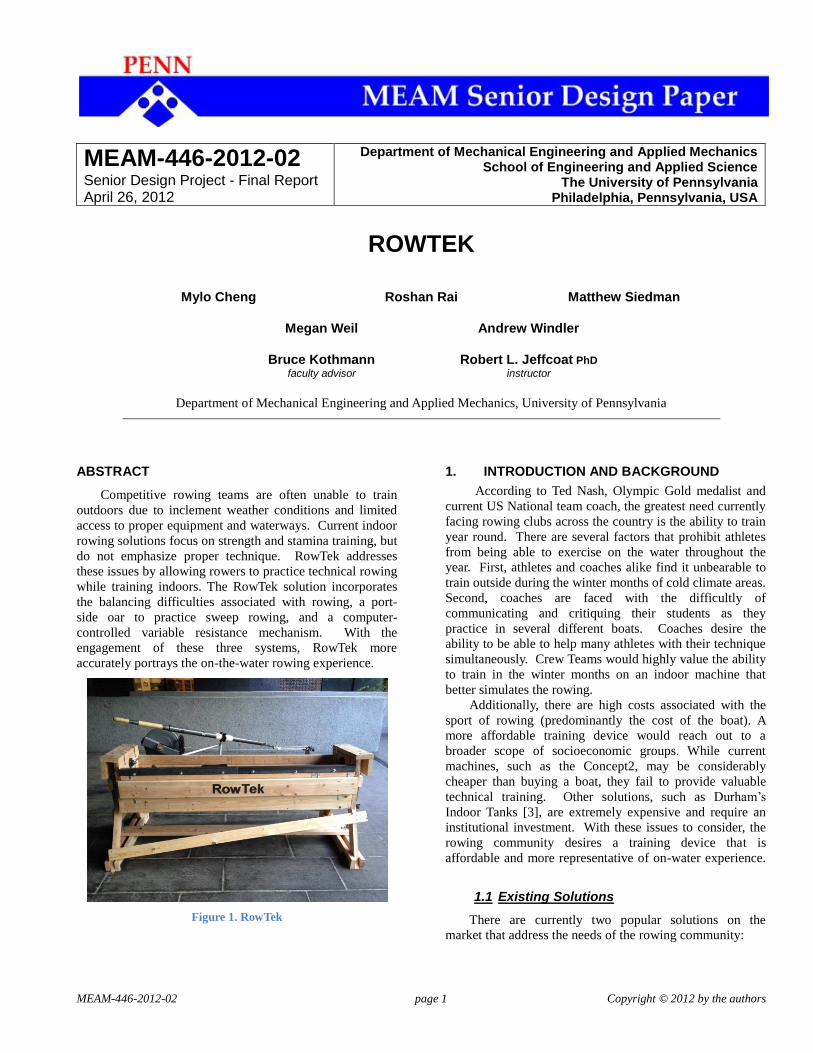
ABSTRACT
Competitive rowing teams are often unable to train
outdoors due to inclement weather conditions and limited
access to proper equipment and waterways. Current indoor
rowing solutions focus on strength and stamina training, but
do not emphasize proper technique. RowTek addresses
these issues by allowing rowers to practice technical rowing
while training indoors. The RowTek solution incorporates
the balancing difficulties associated with rowing, a port-
side oar to practice sweep rowing, and a computer-
controlled variable resistance mechanism. With the
engagement of these three systems, RowTek more
accurately portrays the on-the-water rowing experience.
Figure 1. RowTek
1. INTRODUCTION AND BACKGROUND
According to Ted Nash, Olympic Gold medalist and
current US National team coach, the greatest need currently
facing rowing clubs across the country is the ability to train
year round. There are several factors that prohibit athletes
from being able to exercise on the water throughout the
year. First, athletes and coaches alike find it unbearable to
train outside during the winter months of cold climate areas.
Second, coaches are faced with the difficultly of
communicating and critiquing their students as they
practice in several different boats. Coaches desire the
ability to be able to help many athletes with their technique
simultaneously. Crew Teams would highly value the ability
to train in the winter months on an indoor machine that
better simulates the rowing.
Additionally, there are high costs associated with the
sport of rowing (predominantly the cost of the boat). A
more affordable training device would reach out to a
broader scope of socioeconomic groups. While current
machines, such as the Concept2, may be considerably
cheaper than buying a boat, they fail to provide valuable
technical training. Other solutions, such as Durham’s
Indoor Tanks [3], are extremely expensive and require an
institutional investment. With these issues to consider, the
rowing community desires a training device that is
affordable and more representative of on-water experience.
1.1 Existing Solutions
There are currently two popular solutions on the
market that address the needs of the rowing community:

MEAM-446-2012-02 page 2 Copyright © 2012 by the authors
1. Traditional Indoor Rowers – The traditional
indoor rower has roots stemming to the mid 19th
century. However, it was not until the early
1900s that rowing machines would be mass-
produced by a company called Narragansett
Machine Company and used by crew teams
across the country. In the 1960s, the rowing
machine was improved with the invention of the
ergometer, a machine that measured the work
capacity of the rower. The ergometer uses straps
and a fly wheel device to model the rowing
experience. Typically, either a friction brake
mechanism or a wheel fitted with plastic paddles
is used to create resistance for the athlete to
measure against [2]. Machines today are built in
a variety of styles. They can differ in type of
resistance, stationary vs. sliding seat/foot
attachment, and type of handlebar. Most
machines provide athletes with a monitor to
gauge distance, speed, pace, calories burned,
watts produced, and occasionally heart rate [1].
2. Indoor Tanks – The indoor rowing tanks are less
common forms of equipment used by athletes.
Indoor rowing tanks consist of a platform, oars,
seats, and two tanks full of water. Athletes
(typically 2 to 16) sit on sliding seats mounted
atop the platform. The oars are positioned to
move through the water in the tanks as the athlete
takes his/her stroke. Indoor rowing tanks are
typically custom designed and are extremely
expensive. While these devices more accurately
represent the stroke technique than the ergometer,
they still fail to portray buoyancy and balance
effects. Additionally, the water speed in the tank
has little correlation to the actual average speed in
a boat, making it hard for one to gauge athlete
improvement and development. Moreover, the
turbulence created when rowing in a water tank
does not represent real on-water conditions,
altering the feel an athlete has for the stroke [3].
The description of these existing products alone reveals
several limitations in current designs. No indoor product
has successfully reached a proper balance of cost and
technical accuracy. Indoor tanks seem to provide rowers
with better technique training, but are so expensive that
only the top rowing clubs in the country can afford to install
them. Traditional indoor rowers are a much more practical
solution in terms of price, but lack the technical accuracy
that is required for coaches to teach technique. In fact, in
the paper “Comparison of On-Water Rowing with its
Simulation on Concept2 and ROWPERFECT Machines,”
Dr. Valery Kleshnev reports his findings when testing the
technical accuracy of two popular existing products: the
Concept2 and the ROWPERFECT. The Concept2 was the
most popular training machine in the late 1990s and early
2000s. The ROWPERFECT simulator addressed some
issues with the Concept2, such as increased probability of
knee and low back injury due to stationary foot-rests. Dr.
Kleshnev concluded that the forces and motion of the rower
stationed in the machines is extremely different than those
experienced on the water and affect the rowers’ motor
control pattern and rowing technique. He then went on to
claim that rowing on the water and rowing on a machine are
two very different kinds of exercise. Dr. Kleshnev’s work,
as well as the analysis of existing solutions, has led toward
the recognition of the need for a better indoor rowing
simulator for year round training.
2. REQUIREMENTS AND OBJECTIVES
After understanding both the needs that exists in the
rowing community and the existing products that try to
satisfy such needs, our team developed the following
requirements and objectives:
The RowTek solution must:
a. Replace the handle of a standard erg with a side-
mounted oar, which will be free to rotate about a
fixed oar-lock
b. Accurately portray the “sweeping motion” present
in rowing rather than the linear motion that exists
in more current designs
c. Simulate the forces on an oar that are felt by a
rower during on-the-water rowing
d. Allow the rower to roll laterally in order to portray
the balancing effects of being in a boat
e. Be robust in order to protect the safety of the user
The RowTek solution should:
a. Be portable in order to allow the machine to be
transported between rooms
b. Prevent the user from experiencing extreme angles
of roll
3. CANDIDATE CONCEPTS
Among the variety of formats under consideration for
the final report, the following candidates emerged as
distinct, realistic options:
Pool Mounting System – A mounting system that
connects a boat to the side of a pool. A spring and
damper system, or hydraulic system, would be used
to simulate the on-the-water forces.
Floating Platform – Similar to the pool mounting
system except a platform would be built as opposed to
using an actual boat.
Modified Ergometer – A standard concept II ergometer
will be modified such that it will have a variable
resistance mechanism, be able to roll, and require the user
to row using a “sweep” motion
MEAM-446-2012-02 page 3 Copyright © 2012 by the authors
3.1 Comparison and downselection
After coming up with several distinct design concepts,
we decided to narrow our focus to the modified ergometer.
We believe this is the most feasible project possible given
our constraints and knowledge. The main issue for both the
floating platform and pool mounting system design is that
they both involve the extensive use of water in the testing
process. Designing a system that has to sit in the water has
a variety of issues. During a typical stroke a boat travels
very large distances. Because of this the boat or platform
would need to have ample room in the pool to operate.
Also, at the end of each stroke the system would have to be
returned to its initial state at the edge of the pool. This has
the following problems:
1. The water will all be rushing in one direction
while the boat/platform would need to go back the
other way. If we were able to make the boat return
to initial state that would have an adverse affect on
the flow of water.
2. It is unlikely the boat could gently be returned to
its initial state (since the second stroke would
occur shortly after the first stroke). This indicates
that the boat would likely have to experience a
large force, which would jerk it back to the initial
position. Obviously this type of motion would not
realistically simulate what it is like to row in the
open water.
The modified ergometer concept exhibits none of the issues
involved in both the floating platform design and the pool
mounting system. It is convenient that it will be a machine
that remains in place since it will take up less room and be
more portable. Also, since it does not involve water we will
be able to replicate the forces on a boat by using a variable
resistance mechanism (magnetic particle brake) to control
the resistance against the rower. Similar to the previous
designs this machine will make the user replicate the actual
sweeping rowing motion (as opposed to the horizontal
motion that exists in almost all of the common rowing
machines). It is also significantly easier to test as the
machine can be used anywhere while we would have to
gain exclusive access to a pool to verify the other designs.
All three designs should accurately reflect the balancing
effects that occur in water and ensure the user is practicing
the motion required when actual rowing. However, the
modified ergometer concept has a higher chance of being
successful since it does not have to deal with the problems
that come from working with water.
Table 1 shows a comparison between these three designs.
Table 1 Documentation options
4. DESIGN DESCRIPTION 4.1 RowTek Design Concept
RowTek works through the combination of several
subsystems:
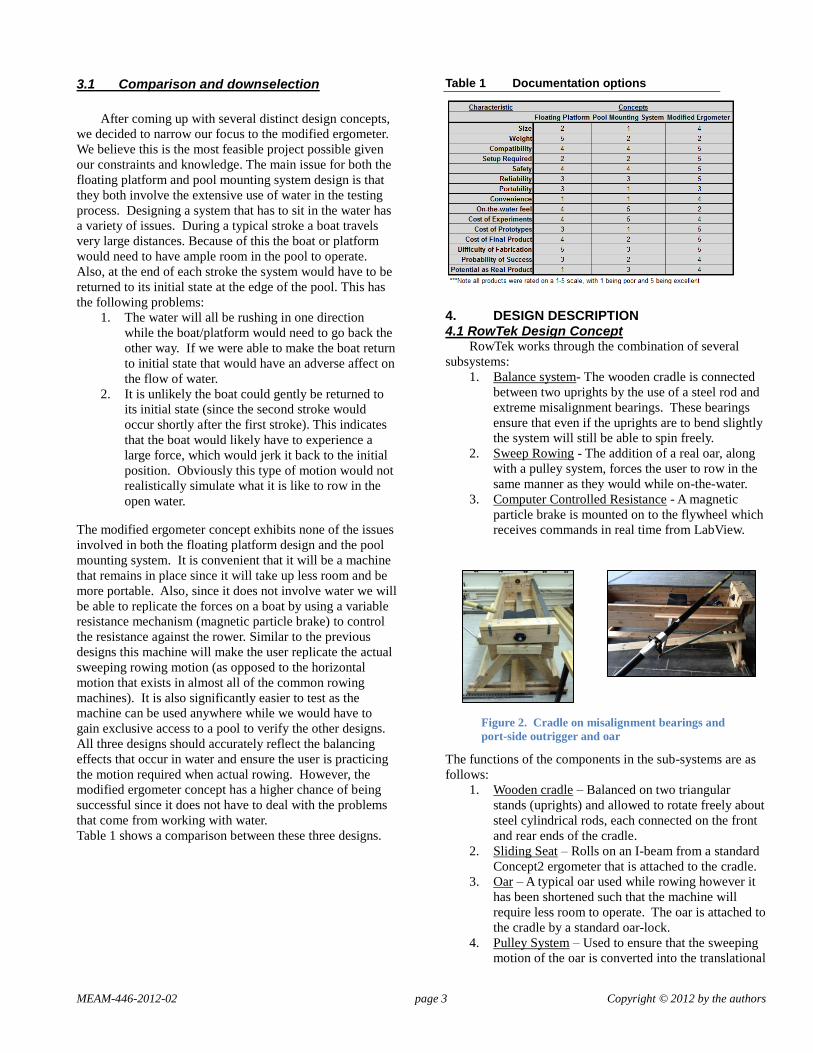
1. Balance system- The wooden cradle is connected
between two uprights by the use of a steel rod and
extreme misalignment bearings. These bearings
ensure that even if the uprights are to bend slightly
the system will still be able to spin freely.
2. Sweep Rowing - The addition of a real oar, along
with a pulley system, forces the user to row in the
same manner as they would while on-the-water.
3. Computer Controlled Resistance - A magnetic
particle brake is mounted on to the flywheel which
receives commands in real time from LabView.
The functions of the components in the sub-systems are as
follows:
1. Wooden cradle – Balanced on two triangular
stands (uprights) and allowed to rotate freely about
steel cylindrical rods, each connected on the front
and rear ends of the cradle.
2. Sliding Seat – Rolls on an I-beam from a standard
Concept2 ergometer that is attached to the cradle.
3. Oar – A typical oar used while rowing however it
has been shortened such that the machine will
require less room to operate. The oar is attached to
the cradle by a standard oar-lock.
4. Pulley System – Used to ensure that the sweeping
motion of the oar is converted into the translational
Figure 2. Cradle on misalignment bearings and
port-side outrigger and oar

MEAM-446-2012-02 page 4 Copyright © 2012 by the authors
motion of the flywheel chain.
Involves four contact points and two
pulleys. One pulley with a custom
made aluminum pulley block to
accommodate the design is attached
to the end of the oar. Another pulley
with steel bearings is fastened to a U-
bolt on vertical steel square tubing.
This pulley sits on the bow end of the
cradle and is fixed directly opposite
the flywheel. A steel ball joint rod
end connects the pulley system to
the end of the oar. This smoothly rotating rod end
ensures that the rower can feather/rotate the oar
freely from any position.
5. LabView – A system design platform and
development environment for a visual
programming language from National
Instruments. It is commonly used for real time
data acquisition, instrument control and industrial
automation, all of which form the backbone of
RowTek’s modulated resistance mechanism. The
program performs a number of functions for
RowTek including receiving voltage signals from
the two primary sensors, filtering the signals, using
signal to calculate boat speed and oar speed,
deriving the ideal drag force on oar, and outputting
the corresponding voltage to the brake. A diagram
of the code and a flow chart of the process are
shown in Appendix B. The force output by the
code is based on the following drag force equation.
This force output is one of the major features that
differentiates RowTek as a indoor training device.
No current training device takes vboat into account
when outputting a resistance.
6. Proximity Sensor – To detect the RPM of the
flywheel, a proximity sensor with three permanent
magnets embedded in the flywheel is used. Upon
detection of a changing magnetic flux, a current is
induced in the solenoid sensor and a voltage signal
is collected for processing in Labview.
7. DC Motor – A 9V Technic
LEGO DC motor is used to
detect the position and speed
of the oar. When the motor
shaft is rotated in a positive
direction during the drive, a
purely positive voltage
signal is collected in Labview.
When the motor is rotated in
the opposite direction during the recovery, a purely
negative voltage signal is collected in Labview. In
this way, we are able to obtain a clear indication of
whether the rower was in the drive or the recovery.
The magnitude of the signal is proportional to the
angular speed of the sprocket, and thus is
proportional to the linear speed of the chain.
8. Force Sensor – There is no force sensor integrated
into the current prototype. However, an explicit
force measurement in the system may allow for
simplified software code and faster reaction times
from the resistance mechanism. A load cell
integrated into the chain or a series of strain
gauges on the oar could serve such a purpose.
9. External PCI Boards – Two PCI boards are used in
the system to connect the sensor inputs and the
brake outputs to the computer. One PCI board
accepts the voltage spikes of the proximity sensor
on the flywheel and outputs a voltage to the brake.
Another PCI board is used to accept the voltage
generated by the DC motor.
10. Modified Flywheel – This is
the base resistance mechanism
of the device. The blades of the
original flywheel are removed
(such that it is merely a flat
circular disk) to minimize its
moment of inertia and air drag
resistance. This ensures that the
air drag resistance and the
moment of inertia of the
flywheel are no longer the
dominant opposing forces
during each stroke.
11. Magnetic Particle Brake – The
Montalvo PB-12 brake applies a
torque to the flywheel based on
the voltage output by Labview.
The acceleration of the flywheel signals help
control when to engage the brake (during the
drive) and when not to (during the recovery). The
speed (rpm) signals obtained
from the magnets are
correlated to the speed of the
boat. The combined
information from these signals
allows us to control the
voltage output to the brake
using LabView. Since the
current given to the brake is
proportional to the torque
applied by the brake, the resistance felt by the
rower during the full length of the stroke can be
modulated to simulate on-the-water rowing.
12. Overall Unique Features of RowTek – computer-
controlled resistance, sweep motion and feathering
capability of the oar (has no effect on force exerted
by brake at this time, but it is still possible to do
so), ability to roll from side to side.
4.2 Operation To operate RowTek, the user will sit on the sliding
seat and simulate strokes as if he or she was on the water.
Figure 3. Steel Ball
Joint and Custom
Pulley on Oar
Figure 4. DC motor
connected to flywheel
Figure 5. Flywheel
modified for brake
Figure 6. Torque vs
current for brake [4]

MEAM-446-2012-02 page 5 Copyright © 2012 by the authors
The force applied during each stroke will cause the
flywheel to accelerate and thus cause the rower to either
gain or lose speed. While using the device the cradle will
have the ability to rotate from side to side to simulate the
roll of a boat while in water. Voltage signals generated by
the three magnets attached to the flywheel will be detected
in LabView to determine the instantaneous angular speed
(in rpm) and acceleration of the flywheel. This data will
then be used to manipulate the voltage output to the brake.
Thus, the resistance of the flywheel and brake system will
be constantly adjusting based on the inputs to and outputs
from the LabView program to simulate on-the-water
resistance.
5. PROTOTYPE REALIZATION
Most of our previously discussed design concepts were
realized in the final prototype. A robust cradle was built
which can freely rotate. This cradle has been tested with
rowers that weigh up to 250lbs. A port-side oar was
effectively integrated into the system through a pulley
system with four contact points. Lastly, a brake was
programmed in such a way that it reacts to the rower’s input
with simulated on-the-water forces. In creating these
systems, a few adjustments had to be made to achieve our
final goal of better simulating rowing in water, which are as
follows:
1. Purely mechanical balance system – We initially
intended to integrate the balance system into our
computer controls, so that the stability of the rower
was directly proportional to the speed of the
simulated boat. Unfortunately due to time and
financial constraints, we were unable to implement
a varying stability mechanism into the cradle.
Instead, we fixed the stability of the cradle at a
point which emulates the stability of an eight boat
moving at a moderate pace.
2. Limit on the angle of rotation – Our initial
prototypes did not successfully limit the rotation of
the cradle. If the user pushed all of their weight to
one side it would rock violently in that direction.
We solved this problem by horizontally placing a
piece of wood on each of the triangular uprights
(such that when the cradle rotated approximately
10 in either direction it would collide with the
stop and be prevented from rotating more).
3. Resolution/timing trade-off with RPM sensor — A
typical rowing stroke lasts about 0.5 seconds for
the drive and 0.5 seconds for the recovery. Since in
this short time interval the force ranges from 0-600
N, we required data from the sensors every 10 ms
and that we could send an output to the brake
every 10 ms. With the proximity sensor collecting
three peaks per revolution, a RPM range of 0-800
corresponded in Labview to a range of 0-4 peaks
per 10ms. Given this discretization of the RPM
data, we were unable to obtain sufficient resolution
of the data for collection time intervals under 1s.
As a result, we lost the timing that was required
(10ms) to appropriately engage the brake. It was
crucial to collect data more quickly to know at
what point the rower was in the stroke so that we
could engage the brake with variable resistance
during the drive and disengage the brake during
the recovery.
4. Improved sensors–We attempted to modify the
RPM sensor and add several new sensors to
resolve the resolution/timing trade-off. An
accelerometer solution proved untenable as a result
of the inconsistent human input into the system.
The Arduino-based accelerometers used for testing
were too sensitive to uneven acceleration by the
rower. Other sensor solutions were attempted.
Our final solution was to attach a DC motor to the
shaft that was directly connected to the chain and
sprocket of the flywheel. With this second sensor,
we could collect stroke position data and
determine the chain velocity every 10 ms to
engage and disengage the brake. In the future, it
may be beneficial to add a load cell into the system
to detect force exerted by the rower explicitly.
6. EVALUATION AND TESTING
Extensive testing was done on all three of
RowTek’s systems during and after construction/assembly.
Balance System
The cradle system was tested for stability and
friction in the rotational motion. Through this testing, it
was determined that approximately 24 pounds of weight
needed to be added to the starboard-side of the cradle to
compensate for the weight of the oar and outrigger on the
port-side of the cradle. We accomplished this by adding 8 ft
of steel trim and one 8 foot piece of 2x6 wood to the
starboard wall of the cradle. The addition of this weight
had the effect of making the cradle evenly balanced and
more stable. Despite this increased stability, the cradle still
roughly emulates the stability of an eight boat moving at a
moderate pace.
Sweep Motion Several current and former rowers were used as
test subjects on the RowTek to ensure the sweep motion
was natural and to ensure the pulley system could
accommodate rowers of different lengths. No major
problems arose during these tests. In addition, physical
tests were run on the pulley system to ensure that all points
in the multi-layered system could handle repetitive loading
and impulse forces up to 200lbs. During this testing, it was
discovered that one of the rod ends at the end of the oar was
twisting while in use. The team decided to stop this
twisting motion in order to reduce the friction added by the
pulley system. A new design was implemented where a nut
was used to tighten down the rod end.
One of the weaknesses in our final design is that

MEAM-446-2012-02 page 6 Copyright © 2012 by the authors
the oar will sometimes slip through the oarlock at the finish
(end of stroke) for shorter rowers. This is due to the force
applied by the pulley system in the port to starboard
direction if the distance between the cradle and the flywheel
system is not adjusted properly. The distance between the
cradle and the flywheel can be easily adjusted with a
wrench, and ideally this adjustment would be made for each
rower based on their physique. However, it is not
convenient to have this requirement when multiple rowers
are using the machine sequentially. Computer Controlled Resistance
The team exerted its most extensive evaluation and
testing efforts on the resistance mechanism. Much
calibration and testing had to be done to develop the
Labview code. The brake needed to be calibrated to so that
the ideal “force” outputted by the code could be translated
into a voltage (0-10V) to be applied across the brake. Prior
to testing we knew that the torque of the brake was
proportional to the voltage applied, but we did not know the
equation that governed this relationship. Our first test was
a static calibration test. The brake was connected to the
flywheel with a steel shaft coupling and set at a constant
voltage. Then a digital hook scale was used to see how
much force was required on the flywheel chain to overcome
the brake’s torque. In this way, we were able to develop the
following experimental equation relating the voltage
applied to the brake and the force applied to the chain. 2
, 6.67 12.76 1.29s frictionF V V
The figure below shows the raw data and the best fit line
from this static calibration.
This static calibration equation was used in the Labview
code, coupled with the dynamic force calculation, to output
a proper voltage to the brake.
Once the team was comfortable with the
progression of the code, we began testing the system to see
how the machine compared to current solutions. Our goal
from the outset of the project was to emulate the on-the-
water resistance, which is often lower than the resistance
output by indoor ergometers at high boat speeds. This
difference in peak resistance is shown in the research
presented in the following chart.
The team decided to run its own tests on the standard
Concept 2 ergometer (with the addition of the RowTek
sensors) to have data to be used for comparison.
Unfortunately the code was not in its final version at the
time of this test. Therefore, the force had to be derived
from a data set of the time locations of each voltage peak of
the proximity sensor. This solution was completed by
sending text files of time locations from Labview to Matlab.
Based on the time locations, we found the average radians
per second of the flywheel between each voltage peak.
Then, this data was used to find the average radians per
second squared between every other voltage peak. The
result of these derivations is the average angular
acceleration data for the flywheel. This data can
theoretically be translated into the force exerted on the
chain by the rower. However, in practice, the team was
unable to determine the mass and moment of inertia of the
objects that the chain is accelerating due to the complexity
of the gear, shaft, and flywheel system which was all tightly
integrated into the Concept 2 machine. As a result, we had
to apply an approximate scale factor to produce the force
curve for this test. We estimate that this scale factor could
be off by ±10%.
The curve produced by this method is somewhat choppy,
but gives a similar shape similar to the Concept 2 curve
Figure 8. Average patterns of biomechanical parameters
of five female rowers at racing speed (32 stokes/min)
Figure 7. Static calibration of brake using fixed voltages
and digital hook scale
Figure 9. Approximate Concept 2 force curve derived from
time location data

MEAM-446-2012-02 page 7 Copyright © 2012 by the authors
shown in the research. The magnitude of the force is lower
than in the research curve, but this was expected since the
research curve was produced by a rower at race pace (32
strokes per minute) whereas our curve was produced at a
training pace (approximately 18 strokes per minute). All of
this was verification to us that our method of deriving the
curve was appropriate, and that our sensors were working
properly.
After successfully running this test, the team
prepared to run a similar test on RowTek. In the interim
period, we were able to make changes to the code which
allowed us to produce live force curves based on the output
of the brake. We now had two methods of producing force
curves. The first method took the time locations of the
proximity sensor voltage peaks to derive the acceleration of
the flywheel. The new method took the “ideal” drag force
calculated in Labview (which controls output to the brake)
and plotted it directly. Below are two graphs which were
derived from the new method.
After analyzing these graphs, we realized that our
resistance mechanism was not working well for faster
strokes. The first graph shows the force output by the brake
in response to someone rowing at a moderate pace, slightly
faster than a training pace. The reason why the curve is not
shaped similarly to the research curves is because the brake
is reacting too slowly to the rower. At the beginning of the
stroke at 0.25s, the rower is exerting a high impulse-like
force. However, the brake does not spike until 0.4s in
reaction to this force. Fundamentally, this delay in the
brake is being caused by the lack of resolution of the
proximity sensor on the flywheel. The sensor hardware on
the final prototype limits the number of voltage peaks to 3
per revolution. This brings us back to the resolution/timing
trade-off. If we want the brake to react quicker, we have to
allow very poor resolution of the simulated “boat speed” or
the rower has to stroke slower.
In the second graph output above, the rower took a
slower stroke. The result is a curve that has more
resemblance to the research curves. However, there are still
problems with this curve as well. There is a large drop off
in brake output right in the middle of the stroke. This is not
ideal, as the rower should experience a smooth drag force
against the oar. These discontinuities in the graphs are
caused by, again, the lack of resolution of the proximity
sensor. The RPM of the flywheel, which is translated into a
theoretical boat speed to calculate ideal drag force, moves
like a stepwise function. This causes the voltage applied to
the brake to be choppy.
As we attempted more tests to try to correct these
issues, we tried the original method of calculating the force
curves from the time locations. Unexpectedly the data
produced from this method was extremely difficult to work
with. The problem was that the lack of resolution of the
proximity sensor was exacerbated by the averaging done to
calculate the velocity and acceleration of the flywheel. The
reason why the method was effective for the Concept 2 test
was because the Concept 2 does not generate the same level
of rotational speed that the RowTek generates. Due to the
length of the RowTek’s lever arm, a 300N pull on RowTek
gets the flywheel spinning faster than a 300N pull on the
Concept 2. This multiplied the negative effects of the
sensor’s low resolution. The graph below shows that the
force calculation from the time location method frequently
falls down to zero or below zero as a result of a lacking of
sufficient quantity of data.
Figure 10. Predicted handle force for moderate training speed
of 22 strokes/min, corresponding to an average flywheel speed
of 600 RPM
Figure 11. Predicted handle force for slow training speeds of 18
strokes/min, corresponding to an average flywheel speed of 330
RPM

MEAM-446-2012-02 page 8 Copyright © 2012 by the authors
It is clear from our testing that our computer
controlled resistance mechanism is effective, but requires
sensors with greater resolution to be successful in perfectly
emulating on-the-water forces. The addition of a force
sensor may be exactly the hardware required to make this
technology a very accurate training tool.
7. DISCUSSION
We believe RowTek is a revolutionary first-of-its-
kind indoor rowing training technology, which offers
distinct advantages for technique training over current
options. RowTek’s balance mechanism and sweep oar offer
the rower the unique opportunity to practice balance and
coordination while off the water. Furthermore the RowTek
computer controlled resistance, with some additional
investment, could become one of the most advanced
technologies to be used as a training tool in world of
athletics. In its current state, RowTek requires more
sophisticated sensors to achieve the split-second reaction
times demanded by the sport of rowing.
There are several updates that could be made to
RowTek in the future, in addition to improving the
hardware and software of the resistance mechanism, to
advance its ability to train athletes for rowing on-the-water.
One great addition to RowTek would be a variable balance
mechanism for the cradle, as our team originally planned to
implement. If a variable resistance mechanism were
included and additional sensors were added to the oar, the
rower could train in a completely computer-controlled
environment. A mechanism could be added to exert forces
on the oar in multiple dimensions. This would allow the
system to simulate a real waterline, crabs, and backsplash.
It would be great if RowTek could eventually be extended
to include multiple rowers sitting in the same cradle and
connected to a resistance mechanism in which the actions
of one rower affected the force on all other rowers.
8. CONCLUSIONS AND RECOMMENDATIONS
After spending extensive time working on and
testing RowTek we believe it to be a significant
improvement for the training of rowers. With the addition
of RowTek rowers are now able to focus on improving their
technique rather than just their strength during the winter
months. However, it is important to note that RowTek is not
yet a completely final design. Several improvements can be
made in future years that would ensure RowTek is the “go-
to” device for all rowers. We would like to see the stability
and thus roll of the boat be a function of speed as was
originally intending. It also would be beneficial to make the
cradle out of a material other than wood such that it is
stronger, easier to work with, easier to transport, and looks
better. Additionally, we would like to have better sensors so
it will be easier to acquire good data to generate force
graphs. We recommend that RowTek be continued at least
through 2013.
9. ACKNOWLEDGEMENTS
The RowTek team would like to thank several
people and groups for their help with the project.
Montalvo, a company which generously donated
us a magnetic particle brake that was used to control the
resistance on the flywheel.
Dr. Bruce Kothmann, Dr. Robert Jeffcoat our
advisor and instructor respectively, who were there to help
us out whenever we had questions and were able to
consistently provide advice.
John Martin, our TA, who helped us extensively with
machining parts that we were unable to do ourselves.
Hitesh Sahoo, who spent a lot of his time working
with us on the LabView code to make the brake respond
appropriately.
Daniel Harbuck, former Penn student, who
provided inspiration for the project.
Many other MEAM professors who were willing
to meet with us and discuss the project and give us ideas.
Figure 12. A series of four RowTek force curves generated by two
different methods

MEAM-446-2012-02 page 9 Copyright © 2012 by the authors
11. REFERENCES
[1] Concept2: The World’s Best Rowing Machine
[Internet]. Indoor Rowers; Available from:
http://www.concept2.com/us/indoorrowers/default.asp
[2] Kleshnev, Valery. Comparison of On-Water Rowing
with its Simulation on Concept2 and ROWPERFECT
Machines [serial on the Internet]. 2011 [cited 2005];
Available from:
http://biorow.org/publ/2005_comparison_of_on_water_row
ing_with_its_simulation_on_concept2_and_rowperfect_ma
chines/1-1-0-17
[3] Durham Boat Company, Inc. [Internet]. Indoor Rowing
Facility; c2011. Available from:
http://www.durhamboat.com/tanks.php
[4] Magnetic Particle Brake – Montalvo PB Series
[Internet]. Montalvo Corporation; Available from:
http://www.montalvo.com/products/tension-brakes/pb-
series-magnetic-particle-brakes/
MEAM-446-2012-02 page 10 Copyright © 2012 by the authors
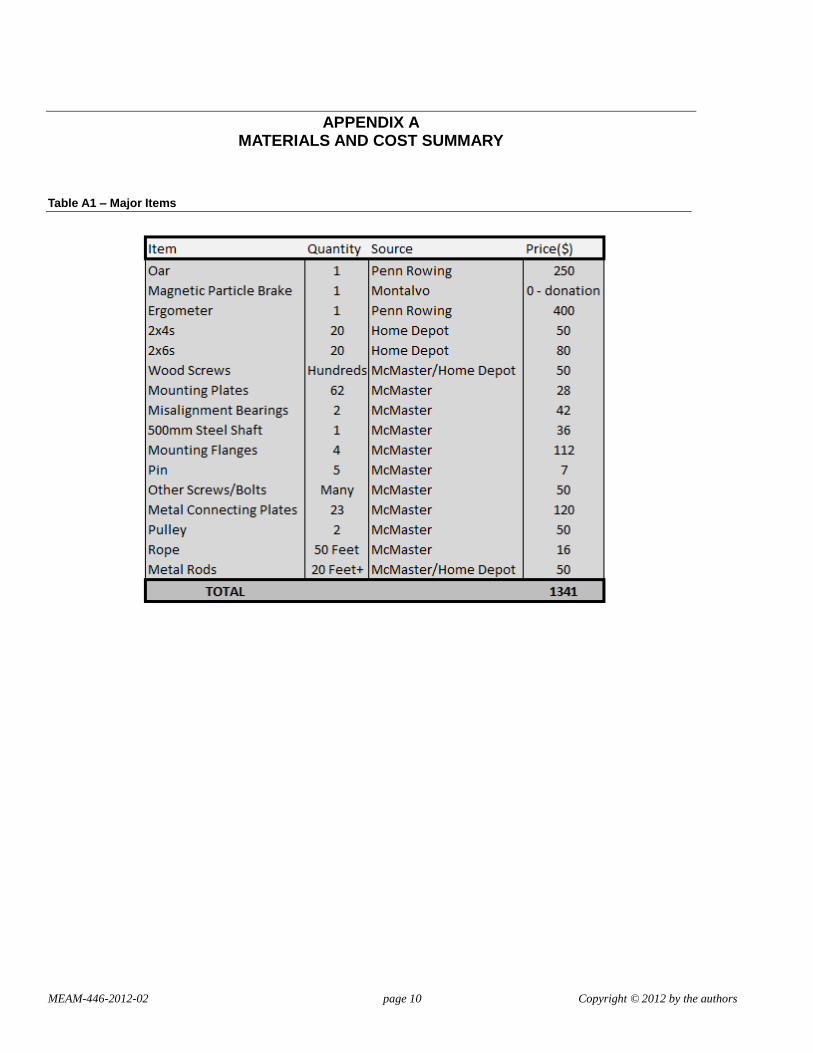
APPENDIX A MATERIALS AND COST SUMMARY
Table A1 – Major Items
MEAM-446-2012-02 page 11 Copyright © 2012 by the authors
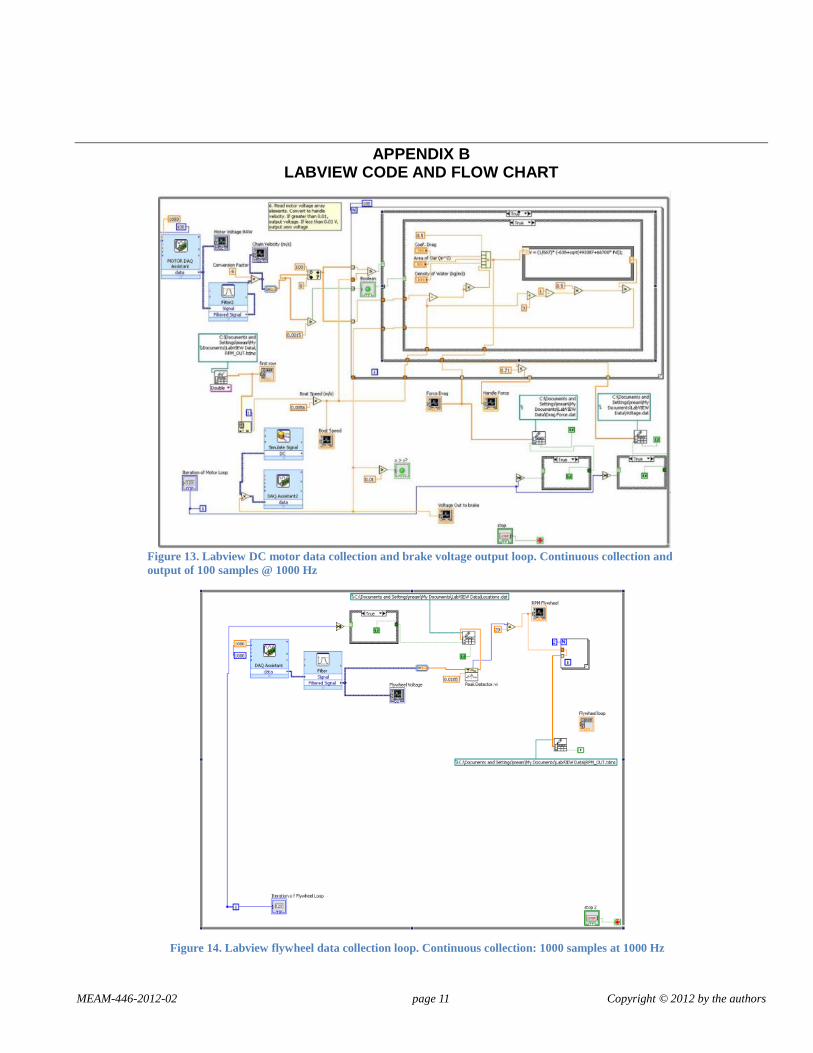
APPENDIX B LABVIEW CODE AND FLOW CHART
Figure 13. Labview DC motor data collection and brake voltage output loop. Continuous collection and
output of 100 samples @ 1000 Hz
Figure 14. Labview flywheel data collection loop. Continuous collection: 1000 samples at 1000 Hz

MEAM-446-2012-02 page 12 Copyright © 2012 by the authors
Figure 15. Flow chart of Labview data processing


