

rosslynrosslynresearch research
Measuring Climate Change Awareness Prepared for West Sussex County CouncilSeptember 2004

2 Measuring Climate Change Awareness – an ESPACE project for West Sussex County Council by Rosslyn Research, August 2004
OBJECTIVES FOR WEST SUSSEX COUNTY COUNCIL
The key role for West Sussex County Councilis to establish the level of awareness and knowledge on climate change issues and develop ways of communicating relevant messages.

3 Measuring Climate Change Awareness – an ESPACE project for West Sussex County Council by Rosslyn Research, August 2004
PROGRAMME FOR WEST SUSSEX COUNTY COUNCIL
The programme of work within West Sussex will consist of 3 parts: STAGE I
An initial evaluation of the current level of community awareness [urban, rural, coastal and business communities] of climate change and its implications for spatial planning.
STAGE IIA series of events [workshops, community meetings, school gatherings] on how climate change awareness and adaptation messages can best be communicated.
STAGE IIIA final evaluation to assess whether community awareness has increased since the initial evaluation and hence the effectiveness of the project programme.
This presentation outlines the top-line findings of Stage I of the programme.

4 Measuring Climate Change Awareness – an ESPACE project for West Sussex County Council by Rosslyn Research, August 2004
WEST SUSSEX COUNTY COUNCIL - METHODOLOGY
Stage I of the programme consisted of three parts:.
1. Focus Groups with different parts of the residential and business community.
2. Quantitative face-to-face sample survey with a representative sample of the residential, farming and business communities.
3. “Control” survey with residents outside West Sussex (Hampshire).
A quantitative postal survey with members of the West Sussex residents’ panel has yet to be conducted.

5 Measuring Climate Change Awareness – an ESPACE project for West Sussex County Council by Rosslyn Research, August 2004
STAGE I/ PART I - METHODOLOGY
Part 1 consisted of 3 focus groups with residents of West Sussex to represent the urban, coastal and rural communities, as well as 8 in-depth interviews with representatives of the business community.
Groups of 2 hours/ interviews of 40 minutes
Findings from focus groups used to ‘shape’ wording and format of questionnaire in Stage I, Part 2

6 Measuring Climate Change Awareness – an ESPACE project for West Sussex County Council by Rosslyn Research, August 2004
STAGE I/ PART I - BRIEF SUMMARY OF FINDINGS
Perceived constituents of climate change are wetter and warmer winters, ‘disturbed’ seasons and hotter summers.
Main perceived effects will be coastal and river flooding, water shortages [water in the ‘wrong place’] and public health problems.
Huge range of awareness by residents and businesses of climate change issues and causes.
Positive side of better weather, sunnier summers, lower heating bills.

7 Measuring Climate Change Awareness – an ESPACE project for West Sussex County Council by Rosslyn Research, August 2004
STAGE I/ PART I - BRIEF SUMMARY OF FINDINGS (cont.)
Generally: “can do very little about it myself”.
Some urban population looking at changes in lifestyle and ‘doing a little’, such as recycling.
Just another problem in a very complicated world.
Weather is ‘out-of-control’, because society is ‘out-of-control’.
“Nothing will happen until there is a huge disaster.”
US [high consumption, emission and industry] is main cause.

8 Measuring Climate Change Awareness – an ESPACE project for West Sussex County Council by Rosslyn Research, August 2004
STAGE I/ PART II - METHODOLOGY
Part 2 of Stage I consist of 1,350 personal interviews with residents and businesses in West Sussex. West Sussex was divided into 4 areas [A 23 corridor/Rural/ Coastal East and Costal West]
1,050 interviews with residents with quotas by age and gender[440 urban/ 370 small town/ 330 rural].
210 interviews with businesses with quotas by 6 industry sectors.
100 interviews with the farming community.
“Control’ sample of 200 residents in Hampshire

9 Measuring Climate Change Awareness – an ESPACE project for West Sussex County Council by Rosslyn Research, August 2004
STAGE I/ PART II - ANALYSIS
Very detailed analysis. Type [business, residential, control and farming]. Gender, age, children, household size and social grade. Location and geography. Home ownership and numbers of cars. Size of business/ farm.

10 Measuring Climate Change Awareness – an ESPACE project for West Sussex County Council by Rosslyn Research, August 2004
SUMMARY OF FINDINGS - CAUSES AND EFFECTS
A number of possible causes and effects of weather and climate change were presented to respondents
Perceived causes of climate change, related to effects of climate change were rated by respondents “out-of-10”.
For causes, ‘1’ indicated that “it has no impact at all on climate change” and ‘10’ that “it is a major cause of climate change”.
For effects, ‘1’ indicated that “it won’t happen or doesn’t matter” and ‘10’ that “it will be a major effect of climate change”.
Therefore, the higher the rating, the more important is the factor as a perceived cause of effect of climate change

11 Measuring Climate Change Awareness – an ESPACE project for West Sussex County Council by Rosslyn Research, August 2004
CAUSES OF CLIMATE CHANGE
“Although there is no perceived single or dominant cause of climate change, cutting down of the rain forest and pollution by industry/ the motor car are seen as key causes.”
7.97 Cutting down of Rain Forest in S. America/ Asia7.54 Pollution caused by Motor Car 7.50 Greenhouse Effect--------------------------------------------------------------------------------7.30 Pollution by Industry6.87 Hole in Ozone Layer6.34 Lack of recycling of Household Waste--------------------------------------------------------------------------------5.84 Building on Flood Plains5.75 Overpopulation5.66 Deforestation in UK

12 Measuring Climate Change Awareness – an ESPACE project for West Sussex County Council by Rosslyn Research, August 2004
CAUSES OF CLIMATE CHANGE
For each factor there are always around 10% of people who rate the factor as having no or little impact [rating of 1, 2 or 3].
Conversely, between 45% and 55% see the factors as a key cause of climate change, rating the factors at 8, 9 or 10.
For virtually all factors we see a pattern by sub-group [example scores are for the most important factor; average 7.97]:• Farmers rate factors much lower than other groups [7.21]• West Sussex residents rate factors slightly above average [8.06]• Businesses rate factors lower, but above farmers [7.45]• The control group of Hampshire [interviewed in urban area] rate the factors highest of all and often by a substantial margin [8.44]
These sub-group differences are statistically significant.

13 Measuring Climate Change Awareness – an ESPACE project for West Sussex County Council by Rosslyn Research, August 2004
EFFECTS OF CLIMATE CHANGE
“Again, we do not see a single or dominant effect of weather and climate change. Floods, Hotter Summers, Wetter Winters and Warmer Winters are closely grouped as main effects.”
6.84 Floods 6.73 Hotter Summers6.74 Wetter Winters6.58 Warmer Winters--------------------------------------------------------------------------------6.11 Droughts5.94 Changes in Agriculture-------------------------------------------------------------------------------- 5.63 New Diseases5.24 Wetter Summers5.23 Changes in Planning Laws

14 Measuring Climate Change Awareness – an ESPACE project for West Sussex County Council by Rosslyn Research, August 2004
EFFECTS OF CLIMATE CHANGE
People are less sure of the effects than of causes, indicated by slightly lower ratings.
We again see a group of around 10% rating these effects at 1,2 or 3, ie. they expect that the effects are unlikely to happen.
The ‘top-box’ of those rating the effects at 8 - 10 tends to be a little lower, which accounts for the overall lower scores.
Sub-sector differences are less marked and not statistically significant.

15 Measuring Climate Change Awareness – an ESPACE project for West Sussex County Council by Rosslyn Research, August 2004
EFFECTS OF CLIMATE CHANGE
The ‘multi-dimensional scaling’ [see charts] shows the groupings of causes and effects.
For the West Sussex [for example] total we see very close correlation between some effects [eg. floods, wetter winters, warmer winters and hotter summers].
Paradoxically, droughts and wetter summers are also closely correlated.
The effects of floods, wetter winters, warmer winters and hotter summers correlated closely to some causes, such as Pollution [industry and motor car], cutting of rain forest, hole in ozone layer and greenhouse effect.
A number of causes appear to be less related to others and to effects. These are building on flood plains, recycling of waste and overpopulation.

16 Measuring Climate Change Awareness – an ESPACE project for West Sussex County Council by Rosslyn Research, August 2004
Multidimensional Scaling
Multidimensional Scaling (MDS) is a technique that assigns each variable a distance from other attributes in the analysis, then places them all on an X-Y axis. It is a statistical visualization method for picturing associations between attributes.
The resulting map shows which attribute are close to other attributes. In practical terms that is similar to correlation.
For ESPACE the maps consist of causes (Q1) and effects (Q2) of weather changes. These two groups tended to group together. Still, the proximity of different issues (e.g.. droughts and hotter summers) is instructive on how groups view upcoming weather changes.
For example, on the following map ‘Changes in planning law’ and ‘Deforestation in the UK’ are close. Also, ‘Cutting down forests in South America’ and ‘hole in the ozone layer’.

17 Measuring Climate Change Awareness – an ESPACE project for West Sussex County Council by Rosslyn Research, August 2004
Cutting down of rain forest in South America and Asia
Hole in the ozone layer
Too much building/ construction on flood plains
Deforestation in the UK
Pollution by industryPollution caused by the motor car
Greenhouse gas emissions/greenhouse effect
Lack of recycling of household wasteOverpopulation
Hotter summersWetter winters
New diseases, e.g. malaria
Droughts
Floods
Changes in planning laws
Changes in agriculture
Wetter summersWarmer winters
Main Causes/Main Effects of Weather ChangesWest Sussex Total
Blue Labels=Main Causes of Climate Change Red Labels=Main Effects of Climate Changes
Causes and effects within proximity show a
high correlation
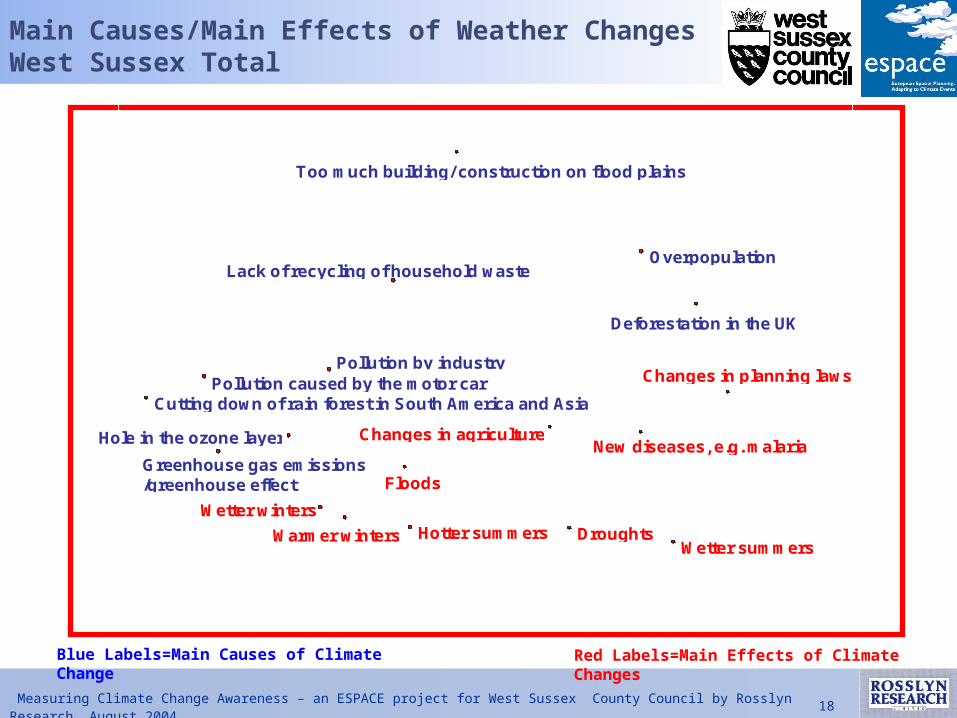
18 Measuring Climate Change Awareness – an ESPACE project for West Sussex County Council by Rosslyn Research, August 2004
Main Causes/Main Effects of Weather ChangesWest Sussex Total
Blue Labels=Main Causes of Climate Change Red Labels=Main Effects of Climate Changes
Cutting down of rain forest in South America and Asia
Hole in the ozone layer
Too much building/ construction on flood plains
Deforestation in the UK
Pollution by industryPollution caused by the motor car
Greenhouse gas emissions/greenhouse effect
Lack of recycling of household wasteOverpopulation
Hotter summersWetter winters
New diseases, e.g. malaria
Droughts
Floods
Changes in planning laws
Changes in agriculture
Wetter summersWarmer winters

19 Measuring Climate Change Awareness – an ESPACE project for West Sussex County Council by Rosslyn Research, August 2004
Hole in the ozone layer
Too much building/ construction on flood plains
Deforestation in the UK
Pollution by industry
Cutting down of rain forestin South America and Asia
Pollution caused by the motor car
Greenhouse gas emissions/greenhouse effect
Lack of recycling of household waste
Overpopulation
Hotter summers
Wetter winters
New diseases, e.g. malaria
Droughts
Floods
Changes in planning laws
Changes in agriculture
Wetter summers
Warmer winters
Main Causes/Main Effects of Weather ChangesControl Group—Hampshire
Blue Labels=Main Causes of Climate Change Red Labels=Main Effects of Climate Changes

20 Measuring Climate Change Awareness – an ESPACE project for West Sussex County Council by Rosslyn Research, August 2004
Main Causes/Main Effects of Weather ChangesWest Sussex Business
Blue Labels=Main Causes of Climate Change Red Labels=Main Effects of Climate Changes
Hole in the ozone layer
Too much building/construction on flood plains
Deforestation in the UK
Pollution by industry
Cutting down of rain forestin South America and Asia
Pollution caused by the motor car
Greenhouse gas emissions/greenhouse effect
Lack of recycling of household wasteOverpopulation
Hotter summers Wetter winters
New diseases, e.g. malaria
DroughtsFloodsChanges in planning laws
Changes in agriculture
Wetter summers
Warmer winters

21 Measuring Climate Change Awareness – an ESPACE project for West Sussex County Council by Rosslyn Research, August 2004
Main Causes/Main Effects of Weather ChangesWest Sussex Farming
Blue Labels=Main Causes of Climate Change Red Labels=Main Effects of Climate Changes
Hole in the ozone layerToo much building/ constructionon flood plains
Deforestation in the UKPollution by industry
Cutting down of rain forest in South America and Asia
Pollution causedby the motor car
Greenhouse gas emissions/greenhouse effect
Lack of recycling ofhousehold waste
Overpopulation
Hotter summers Wetter winters
New diseases, e.g. malaria
Droughts
Floods
Changes in planning laws
Changes in agriculture Wetter summers
Warmer winters

22 Measuring Climate Change Awareness – an ESPACE project for West Sussex County Council by Rosslyn Research, August 2004
Main Causes/Main Effects of Weather ChangesWest Sussex Residential
Blue Labels=Main Causes of Climate Change Red Labels=Main Effects of Climate Changes
Pollution caused by the motor car
Hole in the ozone layer
Too much building/ construction on flood plains
Deforestation in the UK
Pollution by industry
Cutting down of rain forestin South America and Asia
Greenhouse gas emissions/greenhouse effect
Lack of recycling of household waste
Overpopulation
Hotter summersWetter winters
New diseases, e.g. malaria
DroughtsFloods
Changes in planning laws
Changes in agriculture
Wetter summers Warmer winters

23 Measuring Climate Change Awareness – an ESPACE project for West Sussex County Council by Rosslyn Research, August 2004
‘OBSERVED’ CHANGES IN TEMPERATURE
“Although there is a trend, there is no total agreement on changes, such as summer/ winter temperatures ‘observed’ over the last 10 years”.
69% Higher winter temperatures/ lower - 11%Farming:89% Higher winter temperatures/ lower - 1%
65% Higher summer temperatures / lower - 8%

24 Measuring Climate Change Awareness – an ESPACE project for West Sussex County Council by Rosslyn Research, August 2004
‘OBSERVED’ CHANGES IN RAINFALL
“There is less agreement on changes, such as summer/ winter rainfall ‘observed’ over the last 10 years”.
53% Wetter winters / 16% Drier winters
27% Wetter summers/ 36% Drier summers
Business:
18% Wetter summers/ 42% Drier summers

25 Measuring Climate Change Awareness – an ESPACE project for West Sussex County Council by Rosslyn Research, August 2004
‘EXPECTED’ CHANGES IN TEMPERATURE
“Summer/ winter temperatures are ‘expected’ to change more rapidly over the next 10 years than over the last 10”.
65% Higher winter temperatures/ lower - 11%Farming:64% Higher winter temperatures/ lower - 3%
71% Higher summer temperatures / lower - 5%Farming:60% Higher summer temperatures/ lower - 6%

26 Measuring Climate Change Awareness – an ESPACE project for West Sussex County Council by Rosslyn Research, August 2004
‘EXPECTED’ CHANGES IN RAINFALL
“Winter rainfall levels are ‘expected’ to change at about the same rate over the next 10 years than over the last 10. Summers are expected to be much drier”.
53% Wetter winters/ 16% Drier winters
20% Wetter summers/ 48% Drier summersFarming: 13% Wetter summers/ 40% Drier summers

27 Measuring Climate Change Awareness – an ESPACE project for West Sussex County Council by Rosslyn Research, August 2004
EFFECTS ON RESIDENTS AND BUSINESSES
“The majority of residents, businesses and farmers do not think that INCREASED COASTAL FLOODING will affect them”. [scores are ‘out-of-10’/ not affected are scores of 1 -3/ affected are scores of 8 -10]
4.30 Total West Sussex [not affected -45%/ affected - 18%]3.47 Businesses [not affected -59%/ affected - 16%]3.60 Farming [not affected -63%/ affected - 18%]4.30 Residents [not affected -41%/ affected - 19%]

28 Measuring Climate Change Awareness – an ESPACE project for West Sussex County Council by Rosslyn Research, August 2004
EFFECTS ON RESIDENTS AND BUSINESSES
“A, generally small, majority of residents and farmers think that WARMER AND WETTER WINTERS will affect them”. [scores are ‘out-of-10’/ not affected are scores of 1 -3/ affected are scores of 8 -10]
5.45 Total West Sussex [not affected -25%/ affected - 26%]3.69 Businesses [not affected -49%/ affected - 10%]5.82 Farming [not affected -26%/ affected - 37%]5.77 Residents [not affected -20%/ affected - 39%]

29 Measuring Climate Change Awareness – an ESPACE project for West Sussex County Council by Rosslyn Research, August 2004
EFFECTS ON RESIDENTS AND BUSINESSES
“A small majority of residents and farmers think that WARMER AND WETTER SUMMERS will affect them”. [scores are ‘out-of-10’/ not affected are scores of 1 -3/ affected are scores of 8 -10]
5.43 Total West Sussex [not affected -25%/ affected - 26%]4.43 Businesses [not affected -42%/ affected - 20%]6.09 Farming [not affected -28%/ affected - 38%]5.57 Residents [not affected -22%/ affected - 25%]

30 Measuring Climate Change Awareness – an ESPACE project for West Sussex County Council by Rosslyn Research, August 2004
EFFECTS ON RESIDENTS AND BUSINESSES
“Businesses think that INCREASED RIVER FLOODING will not affect them greatly”. [scores are ‘out-of-10’/ not affected are scores of 1 -3/ affected are scores of 8 -10]
4.75 Total West Sussex [not affected - 54%/ affected - 13%]3.55 Businesses [not affected - 60%/ affected - 13%]4.46 Farming [not affected - 52%/ affected - 24%]5.00 Residents [not affected - 33%/ affected - 12%]

31 Measuring Climate Change Awareness – an ESPACE project for West Sussex County Council by Rosslyn Research, August 2004
EFFECTS ON RESIDENTS AND BUSINESSES
“BETTER WEATHER will mainly affect residents”. [scores are ‘out-of-10’/ not affected are scores of 1 -3/ affected are scores of 8 -10]
5.47 Total West Sussex [not affected - 26%/ affected - 26%]4.76 Businesses [not affected - 38%/ affected - 25%]4.82 Farming [not affected - 43%/ affected - 25%]5.66 Residents [not affected - 21%/ affected - 25%]

32 Measuring Climate Change Awareness – an ESPACE project for West Sussex County Council by Rosslyn Research, August 2004
EFFECTS ON RESIDENTS AND BUSINESSES
“WATER SHORTAGES will affect everyone”. [scores are ‘out-of-10’/ not affected are scores of 1 -3/ affected are scores of 8 -10]
6.34 Total West Sussex [not affected - 14%/ affected - 39%]4.82 Businesses [not affected - 36%/ affected - 23%]6.60 Farming [not affected - 18%/ affected - 42%]6.62 Residents [not affected - 13%/ affected - 41%]

33 Measuring Climate Change Awareness – an ESPACE project for West Sussex County Council by Rosslyn Research, August 2004
EFFECTS ON RESIDENTS AND BUSINESSES
“LESS PREDICTABLE WEATHER PATTERNS will affect everyone to a greater or lesser degree”. [scores are ‘out-of-10’/ not affected are scores of 1 -3/ affected are scores of 8 -10]
6.12 Total West Sussex [not affected - 15%/ affected - 33%]4.63 Businesses [not affected - 34%/ affected - 15%]6.04 Farming [not affected - 13%/ affected - 31%]6.41 Residents [not affected - 12%/ affected - 37%]

34 Measuring Climate Change Awareness – an ESPACE project for West Sussex County Council by Rosslyn Research, August 2004
EFFECTS ON RESIDENTS AND BUSINESSES
“Most people will be affected by HIGHER INSURANCE PREMIUMS”. [scores are ‘out-of-10’/ not affected are scores of 1 -3/ affected are scores of 8 -10]
6.09 Total West Sussex [not affected - 23%/ affected - 38%]5.94 Businesses [not affected - 21%/ affected - 33%]5.89 Farming [not affected - 25%/ affected - 34%]6.14 Residents [not affected - 23%/ affected - 40%]

35 Measuring Climate Change Awareness – an ESPACE project for West Sussex County Council by Rosslyn Research, August 2004
EFFECTS ON RESIDENTS AND BUSINESSES
“CHANGES IN AGRICULTURE may not have a great affect on people, including farmers”. [scores are ‘out-of-10’/ not affected are scores of 1 -3/ affected are scores of 8 -10]
5.09 Total West Sussex [not affected - 27%/ affected - 20%]3.91 Businesses [not affected - 40%/ affected - 7%]5.00 Farming [not affected - 28%/ affected - 18%]5.32 Residents [not affected - 24%/ affected - 23%]

36 Measuring Climate Change Awareness – an ESPACE project for West Sussex County Council by Rosslyn Research, August 2004
EFFECTS ON RESIDENTS AND BUSINESSES
“HIGHER FUEL PRICES will affect most segments almost equally”. [scores are ‘out-of-10’/ not affected are scores of 1 -3/ affected are scores of 8 -10]
6.58 Total West Sussex [not affected - 21%/ affected - 48%]6.40 Businesses [not affected - 16%/ affected - 49%]6.39 Farming [not affected - 16%/ affected - 39%]6.63 Residents [not affected - 22%/ affected - 51%]

37 Measuring Climate Change Awareness – an ESPACE project for West Sussex County Council by Rosslyn Research, August 2004
EFFECTS ON RESIDENTS AND BUSINESSES
“HIGHER FUEL PRICES will affect most segments almost equally”. [scores are ‘out-of-10’/ not affected are scores of 1 -3/ affected are scores of 8 -10]
6.58 Total West Sussex [not affected - 21%/ affected - 48%]6.40 Businesses [not affected - 16%/ affected - 49%]6.39 Farming [not affected - 16%/ affected - 39%]6.63 Residents [not affected - 22%/ affected - 51%]

38 Measuring Climate Change Awareness – an ESPACE project for West Sussex County Council by Rosslyn Research, August 2004
Factor Analysis
For ESPACE, we looked at Question 11—”How much will you or your business be affected by Weather and Climate Changes” to ascertain how respondents in West Sussex group effects of weather changes.
Respondents can be grouped into one of the four factors that emerged. The analysis produces a variable for each factor by a regression method.
Each respondent receives a score (actually a correlation) for each of the four new variables.
Respondents are placed into the ‘group’ in which their factor score is the highest. This is called a Q-factor cluster analysis.

39 Measuring Climate Change Awareness – an ESPACE project for West Sussex County Council by Rosslyn Research, August 2004
Factor Analysis
How Much Will You or Your Business be Affected by Weather and Climate Changes
Question 11—How Much Will Your Business by Affected by Weather and Climate Changes
West Sussex Total
Factor1 Factor2 Factor3 Factor4
Higher fuel prices 0.81 0.10 0.01 0.03
Higher insurance premiums 0.77 0.20 -0.02 0.12
Lower heating costs due to warmer winters 0.76 0.02 0.25 0.03
Advantages to agriculture in the UK 0.69 0.09 0.29 0.06
Deterioration in health due to wetter and warmer winters 0.69 0.27 0.13 0.14
Hosepipe bans 0.56 0.40 0.04 0.12
More people taking summer holidays on the South Coast 0.51 -0.09 0.31 0.42
Increased risk of severe storms 0.22 0.83 0.15 0.18
Greater fluctuation/changes in weather patterns 0.07 0.75 0.29 0.24
Water shortages 0.45 0.63 0.19 0.13
Better weather 0.41 0.17 0.75 0.01
Warmer and drier summers 0.22 0.30 0.75 0.27
Warmer and wetter winters -0.16 0.43 0.61 0.41
Increased coastal flooding 0.09 0.18 0.10 0.88
Increased river flooding 0.16 0.32 0.16 0.76
SizePercenta
geFactor1 359 27Factor2 309 23Factor3 280 21Factor4 409 30Total 1357 100
This is the resulting factor solution, showing four groups
of effects that people will think will happen together
This a frequency of the four clusters that emerged from
the Q-factor solution.

40 Measuring Climate Change Awareness – an ESPACE project for West Sussex County Council by Rosslyn Research, August 2004
Factor AnalysisHow Much Will You or Your Business be Affected by Weather and Climate Changes - West Sussex Total
Factor1 Factor2 Factor3 Factor4
Higher fuel prices 0.81 0.10 0.01 0.03
Higher insurance premiums 0.77 0.20 -0.02 0.12
Lower heating costs due to warmer winters 0.76 0.02 0.25 0.03
Advantages to agriculture in the UK 0.69 0.09 0.29 0.06
Deterioration in health due to wetter and warmer winters 0.69 0.27 0.13 0.14
Hosepipe bans 0.56 0.40 0.04 0.12
More people taking summer holidays on the South Coast 0.51 -0.09 0.31 0.42
Increased risk of severe storms 0.22 0.83 0.15 0.18
Greater fluctuation/changes in weather patterns 0.07 0.75 0.29 0.24
Water shortages 0.45 0.63 0.19 0.13
Better weather 0.41 0.17 0.75 0.01
Warmer and drier summers 0.22 0.30 0.75 0.27
Warmer and wetter winters -0.16 0.43 0.61 0.41
Increased coastal flooding 0.09 0.18 0.10 0.88
Increased river flooding 0.16 0.32 0.16 0.76
SizePercent
ageFactor1 359 27Factor2 309 23Factor3 280 21Factor4 409 30Total 1357 100

41 Measuring Climate Change Awareness – an ESPACE project for West Sussex County Council by Rosslyn Research, August 2004
INFORMATION SOURCES
“Television is the essential information source on weather and climate change. It would take very considerable additional effort to ‘elevate’ other media to the same level”.
70% Television [Business - 56%30% National Press [Farming - 41%}25% Radio [Business - 12%/ Farming - 14%]14% Local Press [Farming - 9%]14% Internet [Farming - 25%] 7% Leaflets from Council [Business - 2%] 1% (or less) for all other sources

42 Measuring Climate Change Awareness – an ESPACE project for West Sussex County Council by Rosslyn Research, August 2004
WHAT IS BEING DONE IN WEST SUSSEX
“Not enough is being done about BUILDING OF COSTAL DEFENCES”. [scores are ‘out-of-10’/ nothing is being done = 1/ enough is being done = 10]. Scores based on those who expressed an opinion [76%]
5.18 Total West Sussex [Don’t know - 24%]4.68 Businesses [Don’t know - 30%]5.43 Males5.49 Residents over 605.68 Coastal residents

43 Measuring Climate Change Awareness – an ESPACE project for West Sussex County Council by Rosslyn Research, August 2004
WHAT IS BEING DONE NATIONALLY/ INTERNATIONALLY
“Even less is being done nationally or internationally either about BUILDING OF COSTAL DEFENCES”. [scores are ‘out-of-10’/ nothing is being done = 1/ enough is being done = 10]. Scores based on those who expressed an opinion [71%]
4.65 Total West Sussex [Don’t know - 29%]4.19 Businesses [Don’t know - 44%]3.76 Farming [Don’t know - 47%]5.25 Residents under 185.02 Costal residents

44 Measuring Climate Change Awareness – an ESPACE project for West Sussex County Council by Rosslyn Research, August 2004
WHAT IS BEING DONE IN WEST SUSSEX
“Somewhat less is being done about BUILDING OF RIVER FLOOD DEFENCES”. [scores are ‘out-of-10’/ nothing is being done = 1/ enough is being done = 10]. Scores based on those who expressed an opinion [75%]
4.42 Total West Sussex [Don’t know - 25%]4.32 Farming [Don’t know - 25%]4.66 River valley residents

45 Measuring Climate Change Awareness – an ESPACE project for West Sussex County Council by Rosslyn Research, August 2004
WHAT IS BEING DONE NATIONALLY/ INTERNATIONALLY
“BUILDING OF RIVER FLOOD DEFENCES gets a similar score nationally or internationally”. [scores are ‘out-of-10’/ nothing is being done = 1/ enough is being done = 10]. Scores based on those who expressed an opinion [71%]
4.33 Total West Sussex [Don’t know - 29%]3.45 Farming [Don’t know - 47%]5.16 Young residents [18 and under]3.70 Upland residents5.00 River valley residents

46 Measuring Climate Change Awareness – an ESPACE project for West Sussex County Council by Rosslyn Research, August 2004
WHAT IS BEING DONE IN WEST SUSSEX
“Even less is being done about BUILDING OF STORM DRAINS”. [scores are ‘out-of-10’/ nothing is being done = 1/ enough is being done = 10]. Scores based on those who expressed an opinion [68%]
4.04 Total West Sussex [Don’t know - 32%]4.27 Farming [Don’t know - 29%]4.66 AB Social Grade residents3.48 C2 Social Grade residents4.69 River valley residents

47 Measuring Climate Change Awareness – an ESPACE project for West Sussex County Council by Rosslyn Research, August 2004
WHAT IS BEING DONE NATIONALLY/ INTERNATIONALLY
“BUILDING OF STORM DRAINS also gets a similar score internationally or nationally”. [scores are ‘out-of-10’/ nothing is being done = 1/ enough is being done = 10]. Scores based on those who expressed an opinion [63%]
4.07 Total West Sussex [Don’t know - 37%]3.77 Farming [Don’t know - 53%]5.28 Under 18 residents4.58 River valley residents

48 Measuring Climate Change Awareness – an ESPACE project for West Sussex County Council by Rosslyn Research, August 2004
WHAT IS BEING DONE IN WEST SUSSEX
“Perception of HOSEPIPE BANS is around the mid-point”. [scores are ‘out-of-10’/ nothing is being done = 1/ enough is being done = 10]. Most people expressed an opinion [84%]
4.86 Total West Sussex [Don’t know - 14%]5.38 AB Social Grade residents5.20 Inland flat terrain residents5.38 River valley residents

49 Measuring Climate Change Awareness – an ESPACE project for West Sussex County Council by Rosslyn Research, August 2004
WHAT IS BEING DONE IN WEST SUSSEX
“Very little is being done about ALTERNATIVES TO USING THE CAR”. [scores are ‘out-of-10’/ nothing is being done = 1/ enough is being done = 10]. Virtually everyone expressed an opinion [90%]
3.46 Total West Sussex [Don’t know - 10%]3.17 Farming [Don’t know - 21%]5.00 Under 19 residents2.95 Residents from single person households2.75 Coastal residents------------------------------------------------------------------------3.42 No car3.55 2+ cars

50 Measuring Climate Change Awareness – an ESPACE project for West Sussex County Council by Rosslyn Research, August 2004
WHAT IS BEING DONE IN WEST SUSSEX
“Very little is being done in terms of HELPING PEOPLE/BUSINESSES TO ADAPT TO CLIMATE CHANGE”. [scores are ‘out-of-10’/ nothing is being done = 1/ enough is being done = 10]. Opinion expressed by 79%.
3.11 Total West Sussex [Don’t know - 21%]3.39 Businesses [Don’t know - 33%]4.08 Under 19 residents2.76 C2 Residents2.61 Urban/ suburban residents3.51 Small town residents
51 Measuring Climate Change Awareness – an ESPACE project for West Sussex County Council by Rosslyn Research, August 2004
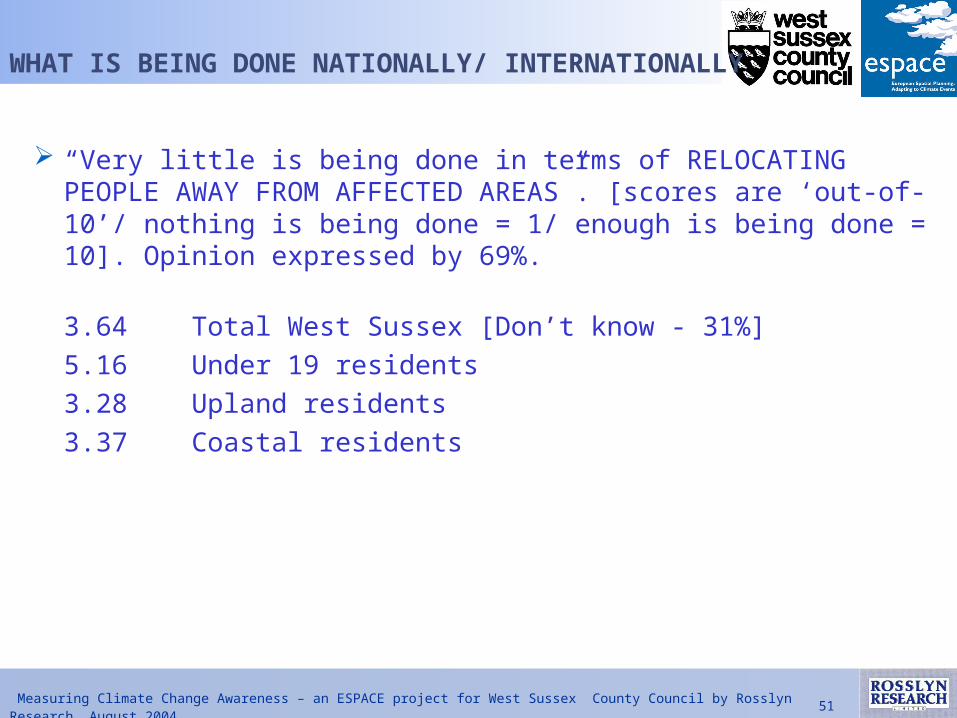
WHAT IS BEING DONE NATIONALLY/ INTERNATIONALLY
“Very little is being done in terms of RELOCATING PEOPLE AWAY FROM AFFECTED AREAS”. [scores are ‘out-of-10’/ nothing is being done = 1/ enough is being done = 10]. Opinion expressed by 69%.
3.64 Total West Sussex [Don’t know - 31%]5.16 Under 19 residents3.28 Upland residents3.37 Coastal residents

52 Measuring Climate Change Awareness – an ESPACE project for West Sussex County Council by Rosslyn Research, August 2004
WHAT IS BEING DONE NATIONALLY/ INTERNATIONALLY
“A little more is being done in terms of CONTROL OF FRESH WATER SUPPLY”. [scores are ‘out-of-10’/ nothing is being done = 1/ enough is being done = 10]. Opinion expressed by 74%.
4.42 Total West Sussex [Don’t know - 26%]3.91 Farming [Don’t know - 43%]5.35 Under 19 residents3.95 Upland residents4.66 Inland/ river valley residents

53 Measuring Climate Change Awareness – an ESPACE project for West Sussex County Council by Rosslyn Research, August 2004
WHAT IS BEING DONE NATIONALLY/ INTERNATIONALLY
“REDUCING GREENHOUSE EMISSIONS gets a very poor score”. [scores are ‘out-of-10’/ nothing is being done = 1/ enough is being done = 10]. Opinion expressed by 78%.
3.94 Total West Sussex [Don’t know - 22%]3.44 Farming [Don’t know - 44%]4.47 Under 19 residents3.66 C2 residents3.54 Upland residents

54 Measuring Climate Change Awareness – an ESPACE project for West Sussex County Council by Rosslyn Research, August 2004
WHAT IS BEING DONE NATIONALLY/ INTERNATIONALLY
“FINANCIAL SUPPORT FOR AFFECTED COUNTRIES gets also a low score”. [scores are ‘out-of-10’/ nothing is being done = 1/ enough is being done = 10]. Opinion expressed by 73%.
4.05 Total West Sussex [Nothing being done - 33%]5.02 Under 19 residents
55 Measuring Climate Change Awareness – an ESPACE project for West Sussex County Council by Rosslyn Research, August 2004
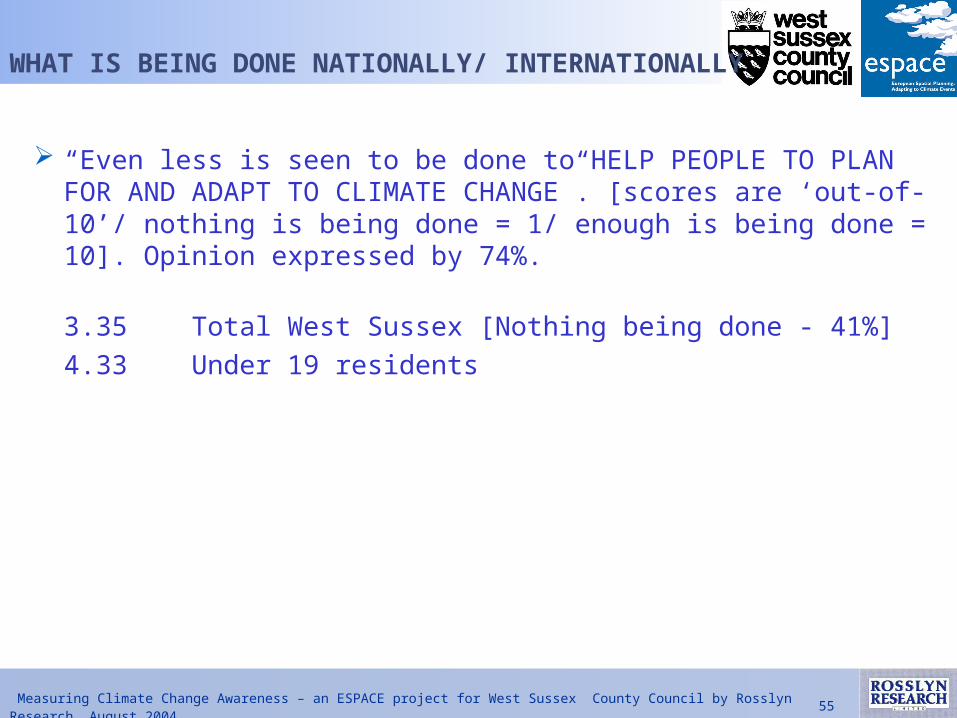
WHAT IS BEING DONE NATIONALLY/ INTERNATIONALLY
“Even less is seen to be done to HELP PEOPLE TO PLAN FOR AND ADAPT TO CLIMATE CHANGE”. [scores are ‘out-of-10’/ nothing is being done = 1/ enough is being done = 10]. Opinion expressed by 74%.
3.35 Total West Sussex [Nothing being done - 41%]4.33 Under 19 residents

56 Measuring Climate Change Awareness – an ESPACE project for West Sussex County Council by Rosslyn Research, August 2004
HOW SHOULD PEOPLE IN WEST SUSSEX BE HELPED
“Residents and businesses are very unsure on what help should be given and who should help”. [Spontaneous responses/open-ended].
33% Government/ Local Authorities [Farming - 19%]11% More information 9% Environment Agency 5% Leaflets/ letters 4% [each] Education/ Media/ Recycling 2% Advertisements33% Don’t know

57 Measuring Climate Change Awareness – an ESPACE project for West Sussex County Council by Rosslyn Research, August 2004
HOW SHOULD PEOPLE IN WEST SUSSEX FIND OUT ABOUT CLIMATE CHANGE
“How should residents and businesses in West Sussex be helped to find out about climate change?”. [Spontaneous responses/open-ended].
28% Government/ Local Authorities [Farming - 21%]26% TV/ Radio18% Leaflets/ letters/ newsletters 8% Newspapers 6% Meetings/ forums 5% Environmental agencies 4% [each] Seminars/ Internet28% Don’t know

58 Measuring Climate Change Awareness – an ESPACE project for West Sussex County Council by Rosslyn Research, August 2004
THE IDEAL AND ACTUAL WORLD
“The National Governments of Europe, the European Union and the USA fall consistently short in a comparison of the ‘ideal’ and ‘actual’ world in taking preventative measures for Climate Control.” [Ratings ‘out-of-10’, with most people expressing an opinion]
Gaps recorded by businesses and farming are substantially larger than for residents.

59 Measuring Climate Change Awareness – an ESPACE project for West Sussex County Council by Rosslyn Research, August 2004
THE IDEAL AND ACTUAL WORLD
NATIONAL GOVERNMENTS OF EUROPE[scores ‘out-of-10’/ 1= institution is not at all important/ 10=institution should be leading the way]
IDEAL8.34 Total West Sussex69% ‘Should be leading the way’ [scores 8 - 10]
ACTUAL6.71 Total West Sussex 39% ‘Is leading the way’ [scores 8 - 10]

60 Measuring Climate Change Awareness – an ESPACE project for West Sussex County Council by Rosslyn Research, August 2004
THE IDEAL AND ACTUAL WORLD
THE EUROPEAN UNION[scores ‘out-of-10’/ 1= institution is not at all important/ 10=institution should be leading the way]
IDEAL8.04 Total West Sussex65% ‘Should be leading the way’ [scores 8 - 10]
ACTUAL6.52 Total West Sussex39% ‘Is leading the way’ [scores 8 - 10]

61 Measuring Climate Change Awareness – an ESPACE project for West Sussex County Council by Rosslyn Research, August 2004
THE IDEAL AND ACTUAL WORLD
THE USA[scores ‘out-of-10’/ 1= institution is not at all important/ 10=institution should be leading the way]
IDEAL8.10 Total West Sussex65% ‘Should be leading the way’ [scores 8 - 10]
ACTUAL5.89 Total West Sussex36% ‘Is leading the way’ [scores 8 - 10]

62 Measuring Climate Change Awareness – an ESPACE project for West Sussex County Council by Rosslyn Research, August 2004
THE IDEAL AND ACTUAL WORLD
THE WORLD TRADE ORGANISATION[scores ‘out-of-10’/ 1= institution is not at all important/ 10=institution should be leading the way]
IDEAL7.89 Total West Sussex59% ‘Should be leading the way’ [scores 8 - 10]
ACTUAL6.53 Total West Sussex34% ‘Is leading the way’ [scores 8 - 10]

63 Measuring Climate Change Awareness – an ESPACE project for West Sussex County Council by Rosslyn Research, August 2004
THE IDEAL AND ACTUAL WORLD
MEDIA CORPORATIONS[scores ‘out-of-10’/ 1= institution is not at all important/ 10=institution should be leading the way]
IDEAL7.76 Total West Sussex57% ‘Should be leading the way’ [scores 8 - 10]
ACTUAL6.60 Total West Sussex37% ‘Is leading the way’ [scores 8 - 10]

64 Measuring Climate Change Awareness – an ESPACE project for West Sussex County Council by Rosslyn Research, August 2004
THE IDEAL AND ACTUAL WORLD
CAMPAIGNING CHARITIES[scores ‘out-of-10’/ 1= institution is not at all important/ 10=institution should be leading the way]
IDEAL7.84 Total West Sussex60% ‘Should be leading the way’ [scores 8 - 10]
ACTUAL7.49 Total West Sussex65% ‘Is leading the way’ [scores 8 - 10]

65 Measuring Climate Change Awareness – an ESPACE project for West Sussex County Council by Rosslyn Research, August 2004
THE IDEAL AND ACTUAL WORLD
EDUCATIONAL INSTITUTIONS[scores ‘out-of-10’/ 1= institution is not at all important/ 10=institution should be leading the way]
IDEAL8.20 Total West Sussex66% ‘Should be leading the way’ [scores 8 - 10]
ACTUAL7.23 Total West Sussex49% ‘Is leading the way’ [scores 8 - 10]
rosslynrosslynresearch research
Espace Study on Climate ChangeEspace Study on Climate ChangePreventive Measures for Climate ControlPreventive Measures for Climate ControlIdeal vs. Actual WorldIdeal vs. Actual WorldWorld InstitutionsWorld InstitutionsGap AnalysisGap Analysis

67 Measuring Climate Change Awareness – an ESPACE project for West Sussex County Council by Rosslyn Research, August 2004
Gap Analysis
Use Gap Analysis Measures the ‘Gap’ Between Attribute
‘Importance in the Ideal World’ Top 2 Box Percentages (9 10) against Top 2 Box (9 10) Percentages of ‘Importance in the Actual World.’ Or, a perceived ‘gap’ in performance.
Percentages are Ideal (Q17) – Actual (Q18) Importance
Display Gaps are displayed in descending order.

68 Measuring Climate Change Awareness – an ESPACE project for West Sussex County Council by Rosslyn Research, August 2004
5350
54
4442
45
50
30 29 30
26 27
3532
Nationalgovernments
of Europe
TheEuropean
Union
The USA The WorldTrade
Organization
Mediacorporations
Campaigningcharities
Universities,schools etc.
Ideal World
Actual World
Q17Q18 Attribute Top 2 Box (9 10) Importance Percentages
Ideal vs. Actual World—World InstitutionsWest Sussex Total

69 Measuring Climate Change Awareness – an ESPACE project for West Sussex County Council by Rosslyn Research, August 2004
10
15
18
18
21
23
24
Campaigning charities
Media corporations
Universities, schools etc.
The World TradeOrganization
The European Union
National governments ofEurope
The USA
Gap
Q17Q18
Attribute Top 2 Box (9 10) Importance Percentages
Ideal World-Actual World
Ideal vs. Actual World—World InstitutionsWest Sussex Total

70 Measuring Climate Change Awareness – an ESPACE project for West Sussex County Council by Rosslyn Research, August 2004
53
44
48
36
30 29
35
20
1618
13 12
19
14
Nationalgovernments
of Europe
TheEuropean
Union
The USA The WorldTrade
Organization
Mediacorporations
Campaigningcharities
Universities,schools etc.
Ideal World
Actual World
Q17Q18
Attribute Top 2 Box (9 10) Importance Percentages
Ideal vs. Actual World—World InstitutionsWest Sussex Business

71 Measuring Climate Change Awareness – an ESPACE project for West Sussex County Council by Rosslyn Research, August 2004
10
18
20
23
27
30
33
Campaigning charities
Media corporations
Universities, schools etc.
The World TradeOrganization
The European Union
The USA
National governments ofEurope
Gap
Q17Q18
Attribute Top 2 Box (9 10) Importance Percentages
Ideal World-Actual World
Ideal vs. Actual World—World InstitutionsWest Sussex Business

72 Measuring Climate Change Awareness – an ESPACE project for West Sussex County Council by Rosslyn Research, August 2004
50
39
46
36
26
29
34
2017
20
14 15 1517
Nationalgovernments
of Europe
TheEuropean
Union
The USA The WorldTrade
Organization
Mediacorporations
Campaigningcharities
Universities,schools etc.
Ideal World
Actual World
Q17Q18
Attribute Top 2 Box (9 10) Importance Percentages
Ideal vs. Actual World—World InstitutionsWest Sussex Farming

73 Measuring Climate Change Awareness – an ESPACE project for West Sussex County Council by Rosslyn Research, August 2004
11
15
18
22
23
26
30
Media corporations
Campaigning charities
Universities, schools etc.
The European Union
The World TradeOrganization
The USA
National governments ofEurope
Gap
Q17Q18
Attribute Top 2 Box (9 10) Importance Percentages
Ideal World-Actual World
Ideal vs. Actual World—World InstitutionsWest Sussex Farming

74 Measuring Climate Change Awareness – an ESPACE project for West Sussex County Council by Rosslyn Research, August 2004
5452
56
46 4649
55
33 33 3330 31
4037
Nationalgovernments
of Europe
TheEuropean
Union
The USA The WorldTrade
Organization
Mediacorporations
Campaigningcharities
Universities,schools etc.
Ideal World
Actual World
Q17Q18
Attribute Top 2 Box (9 10) Importance Percentages
Ideal vs. Actual World—World InstitutionsWest Sussex Residential

75 Measuring Climate Change Awareness – an ESPACE project for West Sussex County Council by Rosslyn Research, August 2004
9
15
16
17
20
21
23
Campaigning charities
Media corporations
The World TradeOrganization
Universities, schools etc.
The European Union
National governments ofEurope
The USA
Gap
Q17Q18
Attribute Top 2 Box (9 10) Importance Percentages
Ideal World-Actual World
Ideal vs. Actual World—World InstitutionsWest Sussex Residential

76 Measuring Climate Change Awareness – an ESPACE project for West Sussex County Council by Rosslyn Research, August 2004
CLASSIFICATION [BUSINESS/FARMING]
SIZE OF BUSINESS/ FARM [EMPLOYEES]
41% 1 - 1035% 11 - 50 9% 51 - 200 6% 201 - 500 9% 500+

77 Measuring Climate Change Awareness – an ESPACE project for West Sussex County Council by Rosslyn Research, August 2004
CLASSIFICATION [BUSINESS/FARMING]
INDUSTRY SECTOR
13% Leisure/ hotels13% Retail 13% Manufacturing 9% Utilities/ construction 7% Transport/ distribution 11% Services27% Farming 6% Forestry

78 Measuring Climate Change Awareness – an ESPACE project for West Sussex County Council by Rosslyn Research, August 2004
CLASSIFICATION [RESIDENTIAL]
GENDER55% Male45% Female
AGE13% up to 1817% 19 - 3016% 31 - 4019% 41 - 50 16% 51 - 60 18% Over 60

79 Measuring Climate Change Awareness – an ESPACE project for West Sussex County Council by Rosslyn Research, August 2004
CLASSIFICATION [RESIDENTIAL]
NUMBER OF CHILDREN58% None18% 1 16% 2 7% 3+
HOUSEHOLD SIZE19% 130% 2 19% 3 26% 4+

80 Measuring Climate Change Awareness – an ESPACE project for West Sussex County Council by Rosslyn Research, August 2004
CLASSIFICATION [RESIDENTIAL]
SOCIO-ECONOMIC GROUP18% AB35% C1 23% C2 23% DE
TYPE OF DWELLING18% Flat23% Terraced 31% Semi 25% Detached

81 Measuring Climate Change Awareness – an ESPACE project for West Sussex County Council by Rosslyn Research, August 2004
CLASSIFICATION [RESIDENTIAL]
OWNERSHIP68% Owner occupied14% Private rented 15% Public rented
LOCATION42% Urban/suburban36% Small town 19% Village 3% Country

82 Measuring Climate Change Awareness – an ESPACE project for West Sussex County Council by Rosslyn Research, August 2004
CLASSIFICATION [RESIDENTIAL]
GEOGRAPHY46% Inland flat terrain14% Uplands/ hills 33% Coastal 4% River valley
NUMBER OF CARS21% None40% 1 30% 2 9% 3+


