

Airey, G.D. and Collop, A.C. (2014) Mechanical and structural assessment of laboratory- and field-compacted asphalt mixtures. International Journal of Pavement Engineering, 17 (1). pp. 50-63. ISSN 1477-268X
Access from the University of Nottingham repository: http://eprints.nottingham.ac.uk/40658/1/Airey%20and%20Collop%20Compaction%20IJPE%20Vol%2017%202016%20%28002%29.pdf
Copyright and reuse:
The Nottingham ePrints service makes this work by researchers of the University of Nottingham available open access under the following conditions.
This article is made available under the Creative Commons Attribution licence and may be reused according to the conditions of the licence. For more details see: http://creativecommons.org/licenses/by/2.5/
A note on versions:
The version presented here may differ from the published version or from the version of record. If you wish to cite this item you are advised to consult the publisher’s version. Please see the repository url above for details on accessing the published version and note that access may require a subscription.
For more information, please contact [email protected]
Full Terms & Conditions of access and use can be found athttp://www.tandfonline.com/action/journalInformation?journalCode=gpav20
Download by: [University of Nottingham] Date: 24 September 2015, At: 08:14
International Journal of Pavement Engineering
ISSN: 1029-8436 (Print) 1477-268X (Online) Journal homepage: http://www.tandfonline.com/loi/gpav20
Mechanical and structural assessment oflaboratory- and field-compacted asphalt mixtures
G.D. Airey & A.C. Collop
To cite this article: G.D. Airey & A.C. Collop (2016) Mechanical and structural assessmentof laboratory- and field-compacted asphalt mixtures, International Journal of PavementEngineering, 17:1, 50-63, DOI: 10.1080/10298436.2014.925551
To link to this article: http://dx.doi.org/10.1080/10298436.2014.925551
© 2014 The Author(s). Published by Taylor &Francis.
Published online: 16 Jun 2014.
Submit your article to this journal
Article views: 376
View related articles
View Crossmark data
Citing articles: 1 View citing articles

Mechanical and structural assessment of laboratory- and field-compacted asphalt mixtures
G.D. Airey* and A.C. Collop
Nottingham Transportation Engineering Centre, University of Nottingham, Nottingham NG7 2RD, UK
(Received 21 May 2013; accepted 22 June 2013)
Compaction forms an integral part in the formation of the aggregate orientation and structure of an asphalt mixture andtherefore has a profound influence on its final volumetric and mechanical performance. This article describes the influenceof various forms of laboratory (gyratory, vibratory and slab-roller) and field compaction on the internal structure of asphaltspecimens and subsequently on their mechanical properties, particularly stiffness and permanent deformation. A 2D imagecapturing and image analysis system has been used together with alternative specimen sizes and orientations to quantify theinternal aggregate structure (orientation and segregation) for a range of typically used continuously graded asphalt mixtures.The results show that in terms of aggregate orientation, slab-compacted specimens tend to mimic field compaction betterthan gyratory and vibratory compaction. The mechanical properties of slab-compacted specimens also tend to be closer tothat of field cores. However, the results also show that through careful selection of specimen size, specimen orientation andcompaction variables, even mould-based compaction methods can be utilised with particular asphalt mixtures to representfield-compacted asphalt mixtures.
Keywords: compaction; asphalt mixtures; gyratory; slab; image analysis; aggregate skeleton; stiffness modulus;permanent deformation
Introduction
High-quality asphalt mixture compaction is an essential
factor in the design and subsequent production of high-
quality pavements. Achieving consistency in compaction,
both in the laboratory and in the field, is necessary if
accurate correlation is to occur between laboratory
performance and observed field behaviour. Laboratory
compaction provides a more controlled environment
(smaller material quantities, tighter temperature and
compaction energy controls, etc) than that found for field
compaction. However, experience has shown that, first,
different modes of laboratory compaction tend to produce
asphalt mixtures with significantly different mechanical
properties and, second, that these mechanical properties
can differ considerably from those obtained from field
specimens.
The fact that different modes of compaction create
volumetrically identical but mechanically different speci-
mens has long been recognised (Vallerga 1951, Nevitt
1959). In recent years, various studies have been
undertaken to assess the influence of both laboratory and
field compaction on the mechanical performance of the
asphalt mixture (Consuegra et al. 1989, Sousa et al. 1991,
Von Quintas et al. 1991, Harvey and Monismith 1993,
Brown and Gibb 1999, Renken 2000, Hunter et al. 2004b,
Airey et al. 2006). In addition, increased use has been
made of image analysis techniques to study the internal
aggregate arrangement of asphalt structures. These
techniques consist of either non-destructive, X-ray
computed tomography (X-ray CT) (Masad et al. 1999,
Tashman et al. 2002) or 2D imaging using destructive
(sawing) techniques combined with digital cameras (Yue
et al. 1995, Shashidar 1999, Hunter et al. 2004a, Masad
and Button 2004, Airey et al. 2006). It is generally
accepted that differences in particle orientation and
general aggregate structure caused by different compac-
tion methods led to differences in mechanical performance
with mould-based compaction methods (gyratory and
vibratory) generally differing from roller-compacted
slab specimens and field-compacted cores of comparable
air voids.
This article considers the influence of laboratory
compaction methods on the internal structure (aggregate
orientation and segregation) as well as the mechanical
properties (stiffness modulus, permanent deformation and
fatigue) of the asphalt mixture relative to what is found for
standard field compaction. To check the sensitivity of any
findings to mixture type, a total of four asphalt mixtures
were included in the study ranging from 14mm maximum
stone size surfacing material to 32mm high modulus base
(HMB) material. Three methods of laboratory compaction
have been considered in this study: gyratory, vibratory and
slab ‘roller’ compaction. These represent the most
commonly used laboratory compaction methods in the
UK. The compaction parameters were closely controlled
and all the specimens were manufactured using the
same constituent materials and mixture design procedure.
The article also investigates the changes in aggregate
q 2014 The Author(s). Published by Taylor & Francis.
This is an Open Access article. Non-commercial re-use, distribution, and reproduction in any medium, provided the original work is properly attributed, cited, and is not altered,
transformed, or built upon in any way, is permitted. The moral rights of the named author(s) have been asserted.
*Corresponding author. Email: [email protected]
International Journal of Pavement Engineering, 2015
Vol. 17, No. 1, 50–63, http://dx.doi.org/10.1080/10298436.2014.925551
Dow
nloa
ded
by [
Uni
vers
ity o
f N
ottin
gham
] at
08:
14 2
4 Se
ptem
ber
2015

orientation and mechanical performance for smaller
specimens cored from larger specimens and, therefore,
less affected by mould-confining effects associated with
gyratory and vibratory compaction.
Materials and mixture design
The experimental testing programme included a wide
range of asphalt mixtures as detailed in Table 1. The
mixtures were carefully chosen to represent four nominal
maximum aggregate sizes and a range of bituminous
binders. In general, the larger the nominal maximum
aggregate size, the greater the risk of segregation and non-
uniform compaction.
The modes of laboratory compaction were chosen to
represent those commonly used in the UK. Where possible
the number of specimens tested for each compaction
method and mixture was limited to 30 to provide a
reasonable number for statistical analysis whilst being
practical in terms of laboratory time. The sites that
provided the field cores were made of the same constituent
materials as those used in the laboratory testing
programme.
Compaction methods
The mixing and compaction temperatures were carefully
controlled for all compaction modes to ensure high-quality
compaction and appropriate bitumen viscosities in line
with the relevant standards (BS EN 12697-31, 32, 33 &
35). After mixing, the loose asphalt mixture was poured
onto a tray and mixed manually using the ‘cone and
quarter’ method in an effort to reduce segregation. The
opposing diagonal quarters of the mixture were then added
to the moulds ready for compaction. Care was taken to
ensure that the mixture did not drop below the temperature
of 1508C. Once the specimens had been manufactured they
were cut using a diamond-edged circular saw.
Gyratory compaction
Two types of gyratory compactors were used in the study
consisting of a ‘Cooper Research Technology’ compactor
manufactured in the UK and the French ‘Laboratoire
Central des Ponts et Chaussees (LCPC)’ gyratory
compactor. The gyratory compaction parameters used
with the Cooper compactor complied with BS EN 12697-
31 and consisted of a compaction pressure of 600 kPa, a
gyratory angle of 1.258 and a gyration rate of 30 gyrations
per minute. The parameters used with the LCPC gyratory
compactor consisted of a slightly higher compaction
pressure of 662 kPa and a lower angle of 550 with the same
rate of 30 gyrations per minute.
The specimens were all compacted to a target density,
as opposed to a set number of gyrations, although the
number of gyrations never exceeded 300 gyrations
(10 minutes). The 28-mm dense bitumen macadam
(DBM), 14-mm surfacing and 32-mm HMB asphalt
mixtures were compacted in 150-mm diameter moulds,
whereas the 20-mm HMB asphalt mixture was compacted
in 100-mm diameter moulds. During the compaction
programme, silicon spray was used on the inside of the
moulds to ease subsequent specimen extraction.
Vibratory compaction
An electric vibratory hammer was used to compact the
specimens in a split mould of internal diameter
152.45 ^ 0.5mm according to BS EN 12697-32. The
power consumption of the vibratory hammer was 800W
Table 1. Asphalt mixtures included in the testing programme.
Percentage passing
Aggregate gradation sieve sizes 28-mm DBM 20-mm HMB 14-mm DBM 32-mm HMB
37.5mm 100 10028mm 98 100 8920mm 83 98 100 8314mm 68 77 98 7010mm 62 806.3mm 52 47 60 533.35mm 38 40 43 390.3mm 14 14 16 150.075mm 7 7 9 8Aggregate Limestone Limestone Granite LimestoneBitumen 40/60 pen 30/45 pen SBS PMBa 30/45 penBinder content (%) 4 4.2 4.9 4Maximum density (kg/m3) 2513 2465 2660 2482Target void content (%) 4.2 3.6 3.6 4.2
a Class 4 for both penetration at 258C and softening point according to EN 14023.
51International Journal of Pavement Engineering
Dow
nloa
ded
by [
Uni
vers
ity o
f N
ottin
gham
] at
08:
14 2
4 Se
ptem
ber
2015

and operated at a frequency of 35Hz. Consistently
achieving a designated air voids using vibratory compac-
tion is difficult and as a result there was some variance in
the air void content of these specimens.
Steel slab roller compaction
The steel slab roller compactor consisted of a curved steel
segment, pivoting on a hinge and applying the load via
pneumatic actuators. The asphalt mixture was placed in a
steel mould (internal dimensions of 300mm by 300mm by
140mm)whichmovedback and forth beneath the roller. The
partial free face allowed the aggregates to orient themselves
in a manner similar to that which occurs on site (Consuegra
et al. 1989). The precise depth of the compacted asphalt layer
was set at the start of the test based on the knowledge of the
maximum density of the mixture and mass of the slab to
enable a target air void content to be specified. The direct
force applied to the slab was not measured, but complied
with BS EN 12697-33, which specifies a minimum static
load, F, that the device should apply:
F
2Dl$ 1025; ð1Þ
where F is the load applied onto the roller (kN), l is the
interiorwidth of themould (mm) andD is the diameter of the
wheel or roller (mm). The dimensions of resulting slabswere
300mm £ 300mm £ 100mm. This enabled two 150-mm
diameter specimens or four 100-mm diameter specimens to
be cored from each slab. The specimen orientation for all
roller-compacted specimens was perpendicular to the
compaction force of the roller.
Field compaction
For the 28-mm DBM, 20-mm and 32-mm HMB, the initial
compaction was carried out by a dead weight 12/14-t three-
wheeled roller. Secondary compaction was undertaken by a
Bomag 161, with a vibration-affected weight of 24t. The
asphalt laying temperature was around 1508C for the 20-mm
and 32-mm HMB and 1408C for the 28-mm DBM, with an
air temperature of around 88C. For the 14-mm asphalt
mixture, the initial compaction was undertaken by a 12-t
static dual roller HAMMcompactor. Secondary compaction
was undertaken by a Bomag 120 2.5-t tandem vibratory
roller. The laying temperature was around 1458C with an air
temperature of 138C. The specimen orientation for all field-
compacted specimens was perpendicular to the compaction
force applied in the field.
Asphalt mixture mechanical properties
Stiffness modulus
The stiffness moduli of the asphalt mixture specimens were
measured using the indirect tensile stiffnessmodulus (ITSM)
test. The test is non-destructive and involves the application
of load pulses to the vertical diameter of a cylindrical
specimen, with the resultant peak transient deformation
measured along the horizontal diameter. The stiffness
modulus is then a function of load, deformation, specimen
dimensions and an assumed Poisson’s ratio of 0.35. The
ITSM test was undertaken in accordance with recognised
guidelines (BSI 1993) using the following test parameters:
Test temperature: 208CLoading rise-time: 124milliseconds
Peak transient
horizontal deformation: 7mm (150-mm diameter
specimen)
5mm (100-mm diameter
specimen)
The test specimen is initially conditioned through the
application of five load pulses. A further five load pulses
are then applied from which a mean stiffness modulus is
obtained. The sample is then rotated through 908 and a
further five pulses are applied and a resulting mean
stiffness modulus obtained. The stiffness modulus of the
asphalt mixture specimen is then calculated as the average
of these two mean values.
Permanent deformation
The resistance of the asphalt mixture specimens to
permanent deformation was determined by means of the
repeated load axial test (RLAT) using a direct uniaxial
compression testing configuration. The test consists of
applying a number of load pulses to the flat faces of the
specimen and recording the resulting deformation. The axial
strainobtainedat the endof the test is usedas ameasure of the
specimen’s resistance to permanent deformation. TheRLAT
was undertaken in accordance with recognised guidelines
(BSI 1996) and the following test parameters:
Test temperature: 408CTest duration: 7200 s (3600 cycles)
Loading pattern: 1 s loading followed by a 1 s
recovery period per cycle
Axial stress: 100 kPa
Conditioning stress: 10 kPa for 120 s
The permanent deformation performance of the
asphalt mixtures was quantified by means of the ultimate
percentage strain after 3600 cycles, although the rate of
strain (microstrain per cycle) over the linear phase of the
deformation response can also be used (Brown and Gibb
1996).
Fatigue cracking
The fatigue life of the asphalt mixture specimens was
assessed using the indirect tensile fatigue test (ITFT) with
52 G.D. Airey and A.C. Collop
Dow
nloa
ded
by [
Uni
vers
ity o
f N
ottin
gham
] at
08:
14 2
4 Se
ptem
ber
2015

an experimental arrangement similar to that used for the
ITSM test but under repeated loading conditions. A range
of stress levels were chosen, and the number of pulses to
failure (defined as the point at which there is 9mm of
vertical deformation) was recorded. The range of stress
levels should ensure a wide range in fatigue lives with the
test being carried out using the following test parameters
(BSI 1995):
Test temperature: 208CLoading condition:: Controlled-stress
Rise time: 124milliseconds
Pulse repetition: 1.5 ^ 0.1 s (40 pulses/minute)
Range of tensile stress: 200–700 kPa
The maximum tensile strain generated at the centre of
the specimen is defined as:
1xmax ¼ sxmax 1þ 3yð ÞSm
£ 1000; ð2Þ
where 1xmax is the maximum tensile horizontal strain at the
centre of the specimen in microstrain, sxmax is the
maximum tensile stress at the centre of the specimen in
kPa, y is Poisson’s ratio (assumed to be 0.35) and Sm is the
indirect tensile stiffness modulus at sxmax in MPa. The
maximum tensile stress at the centre of the specimen is
defined as:
sxmax ¼ 2L
pdt; ð3Þ
where d is the diameter of the test specimen (m) and L is
the vertical applied line load in kN. Linear regression
analysis of the ITFT results was used to determine fatigue
functions for the asphalt mixtures using the following
relationship:
Nf ¼ a12b0 ; ð4Þ
where Nf is fatigue life, 10 is the initial tensile strain
(microstrain) and a, b are experimentally determined
coefficients.
Aggregate skeleton matrix
Image analysis techniques
There are currently two main image analysis techniques
available for the study of asphalt structures: (i) X-ray CT
and (ii) digital cameras. X-ray CT is a completely non-
destructive method for visualising features in the interior
of solid objects to obtain digital information on their three-
dimensional geometry and properties (Tashman et al.
2002). It operates by X-raying a series of planes within the
specimen. The resulting intensity values are then
correlated to the densities of the materials. The technique
works well with a composite material such as asphalt as its
three phases (air, bitumen and aggregate) have distinct
densities. The computer software subsequently assimilates
the information to produce a 2D or 3D digital image.
This study used a digital camera (QImaging Evolution
MP 12 bit digital camera) and Image ProPlus software as
shown in Figure 1. This is a destructive technique due to
the need for cut sample surfaces and fails to capture the air
void distribution but it has the advantage of capturing
greater aggregate detail on an individual plane and being
relatively inexpensive. The cores were cut using diamond-
tipped saw blades and the surfaces marked, as shown in
Figure 2. In total, 1200 monochrome images per
compaction method and asphalt mixture type were taken
with approximately 3000 aggregate particles captured on
each slice.
A process called ‘thresholding’ was undertaken on the
images to provide information on the contrast of different
objects in the image. Image analysis is most effective
where the objects of interest have distinct colour/lightness
phases when compared to their surroundings. This is
indicated in the threshold plot displayed in Figure 3. Plot A
is representative of an image where the phases are readily
distinguishable, whereas plot B is representative of an
image where the phases are intertwined and hence difficult
for any subsequent analysis. In this type of image analysis,
Top
Middle
Base
Surface 1
Surface 2
Surface 3
Surface 4
20 mm
60 mm
20 mm
Figure 2. Core sections and surfaces of cylindrical specimens.
Figure 1. 2D image analysis equipment.
53International Journal of Pavement Engineering
Dow
nloa
ded
by [
Uni
vers
ity o
f N
ottin
gham
] at
08:
14 2
4 Se
ptem
ber
2015

the monochrome contrast between the two materials,
bitumen and aggregate, is critical to the success of the
results. The image analysis software enables the user to
automatically select light-coloured objects. In this
instance, the software uses an algorithm based on the
threshold data to make a judgement of what constitutes a
light-coloured object, or in this instance the aggregate
particles. Once the thresholding process has been
undertaken, the user may perform a number of ‘count
and measure’ operations on the objects selected. Virtually
any measurement of a recognised particle can be made, for
example area, particle orientation, centre of area,
perimeter (Hunter et al. 2004a). In this study, the
following parameters were measured:
. Visible particle cross-sectional area (VSA).
. The vertical particle angle (b), defined as the angle
between the major axis length of the particle and the
vertical axis. The vertical axis is provided by the
image boundary.. Centre of VSA (xc, yc) of the particle.. The maximum length of the particle.. The maximum width of the particle.
It should be noted that an element of the fines within
the aggregate matrix are not recognised by the image
analysis thresholding process, due to their size and the
cutting process. The cutting process can discolour very
small particles by smearing the adjacent bitumen over the
area, hence reducing the contrast between the particle and
the bitumen. With the knowledge of the mixture design
and relative material densities, it is possible to calculate
that the average aggregate surface area should be
approximately 88% of the total area. Approximately
25% of the aggregate surface area was not recognised by
the image analysis process. This ‘aggregate loss’ is not
seen as a major problem in this study which is concerned
with the structural effect of the aggregate generally
provided by the larger particles as opposed to the bitumen
mastic (filler-fines). Based on the parameters determined
using the 2D system, the aggregate orientation (alignment)
and segregation for the various asphalt mixtures as a
function of compaction method were determined.
Aggregate orientation
Each mode of compaction has its own specific type of
loading and boundary conditions which inevitably have an
effect on the resulting aggregate orientation in the
compacted asphalt mixture. When studying aggregate
orientation, a point of reference from which measurements
should be made needs to be defined. If radial or
circumferential particle alignment is to be investigated it
needs to be considered relative to the core centre, as
opposed to an imposed arbitrary x–y axes. Figure 4 is a
schematic diagram representing the horizontal plane of an
asphalt specimen, indicating the particle orientation 1i.The particle orientation 1i is defined as the angle between
the radial line (connecting the centre of the core to the
centre of the particle) and the line of major particle
orientation. It is calculated from the knowledge of the
particle co-ordinates, centre of the specimen co-ordinates
and the vertical particle angle b. The angle 1i varies from08 to 908, i.e. it is always the minor angle between the
Fre
quen
cy
Greyscale
Plot A
Plot B
0 255
Figure 3. Schematic threshold intensity plots.
xc, yc
Line ofmajor particleorientation
εi
εi
Aggregateparticles
Bitumenmastic
Centre ofcross section
Radial line
Figure 4. Schematic diagram indicating aggregate orientationrelative to centre of core.
εi
εiRadial line
Centre of core
Centre ofmass ofparticle
Figure 5. Particles aligned in radial directions.
54 G.D. Airey and A.C. Collop
Dow
nloa
ded
by [
Uni
vers
ity o
f N
ottin
gham
] at
08:
14 2
4 Se
ptem
ber
2015

radial line and the line of major orientation. If 1i ¼ 08, thenthe particles are aligned in a radial direction, and if 1i ¼ 908,then the particles are aligned in a circumferential direction, i.
e. parallel to the circumference. It is worth noting that if the
particles have a randomdistribution then the averagevalueof
1i will be 458. Calculating the angle 1i in this way ensures
against the scenario depicted in Figure 5, where two particles
are aligned invery similar directions but havewidely varying
angles of 1. i. In this scenario, any averaging of angles wouldyield meaningless results.
The behaviour of the aggregate particles was
investigated as a function of their size, shape and depth
in the sample. There is a relatively large spread of
aggregate sizes within a typical asphalt mixture, spanning
from dust to particles with a nominal diameter of 28mm
for the asphalt mixtures included in this study. The
particles were split by their particle area range with an
average (weighted) circumferential particle orientation
being calculated for each particle area range according to
Equation 5.
1w ¼Pi¼n
i¼1 1ia1Pi¼ni¼1 ai
; ð5Þ
where 1w is the weighted circumferential angle for a
particle area range, n is the total number of particles within
the particle area range, 1i is the individual particle
orientation relative to the centre and ai is the individual
particle area (Hunter et al. 2004a). The weighted
circumferential angles (1w) for the various particle area
ranges were obtained for the four surfaces (Figure 2) of
each core and subsequently averaged for the 30 specimens
of each compaction method. The analysis was also
undertaken on ‘elongated’ particles to investigate whether
they were subject to a greater degree of re-orientation. In
this study, an elongated particle is classed as having an
aspect (length/width) ratio of greater than two.
A particle orientation plot is shown in Figure 6 for the
gyratory-compacted 28-mm DBM asphalt mixture for all
particles as well as elongated particles. With both gyratory
and vibratory samples there is a general increase in particle
orientation tending towards 908 with increasing particle
area with this trend being more pronounced for elongated
particles. The variance in the results from the lines of best
fit shown in Figure 6 is indicative of the results for
gyratory- and vibratory-compacted specimens, i.e. there is
a general trend towards circumferential particle orientation
with increasing particle size, but there are plenty of
exceptions to the rule. The gradient of the line of best fit in
Figure 6 has units of degrees per cm2 VSA (particle area)
with the zero particle size (y intercept) being fixed at 458.The gradients for three of the asphalt mixture types and the
four compaction methods (three laboratory and field
compaction) have been used to determine the aggregate
orientation at increasing particle sizes in Tables 2–4.
R2 = 0.67
R2 = 0.62
0
10
20
30
40
50
60
70
80
90
0 1 2 3 4 5 6 7 8 9 10 11
Par
ticl
e O
rien
tati
on
, ε(°
)
Particle Area (cm2)
General particles
Elongated particles
Figure 6. Plot of particle orientation versus particle size for a gyratory-compacted specimen.
Table 2. Aggregate orientation of different sizes for 28-mmDBM material.
Aggregate orientation (8)
Particle size (cm2) Gyratory Slab Vibratory Field
0 45.0 45.0 45.0 45.02 48.1 46.5 49.9 45.74 51.2 47.9 54.8 46.56 54.4 49.4 59.7 47.28 57.5 50.8 64.6 48.010 60.6 52.3 69.5 48.7
55International Journal of Pavement Engineering
Dow
nloa
ded
by [
Uni
vers
ity o
f N
ottin
gham
] at
08:
14 2
4 Se
ptem
ber
2015

The results indicate that circumferential alignment of
aggregate particles occurs more in gyratory- and
vibratory-compacted specimens than in slab- or field-
compacted specimens. In addition, this behaviour is more
pronounced for larger aggregate size mixtures (28-mm
DBM and 20-mm HMB) than the smaller size 14mm
surfacing, where the vibratory-compacted specimens
actually show a slight radial alignment. In general, there
is a better agreement between slab- and field-compacted
aggregate alignment (orientation) than between the two
mould-based techniques (gyratory and vibratory) and field
compaction. Both the slab- and field-compacted specimens
display a more random particle orientation, than the
circumferential aggregate orientation found for gyratory
and vibratory compaction as highlighted in Figure 7.
The reason for the circumferential orientation is
difficult to verify, but two likely contenders are (i)
boundary effects due to the confining nature of the
gyratory and vibratory moulds and (ii) the circumferential
shear stress imparted by the inclined plate of the gyratory
compactor and the kneading action of the vibratory
hammer. The relative influence of these two effects can be
investigated by removing the influence of the mould
boundary by altering the compaction and testing
methodology as shown in Figure 8. After gyratory
compaction and extraction, a set of asphalt mixture
specimens were trimmed to produce 150mm diameter by
60mm high specimens for subsequent image analysis,
density and mechanical property testing. The top and
bottom 20mm of the compacted specimens (high air void
content sections) were removed in order to obtain as
consistent a void content distribution as possible as
described by Masad et al. (1999, 2002). The 150mm
diameter specimens were then cored to obtain 100mm
diameter by 60mm high specimens as shown in Figure 9.
The aggregate orientation as a function on increasing
particle size (area) for the different sized specimens is
presented in Table 5. However, instead of seeing a
reduction in slope (circumferential particle orientation)
and a more random distribution of aggregate orientations,
the 100-mm specimens had very similar orientations (for
both the gyratory and vibratory specimens). The results in
Tables 2–4 show that slab-compacted specimens exhib-
ited a smaller degree of circumferential alignment
compared to gyratory and vibratory compaction, with
this reduced orientation thought to be due to the lack of
mould confinement as the specimens were cored from a
larger slab. However, there was still a degree of
circumferential orientation that was thought to be due to
the coring process producing erroneous elongated particles
that were analysed as circumferentially orientated
particles. A similar process was thought to be happening
with the cores from the 150-mm diameter gyratory and
vibratory specimens as shown in Figure 10.
To overcome this possible error, the 150-mm diameter
images were reanalysed by using the computer software to
artificially core the larger specimen by only determining
the orientation of those particles that had their centres
within a radius of 50mm from the centre of the specimen
as shown in Figure 11.
The results in Table 5 clearly show that using this
approach leads to a large reduction in the particle
orientation and, therefore, a more random particle
orientation for both the gyratory- and vibratory-compacted
specimens. The values shown in Table 5 for the computer-
trimmed 100-mm cores are similar to the values obtained
for slab-compacted specimens (Hunter et al. 2004a, Iwama
et al. 2007).
Table 4. Aggregate orientation of different sizes for 14-mmsurfacing.
Aggregate orientation (8)
Particle size (cm2) Vibratory Field
0 45.0 45.02 43.9 45.74 42.8 46.36 41.7 47.0
Table 3. Aggregate orientation of different sizes for 20-mmHMB material.
Aggregate orientation (8)
Particle size (cm2) Gyratory Slab Vibratory Field
0 45.0 45.0 45.0 45.02 47.5 46.0 48.0 45.64 49.9 47.1 51.0 46.36 52.4 48.1 54.1 46.98 54.8 49.2 57.1 47.5
Gyratory
Vibratory
Sla
Field
Figure 7. Horizontal sections through 150-mm diameter coresof 28-mm DBM.
56 G.D. Airey and A.C. Collop
Dow
nloa
ded
by [
Uni
vers
ity o
f N
ottin
gham
] at
08:
14 2
4 Se
ptem
ber
2015

Aggregate segregation
Aggregate segregation is another parameter by which the
aggregate matrix may be described. Ideally, a specimen
made up of a continuously graded mixture should have an
even distribution of particles across its volume. However,
due to inevitable segregation which occurs during all
compaction processes, this is rarely the case. In this study,
the aggregate segregation has been considered from two
perspectives: (i) relative to the centre of the cross-section
using sectors (radial segregation) and (ii) by considering
the inner and outer regions of the specimen cross-section
(regional segregation) (Hunter et al. 2004a).
For the radial segregation, the method of analysis
involved splitting the cross-section into sectors of 58, withthe entire cross-section comprising 72 sectors. If the
aggregate particles in 18 adjacent sectors are summed up
then the area of aggregate present in a quarter of the cross-
section is obtained. By shifting around the cross-section by
58 the area of aggregate in 72 different quarters can be
calculated, from which the maximum may be selected.
This process is shown graphically in Figure 12 where the
individual sectors have been denoted by a. This process
enables the quarter with the maximum aggregate density to
be located as well as the aggregate densities in the
Vertical pressure Take core from 150mm
diameter specimen
60mm
150mm 100mm
Voids
Angle ofgyration(degrees)
Gyratorymotion
Cut specimen
150mm
H = 60mm
Figure 8. Specimen dimensional testing methodology for gyratory compaction.
(a) (b)
Figure 9. Coring process on gyratory and vibratory cores (a) 150-mm diameter, (b) 100-mm diameter.
Table 5. Aggregate orientation of 150-mm and 100-mm diameter specimens for 28-mm DBM material.
Aggregate orientation (8)
Gyratory Vibratory
Particle size (cm2) 150mm 100mm C100mm 150mm 100mm C100mm
0 45.0 45.0 45.0 45.0 45.0 45.02 48.1 48.1 45.3 49.9 49.5 45.84 51.2 51.1 45.7 54.8 54.0 46.66 54.4 54.2 46.0 59.7 58.6 47.38 57.5 57.2 46.4 64.6 63.1 48.110 60.6 60.3 46.7 69.5 67.6 48.9
57International Journal of Pavement Engineering
Dow
nloa
ded
by [
Uni
vers
ity o
f N
ottin
gham
] at
08:
14 2
4 Se
ptem
ber
2015
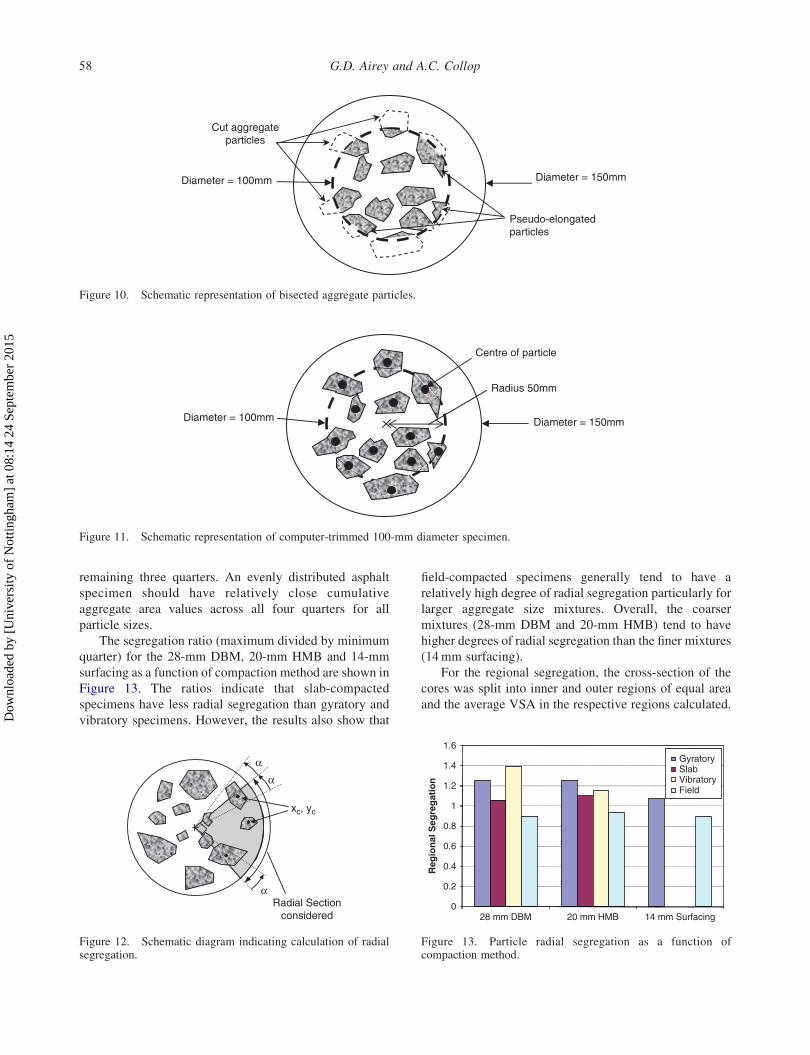
remaining three quarters. An evenly distributed asphalt
specimen should have relatively close cumulative
aggregate area values across all four quarters for all
particle sizes.
The segregation ratio (maximum divided by minimum
quarter) for the 28-mm DBM, 20-mm HMB and 14-mm
surfacing as a function of compaction method are shown in
Figure 13. The ratios indicate that slab-compacted
specimens have less radial segregation than gyratory and
vibratory specimens. However, the results also show that
field-compacted specimens generally tend to have a
relatively high degree of radial segregation particularly for
larger aggregate size mixtures. Overall, the coarser
mixtures (28-mm DBM and 20-mm HMB) tend to have
higher degrees of radial segregation than the finer mixtures
(14mm surfacing).
For the regional segregation, the cross-section of the
cores was split into inner and outer regions of equal area
and the average VSA in the respective regions calculated.
Diameter = 150mm Diameter = 100mm
Pseudo-elongatedparticles
Cut aggregateparticles
Figure 10. Schematic representation of bisected aggregate particles.
Diameter = 100mm
Radius 50mm
Centre of particle
Diameter = 150mm
Figure 11. Schematic representation of computer-trimmed 100-mm diameter specimen.
xc, yc
Radial Sectionconsidered
α
α
α
Figure 12. Schematic diagram indicating calculation of radialsegregation.
0
0.2
0.4
0.6
0.8
1
1.2
1.4
1.6
28 mm DBM 20 mm HMB 14 mm Surfacing
Reg
ion
al S
egre
gat
ion
GyratorySlabVibratoryField
Figure 13. Particle radial segregation as a function ofcompaction method.
58 G.D. Airey and A.C. Collop
Dow
nloa
ded
by [
Uni
vers
ity o
f N
ottin
gham
] at
08:
14 2
4 Se
ptem
ber
2015

The ratio of inner to outer VSA is presented in Figure 14
and shows that a relatively large difference in average
VSA exists for the vibratory- and gyratory-compacted
samples, possibly due to the vibration and gyratory action
causing larger particles to migrate to the boundary of the
sample. This behaviour is consistent with the findings of
Tashman et al. (2001). The slab-compacted samples
showed a near uniform particle size distribution across the
regions considered, while field cores showed a slightly
higher concentration of aggregate in the inner region.
Mechanical property results
Asphalt mixture stiffness
The main objective of the testing programme was to
establish which mechanical parameters were most
sensitive to the mode of compaction. The volumetric
proportions (air void contents) together with the stiffness
results from the ITSM are presented in Tables 6–9 for the
28-mm DBM, 20-mm HMB, 14-mm surfacing and 32-mm
HMB asphalt materials. The average, standard deviation
and coefficient of variation were recorded for the different
compaction methods. In general, the results of the air voids
and stiffness moduli for the 28-mm DBM asphalt mixture
are relatively consistent with low coefficients of variation
within the range of 8–15% for the air voids and 7–14%
for stiffness modulus for the laboratory compaction
methods. The coefficients of variation for the 20-mm
DBM, 14-mm surfacing and 32-mm HMB asphalt
mixtures are slightly higher with the field variations
tending to be higher for all four mixtures. The increased
variability associated with the air void contents of the
laboratory-compacted 20-mm, 14-mm and 32-mm asphalt
mixture specimens may be partly due to the use of stiffer
and polymer-modified bitumens in these materials
compared to the 28-mm DBM mixture (Hunter et al.
2009).
The mean stiffness moduli as a function of mean air
voids for the 14-mm asphalt mixture are plotted in
Figure 15. In this plot, the vibratory- and field-compacted
specimens are of comparable stiffness if the difference in
air void content is accounted for (increased air voids for
field cores). The gyratory-compacted specimens, with
similar air void content to the site-compacted specimens,
have almost double the mean stiffness modulus. The
combined results for all four asphalt mixture types
(Table 6–9) show a degree of scatter with no one
laboratory compaction method consistently producing
either extremely high or low stiffness modulus specimens.
However, in general the mould-based compaction methods
(gyratory and vibratory) tend to produce specimens of
1
1.1
1.2
1.3
1.4
1.5
1.6
28 mm DBM 20 mm HMB 14 mm Surfacing
Rad
ial S
egre
gat
ion
Rat
io
GyratorySlabVibratoryField
Figure 14. Particle regional segregation as a function ofcompaction method.
Table 6. Volumetric and stiffness modulus results for 28-mmDBM asphalt mixture.
Compaction method
Properties Gyratory Slab Vibratory Field
Average air voids (%) 3.1 3.0 2.8 8.2Standard deviation airvoids (%)
0.4 0.4 0.2 1.8
CoV air voids (%) 13 14 8 22Average stiffness (MPa) 7906 7323 10,089 1891Standard deviationstiffness (MPa)
596 540 932 269
CoV stiffness (%) 8 7 9 14
Table 7. Volumetric and stiffness modulus results for 20-mmHMB asphalt mixture.
Compaction method
Properties Gyratory Slab Vibratory Field
Average air voids (%) 4.0 2.7 2.9 1.6Standard deviation airvoids (%)
1.6 0.9 0.9 0.7
CoV air voids (%) 40 33 32 42Average stiffness (MPa) 10,601 8173 10,022 5476Standard deviationstiffness (MPa)
882 493 2066 586
CoV stiffness (%) 8 6 21 11
Table 8. Volumetric and stiffness modulus results for 14-mmsurfacing material.
Compaction method
Properties Gyratory Vibratory Field
Average air voids (%) 3.4 2.2 2.8Standard deviation air voids (%) 0.6 0.7 0.6CoV air voids (%) 19 31 20Average stiffness (MPa) 2889 2104 1565Standard deviation stiffness (MPa) 228 252 196CoV stiffness (%) 8 12 13
59International Journal of Pavement Engineering
Dow
nloa
ded
by [
Uni
vers
ity o
f N
ottin
gham
] at
08:
14 2
4 Se
ptem
ber
2015

higher stiffness than the roller- (slab) and field-compacted
specimens as shown in Figure 16 where the average
stiffness values, relative to gyratory compaction, are
depicted.
Assuming that the mixture design, mixing procedures,
compaction temperatures and volumetrics are identical,
the reasons for the different stiffness results can be linked
to the internal structure of the asphalt mixture matrix. The
results in this and other studies have established that a
circumferential aggregate orientation occurs in mould-
based compaction (Hunter et al. 2004a), as well as a
distribution of aggregate sizes between the inside and
outside of the specimen (Masad et al. 1999, 2002,
Tashman et al. 2001, 2002). These studies have also
revealed a ‘bath tub’ air void distribution in gyratory-
compacted specimens, i.e. far higher air void content at the
surfaces in contact with the loading platens. In contrast,
linear kneading (vibratory) compactors produce a near
linear increase of air void content with depth. These
distinct particle arrangements within a specimen will have
a direct influence on the micro-mechanical properties as
manifested through variations in stiffness modulus
between compaction methods.
The aggregate orientations shown in Table 5 indicate
that a more random particle orientation (aggregate matrix)
can be produced for mould-based compaction methods by
coring 100-mm diameter specimens from larger 150-mm
diameter specimen. Although, this has only had a marginal
effect on stiffness modulus as shown in Table 10, it is
interesting to note that both the stiffness and air void
contents of the smaller specimens are lower than those of
the larger specimens and, therefore, closer to the slab and
field values.
Asphalt mixture rutting resistance
The permanent deformation results obtained from the
RLAT for the 20-mm asphalt mixture are shown in
Figure 17 as a function of air void content. The results, if
viewed as a whole, show an increase in resistance to
permanent deformation of the specimens with an increase
in air voids, levelling out at approximately 3.5% air void
content. Gibb (1996) reported a similar relationship is his
study where poor resistance to permanent deformation was
observed in both vibratory-compacted specimens and field
cores with low air voids, typically below 3% for a range of
UK asphalt mixtures. He hypothesised that this was due to
insufficient void space to accommodate the bitumen/fines
mortar, resulting in loss of frictional contact between
aggregate particles under loading. Furthermore, data
Table 9. Volumetric and stiffness modulus results for 32-mmHMB asphalt mixture.
Compaction method
Properties Gyratory Slab Vibratory Field
Average air voids (%) 3.8 3.4 4.4 4.1Standard deviation airvoids (%)
1.3 0.5 0.5 1.7
CoV air voids (%) 34 15 6 42Average stiffness (MPa) 11,003 10,327 12,233 6411Standard deviationstiffness (MPa)
2050 841 675 859
CoV stiffness (%) 19 8 6 13
500
1,000
1,500
2,000
2,500
3,000
3,500
4,000
1 1.5 2 2.5 3 3.5 4 4.5 5
Sti
ffn
ess
mo
du
lus
(MP
a)
Air voids (%)
GyratoryVibratoryField
Figure 15. Stiffness modulus against air voids for differentcompaction modes – 14-mm surfacing asphalt mixture.
0
0.2
0.4
0.6
0.8
1
1.2
1.4
28 mm DBM 20 mm HMB 14 mm Surfacing 32 mm HMB
Rel
ativ
e S
tiff
nes
s
Gyratory Slab
Vibratory Field
Figure 16. Asphalt mixture stiffness relative to gyratory-compacted asphalt stiffness.
Table 10. Volumetric and stiffness results for the 150-mm and100-mm diameter 28-mm DBM asphalt specimens.
Gyratory Vibratory
Properties 150mm 100mm 150mm 100mm
Average air voids (%) 2.8 2.5 3.1 2.7Standard deviation airvoids (%)
0.8 1.1 1.2 1.0
CoV air voids (%) 28 42 37 37Average stiffness (MPa) 6786 6304 8042 7435Standard deviationstiffness (MPa)
566 597 670 642
CoV stiffness (%) 8 9 8 9
60 G.D. Airey and A.C. Collop
Dow
nloa
ded
by [
Uni
vers
ity o
f N
ottin
gham
] at
08:
14 2
4 Se
ptem
ber
2015

relating to continuously graded DBM materials indicated
an ‘optimum void content range’ typically 3–8% within
which the asphalt mixture performance remained rela-
tively constant. Above 8–10% air void content, there is a
marked reduction in resistance to permanent deformation.
Another interesting observation from this study was that at
high air voids (.10%) there is little difference in
permanent deformation performance between laboratory-
and field-compacted specimens indicating that the degree
of compaction is more significant than the method of
compaction (Gibb 1996).
Looking at the different compaction methods, the field
specimens are considerably different from the laboratory-
compacted specimens both in terms of axial strain (mean
axial strain of 1.41%) and air voids (mean air voids of
1.7%). The slab-compacted specimens have a higher air
void content (2.7%) and significantly lower axial strain
(0.64%). There is a further increase in resistance to
permanent deformation for the gyratory- (average
permanent strain of 0.40%) and vibratory- (average
permanent strain of 0.32%) compacted specimens. It
should be noted that the gyratory-compacted specimens
have higher mean air void content (4.0%) than the roller-
and vibratory-compacted specimens (2.7% and 2.9%
respectively). In general, the data suggest that mould-
based compaction methods (gyratory and vibratory)
produce specimens with greater resistance to permanent
deformation compared to roller compaction. This can be
clearly seen over the air void range of 2–4% for the
gyratory-, vibratory- and roller-compacted asphalt mix-
tures specimens in Figure 17.
The permanent deformation performance of all the
asphalt mixtures, quantified by the ultimate percentage
strain after 3600 cycles, is presented in Table 11, with the
permanent deformation performance relative to gyratory
compacted specimens shown in Figure 18. The results
clearly show the superior permanent deformation per-
formance of the gyratory- and vibratory-compacted
specimens compared to the slab and particularly the field
compacted cores. Although the permanent strain results
for the slab and field specimens of the 32-mm HMB are
almost identical, the strains for the field specimens are
more than double that of the slab cores for the 20-mm
HMB mixture.
Asphalt mixture fatigue
The fatigue results from the ITFT for the 28-mm DBM
asphalt mixture are shown in Figure 19 in the form of the
fatigue relationship defined in Equation 4 and using a
strain criterion. The seven sets of fatigue data, representing
the three compaction methods (gyratory, vibratory and
roller slab) and five laboratories (all gyratory compaction),
all lie on the same fatigue function (Hunter et al. 2009). It
is arguable whether any significantly different fatigue lines
exist between the data-sets beyond the natural variation
associated with a fatigue (failure) test. This is sub-
stantiated by an R 2 value of 0.85 for the fatigue line of best
fit for the aggregated data-sets.
Conclusions and discussion
The mechanical property results show that in general
mould-based compaction methods (gyratory and vibra-
tory) form asphalt mixture specimens of greater stiffness
and resistance to permanent deformation. Site cores appear
to lie at the other end of the spectrum in terms of
0
0.5
1
1.5
2
2.5
0 1 2 3 4 5 6 7 8
Axi
al S
trai
n (
%)
Air Voids (%)
GyratoryRoller SlabVibratoryField
Figure 17. Permanent strain versus air voids for differentcompaction modes – 20-mm DBM asphalt mixture.
Table 11. Average permanent strain results from RLAT.
Permanent strain (%) after 3600loading cycles
Asphalt mixture Gyratory Slab Vibratory Field
28-mm DBM mixture 0.58 1.33 0.65 –20-mm DBM mixture 0.39 0.64 0.32 1.4114-mm surfacing 0.56 – 1.36 1.5632-mm DBM mixture 0.51 1.39 0.67 1.34
0
0.5
1
1.5
2
2.5
3
3.5
4
Rel
ativ
e A
xial
Per
man
ent
Str
ain Gyratory Slab
Vibratory Field
28 mm DBM 20 mm HMB 14 mm Surfacing 32 mm HMB
Figure 18. Asphalt mixture permanent strain relative togyratory-compacted permanent strain.
61International Journal of Pavement Engineering
Dow
nloa
ded
by [
Uni
vers
ity o
f N
ottin
gham
] at
08:
14 2
4 Se
ptem
ber
2015

mechanical performance and, in general, have lower
stiffness and increased susceptibility to permanent
deformation. Conversely, the mode of compaction does
not appear to influence the fatigue response of an asphalt
mixture (unique fatigue relationship for each asphalt
mixture independent of compaction method). However,
there are several exceptions to these general trends which
may be seen from the data presented in this article. Indeed
within a given compaction method there will be
considerable scope for variation, as demonstrated by the
difference in stiffness between the type of gyratory
compactor (28-mm asphalt mixture) and operation of
roller compactors (20-mm asphalt mixture) (Hunter et al.
2009). Sousa et al. (1991) also recognised that compactors
within a given mode of compaction may manufacture
specimens with quite different properties. They used the
example of a kneading compactor, stating that the
compaction parameters (size of foot, number of tamps,
size of specimen, thickness of layer, tamping pressure) and
the variation of these parameters will almost certainly
affect many mixture properties linked to asphalt
performance. This view was further reinforced by the
findings of Harvey et al. (1994).
Within any one generic compaction mode there would
appear to be compaction variables which have an effect on
the stiffness and permanent deformation of the specimens for
a given air void content. For example, in gyratory
compaction it could be the angle of gyration or the
compaction pressure. For roller (slab) compaction probable
parameters are compaction pressure and roller speed. In
addition, the importance of sample preparation, bitumen and
aggregate heating temperatures and duration and finally
mixing procedures cannot be overlooked. All these
parameters undoubtedly have an influence on the micro-
mechanical behaviour of the coated aggregate particles.
Based on the findings from this study on the
comparison between laboratory and field compaction in
terms of the physical particle arrangement and mechanical
properties of asphalt mixtures, the following conclusions
are relevant:
Gyratory and vibratory compactions produce asphalt
mixture specimens that are susceptible to circumferential
particle orientation with the degree of circumferential
orientation increasing with particle size. This aggregate
orientation is probably due to boundary conditions
associated with the moulds used with these compaction
methods.
The circumferential particle alignment associated with
gyratory and vibratory compaction can be eliminated to a
certain degree by removing smaller diameter specimens
for testing from larger diameter compacted specimens.
This has the effect of producing an internal aggregate
structure similar to that found in field- and slab-compacted
specimens.
In terms of radial and regional segregation, the three
laboratory compaction methods and field compaction
showed various degrees of particle segregation. The
gyratory and vibratory specimens showed a higher radial
segregation ratio than slab-compacted specimens but not
as high as field cores. Regional segregation tended to be
more prevalent in vibratory- and gyratory-compacted
specimens compared to slab- and field-compacted
specimens.
Overall, slab-compacted specimens tend to show
closer correlation with field cores than gyratory- and
vibratory-compacted specimens.
10
100
1,000
100 1,000 10,000 100,000 1,000,000
Init
ial S
trai
n (
με)
Number of Load Cycles to failure (Nf)
Gyratory Lab #1 Gyratory Lab #2
Gyratory Lab #3 Gyratory Lab #4
Gyratory LCPC Vibratory
Roller Slab
R2 = 0.85
Figure 19. Fatigue as a function of laboratory compaction method for 28-mm DBM.
62 G.D. Airey and A.C. Collop
Dow
nloa
ded
by [
Uni
vers
ity o
f N
ottin
gham
] at
08:
14 2
4 Se
ptem
ber
2015

The results show that mould-based compaction
methods (gyratory and vibratory) generally produce stiffer
specimens with higher resistance to permanent defor-
mation when compared to slab ‘roller’-compacted speci-
mens and field compacted cores of comparable air voids.
This may be a result of possibly higher compaction
energies being associated with the gyratory and vibratory
compaction methods.
References
Airey, G.D., Hunter, A.E., Collop, A.C., and Zoorob, S.E., 2006.Comparison of field and laboratory compacted asphaltmixtures. In: 10th international conference on asphaltpavements, Quebec City. Leiden, The Netherlands: Balkema,Vol. 1, 35–46.
Brown, S.F. and Gibb, J.M., 1996. Validation experiments forpermanent deformation testing of bituminous mixtures.Journal of the Association of Asphalt Paving Technologists,65, 255–299.
Brown, S.F. and Gibb, J.M., 1999. Effects of compaction onmechanical properties of asphalt mixtures. In: 7th conferenceon asphalt pavements for southern Africa, Victoria Falls,Zimbabwe. Cape Town: CAPSA.
Consuegra, A., Little, D.N., Quintas, H.V., and Burati, J., 1989.Comparative evaluation of laboratory compaction devicesbased on their ability to produce mixtures with engineeringproperties similar to those produced in the field. Transpor-tation Research Record, 1228, 80–87.
Gibb, J.M., 1996. Evaluation of resistance to permanentdeformation in the design of bituminous paving mixtures.Thesis (PhD), University of Nottingham.
Harvey, J. and Monismith, C.L., 1993. Effects of laboratoryasphalt concrete specimen preparation variables on fatigueand permanent deformation test results using strategichighway research programme A-003A proposed testingequipment. In: Transportation Research Record 1417.Washington, DC: Transportation Research Board, 38–48.
Harvey, J., Monismith, C.L., and Sousa, J.B., 1994. Aninvestigation of field and laboratory compacted asphalt-rubber, SMA, recycled and conventional asphalt-concretemixes using SHRP Project A-003A equipment. Journal ofthe Association of Asphalt Paving Technologists, 63,511–560.
Hunter, A.E., Airey, G.D., and Collop, A.C., 2004a. Aggregateorientation and segregation in laboratory compacted asphaltsamples. Transportation Research Record, 1891, 8–15.
Hunter, A.E., Airey, G.D., and Collop, A.C., 2004b. Influence ofcompaction method on asphalt mixture internal structure andmechanical properties. In: 3rd eurasphalt and eurobitumecongress, Vienna, Vol. 2, 1868–1877.
Hunter, A.E., McGreavy, L., and Airey, G.D., 2009. Effect ofcompaction mode on the mechanical performance and
variability of asphalt mixtures. ASCE Journal of Transpor-tation Engineering, 135 (11), 839–851.
Iwama, M., Airey, G.D., and Hunter, A.E., 2007. Influence ofasphalt mixture compaction method and specimen size oninternal structure and mechanical properties. In: Inter-national conference on advanced characterisation ofpavement and soil engineering materials, Athens. Leiden,The Netherlands: Taylor & Francis, Vol. 2, 1063–1073.
Masad, E. and Button, J., 2004. Implications of experimentalmeasurements and analyses of the internal structure of HMA.In: Proceedings of the 83rd TRB annual meeting.Washington, DC: Transportation Research Board.
Masad, E., Jandhyala, V.K., Dasgupta, N., Somadevan, N., andShashidhar, N., 2002. Characterization of air void distri-bution in asphalt mixes using X-ray computer tomography.Journal of Materials in Civil Engineering, 14, 122–129.
Masad, E., Muhunthan, B., Shashidhar, N., and Harman, T.,1999. Quantifying laboratory compaction effects on theinternal structure of asphalt concrete. TransportationResearch Record, 1681, 179–185.
Nevitt, H.G., 1959. Some sources of stability measurementvariations. Association of Asphalt Paving Technologists, 28,16–34.
Renken, P., 2000. Influence of specimen preparation onto themechanical behaviour of asphalt mixtures. In: 2ndeurasphalt & eurobitume congress, Barcelona. Breukelen,The Netherlands: Foundation Eurasphalt, 729–735.
Shashidar, N., 1999. X-Ray tomograpy of asphalt concrete.Transportation Research Board, 1681, 186–192.
Sousa, J.B., Deacon, J.A., and Monismith, C.L., 1991. Effect oflaboratory compaction on permanent deformation character-istics of asphalt-aggregate mixtures. Journal of theAssociation of Asphalt Paving Technologists, 60, 533–585.
Tashman, L., Masad, E., Peterson, B., and Saleh, H., 2001.Internal structure analysis of asphalt mixes to improve thesimulation of superpave gyratory compaction to fieldconditions. Journal of the Association of Asphalt PavingTechnologists, 70, 605–645.
Tashman, L., Masad, E., D’Angelo, J., Bukowski, J., andHarman, T., 2002. X-Ray tomography to characterize airvoid distribution in superpave gyratory compacted speci-mens. The International Journal of Pavement Engineering, 3(1), 19–28.
Vallerga, B., 1951. Recent laboratory compaction studies ofbituminous paving mixtures. Association of Asphalt PavingTechnologists, 20, 117–153.
Von Quintas, H.L., Scherocman, J.A., Hughes, C.S., andKennedy, T.W., 1991. Asphalt-aggregate mixture analysissystem, AAMAS. National Cooperative Highway ResearchProgram Report 338. Washington, DC: TransportationResearch Board.
Yue, Q.Z., Bekking, W., and Morin, I., 1995. Application ofDigital Image Processing to Quantitative Study of AsphaltConcrete Microstructure. Transportation Research Record,1492, 53–60.
63International Journal of Pavement Engineering
Dow
nloa
ded
by [
Uni
vers
ity o
f N
ottin
gham
] at
08:
14 2
4 Se
ptem
ber
2015


