

8/7/2019 media_21789_en
http://slidepdf.com/reader/full/media21789en 1/40
1
FOREIGN DIRECT INVESTMENT, DETERMINANTS AND POLICY ANALYSIS:
CASE STUDY OF PAKISTAN.
Ahmed Nawaz Hakro,a
Akhtiar Ahmed Ghumrob
aVisiting Research Scholar at Department of Economics, Glasgow University, Glasgow, UK, [email protected]
bAssistant Professor, Department of Commerce, Shah Abdul Latif University, Khairpur, Pakistan
ABSTRACT
The objective of this study is to understand the determinants of Foreign Direct Investment (FDI) flows
and to quantify relevant policy shocks in dynamic econometric model for Pakistan economy. The study
has highlighted the degree of attraction of cost related factors, investment environment factors,development strategy factors with ownership and internalization factors and other risk factors of recent
FDI flows to Pakistan economy. The results show the investment environment improving factors-openness
is statistically significant in short-run. While long run dynamics between FDI, openness and macro
economic factors show consistency with short run results. The stable macro economic indicators,
country’s risk profile followed by cost related and investment environment improving factors are real
determinants to attract FDI.
Introduction
Vast body of literature suggests that foreign direct investment is linked with economic
environment of the host country [Dunning 1981; 1988; 1993; 2001; Fry, 1992; Borensztein et al.,
1998; Bosworth and Collins, 1999; De Mello, 1999; Agosin and Mayer, 2000; Lipsey, 2000].
Economic environment, in turn, is influenced by the development strategies and macro-
organizational policies of the host country’s government see e.g. Dunning (1993), Choe (2003).
In many country case studies the empirical evidence varies from country to country, due to
variations in their national policies, the response of domestic enterprises, the type of FDI flow,
and the econometric methodology employed e.g. see [Apergis et al .2006; De Mello, 1999;
Agosin and Mayer, 2000]. Literature also established the fact that the nature and volume of FDI
in DCs and LDCs are very different and certainly its impact in DCs and LDCs would be different
e.g. see Blonigen and Wang (2005).

8/7/2019 media_21789_en
http://slidepdf.com/reader/full/media21789en 2/40
2
The literature further suggests that following broad categories of factors that influence FDI are: i)
The cost-related factors1 ii) The investment environment improving factors2 iii) The macro
economic factors and development strategy of a country3. Furthermore, the political risk rating of
the country cannot be ignored. An unstable political environment makes investment risky and
therefore erodes the investor’s confidence. The political ideology and hence development
strategy of the host country plays a critical role particularly with respect to the type of investment
to be undertaken. For instance, it may be a restrictive import-substitution strategy, which draws
investment geared for the domestic market. Alternatively, it may be a less restrictive export-
orientation strategy that promotes investment for exports e.g. see Blonigen and Wang (2005).
Blonigen (2005) in his recent survey article confirms that more recent body of literature has
begun to frame the frameworks and started to generate predictions of how fundamental country-
specific factors aggregate country level determines the FDI behavior.
While looking at the pattern of Foreign Direct Investment in Pakistan, which has been very
impressive in recent years. FDI has been increased from $ 322 million in 2000-01 to $3.52
billion in 2005-06 and expected to be $6 billion dollars in 2006-07 according to government
1 The presence of a significant cost factor disparity between a home country and a host country may significantlyinfluence the choice of an investment location. Such a disparity might be particularly in which major marketimperfections arise from the disproportionate cost of given unit of inputs between the developed countries and the
developing countries.2 The FDI policy liberalization package may include, ownership policies, taxes/subsidies (including tariffs andtransfer payment), convertibility of currency (including limits on dividends and royalties and fees) price controls,and performance requirements (such as export, local content and foreign exchange balancing abilities).3 Under the macro-economic factors, we consider factors that can in their own right influence foreign firms toconsider direct investment in the host country as opposed to continuing to service it either through exports orthrough other means such as licensing. Here, there are two market familiar factors. i.e current market size and thepotential market size. While a large domestic market size generates scale economies, a growing market improves theprospects of market potential. Therefore, the larger the current market size and the higher the market growth rate, themore likely that the investment will take place. In addition, there are factors such as the quality of the availableinfrastructure that facilitate the production and distribution processes of goods and services that will induce FDIinflows. Thus, the availability of skilled manpower (both technical and managerial) and good physical infrastructurewill induce FDI inflows. (Markusen and Venables, 1999; Driffield and Munday, 2000).

8/7/2019 media_21789_en
http://slidepdf.com/reader/full/media21789en 3/40
3
pronouncement. Earlier, it has different trends, as Pakistan received little amount of FDI4,
because Pakistan was heavily dependent on the debt5. By 1996 its share raised to almost 50
percent of net resource flows6. Considering the openness of the investment regime, foreign
investment activity to date has been registered a substantial increase in FDI flows. Pakistan was
among the first few countries in the region to open up the market in early nineties. Pakistan does
not only have an enviable record of accomplishment of economic growth in sixties but still it has
the potential to repeat the past. It still enjoys some economic fundamentals. The country has
often come out with pro-investment policies. The government of Pakistan under took program of
liberal economic reforms including liberalization, privatization, and deregulation to bring the
economy into a fully market-oriented system. Foreign investment is generally subject to the same
rules as domestic investment, with the exception of certain sensitive areas such as defense
production, banking, and broadcasting. However, the new Investment Policy provides equal
investment norm opportunities for both domestic and foreign investors. Enormous literature has
been written on FDI flows vis-à-vis Pakistan e.g. Akhtar et al (2001), Khan 1996, Guisinger
(2001), Ashfaq (1997), Nishat et al (1998), Sharif (1997) and Khawaja (1995,2000). Earlier
studies on FDI flows are conducted in the spirit of understanding the factors responsible for low
4 In spite of liberalizing its formerly inward looking FDI regime, tempering or removal of obstacles to foreigninvestors, and according various incentives, Pakistan's performance in attracting FDI has been lackluster (AshfaqueH. Khan and Yun Hwan Kim 1999). Pakistan received very little amount of FDI when compared with theopportunities and economic (UNCTAD-World Investment Report 1993-96).5 Direct government-to-government assistance was readily available during the 1960s, 1970s and 80s.. During thecold war East West competition USA and other western governments provides aids to their allies . Since 1970 theshare of grants has decreased, the rise in the non- concessional loans has hardened the debt profiles. During thatperiod, the FDI gradually increased up to 16% of all flows. In 1985, foreign private capital flows provideinsignificant portion of Pakistan’s external finances. FDI increased from negligible amounts in 1980s to over $500million by 1995.6 This had changed dramatically since 1995 when Independent Power Projects (IPP) brought into significant amountof FDI for investment into electricity generation and recent increase in investment in telecom and oil and gassectors.

8/7/2019 media_21789_en
http://slidepdf.com/reader/full/media21789en 4/40
4
FDI in Pakistan7. The earlier literature in this connection is essential but hardly substantive or
convincing to understand the determinants of FDI and recent rise in FDI, no study has been
conducted to study the factors responsible for recent rise in FDI, the earlier studies are either
superficial or theoretical and mainly focusing the socio-political and economic constraints for
low level of FDI and its reasons. No quantification model or simple OLS regression has been
applied to generate the nature of relationship among the set of variables. A lot has been changed
since, the accelerated economic reforms or recent stability specially after 9/11, or nuclear tests of
1998 and resultant economic sanctions and the nature and working of the key macro economic
variables etc, Other than this the interrelationship of different factors, forecasting and the
causality direction with respect to social and political risk index measurement still missing in
earlier studies, which requires the further investigation. Consequently, this study is designed to
understand the number of factors determining the recent increase in foreign investment in the
country. This study has filled the gap. The objectives of the study are to investigate; i) key
determinants of FDI flows to Pakistan economy ii) relationship of FDI and macro economic
fundamentals in dynamic process of short run and long run iii) potential attraction factors of FDI
(socio-political and economic factors, development strategy etc) iv) effect of investment and
liberalization policies on FDI and the structural shocks of 1998 Nuclear tests and September 11,
2001.
Rest of the paper is organized as; Section II is literature review followed by Section III-
Methodology and last section IV- Results, Conclusion and Policy recommendations.
7 The factors, which are identified; e.g. the lack of trained, educated, and disciplined labor force along withcomplicated and over protective labor laws, has inhibited business expansion and frightened away productiveinvestment. The cultural and social taboos as well as quality of life are not conducive to attracting foregoinginvestors to Pakistan. The lack of welcome to foreign investors by government agencies and officials has also been aproblem etc.
8/7/2019 media_21789_en
http://slidepdf.com/reader/full/media21789en 5/40
5
II. Literature review
There is a vast body of empirical literature, e.g. Mac Dougall (1960), Andrea Marino (2000),
Balasundram (2000), Azmat (1999), Chakrabarti, (1997, 2001), Gordon (2001), Kojima (1973),
Hymer (1976), Kishor (2000), on whether foreign direct investment is beneficial to host
country’s growth or not and has shown the likelihood that the, market size, trade policy regime
followed by host countries development policies influences significantly both the amount of
inward FDI received by recipient countries and the impact of foreign direct investment on
growth, as suggested by the trade theory. Fry (1993), in his paper analysis macro impacts of FDI,
the results from macro econometric analyses showed that, unlike Latin American cases, FDIs in
Asia lead to a direct expansion of productive stock, and rates of domestic savings and investment
tend to increase together with an inflow of FDI ("co-finance effects"). Hein (1993), and Dollar
(1992), found in his paper, that out-ward oriented developing economies, (i.e., those that rely on
new export markets) have been successful in attracting FDI flows. Whereas, Usha et al (1999 -
Revised 2000), used a mixed fixed and random (MFR) panel data estimation method to allow for
cross-country heterogeneity in the causal relationship between FDI and growth, found that the
relationship between investments, both foreign and domestic, and economic growth in
developing countries is highly heterogeneous and that estimation methods, which assume
homogeneity across countries, can yield misleading results. The results suggest that there is some
evidence that the efficacy of FDI in raising future growth rates, although heterogeneous across
countries, is higher in more open economies. Francisca et al (1996), suggested that market size,
growth rate, labor costs, export flows and tariff barriers have shown to influence U.S. foreign
direct investment in the European Union. Sung-Hoon Lim et al (1998), explained that Foreign
Direct Investment (FDI) bring about various positive externalities such as stable inflow of

8/7/2019 media_21789_en
http://slidepdf.com/reader/full/media21789en 6/40
6
foreign capital, increase in employment, increase in gross national product, improvement in
balance of payments and transferring multinational corporations' advanced managerial skill and
technology to the host country. These positive externalities can be the main goal of FDI inducing
policy. Saskia et all (1998), they have analyzed the determinants of net foreign direct
investment (FDI) inflows in emerging economies between 1978 and 1995. The theoretical
framework of this study is based on the concept of the Institutional FDI Fitness theory, which
stipulates that FDI is determined less by intransigent fundamentals than by institutional variables
more amenable to change, namely policies, laws, and their implementation. This has suggested
that four institutions contributing to FDI Fitness are government, markets, education, and socio-
culture8. Root and A. Ahmed (1979) also found that the number of regular (constitutional)
changes in government leadership between 1956 and 1967 was significant. However, other
political variables, such as the number of internal armed attacks, the degree of nationalism and
colonialism and colonial affiliations, were not significant. Schneider and Bruno Frey (1985)
found a negative relationship between the number of political strikes and riots in the host
countries and FDI flows. Nigh (1985), by using the COBDAB9 database, which constructs
aggregate measures of intra country and inter-country conflicts and co-operations, founded that,
for developed countries, inter-country political events are more significant determinants of FDI
than intra country events. For developing countries, intra country political events had a more
robust relationship with FDI. Wheeler and Moody (1992), has found a broad principal
component measure of administrative efficiency and political risk as the determinants of FDI.
8 They tested the FDI Fitness concept in an econometric cross-section across 67 emerging economies. Theireconometric analysis showed government and market variables as the most significant determinants of FDI inflows.Governmental fitness is reflected in economic openness with only minimal trade and exchange rate controls.Government fitness also means a strong rule of law and low corruption, based on legal and administrative equity andtransparency.9 Conflict and peace data base

8/7/2019 media_21789_en
http://slidepdf.com/reader/full/media21789en 7/40
7
Lucas’s (1993) by using episodic dummies for good events, such as the Asian and Olympic
Games in the Republic of Korea, and President Aquino’s accession in the Philippines, to be
positively related to inward FDI. Conversely, negative events, such as Sukarno’s rule in
Indonesia, Park’s assassination in the republic of Korea and Ferdinand Marco’s martial law in
the Philippines have had a negative effect on inward FDI. Helliener (1988), and UNCTAD-DTCI
(1996) have pointed out; investment incentives created by governments appear to play a limited
role in FDI decisions. Salvador (2000), paper analyzed positive spillovers related to Foreign
Direct Investment (FDI) using an establishment-level panel of Spanish manufacturing industry
that spans the period 1990-1994. Aggarwal, (1997), explains that economic reforms in a host
country not only confer greater freedom on TNCs in their choice to internalize or not, but also
affect the market conditions, which in turn, influence this choice. J. Peter (2002), this paper
‘FDI and single markets’ extends the theory of multinational corporations, found three distinct
influences of internal trade liberalization by a group of countries on the level and pattern of
inward foreign direct investment (FDI). First, the tariff-jumping motive encourages plant
consolidation. Second, the export platform motive favors FDI with only a single union plant
relative to exporting, and may induce a firm, which has never exported to invest. Finally,
reduced internal tariffs increase competition from domestic firms, which dilutes the other
motives and may induce a "Fortress Europe" outcome of multinationals leaving union markets
even though external tariffs are unchanged.
Kadi (1999), synthesizes that causes of low percentage of FDI in Middle East due to many
factors including chronic political instability, empirical evidence drawn from model that test
cross section data of 59 countries to provide evidence of positive relationship between both

8/7/2019 media_21789_en
http://slidepdf.com/reader/full/media21789en 8/40
8
trends, FDI and economic freedom. Stephen et al, (1997), According to the findings of their
research work the gross domestic product (GDP), imports, exports, infrastructure, political risk,
are significant influences on the decisions of MNCs to invest abroad 10. Pattama, (1999) in his
thesis examined the long run relation ship between FDI and domestic investment in Thailand.
The main findings of the empirical analysis are that FDI has a significantly positive long run
effect on domestic investment in Thailand. This result holds true for all the cases examined,
using two different estimation methods11. Laura (1999) explained by applying the regression
that a statistically significantly positive association has been found between FDI and market size,
wage differential, the stage of the transition process and the degree of openness of economy as
well. However, a statistically significant negative relation has been found for proximity to
Europe and the degree of industrial concentration.
Sayek Selin, (1999), in his thesis ‘FDI and inflation: Theory and evidence’ explained the
relationship between FDIs and inflation. This research’s results from an impulse response
analysis supported the theoretical model, shown a 3 percent increase in Canadian inflation
reducing US FDI in Canada by 2 percent and increasing USA domestic investment by 1percent.
Similarly, a 7 percent increase in Turkish inflation reduces US FDIs in Turkey by 1.9 percent,
increasing US domestic investment by 0.3percent. Dunning (1977, 1979, 1988 and 1993)
presented OLI (ownership, location, and internalization) theory as an eclectic approach. In
analyzing prerequisites for FDI to take place, Dunning asserted that a firm should have a firm-
specific advantage (ownership), a location advantage to mobilize this firm specific know-how
(location), and an incentive to internalize external transactions (internalization).
10Using 20 years of FDI international data.11The long run relationship implied by the theoretical model was implemented empirically for Thailand, using paneldata for eight sectors of the economy for the period from 1971-1995.

8/7/2019 media_21789_en
http://slidepdf.com/reader/full/media21789en 9/40
9
Narula et al (1998), described that the competitiveness of MNEs becoming increasingly mobile
and knowledge intensive and also explained that MNEs give more attention to the availability
and quality of created assets of alternative locations. He has also described that among
developing countries there are considerable differences between “catching up” countries of (e.g.,
NICs) and “falling behind”, (LDCs). Narula argued that economic structure’s importance plays
less important role in determining the FDI activities of industrialized countries than developing
ones, there seems to be no indication that they are becoming insignificant He also described that
inward investment directed towards the exploitation of natural assets and markets (in case of
developing countries). Nebende et al (2000), stated that the cost related factors are the dominant
determinants of FDI. In particular, the dominance of real wage rates and human capital suggest
that the “under priced” skilled (semiskilled) labor is the deriving force behind FDI. Nabende et
al their study investigated both the short-run and long-run locational determinants of FDI under
the broad categories of cost-related, investment environment improving and other
macroeconomic factors. The short-run dynamics indicated that European investment in the Thai
manufacturing sector has been more responsive to the macroeconomic factors. The long-run
dynamics on the other hand suggested that European investment has been more responsive to the
investment environment improving factors. Steven (1995) evaluates the relationship between
patterns of international technological specialization and the competition provided by FDI, he
suggests that TNCs have a relatively weak over all impact on patterns of technological
specialization with in and between the countries. Kwang and Singh, (1996) in their findings
indicated that a qualitative index of political risk has been a significant determinant of FDI flows
for countries that have attracted historically sizeable investment flows and for countries that have
not been very successful in attracting such investments, socio political instability, proxies by

8/7/2019 media_21789_en
http://slidepdf.com/reader/full/media21789en 10/40
10
negative impact on investment flows. Exports in general and manufacturing exports in particular
are a significant determinant for high investment recipients. Kathryn et al (1995), concluded that
there has been no statistically significant relationship between the level of the exchange rate and
foreign investment relative to domestic investment after controlling for relative corporate wealth
and the over all level of investment. Soboleva (1999), in her thesis by developing a dynamic
structural model of a firm’s location choice for its production affiliates analyzed the effect of
trade policy on FDI. She has considered both tariff and non-tariff barriers to exports and
explicitly model the link between investment decisions and trade policy. The results provide
evidence on micro level determinants of investment decisions
The literature is largely confined within the variety of factors which determining the attraction of
FDI to a host country. These factors are broadly the cost related factors, investment environment,
macro economic factors, political stability/risk factors, and development strategy factors etc of
the host country. Consequently, this study largely covered the period of liberalizing regime,
political stability factors, governments development strategy factors along with the external
shocks like nuclear tests, 11 September 2001 shock etc to determine which factors are crucial in
attracting the FDI in Pakistan. The study takes all major variables of cost, investment, macro
economics, risk/stability and development strategy factors in a dynamic process both in short run
and long run to determine its interrelationship and long run relationship together with variety of
policy variables at country level. Because the empirical literature used cross-country regressions
to search for the determinants of FDI is statistically fragile, see e.g Chakrabarti (2001).
8/7/2019 media_21789_en
http://slidepdf.com/reader/full/media21789en 11/40
11
III. METHODOLOGY
This study used the VAR (Vector Autoregressive Model) model. The VAR provides a simple
means of explaining or predicting the values of a set of variables. VAR is a straightforward,
powerful statistical technique, which can be applied to any set of historical data. VAR model
developed by Sims (1980, 1982, and 1986), Doan et al (1984) and Litterman (1984), used these
techniques. The VAR modeling avoids imposing potentially spurious restrictions on the model.
The VAR model does not require any explicit economic theory to estimate model. Moreover, it
allows one to capture empirical irregularities in the data and thereby provide insight into the
channels through which the different policy variables operate. Under the VAR model
methodologies, the relationship of the variables is determined with their optimal lag length
effects (the order of the lag length with back shift operator). The Causality is to be determined
based on one-way causality or either direction techniques suggested by Engle and Granger
(1987).
To employ the VAR in orthodox format, or in the form of VEC, this is Johansen (1995) VAR
incorporating (potential) error correction terms, consequent upon the potential co integration
vectors. These techniques are to be accompanied with the impulse response functions and the
variance decomposition functions. The standard procedure of using both of these techniques to
measure the change in one of the variable and keeping all other variables constant and finding
the covariance matrix of the reduce form (that is, estimated) residuals in order to orthogonal the
innovations. This technique has given us the forecasting capability of each of the variables
defining to the other variables. Surely, the dummy variables of structural periods like political
instability, nuclear tests (1998) and the economic liberalization period (1988), 11 September
8/7/2019 media_21789_en
http://slidepdf.com/reader/full/media21789en 12/40
12
2001 are used to testify the structural change and the significant effect of these periods on key
variables. The necessary model checking and identification procedure is applied for the
suitability of the model, optimal lag lengths based on criterion used by the FPE (Final Prediction
Error), AIC (Akakai’s information Criterion). Other necessary tests have been applied to check
the econometric assumptions related to residual terms. The unit roots and order of the integration
of the variables using Augmented Dickey Fuller (ADF) and Phillips-Person tests have been
applied. There are lots of issues discussed while applying the VAR technique. i) The variables,
which are exogenous, included as conditioning variables. ii) The order of the lag has been
determined on the bases of identification criterion. iii)The order of the integration of the
endogenous variables has been checked and then has been used. iv) If any co integration between
the endogenous variables has found in the system VECs has been used rather than straight
VARs. In addition, if not whether latter been used for levels or first differences of the variables
has been used. v) In any, VAR or VEC what type of error decompositions has been used in order
to identity the structural errors from the reduced form estimated errors. For policy analysis, a
model has been nested based on 2SLS/ 3SLS to capture the relationship between FDI and its
determinants. A system of equations based on the relationship has been adjusted with the
monetary policy variables, trade related policy and fiscal policy variables.
The Hypotheses
The hypotheses are built on the existing literature that proposes that the determinants of FDI
flows are positively influenced by four broad categories of factors namely; i) the cost related
factors, ii) the investment environment improving factors, iii) macro economic factors and iv) the
development strategy of the country and structural shocks of 1988, Nuclear tests 1999 and Sept.
11, 2001. Data and econometric methodology makes it practicable to test all the theorized

8/7/2019 media_21789_en
http://slidepdf.com/reader/full/media21789en 13/40
13
factors. Consequently, a model is designed to test collectively the significance of three of the
cost-related factors, i.e. wage rate, interest rate, and foreign exchange rates; investment
environment improving factors i.e. openness of the economy and liberalization; macro economic
factors i.e., output growth, market size, human capital, and the quality of infrastructure; political
factors combine cumulative risk indicator12 and development policy factor, i.e., export led
policy. Specifically the model is based on the above said hypotheses.
Estimation
We have employed the following estimation techniques. First, a structural model is based on a
three stage least square (3sls) employed to capture the short-run relationship between FDI and its
determinants. Second, a co-integration estimation technique is employed to analyze the long-run
dynamics.
The Structural Model
A system of equations based on the relationship expected direction of the relationship between
the dependent and independent variables setup (see Table No: 01, positive unless specified) are
developed. In this model, the variables on the cost factors/ supply side have been endogenized,
while the exogenous policy variables have been asserted under monetary policy, trade related
policy and fiscal government policy, development policy variable and along with combined
cumulative risk index of political policy variable for political stability.
12 Combined cumulative risk is the combination of political risk, financial risk and economic risk by (Erb- Harvey-Viskanta).

8/7/2019 media_21789_en
http://slidepdf.com/reader/full/media21789en 14/40
14
Table No: 01
Expected Direction of the Relationship between the Dependent and Independent variable
Explanatory Policy VariablesDependent
Variables
Endogenous
Monetary
Policy
Trade Related
Policy
Fiscal and Govt:
Policy
Development policy/
structural dummies
FDI Wage Rate (-)Openness,Output Growth,Human Capital
InterestRates (-)
LiberalizationForeignexchange rate (-)
Expenditure onInfrastructure
Exports,cumulative combined risk index (-)/ Dummies 1988,1999 (nuclear tests) and
sept11/2001OutputGrowth
FDI,Openness,Employment,CapitalFormation,Human Capital
Liberalization Expenditure onInfrastructure
Exports,cumulative combined risk index(-)/Dummies 1988, 1999(nuclear tests) andsept11/2001
Wage Rate Output Growth(-) ForeignExchange Rates(-)
Exports,Cumulative Combined Risk Index (-)/Dummies 1988,1999 (nuclear tests) andsept11/2001
Openness FDI,Output Growth
InterestRates (-)
Liberalisation,ForeignExchange Rates(+/-)
Exports,Cumulative Combined Risk Index (-)/Dummies 1988,1999 (nuclear tests) andsept11/2001
Employment FDI (+/-)Output Growth(+/-)Human Capital(+/-)
InterestRates (-)
ForeignExchange Rates(+/-)Inflation (-)
Expenditure onInfrastructure
Exports,Cumulative Combined Risk Index(-)/Dummies 1988, 1999(nuclear tests) andsept11/2001
CapitalFormation
FDI,Output Growth,Openness
InterestRates (-)
Liberalization,ForeignExchange Rates(+/-)
Expenditure onInfrastructure,Savings
Exports,Cumulative Combined Risk Index (-)/Dummies 1988,1999 (nuclear tests) and
sept11/2001HumanCapital
FDI,Output Growth,Employment
InterestRates (-)
GovernmentExpenditure onEducation,Savings
Exports,Cumulative Combined Risk Index (-)/Dummies 1988,1999 (nuclear tests) andsept11/2001

8/7/2019 media_21789_en
http://slidepdf.com/reader/full/media21789en 15/40
15
The specifications of the structural model of seven equations are self evident from the rows of
the table no: 01. The equations are taken in order. In the output growth equation, openness of
foreign trade and liberalization are expected to influence productivity and that kind of influence
is also embedded in FDI. Similarly, an increase in the employment, capital formation, human
capital, and infrastructure should promote productivity and hence output growth. As for the wage
rate equation, output growth might influence and increase in wage rate and this expectedly
negative relationship. An increase in wage rate and an increase in foreign exchange rate would
cause similar effect, while wage rate would be positively related. With regard to the openness
equation, FDI, output growth (economic development) and liberalization are concomitant with
an open foreign trade environment. However, an increase in foreign exchange rate would have
mixed effects depending on whether international trade is dominated by exports (positive) or
imports (negative). While an increase in interest rate would generate negative effects. Turning to
the employment equation, FDI, output growth and human capital are expected to have mixed
effects depending on whether they are promoting employment intensive production (positive) or
capital intensive production (negative). Similarly, an increase in wage rates may motivate more
people to seek employment. Like wise, an increase in the foreign exchange rates might negates
the exports of existing investors and hence employment, or may encourage new capital
investment and hence employment. Investment and inflation would generate negative effects
through respective impact on investor’s cost of capital and costs of production. Under the capital
formation equation, an increase/ improvement in FDI, output growth, openness, liberalization,
savings and infrastructure are expected to be concomitant with an increase in capital formation.
However, an increase in interest rates would deter it; while infrastructure and foreign exchange
rates would have mixed effects depending on whether the capital formation is being dominated

8/7/2019 media_21789_en
http://slidepdf.com/reader/full/media21789en 16/40
16
by the public (positive) or private (negative) sector, and on whether the capital is reinvested from
exports (negative) or comes in new investments (positive). Lastly, human capital should be
positively influenced by FDI, output growth and employment level particularly by making the
population more aware of the benefits of education, and through the process of learning by
doing. Similarly, government expenditure and savings should make it more likely for individuals
to invest in education. However, an increase in interest rates makes it more difficult to finance
education/ training. Further, an important issue in econometrics is the need to integrate short-run
dynamics with the long-run equilibrium. The co-integration technique has been applied.
Measurement and notation of variables, Data sources and limitations:
The measurements of variables and data sources13 are reported in Appendix (A). The following
notation has been adopted for ease of presenting the empirical results. Foreign Direct Investment
(FDI), Wage Rate (WRATE), Output Growth (OG), Openness (OPEN), Employment/labor force
(EMPL), Human Capital (H C), Capital Formation (CF), Liberalisation (LIB), Interest Rate (IR) ,
Infrastructure (INFRA), Savings (SAVINGS) , Inflation (INFRATE), Govt: Expenditure on
Education(GEE), Combined Cumulative Index(CCR), Exports (EXPORTS). Some of the
endogenous, exogenous, policy variables require some explanation. For example, secondary
school enrolment ratio is used as variable for a human capital of country, which is used by
Noorbakhsh et al (2001), Root and Ahmed (1979), Schneider and Frey (1985), Levine and
Renelt (1992) and other empirical literature such as Mankiw, Romer, and Weil (1992), used this
variable as an average in growth literature and Barro (1991) also used this variable as ‘at some
initial period’. Growth and size of the market is recognized as a major determinant of FDI,
13 Annual data series from 1971-2005 has been taken for the analysis.

8/7/2019 media_21789_en
http://slidepdf.com/reader/full/media21789en 17/40
17
(Root & Ahmed, 1979; Schneider & Frey, 1985; Torrisi, 1985; UNCTAD, 1998, 1999;
UNCTAD-DTCI, 1993; UNCTC, 1992). Rate of growth of GDP is used as a proxy for the
growth of market size in Pakistan which is used in many empirical studies, see Gastanaga,
Nugent, and Pashamova (1998), Knickerbocker (1973), Lim (1983), Root and Ahmed (1979),
Ryckeghem (1998), Singh and Jun (1995), and Torrisi (1985). Real wage is also used as a proxy
of a cost of labor, which is also recognized an important determinant in the studies Flamm
(1984), Lucas (1993), Schneider and Frey (1985), Wheeler and Mody (1992) , Shamsuddin
(1994) and Singh and Jun (1995), real wage variable is used by dividing nominal wage with
GDP deflator. The variable openness is measured by the ratio of total trade to GDP; which is
used in empirical studies, see Haufbauer, Lakdawalla, and Malani (1994), Ryckeghem (1998)
and UNCTAD (1999) .Liberalization is also recognized as an important variable (for example,
see Haque, Mathieson, & Sharma, 1997; Schadler, Carkovic, Bennett, & Kahn, 1993). The
dummy variable with 0 representating the pre-liberalization period 1971-87 and 1 representing
the period 1988-2005 as post liberalization. Infrastructure is also concern for foreign investors
(UNCTAD, 1998), some survey studies confirm that this is one of the main factors that influence
foreign investment location decisions (see, for example, Area Development, 1998; Business
International Corporation, 1970), level of government expenditure on economic services (which
by definition includes, transport and communication, electricity gas and water, industry and
agriculture)/GDP*100 used as a variable for infrastructure.(government expenditure on
education was also included in this ratio). The economic literature suggests that, in addition to
the variables. Risk could be an important deterrent to investment, both domestic and foreign.
Fear of political instability, risk of policy reversal and fear of government action could make
investment excessively risky (Collier & Pattillo, 2000). Certain political and economic
8/7/2019 media_21789_en
http://slidepdf.com/reader/full/media21789en 18/40
18
characteristics of host countries could be among these factors (see the surveys by Przewoski &
Limongi, 1993; Sirowy & Inkeles, 1990) and other studies (Lansbury et al., 1996; Levis, 1979;
Singh & Jun, 1995; UNCTAD, 1998; Wheeler & Mody, 1992, Brunetti, Kisunko, & Weder,
1997b; Edwards, 1991; UNCTC, 1992). Combined cumulative risk factors of social, economic,
financial and political index are used for the purpose. In addition to this annual average inflation
rate is also used as a proxy for economic stability factor. We tested the CCR index as a
determinant of FDI. Besides this, using dummy variable also tests impact of structural shocks of
nuclear tests and September 11 events. Some fiscal monetary, trade and development policy
instruments like interest rate, exchange rate, inflation, savings, expenditure on infrastructure and
education is also used to determine the significance of these variables.
IV. Empirical results: Short-run Dynamics
We have tested unit roots for each converted variable and the order of integration of the variables
using the Augmented Dickey Fuller (ADF) and Philips-Perron (PP) tests have been applied to
find out trend and order of integration. To handle the simultaneity 3SLS has been applied. A
3SLS has the advantage of not only being asymptotically maximum likelihood and of giving
more efficient parameter estimates, but also performing the regressions simultaneously on all the
equations in the model (Table No: 02) rather than one to one at a time. This estimation technique
has been therefore adopted in this analysis. Since the data is of annual nature we have found a
few significant lag relationships among the set of variables. However, we have omitted to
include the lag periods in 3sls estimation, but we have tried the lag variables in the VAR, VEC
and Granger causality models. A system of the best-fit variables is then estimated using the 3SLS
technique. Due to the limitation of the degree of freedom, only those regressions with significant
co-efficient were retained, and the system re-estimated. For detail see the model at table no: (02).

8/7/2019 media_21789_en
http://slidepdf.com/reader/full/media21789en 19/40
19
TABLE No: 02 EQUATIONS
FDI = OG OPEN IR EXPORTS CCR WRATEWRATE= EMPL IR INFRATEOG = OPEN HC WRATE IROPEN = OG HC IR INFRATE INFRAEMPL = WRATE FDI IRCF = OG FDI IR INFRATE LIBHC = FDI INFRATE
Consequent upon the experimentation, this linear structural form of the system emerged.
Αt=βο+β1Αt+β2Αt−1+β3Βt+ β4Βt−1+∈t (1)
Where A = [FDI, WRATE, OG, OPEN, EMPL, CF]
B = [LIB, IR, INF, EINFRA, EXRATE, HC, GEE, SAVINGS, EXPORTS, CCR]
∈ is 7 by I vector of disturbances.
The Results:
Before commencing the empirical results’ discussion, it is appropriate to first point out the
meaning of the direction of the relationships. To begin with, since the variables are measured as
log, a unit change in the policy variable causes a rate of change or acceleration (deceleration) on
the endogenous variable. As for FDI, which is measured by log (Foreign Direct Investment
rupees in millions), a unit change in the policy variable imparts a change in acceleration
(deceleration) on it. The results of FDI are present in table no: (03).
8/7/2019 media_21789_en
http://slidepdf.com/reader/full/media21789en 20/40
20
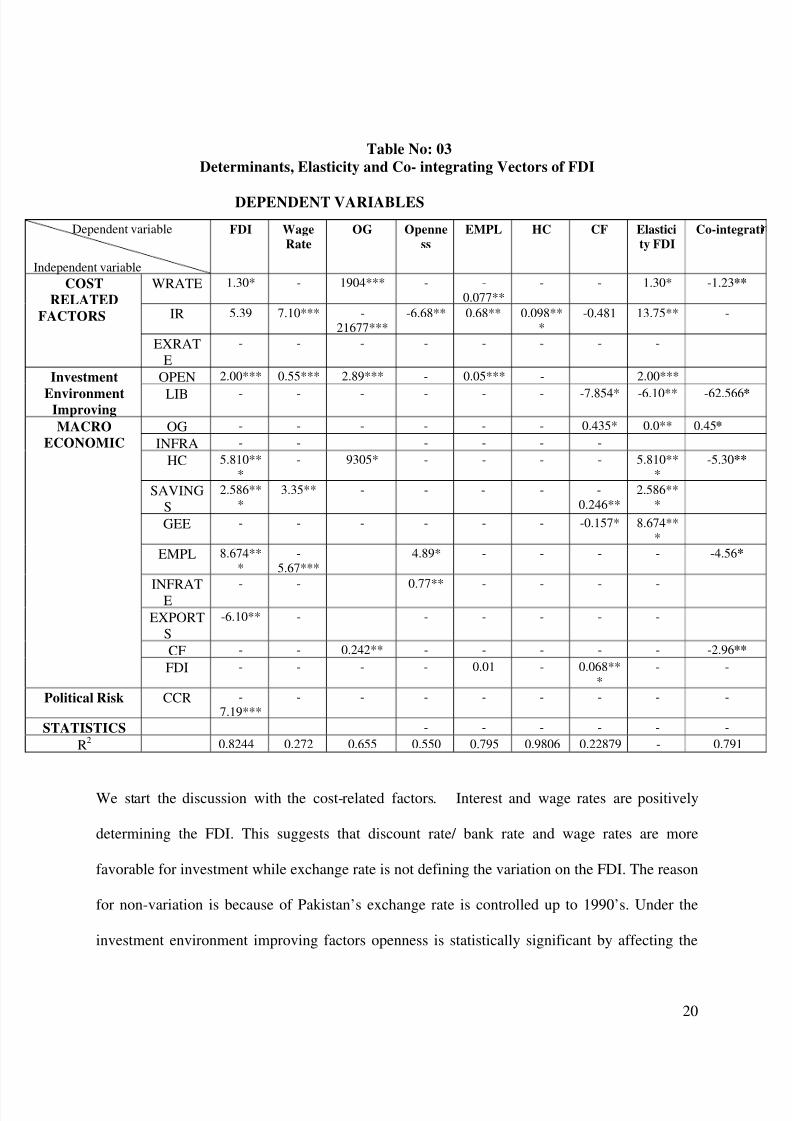
Table No: 03
Determinants, Elasticity and Co- integrating Vectors of FDI
DEPENDENT VARIABLES
We start the discussion with the cost-related factors. Interest and wage rates are positively
determining the FDI. This suggests that discount rate/ bank rate and wage rates are more
favorable for investment while exchange rate is not defining the variation on the FDI. The reason
for non-variation is because of Pakistan’s exchange rate is controlled up to 1990’s. Under the
investment environment improving factors openness is statistically significant by affecting the
Dependent variable
Independent variable
FDI Wage
Rate
OG Openne
ss
EMPL HC CF Elastici
ty FDI
Co-integrati
WRATE 1.30* - 1904*** - -0.077**
- - 1.30* -1.23**
IR 5.39 7.10*** -21677***
-6.68** 0.68** 0.098***
-0.481 13.75** -
COST
RELATED
FACTORS
EXRATE
- - - - - - - -
OPEN 2.00*** 0.55*** 2.89*** - 0.05*** - 2.00***Investment
EnvironmentImproving
LIB - - - - - - -7.854* -6.10** -62.566*
OG - - - - - - 0.435* 0.0** 0.45*
INFRA - - - - - -
HC 5.810***
- 9305* - - - - 5.810***
-5.30**
SAVINGS
2.586***
3.35** - - - - -0.246**
2.586***
GEE - - - - - - -0.157* 8.674***
EMPL 8.674***
-5.67***
4.89* - - - - -4.56*
INFRATE - - 0.77** - - - -
EXPORTS
-6.10** - - - - - -
CF - - 0.242** - - - - - -2.96**
MACRO
ECONOMIC
FDI - - - - 0.01 - 0.068***
- -
Political Risk CCR -7.19***
- - - - - - - -
STATISTICS - - - - - -
R2 0.8244 0.272 0.655 0.550 0.795 0.9806 0.22879 - 0.791

8/7/2019 media_21789_en
http://slidepdf.com/reader/full/media21789en 21/40
21
FDI, suggesting that more open the economy stimulates further investment in the short-run.
Turning to the macro economic factors human capital, savings, employment and exports are
stimulating the FDI in short-run. The response mostly is significant. The combined cumulative
risk (CCR) variable is highly significant variable showing the variation to FDI that sum of the
cumulative; financial, economic, social and political factors indexed is highly significant and
negatively affecting the FDI. This shows the robustness as human capital availability is another
major variable and is statistically significant to define FDI. In summary, besides cost related
factors the macro economic variables are tempting for FDI and output growth and investment.
While discussing the other equations table; the wage rate is determined by labor force, interest
rate, openness and savings. The variation explained by labor force is straightforward and
statistically significant with right sign. While the interest rate and openness is explained the
7.10% and 0.55% of variation at 1 percent level of significant. Since, the interest rate is
explaining the 7% variation to FDI and savings is also explaining the variation on wage rate. The
output growth is explained by openness, human capital, wage rate and interest rate, which is
straightforward relationship among the variables. The openness equation is explained by
inflation rate and employment. Most of the above variables are statistically significant. The
employment equation is explained by wage rate negatively and statistically significant at 5%.
Where as, the interest rate and openness are statistically significant and defining the employment
at 5% and 1% respectively. The capital formation is explained by output growth, FDI and
educational expenditure. The rest of the equations results are presented in table no (03).
Elasticity of FDI
The measurement of elasticity is based on the statistical significant co-efficient variables, which
gives us a good quantitative picture of the degree of response to the tested hypotheses. These

8/7/2019 media_21789_en
http://slidepdf.com/reader/full/media21789en 22/40
22
results are reported in table no: (03). Pakistan’s FDI is more elastic to the availability of
employment followed by negative sign of combined cumulative risk, (-7.19) which is high
elastic and showing the degree of elasticity among the cost related factors interest rate followed
by wage rate which show highly significant variation. However, the savings, openness and
output growth are showing the elasticities within the variation of two percent. Elasticity for
employment is a unit change in employment will accelerate the FDI at 8.67%. The FDI is most
responsive to labor force/ employment, political index variable followed by investment, savings,
human capital, output growth and wage rate. However, a unit increase in openness accelerates
the FDI by two units. In general it appears that the short-run degree of response is combined
CCR index and macro economic factors and followed by cost-related factors. Since, we have
found no structural dummy of nuclear tests, September 11, 2001 is statistically significant so we
have dropped the dummies from the rest of the analysis.
VAR, VEC and Co-integration
It is not realistic of course, to envisage FDI as responding to a set of exogenous variables, given
those in the country of origin, and to ignore the feed back effect between those variables and
FDI, and further more the interdependencies between the factors themselves. To do so is to
ignore the possible spillover effects of FDI, where potential existence is such a strong motivator
for the country attempts to attracts FDI, equation (02).
FDI= [[WRATE,IR,EXRATE],[OPEN, LIB],[GDP,OG,HC], [EXPORTS, CCR]] (02)
Above, the expectations must be that if macro economic factors are strong pull factors for FDI,
then these factors, such as national output or its growth rate, human capital, employment and
savings will in turn be influenced by FDI. The literature on FDI has obviously considered the

8/7/2019 media_21789_en
http://slidepdf.com/reader/full/media21789en 23/40
23
links between it and macro economic performance of country, but it has tended, indeed, to do so,
on the basis of one-way causality, in either direction. The exploration of two-way causation is
only just beginning. In various studies and papers, on single country studies the authors
employed a ‘model’ framework. Hence, because of the possible limitations of such a framework,
certainly in the context of panel data studies, we have relied upon the much-favored VAR and
VEC methodologies.
Empirical Results:
VAR model has been applied to all the endogenous variables and policy variables at different
orders. However, we have also tried different orders of VAR model, at needed selection criterion
of AIC and SBC. The results are reported in table No. 04. Since, our focus is to analyze the
effect of different policy variables at impulse and variance decomposition levels. We have
worked on limited number of thirty observations; we have tried all different variables while
eliminating/dropped insignificant variables at later stage. For simplicity we have only reported
two lag period’s results of (1) and (2) ordering in table no.04, but we have also tried different
ordering to capture best impulse response and variance decomposition results.
TABLE No: 04
Model selection criterions
Order SC AIC criterion
1 9.51 8.86
2 9.15 6.63
VAR ordering:
[WRATE, OG, OPEN, EMPL, CF, HC, FDI, CCR, LIB, IR, INFRATE, SAVINGS, AND EXPORTS]
[FDI, WRATE, OG, OPEN, EMPL, CF, HC, LIB, IR, SAVINGS, EXPORT]
[WRATE, OG, CF, HC, FDI, EMPL, OPEN, EXPORTS, SAVINGS, INFRATE, AND EINF]

8/7/2019 media_21789_en
http://slidepdf.com/reader/full/media21789en 24/40
24
Impulse response function and variance decompositions:
Because of limited space we are confined to discuss only limited impulse response function
results to FDI, Output Growth, Wage rate, Openness, Labor/Employment, Capital Formation,
and Human Capital. The result in table no.05 shows the impulse response of other variables to
FDI. Theoretically, impulse response function is one standard deviation shock to policy variables
taking other variables constant. While looking at the results disregarding the impact of FDI itself,
the most important sources of impulse are output growth, wage rate, employment, openness,
human capital and capital formation. For simplicity, we have only reported the results of one
ordering as the order does matter in the VAR ordering process. The impulse response function in
combined graphs and are standard shocks are reported in figure 01.
Figure No: 01 Combined impulse response function graphs.
-1 0
-5
0
5
10
15
1 2 3 4 5 6 7 8 9 10
W R A T E OG OPEN
EMPL C F H C
FD I
Res ponse o f WR AT E to One S .D. I nnov at ions
-2
0
2
4
6
8
1 2 3 4 5 6 7 8 9 10
W R A T EOGOPEN
E M P LC FH C
FD I
Res ponse o f OG to O ne S .D . I nnov at i ons
-4
-2
0
2
4
6
8
10
1 2 3 4 5 6 7 8 9 10
W R A T E OG OPEN
E M P L C F H C
FD I
Res ponse o f OPEN to One S .D . I nnov at i ons
-1
0
1
2
3
1 2 3 4 5 6 7 8 9 10
W R A T E O
G OPEN
EMPL CF HC
FD I
Res ponse o f EMPL t o One S .D . Innovat i ons
-4
-2
0
2
4
6
1 2 3 4 5 6 7 8 9 10
W R A T EOGOPEN
E M P LC FH C
FD I
Res ponse o f CF t o One S .D . I nnov at i ons
-2
-1
0
1
2
3
4
1 2 3 4 5 6 7 8 9 10
W R A T E OG OPEN
E M P L C F H C
FD I
Res ponse o f HC to One S .D . I nnov at i ons
-2 0
0
20
40
60
1 2 3 4 5 6 7 8 9 10
W R A T E OG OPEN
EMPL CF HC
FD I
Res ponse o f F D I t o One S .D . I nnov at i ons

8/7/2019 media_21789_en
http://slidepdf.com/reader/full/media21789en 25/40
25
Table No: 05 Average Impulse Response Functions FDI OG WRATE OPEN EMPL CF HC
FDI 2.469 -1.795 0.150 -1.279 -1.67 1.605 3.95
OG -0.039 0.879 0.22 -0.294 0.43 -0.21 -0.077
WRATE 0.507 -0.194 .885 -0.299 0.285 -0.140 0.62
OPEN -0.203 -4.275 0.418 5.096 -3.430 1.60 0.709
EMPL 0.021 0.074 -0.056 0.051 0.144 -0.043 -0.019
CF -0.072 0.408 0.176 -0.185 -0.231 0.704 0.424
HC -0.021 -0.230 -0.137 -0.196 -0.024 0.245 0.360
EXPORTS 0.114 -0.16 0.086 -0.36 0.481 -0.344 -0.426
LIB -0.017 -0.070 0.004 0.027 -0.0493 0.030 0.025
INTRATE -0.056 -0.344 0.125 -0.31 0.289 -0.222 0.312
SAVINGS -0.039 0.363 0.286 -0.265 0.141 0.081 0.079
Variance Decomposition
The variance decomposition is showing the variation explained by the other variables to the
policy variables. In our results FDI is being shown how the other variables are showing variance
to FDI, nearly all the variables are showing the variation to FDI largely by the labour force,
capital formation followed by openness, wage rate and output growth. The results are reported in
table No.06. The variation is clearly being shown at combined and multiple graphs in figure
no.2:
Table No 06 Average Variance Decomposition
FDI WRATE OG OPEN EMPL CF HC IRFDI 71.79 1.776 2.169 4.843 4.078 1.668 7.65 2.312WRATE 26.23 52.51 1.473 4.509 2.47 1.31 5.22 2.47OG 3.155 5.029 59.83 7.083 6.098 1.856 4.109 7.622OPEN 6.441 0.717 3.819 78.245 5.522 0.072 0.283 2.72
EMPL 18.19 6.322 2.558 3.035 63.895 1.357 0.167 0.533CF 3.093 6.222 10.451 19.1993 9.722 39.767 2.928 2.84HC 2.789 5.39 7.017 6.22 2.123 5.564 58.55 0.286INTRATE 4.13 4.039 5.474 18.819 4.25 26.562 4.18 26.04INFRATE 1.03 2.11 7.946 7.843 3.37 4.761 2.56 11.70SAVINGS 3.965 12.035 5.882 2.682 8.071 6.216 5.879 7.027EXPORTS 3.645 5.234 9.728 22.828 4.886 5.504 1.743 17.29

8/7/2019 media_21789_en
http://slidepdf.com/reader/full/media21789en 26/40
26
FIGURE No: 02 COMBINED VARIANCE DECOMPOSITION GRAPHS
Long-run dynamics & co-integration
Since the theoretical model suggests a long-run relationship between the variables in equation 1
and 2 which are al1 non- stationary, we seek to test whether the relation is co- integrated using
recent developments in the econometric analysis of non-stationary variables as applied to
historical/time series data. The basic idea of co-integration is that if there is a long-run
relationship between two or more non-stationary variables, a regression containing all these
relevant variables--the co-integrating equation-will have a stationary error term, even if none of
the variables taken alone is stationary. In other words, in order for the variables to be related in
the long run, they must be co-integrated. Thus the test for co-integration of variables in the
relation is also a test for the presence of any long-run equilibrium relationship among these
2
4
6
8
10
1WRATOOPE
EMPLCH
FD
Variance Decomposition of
2
4
6
8
10
1WRATOOPE
EMPCH
FD
Variance Decomposition of
2
4
6
8
10
1WRATOOPE
EMPCH
FD
Variance Decomposition of
2
4
6
8
1WRATOOPE
EMPCH
FD
Variance Decomposition of
2
4
6
8
1WRATOOPE
EMPCH
FD
Variance Decomposition of
2
4
6
8
10
1WRATOOPE
EMPCH
FD
Variance Decomposition of
1
2
3
4
5
1
WRATOOPE EMPCH FD
Variance Decomposition of

8/7/2019 media_21789_en
http://slidepdf.com/reader/full/media21789en 27/40
27
variables. The trace static reported in Johensen co-integration test illustrate co-integration r=3.
We have estimated the VEC model by putting the two co-integration equations into the system.
Results of Dynamics Vector Error Correction model
From cost related factors, only the wage rate is showing the long run relationship with FDI. See
Table No: (03 last column). The macro economic factors; output growth, employment, capital
formation, and human capital exhibit long-run relationship with FDI. The results illustrate the
long-run dynamics between FDI, openness and macro economic factors consistently.
Compare Diagnostics:
It is evident that macro economic factors followed by cost-related factors emerge as the
dominant factors both in short-run dynamic relationship between FDI and its determinants.
Openness emerges as dominant factor in long-run dynamics also. There is also strong evidence
to suggest that determinant variables that exhibit short-run dynamics may also exhibit long-run
dynamics and vice versa. In general, however, the macro economic factors seem to be playing a
comparatively significant role in determining FDI then cost-related factors both in short-run and
long run dynamics.
Impulse Response Function
Impulse response function some times also called innovation accounting. The ordering of the
variables in VAR (VEC) (particularly the direction of response) also influences the results.
Therefore, FDI indicates substantial variation by the different variables. FDI is most sensitive to
Openness, Employment, Wage rate, Output Growth and other macro economic variables. The
time path of showing the 10 period effect of FDI and other variables (for space limit we are
reporting only FDI results- Table No.07) and combined graphs of all shocks in table no.8
8/7/2019 media_21789_en
http://slidepdf.com/reader/full/media21789en 28/40
28
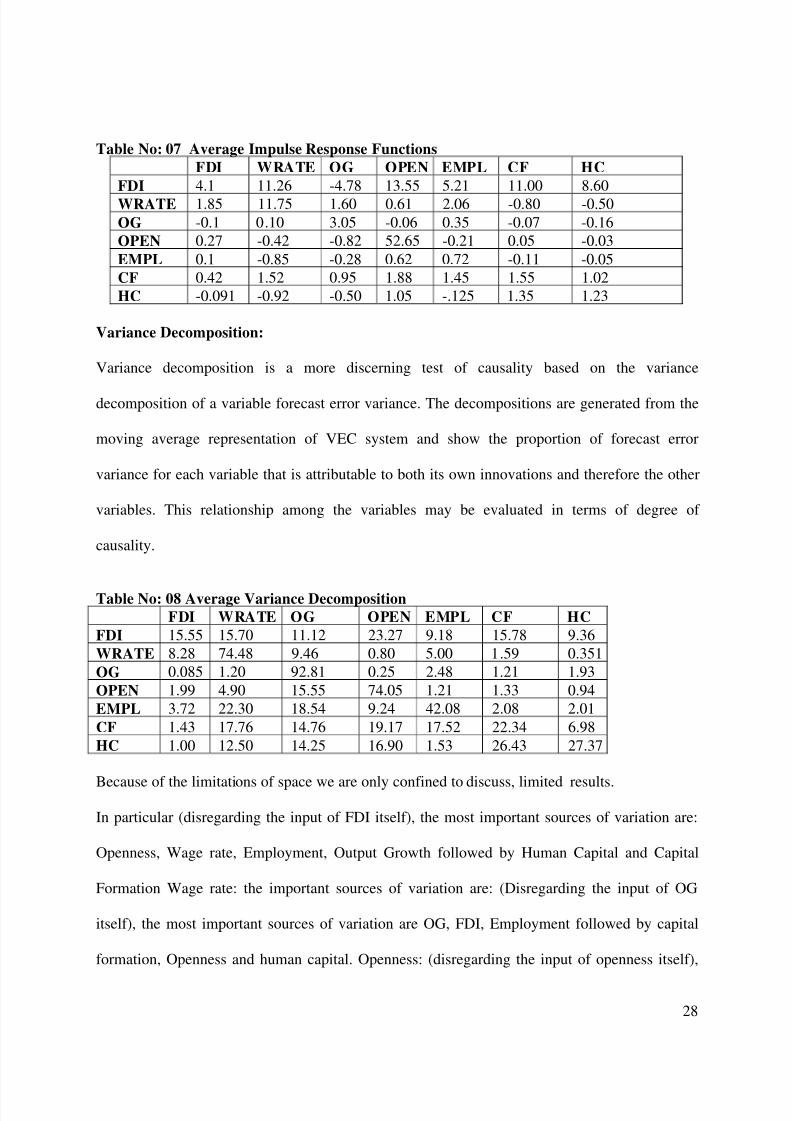
Table No: 07 Average Impulse Response Functions
FDI WRATE OG OPEN EMPL CF HC
FDI 4.1 11.26 -4.78 13.55 5.21 11.00 8.60
WRATE 1.85 11.75 1.60 0.61 2.06 -0.80 -0.50
OG -0.1 0.10 3.05 -0.06 0.35 -0.07 -0.16
OPEN 0.27 -0.42 -0.82 52.65 -0.21 0.05 -0.03
EMPL 0.1 -0.85 -0.28 0.62 0.72 -0.11 -0.05
CF 0.42 1.52 0.95 1.88 1.45 1.55 1.02
HC -0.091 -0.92 -0.50 1.05 -.125 1.35 1.23
Variance Decomposition:
Variance decomposition is a more discerning test of causality based on the variance
decomposition of a variable forecast error variance. The decompositions are generated from the
moving average representation of VEC system and show the proportion of forecast error
variance for each variable that is attributable to both its own innovations and therefore the other
variables. This relationship among the variables may be evaluated in terms of degree of
causality.
Table No: 08 Average Variance Decomposition
FDI WRATE OG OPEN EMPL CF HC
FDI 15.55 15.70 11.12 23.27 9.18 15.78 9.36
WRATE 8.28 74.48 9.46 0.80 5.00 1.59 0.351
OG 0.085 1.20 92.81 0.25 2.48 1.21 1.93
OPEN 1.99 4.90 15.55 74.05 1.21 1.33 0.94
EMPL 3.72 22.30 18.54 9.24 42.08 2.08 2.01
CF 1.43 17.76 14.76 19.17 17.52 22.34 6.98
HC 1.00 12.50 14.25 16.90 1.53 26.43 27.37
Because of the limitations of space we are only confined to discuss, limited results.
In particular (disregarding the input of FDI itself), the most important sources of variation are:
Openness, Wage rate, Employment, Output Growth followed by Human Capital and Capital
Formation Wage rate: the important sources of variation are: (Disregarding the input of OG
itself), the most important sources of variation are OG, FDI, Employment followed by capital
formation, Openness and human capital. Openness: (disregarding the input of openness itself),

8/7/2019 media_21789_en
http://slidepdf.com/reader/full/media21789en 29/40
29
the most important sources of variation are, OG, Wage rate followed by FDI, capital formation,
employment and human capital. Employment: (disregarding the input of employment itself), the
most important sources of variation are, wage rate, output growth, followed by openness, FDI,
capital formation and, human. Output Growth: (disregarding the input of wage rate itself), the
most important sources of variation are, employment followed by Human Capital, Wage rate,
capital formation, openness and, FDI human capital.
Human capital: (disregarding the input of human capital itself), the most important sources of
variation are capital formation followed by, openness, output growth, wage rate, employment
and FDI. Capital formation: (disregarding the input of capital formation itself), the most
important sources of variation are, openness followed by wage rate, employment, human capital
and FDI.
Point and Interval Forecast:
The VEC model has been solved for forecasting while keeping in view getting point and interval
forecast by minimizing forecasting mean squared error. The point and interval forecast are
reported table no.09. The forecast of dynamic solutions is also showing the consistency between
the actual and forecasted series.
Table No: 09. Point and Interval Forecast results
Forecasting Period Point
Forecast
Interval Forecast
FDI (1) ± 1.96 s.e (12.33)FDI (2) ± 1.96 (17.73)FDI (3) ± 1.96 (8.43)FDI (4) ± 1.96 (25.0)FDI (5) ± 1.96 (4.19)
-40.99-27.14-52.14-46.10-40.55
± 24.17
± 34.76
± 8.43
± 49.07
± 8.22
CF (1) ± 1.96 (2.19)CF (2) ± 1.96 (2.36)
6.72.04
±4.30
±4.62

8/7/2019 media_21789_en
http://slidepdf.com/reader/full/media21789en 30/40
30
CF (3) ± 1.96 (6.33)CF (4) ± 1.96 (4.42)CF (5) ± 1.96 (4.92)
6.451.96-4.68
± 12.41
± 8.67
±
9.65
WRATE (1) ± 1.96 (3.85)WRATE (2) ± 1.96 (4.32)WRATE (3) ± 1.96 (8.72)WRATE (4) ± 1.96 (3.30)WRATE (5) ± 1.96 (5.32)
19.6-8.9921.905.3712.29
± 7.56
± 8.47
± 17.00
± 6.47
± 10.43
EMPL (1) ± 1.96 (4)EMPL (2) ± 1.96 (3.20)
EMPL (3) ± 1.96 (1.97)EMPL (4) ± 1.96 (2.28)EMPL (5) ± 1.96 (0.44)
3.233.50
-1.491.38-1.76
± 7.84
± 6.27
± 3.85± 4.47
± 0.87
HC (1) ± 1.96 (0.42)HC (2) ± 1.96 (0.56)HC (3) ± 1.96 (2.28)HC (4) ± 1.96 (1.33)HC (5) ± 1.96 (0.96)
-2.86-0.96-3.45-3.48-1.23
± 0.83
± 1.11
± 4.45
± 2.62
± 1.89
OG (1) ± 1.96 (2.79)OG (2) ± 1.96 (5.17)OG (3) ± 1.96 (3.22)OG (4) ± 1.96 (4.80)OG (5) ± 1.96 (4.05)
1.487.672.418.293.04
± 5.48
± 10.14
± 6.31
± 9.54
± 7.94
OPEN (1) ± 1.96 (42.18)OPEN (2) ± 1.96 (42.69)OPEN (3) ± 1.96 (44.84)OPEN (4) ± 1.96 (49.14)OPEN (5) ± 1.96 (44.79)
138.53141.11147.98167.34153.10
± 82.68
± 83.68
± 87.89
± 96.32
± 87.79
Granger -causality
FDI has been the major concern to economists and politicians because of its potential effects on
the macro- economic factors of the country. Among the location factors investigated in the
foregoing section, there is a possibility of causation between FDI and some of the macro
economic variables. FDI might impact on for instance output growth (GDP), human capital and

8/7/2019 media_21789_en
http://slidepdf.com/reader/full/media21789en 31/40
31
international trade; investigated above under different contexts. We are therefore in a position to
investigate this as well as by normalizing each of these variables as 1 in the respective co-
integrating relationship. However, since some of the variables are eliminated during the co-
integration analysis, we do not have results for the above variables. We therefore employ
Granger causality methodology to complement the results.
Results
Granger-causality between FDI and other determinants are reported in table no.10.
Table No: 10. Granger-causality Equation
I. FDI = IR3 + INFRA3
II. OG = OPEN + IR2 + SAVINGS3 + LIBIII. OPEN = EMPLIV. WRATE = FDI3 + HC2
V. CF = OG3 + OPEN3 + IR3 + INFRATE3 + EMPL3 + GEE3 VI. HC = OPEN3 + CF3 + INFRA2
VII. EMPL = OG3 + FDI2 + LIB3 Note: 3 show the causation on three lag, 2 shows the causation on 2 lag and others on one lag.
While discussing the Granger-causality results, the results exhibit the consistency with the earlier
results, showing the lag relationship among the set of variables. Each variable’s lag period
inclusion is showing the significance of dependent variables prediction power. While looking at
the first equation FDI is being caused by interest rate and infrastructure by three lag periods.
While out put growth is being caused by openness, interest rate on two lag savings two lag and
liberalization one lag period. While capital formation is being caused by output growth,
openness, interest rate, inflation rate, employment and education expenditure all by three lag
periods. While wage rate is being caused by FDI by three lag periods and human capital by two
lag periods. While openness is being caused by, Employment/Labor by one lag period. While
human capital is being caused by openness and capital formation by three lag periods and

8/7/2019 media_21789_en
http://slidepdf.com/reader/full/media21789en 32/40
32
infrastructure investment by two lag periods. While employment is being caused by out put
growth by three lag periods, FDI by two lag periods and liberalization by one lag period.
Conclusion and Policy recommendations
It has been found that cost related factors, macro economic factors and country’s profile of
political risk index are the major determinants emerge in short-run analysis. It has been found
that macro economic factors followed by cost related factors emerges as the dominant factors
both in short run dynamic relationship between FDI and its determinants. Among the cost-related
factors only wage rate is showing the long run relationship with FDI. Among the macro
economic factors, the output growth, employment, capital formation, and human capital exhibit
long run relationship with FDI. The results showing/ illustrates the long run dynamics between
FDI, openness and macro economic factors consistently. Openness emerges as dominant factor
in long run dynamics also. There is also strong evidence to suggest that determinant variables
that exhibit short run dynamics may also exhibit long run dynamics and vice versa. In general,
however, the macro economic factors seems to be playing a comparatively significant role in
determining FDI then cost related functions both in short run and long run dynamics. The
relationship among the variables has been evaluated in terms of degree of causality. The results
exhibit the consistency with the earlier results, showing the lag relationship among the set of
variables. On the policy front, it becomes apparent that FDI is the important source to induce
economic activity and hence growth. If a country has to feel FDI’s spillover effects and
economic growth, the country needs to attract FDI formulating a bundle of policies (such as
those that are included in the model that caters for the interests of all the potential investors from
different countries). This means that country needs stable macro economic indicators
improvement, country’s risk profile followed by cost related and investment environment

8/7/2019 media_21789_en
http://slidepdf.com/reader/full/media21789en 33/40
33
improving factors. Further, the country can indeed realize benefits from present attributes to have
to keep of FDI friendly atmosphere by improving the country’s macro economic, socio-political
and financial profile.
References
Area Development, 1998Area Development (1998). Annual corporate survey. Westbury, NY: Halcyon BusinessPublications.
Agosin, M. R.; Mayer, R. B (2000), ‘Foreign Investment in Developing Countries: Does it Crowd in DomesticInvestment?’’ Discussion Paper no. 146, United Nations Conference on Trade and Development(UNCTAD), Palais des Nations, Geneva, Switzerland, 2000.
Andrea Marino (2000), ‘ The Impact Of Fdi On Developing Countries Growth : Trade Policy Matters’ ISTAT
(National Institute of Statistics), Italy. CEMAFI , Université de Nice-Sophia Antipolis, France.Apergis Nicholas, Costantinos P. Katrakilidis,And Nikolaos M. Tabakis,(2006) ‘Dynamic Linkages Between FDI
Inflows and Domestic Investment: A Panel Cointegration Approach’Atlantic Economic Journal(2006)34:385-394
Agarwal, J. P. 1997. Effect of foreign direct investment on Employment in home countries?, Transnational
Corporation, vol. 6, no. 2Agarwal, Jamuna P. (1980). " Determinants of Foreign Direct Investment: A Survey, "Weltwirtschaftliches Archiv,
Vol. 116, Heft 4.Aitken, B., and A. Harrison (1991). "Are there spillovers from Foreign Direct Investment? Evidence from Panel
Data for Venezuela”, Mimeo, MIT and the World Bank. Akaike, H. (1969), “Fitting Autoregressive Models for Prediction”, Annals of the Institute of Statistical
Mathematics, 21, 243-247.______ (1971), “Autoregressive Model Fitting for Control”, Annals of the Institute of Statistical Mathematics, 23,
163-180.Akhtar MH H Radice (2001) ‘Foreign Direct Investment In Pakistan: Trends And Policy Issues‘- Journal Of AsianBusiness, 2001 - The Association For Asian Studies, Inc.
Andrea Marino (august 2000), ‘The impact of FDI on developing countries growth: Trade policy matters’. ISTAT
(National Institute of Statistics), Italy. CEMAFI, Université de Nice-Sophia Antipolis, France. Aggarwal (1997). “ Liberalization, internationalisation advantages and FDI: the Indian experience”.
Transnational Corporations, vol: 6, no: 3, December 1997, pp. 55.Ashfaque H. Khan (1997). “FDI in Pakistan: policies and trends”, The Pakistan Development Review (winter
1997), pp. 959- 985.Ashfaque H. Khan and Yun-Hwan Kim, (1990) ‘ Foreign direct Investment in Pakistan: Policy Issues and
Operational Implications’ EDRC report Series No.66.Arguelles, 1986Arguelles, S. (1986). Foreign direct investment and indebted developing countries. Research Paper
No. 8609, Federal Reserve Bank of New York, New York.Aynal Hasan and Mohammad Nishat (1989). “ Determinants of multinational investment in Pakistan”, Pakistan
Economic and Social Review, vol: xxvii, no: 1(summer-1989), pp-49-60.Azmat Ghani (June, 1999), ‘Foreign Direct Investment in Fiji’. Pacific economic bulletin, volume 14, number 1,
June 1999 Asia Pacific Press.Barro, 1991 R.J. Barro , Economic growth in a cross section of countries. Quarterly Journal of Economics 106
(1991), pp. 407–444Blonigen, Bruce; Wang, Miao.(2005) “Inappropriate Pooling of Wealthy and Poor Countries in Empirical FDI
Studies,” in Does Foreign Direct Investment Promote Development? Theodore Moran, Edward Graham,Magnus Blomstrom, (eds.), Washington, DC: Institute for International Economics, 2005, pp. 221–44.
Blonigen, Bruce A, (2005), ‘A review of the empirical literature on FDI determinants’ Atlantic Economic Journal ,Vol 33, page 383-403.
Borenszstein, E., De Gregorio, J. & Lee, J.-W. (1998) How does foreign direct investment affecteconomic growth?, Journal of International Economics, 45, pp. 115± 135.

8/7/2019 media_21789_en
http://slidepdf.com/reader/full/media21789en 34/40
34
Bosworth, B. P.; Collins, S. M. BCapital Flows to Developing Economies: Implications for Savingand Investment,’’ Brookings Papers on Economic Activity, 1, 1999, pp. 143Y69.
Brunetti et al., 1997bBrunetti, A., Kisunko, G., & Weder, B. (1997b). How businesses see government: Responses
from private sector surveys in 69 countries. IFC Discussion Paper No. 33, World Bank, Washington, DC.Business International Corporation, 1970Business International Corporation (1970). Decision making in
international operations, 100 checklists. Mimeograph No. 7, Business International Corporation, NewYork.
Balasundram Maniam, (2000), ‘U.S. FDI in Latin America: A new perspective’. Sam Houston State UniversityProceedings of the Academy for Economics and Economic Education, 3(2) Maui, Hawaii, 2000. AlliedAcademies International Conference page 24
Blomström, M. and M. Zejan (1991). "Why do Multinational Firms Seek Out Joint Ventures?" Journal of International Development, Vol. 3, pp. 53-63.
_______ (1989). “Foreign Investment and Spillovers: A Study of Technology Transfers to Mexico”, (London:Routledge).
_______And H. Persson (1983). "Foreign Investment and Spillover Efficiency in an Underdeveloped Economy:
Evidence from the Mexican Manufacturing Industry", World Development, Vol.11, pp. 493 -501.Bowditch, Elizabeth Cluverius (1998). “Opening to the Outside World: The Political Economy of Trade and
Foreign Investment in the People's Republic of China”, University of California, Los Angeles, 1998.Advisor Ronald Rogowski.
Buckley, P.J. and M.C. Casson, (1985). “The economic theory of the multinational enterprise”. St. Martin Press,New York;
-----------(1988), "The Limits of Explanation: Testing the Internalisation Theory of the Multinational Enterprise,"Journal of International Business Studies, Vol. 19 (summer).
Caves, Richard E. (1982), “ Multinational enterprise and economic analysis”, (Cambridge: Cambridge UniversityPress).
Choudhary, Mohammad Sharif (1997). “FDI and Economic growth: the case of Asian developing countries”. FordHam University. Advisor: Dominic Salvatore.
Cinquetti, Carlos Alberto (1999) . “Growth external financing and stabilization of Barazilian economy”. NewSchool for Social Research, 1999. Advisor: Taylor, Lance.
Chakrabarti A, (2001), ‘ the determinants of foreign direct Investment: Sensitivity analysies of Cross-Country
Regressions’’ - Kyklos, 2001 Vol. %4-fas, 89-114Chakrabarti Avik, John S. Heywood, Markusen (1997) ‘ foreign investment, Vertical Integration and Local
equaity Requirements’ Economica, 2004 - Blackwell Synergy
Chakrabarti Avik (April 1997), ‘The Distribution of Foreign Direct Investment and the Excluded Economies’.School of Public Policy University of Michigan Ann Arbor, Michigan 48109-1220 Discussion Paper No.397 http://www.spp.umich.edu/rsie/workingpapers/wp.html
Choe, Jong Il. BDo Foreign Direct Investment and Gross Domestic Investment Promote Economic Growth?^Review of Development Economics, 7, 1, February 2003, pp. 44Y57.
Collier and Pattillo, 2000P. Collier and C. Pattillo, Editors, Investment and risk in Africa, Macmillan, London(2000).
Country Commercial Guides for FY 2000.” Pakistan Report prepared byU.S. Embassy Islamabad, released July
1999”, (chapter-vii. - investment climate).
Coase, R.H. (1937), "The Nature of the Firm”, Economica, Vol. 4 (November 1937).Doan, T.R. Litterman, and C. Sims, (1984). “Forecasting and conditional projection sing realistic prior
distribution”, Econometric Review, 3, 1-100.Dollar, D. (1992). 'Outward-oriented developing countries really do grow more rapidly: evidence from 95 LDCs,
1976–85', Economic Development and Cultural Change, vol. 40(3), (April), pp. 523–44.De Mello, L. R. BForeign Direct Investment-led Growth: Evidence from Time Series and Panel Data,’’ Oxford
Economic Papers, 51, 1999, pp. 133Y51.Driffield, N. L.; Munday, M. C. BIndustrial Performance, Agglomeration, and Foreign Manufacturing
Investment in the UK,’’ Journal of International Business Studies, 31, 2000, pp. 21Y37.Dunning, 1973J. Dunning , The determinants of international production. Oxford Economic Papers 25 (1973), pp.
289–336. Abstract-EconLitDunning, J.H. (1977). "Trade, Location of Economic Activity and the MNE: A Search for an Eclectic Approach," in

8/7/2019 media_21789_en
http://slidepdf.com/reader/full/media21789en 35/40
35
Bertil Ohlin, et al. Eds. The International Allocation of Economic Activities (London: Macmillan), pp. 395-418.
_______ (1979). "Explaining Changing Patterns of International Production: In Defence of the Eclectic Theory,"
Oxford Bulletin of Economics and Statistics, Vol. 41 (November)._______ (1988). "The Eclectic Paradigm of International Production: A Restatement and Some Possible
Extensions," Journal of International Business Studies, Vol. 19 (Spring)._______ (1996). “The geographical sources of the competitiveness of a firm: some results of a new survey”.
Transnational Corporations, vol: 5, no: 3, September 1996, pp.1- 29.Dunning, 1979J. Dunning , Explaining changing patterns of international production: In defence of the Eclectic
theory. Oxford Bulletin of Economic and Statistics 41 (1979), pp. 269–296.Dunning, 1988J. Dunning Explaining international production , Unwin Hyman, London (1988).Dunning, J.H., 1992. The competitive advantage of countries and the activities of transnational corporations.
Transnational Corporations 1, 135–168.Dunning, J.H. (1993) Multinational Enterprises and the Global Economy (Wokingham, Addison Wesley).Dunning, 1998Dunning, J. (1998). The changing geography of foreign direct investment: Explanations and
implications. In N. Kumar (Ed.), Globalization, foreign direct investment and technology transfers Impacts
on and prospects for developing countries. London: Routledge.Dunning, J.H (2001), ‘The Eclectic (OLI) Paradigm of International Production: Past, Present and Future’international Journal of the Economics of Business, volume 8, Number 2, July 1, 2001
Dunning and Narula, 1995J. Dunning and R. Narula Foreign direct investment and governments: Catalyst for
economic restructuring, Routledge, London (1995).Dunning and Wymbs, 1999Dunning, J., & Wymbs, C. (1999). The geographical sourcing of technology-based assets
by multinational enterprises. In D. Archibugi, J. Howells, & J. Michie (Eds.), Innovation policy in a global
economy. Cambridge: Cambridge University Press.Engle, R.F. & C.W.J. Granger (1987). “Co-Integration and Error correction: Representation, Estimation and
Testing,” Econometrica, 55, 251-276.Edwards, 1991Edwards, S. (1991). Capital flows, foreign direct investment and debt equity swaps in developing
countries. In H. Siebert (Ed.), Capital flows in the world economy: Symposium 1990. Tubingen: Institutefur Weltwirtschaft.
Flamm, 1984K. Flamm , The volatility of offshore investment. Journal of Development Economics 16 (1984), pp.
231–248.Freedom House, 1980–1994Freedom House (1980–1994). Freedom in the world: Political rights and civil liberties.
Westport, CT: Greenwood.Fry, Maxwell J. (1992) ‘Foreign Direct Investment in a Macroeconomic Framework: Finance,
Efficiency, Incentives and Distortions’, PRE Working Paper, Washington, DC: The WorldBank.
Fry, Maxwell, 1993, Foreign Direct Investment in Southeast Asia: Differential Impacts, ASEAN EconomicResearch Institute, Institute of Southeast Asian Studies, Singapore.
Fry, 1997M. Fry , In favour of financial liberalisation. Economic Journal 107 (1997), pp. 754–770.Fry, Maxwell J. (1994). "Foreign Direct Investment, Financing and Growth”, In Bernhard Fischer, ed., Investment
and Financing in Developing Countries (Baden-Baden, Germany: Nomos Verlagsgesellschaft), pp. 181-214.
Francisca M. Beer and Suzanne N. Cory (summer 1996), ‘The Locational Determinants of U.S. Foreign Direct
Investment in the European Union’. Journal Of Financial And Strategic Decisions Volume 9 Number 2summer 1996
Gastanaga et al., 1998V. Gastanaga, J. Nugent and B. Pashamova , Host country reforms and FDI inflows: Howmuch difference do they make?. World Development 26 (1998), pp. 1299–1312.
Graham, Edward M., and Paul R. Krugman (1989). “Foreign Direct Investment in the United States”, Washington,D.C.: Institute for International Economics.
Gordon H. Hanson (February 2001), ‘Should Countries Promote Foreign Direct Investment?’ United NationsConference on Trade and Development- Center for International Development Harvard University.Research papers for the Intergovernmental Group of Twenty-Four on International Monetary Affairs
Guisinger Stephen. (2001), ‘ From OLI to OLMA: Incorporating Higher Levels of Environmental and StructuralComplexity into the Eclectic Paradigm, International Journal of economics of business Volume 8, number2, July 2001
Haddad, M. and A. Harrison (1993). "Are there Positive Spillovers from Direct Foreign Investment?" Journal of

8/7/2019 media_21789_en
http://slidepdf.com/reader/full/media21789en 36/40
36
Development Economics, Vol. 42, pp. 51- 74.Haque et al., 1997Haque, N. U., Mathieson, D., & Sharma, S. (1997). Causes of capital inflows and policy responses
to them. Finance & Development , March, 3–6.
Haufbauer et al., 1994G. Haufbauer, D. Lakdawalla and A. Malani , Determinants of foreign direct investment andits connection to trade. UNCTAD Review (1994), pp. 39–51.Hymer, Stephen (1976), the international operations of national firms: A study of FDI Cambridge: MIT press.Hanson Gordon (2001), ‘should countries promote FDI, G-24 discussion paper series, UNCTAD centre for
International development Harvard University.Hamilton, J. D., (1994), “Time series, Princeton, Princeton University Press.Helleiner, Gerry K. (1989).” Transnational corporations and direct foreign investment”. Handbook of development
economics, vol.: 1 (Elsevier publishers), pp. 1441-1480.Hein, Simeon (1992). “Trade strategy and the dependency Hypothesis: a comparison policy, foreign investment and
economic growth in Latin America and East Asia”. Economic Development and Cultural Change, 40, 3,pp. 495- 521.
Hymer, S. H. (1976). "The International Operations of National Firms: A Study of Direct Foreign Investment,"
Ph.D. dissertation, 1960, Massachusetts Institute of Technology. (Cambridge: MIT Press).IFC papers.” Framework for the Collection, Compilation, and Dissemination of Foreign Direct Investment
Statistics”, (down loaded from internet). IMF-- A quarterly magazine of the IMF March 1999, Volume 36,Number 1
Ishrat Hussain (2000). “Pakistan the economy of an elitist state”, Oxford University Press-2000.James H Love (November 2000) ‘Technology Sourcing Versus Technology Exploitation: An Analysis of US Foreign
Direct Investment Flows’. James H Love, Aston Business School, Aston University, Birmingham, B4 7ET,UK RP0028
J. Peter Neary ( 2002), ‘Foreign Direct Investment and the single market’. University College Dublinand CEPR home page: http://www.ucd.ie/~economic/staff/pneary/neary.htm
Kadi O - 1999 - Economic freedom & foreign direct investment: the Arab world case Eastern Michigan UniversityKishor Sharma (2000), ‘ Export Growth In India: Has Fdi Played A Role’ Center Discussion Paper No. 816 Charles
Stuart University AustraliaKnickerbocker, Frederick T. (1973).” Oligopolistic Reaction and Multinational Enterprise”, Boston: Division of
Research, Harvard University Graduate School of Business Administration.
Kawaguchi, Osamu (1994). "Foreign Direct Investment in East Asia: Trends,Determinants and Policy Implications," World Bank Internal Discussion Paper, No. IDP-139.
Kadi, Osama (1999). “Economic freedom and FDI: the Arab world Case”. Eastern Michighen University.Kathryn L. Dewenter (1995). “Do exchange rate changes derive FDI?” University of Washington, The Journal of
Business vol: 68, no: 3, July 1995, pp-).Khawaja Amjad Saeed Prof: Dr. (1995). Economy of Pakistan, 1995, p.137.-----------(2000). “Foreign direct investment: fi A Review”. Investment and Marketing, vol: xxxv, 1’ 2000. Khan MZ (1996) – ‘Pakistan: Prospects for Private Capital Flows and Financial Sector Development, ‘the AnnualGeneral Meeting of the Pakistan Society of 1996Kojima, Kiyoshi (1973). "A Macroeconomic Approach to Foreign Direct Investment”. Hitotsubashi Journal of
Economics, Vol. 14 (June).Kwang W. Jun and Harinder Singh (1996). “The determinants of FDI in developing countries”. Transnational
Corporations, vol: 5, no: 2, (August 1996), pp. 67- 105.
Lall, Sanjaya (1974). "Less Developed Countries and Private Foreign Direct Investment. A Review Article”. WorldDevelopment, Vol. 2, No. 4&5, pp. 43-48.
Lall, Sanjaya (April 2000). “Foreign Direct Investment and development: research issues in the
emerging context”. centre for international economic studies university of adelaide sa 5005 Australia(Queen Elizabeth house oxford university (cies policy discussion paper 0020).
Laura Resmini.(1999)” Determinants of FDI into the CEECs: New evidence from sectorial patterns”. LICOS Centrefor Transition Economics, Katholieke Unversitiet Leuven, (Belgium, and Baconi University, Milan Italy).
Lipsey, R. E. BInterpreting Developed Countries_ Foreign Direct Investment,’’ NBER Working Paper no. 7810,National Bureau of Economic Research, Cambridge, Massachusetts, 2000.
Lansbury et al., 1996Lansbury, M., Pain, N., & Smidkova, K. (1996). Foreign direct investment in Central Europesince 1990: An econometric study. National Institute Economic Review, May, 104–114.
Levine and Renelt, (1992 ), A sensitivity analysis of crosscountry growth regressions. American Economic Review 82 (1992), pp.

8/7/2019 media_21789_en
http://slidepdf.com/reader/full/media21789en 37/40
37
Levis, 1979M. Levis , Does political instability in developing countries affect foreign investment flow? Anempirical investigation. Management International Review 19 (1979), pp. 59–68.
Lim, 1983D. Lim , Fiscal incentives and foreign direct investment in less developed countries. Journal of
Development Studies 19 (1983), pp. 207–212.Litterman RB (1984) ‘A Bayesian Procedure for forecasting with Vector Autoregressions’ Federal Reserve Bank of Minneapolis’ Working Paper.
Lizondo, 1992Lizondo, J. (1992). Foreign direct investment. In Determinants and systemic consequences of
international capital flows. IMF Occasional Paper 77, IMF, Washington, DC.Lucas, Robert (1993). “On the determinants of direct foreign investment: evidence from East and South East Asia”,
World Development, 21, 3, pp. 391- 406.Mac Dougall, G. D. A . (1960). "The Benefits and Costs of Private Investment from Abroad: A Theoretical
Approach". Economic Record 36, pp. 13-35.Macdougal, G. D. A., (1960), ‘ The Benefits and Costs of Private Investment from Abroad: A Theoretical
Approach,” Economic Record 36 (Mar. 1960), 13-35.Markusen, J.; Venables, A. BForeign Direct Investment as a Catalyst for Industrial Development,’’ European
Economic Review, 43, 1999, pp. 335-56.Mankiw et al., 1992 G. Mankiw, D. Romer and D. Weil , A contribution to the empirics of economic growth.
Quarterly Journal of Economics 152 (1992), pp. 407–437.Meier, Gerald M. (1968) “The Economics of Development Theory and Policy “. (Harper).Nabi, Ijaz (1992). “Foreign Direct Investment: Lessons from the Asian experience”. Paper presented at the LUMS
conference on Financing Pakistan’s Development in the 1990s, LUMS, Lahore.Nancy Marion Department of Economics University of California, Santa Cruz Dartmouth College,
[email protected] [email protected], A. Bende-J. L. Fordf, S. Sen. and J. Slater (November-2000). “Foreign direct investment locational
determinants and the linkage between FDI and other macro economic factors”, Graduate Centre forBusiness Administration, The Birmingham School, University of Birmingham, Edgbaston, Birmingham,B15 2RU, UK.
Nigh, D. (1985).” The effect of political events on US directs foreign investment: a pooled time-series cross
-sectional analysis”. Journal of International Business Studies, 16, pp. 1- 17.Nishat, Muhammad and Anjum Aqeel, (1998). The Empirical Determinants of Direct Foreign Investment,
Savings and Development , XXII (4).Narula Rajneesh and John H.Dunning (1998). “Globalisation and New Realities for multinational enterprise
(Developing Host Country Interaction)”. Revised Version, 14th September 1998. University of Oslo.Narula. Rajneesh “The locational determinants of inward and outward FDI activity”. Faculty of Economics and
Business/MERIT University of Limburg P O Box 616 6200 MD Maastricht the Netherlands.Noorbakhsh Farhad et al (2001) Farhad Noorbakhsh, Alberto Polani and Ali Youssef, ‘ Human Capital and FDI
inflows to Developing Countries: New Empirical Evidence’ World Development Volume 29, issue 9, page1593-1610.
OECD (1989). Organization of economic cooperation and development, UN. Overseas Development Institute(1997). “foreign direct investment flows to low- income countries: a review of the evidence”. (1997 (3)September). Email: [email protected]
Padma Mallampally and Karl P. Sauvant (1999). “Foreign Direct Investment in Developing Countries”. Aquarterly magazine of the IMF-March 1999, Volume 36, Number 1.
Przewoski and Limongi, 1993A. Przewoski and F. Limongi , Political regimes and economic growth. Journal of Economic Perspectives 7 (1993), pp. 51–69.
Quan Li and Adam Resnick (February 24, 2001), ‘Investors and Autocrats: Democratization and Foreign Direct
Investment in 55 less Developed Countries’. Presented at the International Studies Association AnnualConference, Chicago, IL
Root and Ahmed, (1979), Empirical determinants of manufacturing direct foreign investment in developingcountries. Economic Development and Cultural Change 27 (1979), pp. 751–767.
Ryckeghem, 1998Ryckeghem, W. (1998). Domestic policy variables and foreign direct investment inflows in LatinAmerica. In P. K. M. Tharakan, & D. Van Den Bulcke (Eds.), International trade, foreign direct investment
and the economic environment: Essays in Honour of Professor Sylvain Plasschaert . London: Macmillan.Rugman, Alan M. (1980). "Internalisation as a General Theory of Foreign Direct Investment: A Re-Appraisal of the
Literature". Weltwirtschaftliches Archiv, Vol. 116, Heft 2.Rao, V.V. Bhanoji, and S. M. Thangavelu (1998). "TFP Growth in Manufacturing Industries in ASEAN: A Study on

8/7/2019 media_21789_en
http://slidepdf.com/reader/full/media21789en 38/40
38
FDI Intensive and Other Industries in Singapore". Papers and Proceedings of the International Symposiumon Foreign Direct Investment in East Asia (Tokyo: Economic Planning Agency), pp. 231-264.
Root, Franklin, and A. Ahmed (1979). “Empirical determinants of manufacturing direct foreign investment in
developing countries”. Economic Development And Cultural Change, 27, pp. 751- 767.Salvador Barrios (February 2000), ‘Are there positive spillovers from Foreign Direct Investment? Evidence from the
Spanish experience (1990- 1994)’.University of Manchester and University College Dublin.Schneider, F. and B. Frey (1985). “Economic and political determinants of foreign direct investment”. World
Development, 13, 2, pp. 161- 175.State Bank of Pakistan (2000/2001). “the state of pakistan’s economy”. First Quarterly Report for
2000/2001.Steven Globerman (1997). “TNCs and International technological specialization”. Transnational Corporations,
August 1997, vol: 6, no: 2, pp. 95- 105.Stephen P.Ferris, G. Rooney Thompson, and Calvin Val son (1997). “ An analysis of FDI in Latin America”.
Pakistan Economics and Social Review, vol: xxxv, no: 1(summer 1997), pp. 11- 24.Sayek, Selin (1999). “FDI and inflation: theory and evidence”. Duke University. Advisor: Kimbrough, Kent.Soboleva, Nadezhada (1999). “Foreign Direct Investment and trade policy: An Empirical Analysis”. Yale
University, 1999.Sekiguchi, Sueo, Chokusetsu Toshi to Gijutsu Iten no Keizaigaku (1988). “Economics of Foreign Direct Investment
and Technology Transfer”. Chuo Keizaisha.Streeten, Paul P. (1973). "The Multinational Enterprise and the Theory of Development Policy”. World
Development, Vol. 1, No. 10, pp. 1-13.Sjöholm, Fredrik (1998). "Joint Ventures, Technology Transfer and Spillovers: Evidence from Indonesian
Establishment Data". Papers and Proceedings of the International Symposium on Foreign DirectInvestment in East Asia (Tokyo: Economic Planning Agency), pp. 193-227.
Saskia K.S. Wilhelm’s Morgan Stanley Dean Witter (July 1998), ‘Foreign Direct investment and its determinants in
emerging economies’ African Economic Policy Paper Discussion Paper Number 9 July 1998. Funded byUnited States Agency for International Development Bureau for Africa Office of Sustainable DevelopmentWashington, D.C. 20523-4600.
Sung-Hoon Lim (internet - down loaded), “Foreign Direct Investment Policy and Incentives”. Senior Researcher/ Ph.D. Korea Trade-Investment Promotion Agency (KOTRA)
Schadler et al., 1993Schadler, S., Carkovic, M., Bennett, A., & Kahn, R. (1993). Recent experiences with surges incapital inflows. Occasional Paper No. 108, IMF, Washington, DC.
Shamsuddin, 1994A. Shamsuddin , Economic determinants of foreign direct investment in less developed countries.Pakistan Development Review 33 (1994), pp. 41–51.
Sharif CM-( 1997) - Foreign direct investment and economic growth: the case of Asian developing countries,Fordham University
Sims Ca (1980), ‘ Macroeconomics and Reality’ Econometrica 1980.Sims (1982) , ‘Policy analysis with Econometric Models.’ Brookings papers on economic activity, 1, pp 107-154Sims CA (1986) ‘ Are forecasting models usable for policy analysis’ Federal Reserve Bank of Minneapolis quarterlyReview, 1986.Singh and Jun, 1995Singh, H., & Jun, K. (1995). Some new evidence on determinants of foreign direct investment in
developing countries. Policy Research Working Paper No. 1531, World Bank, Washington, DC.Sirowy and Inkeles, 1990L. Sirowy and A. Inkeles , The effects of democracy on economic growth and inequality:
A review. Studies in Comparative International Development 25 (1990), pp. 126–157.Schneider and Frey, (1985), Economic and political determinants of foreign direct investment. World Development
13 (1985), pp. 161–175.Torrisi, 1985 C. Torrisi , The determinants of direct foreign investment in a small LDC. Journal of Economic
Development 10 (1985), pp. 29–45.Teanravisitsagool, Pattama (1999). “Trade off between the domestic and foreign investment: Theoretical analysis
and empirical investigation for the case of Thailand ”. Carlton University Canada, 1999.UNCTAD, (1999) “Foreign direct investment and the challenge of development”. United Nations Conference on
Trade and Development (UNCTAD), 1999. World Investments Report 1999: United Nations Publication,New York and Geneva.).
UNCTAD - World Investment Report 1990-2000. United Nations Conference on Trade and Development, UN. New
York.
UNCTAD (Trade and Development Report 2000) “Global Economic Growth and Imbalances”, Trade and

8/7/2019 media_21789_en
http://slidepdf.com/reader/full/media21789en 39/40
39
Development Report (TDR) 2000 , issued by the United Nations Conference on Trade and Development(UNCTAD), United Nations 2000. [email protected].
UNCTAD, 1993UNCTAD (1993, 1994, 1996, 1998, 1999). World investment report . Geneva: UNCTAD.
UNCTAD-DTCI, 1993UNCTAD-DTCI (1993). Explaining and forecasting regional flows of foreign direct investment . Geneva: UNCTAD.UNCTC, 1991UNCTC (1991). World investment report 1991. Geneva: UNCTC.UNCTC, 1992UNCTC (1992). The determinants of foreign direct investment: A survey of the evidence. New York:
United Nations.Usha Nair-Reichert (April 1999 - Revised January 2000), ‘Causality Tests for Cross-Country Panels: New Look at
FDI and Economic Growth in Developing Countries’. Georgia Institute of Technology Diana WeinholdLondon School of Economics.
Wheeler, David, and A. Mody (1992). “International investment location decisions, the case of U.S. firms”. Journalof International Economics, 33, pp. 57- 76.
Appendix ‘A’
DATA SOURCES 1- UN, The UN Government Finance Statistics, New York, UN (various years).2- UN, The United Nations International Financial Statistics Year Book, New York, UN (various
years).3- UN, The United Nations Year Book of Labour Statistics, New York, UN (various years).4- UNCTAD- (United Nations Conference on Trade and Development) New York and Geneva.
World Investment Report (for various years).5- UNCTC- (United Nations Centre on Transnational Corporations) (1992), “ the determinants of
foreign direct investment, A Survey of the Evidence, Division of Transnational corporations andinvestment, New York, UN.
6- UNCTC- (United Nations Centre on Transnational Corporations) New York (1988),“Transnational Corporations in world Development: Trends and Prospects”.
7- UNCTAD- (United Nations Conference On Trade And Development: New York and Geneva1998). “Hand Book of Foreign Direct Investment by Small And Medium-sized Enterprises-Lessons from Asia”.
8- World Bank Global Development Finance 1997 vol: 1 Washington DC: World Bank, FirstEdition March 1997.
9- World Bank. Private Capital Flows to Developing Countries: The road to the FinancialIntegration: New York: Oxford University Press, April 1997.
10- State Bank of Pakistan: Annual Reports (various years).11- Pakistan Bureau of Statistics.12- Economic Survey (various Years).
13- Census of Manufacturing Industries.Variables Measurement of variables:
FDI- net FDI flows into the manufacturing/ GDP* 100Real wage rates- real wage ratesOutput growth- (GDPt – GDPt-1)/GDPt-1* 100Openness- (Exports+ Imports)/ GDP*100Labour force- employment level in the manufacturing sectorcapital formation- Fixed capital formation/ GDP*100Human capital- Secondary school enrolmentLiberalization- A dummy variable with 0 representing the pre liberalization, period-1971-87 and 1representing the period 1988-2005Foreign exchange rates- annual average of the exchange rate between one Pakistani Rupee and theequivalent in Dollar

8/7/2019 media_21789_en
http://slidepdf.com/reader/full/media21789en 40/40
Interest rates- average annual lending interest rates.Real wage rates- average hourly wage rates.Infrastructure- level of government expenditure on economic services (which by definition includes,
transport and communication, electricity gas and water, industry and agriculture)/GDP*100.(governmentexpenditure on education was also included in this ratio)
Savings- end of year annual amount of time and savings and deposits in commercial banks/GDP*100Inflation- implicit GDP inflatorGovernment expenditure on education- Annual recurrent and capital expenditure on education/GDP*100GNP- GNP at market prices.Political Risk indicator- 5-point scale indicating stability of government and market oriented policies (1=lowest, 5= highest).Market potential- annual average GDP per capita (US. $)Annual average GDP growth%Economic stability- annual average inflation rate (%)