
PA - PSRS
NGA Center for Best PracticesHealth Policy AdvisorsSeptember 10, 2004
Medical Liability & Patient Safety:Pennsylvania’s Experience
PA - PSRS
BackgroundBackground
• Institute Of Medicine Reports
– “To Err is Human – Building a safer health system” (1999)
– “Crossing the Quality Chasm” (2001)
– “Patient Safety - Achieving a new standard for care” (2004)
• 44,000 - 98,000 preventable deaths (estimated)
• $29 Billion per year in additional costs
PA - PSRS
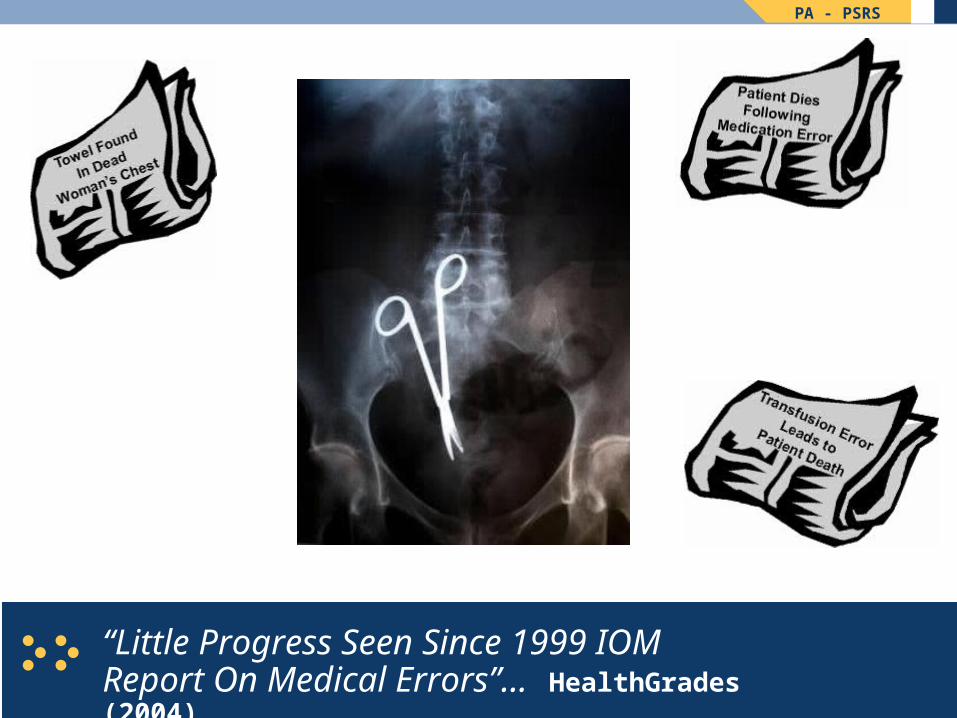
“Little Progress Seen Since 1999 IOMReport On Medical Errors”… HealthGrades (2004)

PA - PSRS
Why Do Errors Happen?Why Do Errors Happen?
PA - PSRS
Patient Safety Organization…

PA - PSRS
Strategic / Policy DecisionsStrategic / Policy Decisions
Charter
• Statute• Regulation• Executive Order
Funding
• General Funds• Assessment /
Fees• Grant / Other
Oversight
• Independent Agency/Board
• Existing Agency• Licensure Board
Goal
• Learning• Regulatory
Patient SafetyOrganization
PA - PSRS
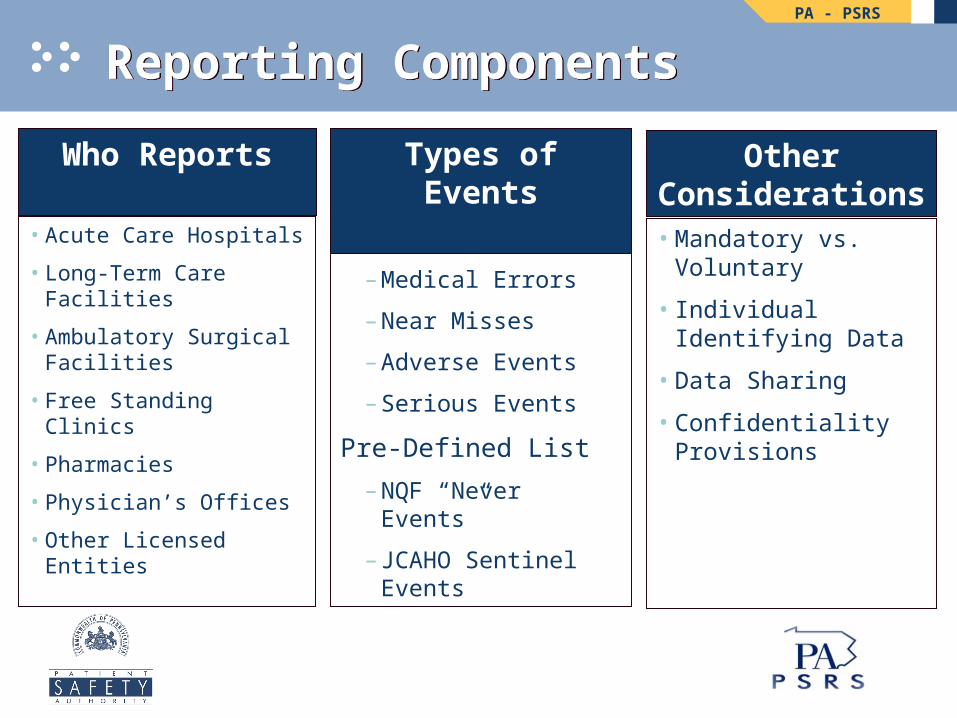
Reporting ComponentsReporting Components
• Acute Care Hospitals
• Long-Term Care Facilities
• Ambulatory Surgical Facilities
• Free Standing Clinics
• Pharmacies
• Physician’s Offices
• Other Licensed Entities
Who Reports
• Mandatory vs. Voluntary
• Individual Identifying Data
• Data Sharing
• Confidentiality Provisions
Other Considerations
By Definition
– Medical Errors
– Near Misses
– Adverse Events
– Serious Events
Pre-Defined List
– NQF “Never Events”
– JCAHO Sentinel Events
Types of Events

PA - PSRS
Pennsylvania’s Approach

PA - PSRS
The Medical Care Availability and Reduction of Error (MCARE) Act of 2002The Medical Care Availability and Reduction of Error (MCARE) Act of 2002
• Establishes the Patient Safety Authority
• Goal: Reduce and eliminate medical errors by identifying problems and implementing solutions that promote patient safety
• Promulgate new reporting requirements for: Hospitals, Ambulatory Surgical Facilities (ASF’s) and Birth Centers

PA - PSRS
Patient Safety AuthorityPatient Safety Authority
• 11-member Board appointed by the Governor and General Assembly consisting of:
– Physician General (Chair), Physician, Nurse, Pharmacist, Hospital employee, health care worker, non-health care worker, and 4 other PA residents
• Established as an independent entity
• Non-regulatory

PA - PSRS
Funding ModelFunding Model
• Allows for up to $5 Million a year.
• Assessment of $105/unit based on:
– For Hospitals: Licensed Beds
– For ASFs: Licensed Operating Rooms
– For Birth Centers: Licensed Birthing Rooms
• In 2004 and 2005 – assessed $2.5 million or 50% of authorized amount.

PA - PSRS
Reportable EventsReportable Events
• Serious Event (“adverse event”)
– Event that results in patient harm
• Incident (“near-miss”)
– Event that could have injured a patient
• Infrastructure Failure
– Event related to physical plant, facility systems and criminal activity

PA - PSRS
PA - Reporting ComponentsPA - Reporting Components
Acute Care Hospitals
• Long-Term Care Facilities
Ambulatory Surgical Facilities
• Free Standing Clinics
• Pharmacies
• Physician’s Offices
Other Licensed Entities
Who Reports
Mandatory vs. Voluntary
No Individual Identifying Data
• Data Sharing
Confidentiality Provisions
Other Considerations
By Definition
– Medical Errors
Near Misses
– Adverse Events
Serious Events
Pre-Defined List
– NQF “Never Events”
– JCAHO Sentinel Events
Types of Events

PA - PSRS
Reporting System

PA - PSRS
Report IntakeReport Intake

PA - PSRS
Report IntakeReport Intake
• 21 Core Questions
– Patient Age / Gender
– Location
– Event type
– Level of harm, contributing factors and root causes
– Recommendation to prevent future occurrence
• Additional Event Detail Questions
– 15 Major categories, 233 sub categories
PA - PSRS
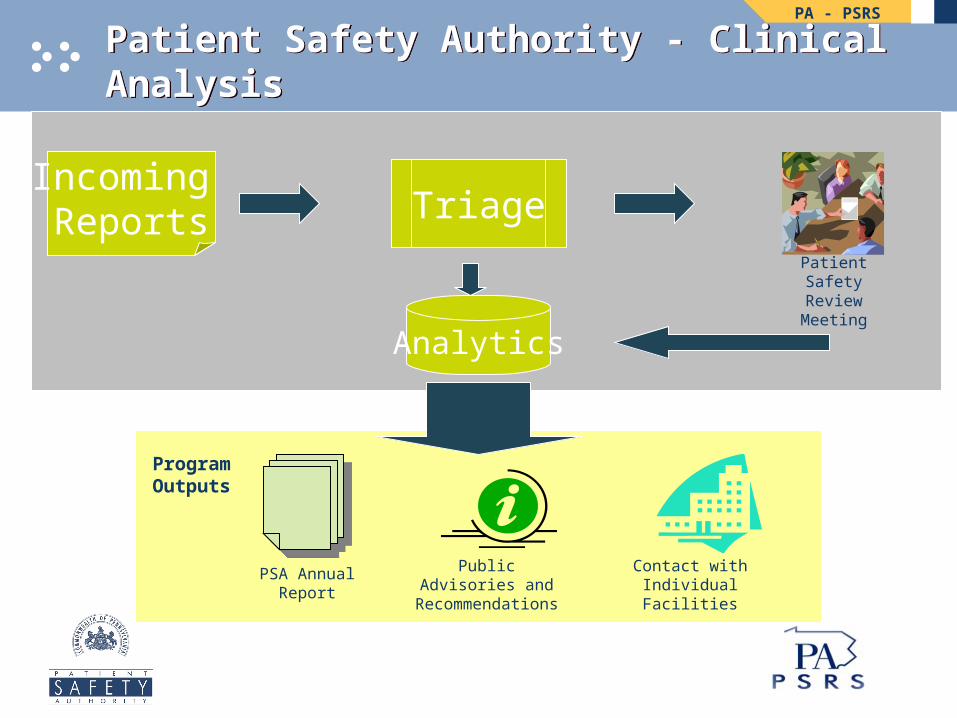
Patient Safety Authority - Clinical AnalysisPatient Safety Authority - Clinical Analysis
Analytics
TriagePatient Safety
Review Meeting
Contact with Individual Facilities
Public Advisories and Recommendations
PSA Annual Report
Program Outputs
Incoming Reports

PA - PSRS
Advisory TopicsAdvisory Topics
• Dangerous Abbreviation in Surgery
• Falls Associated with Wheelchairs
• MRI Hidden Risks
• Hidden Sources of Latex
• Use Of Multidose Medication Vials And Latex Allergy
• Use of X-Rays for Incorrect Needle Counts
• Preventing Wrong-Site Surgery

PA - PSRS
Analytical Tools
PA - PSRS
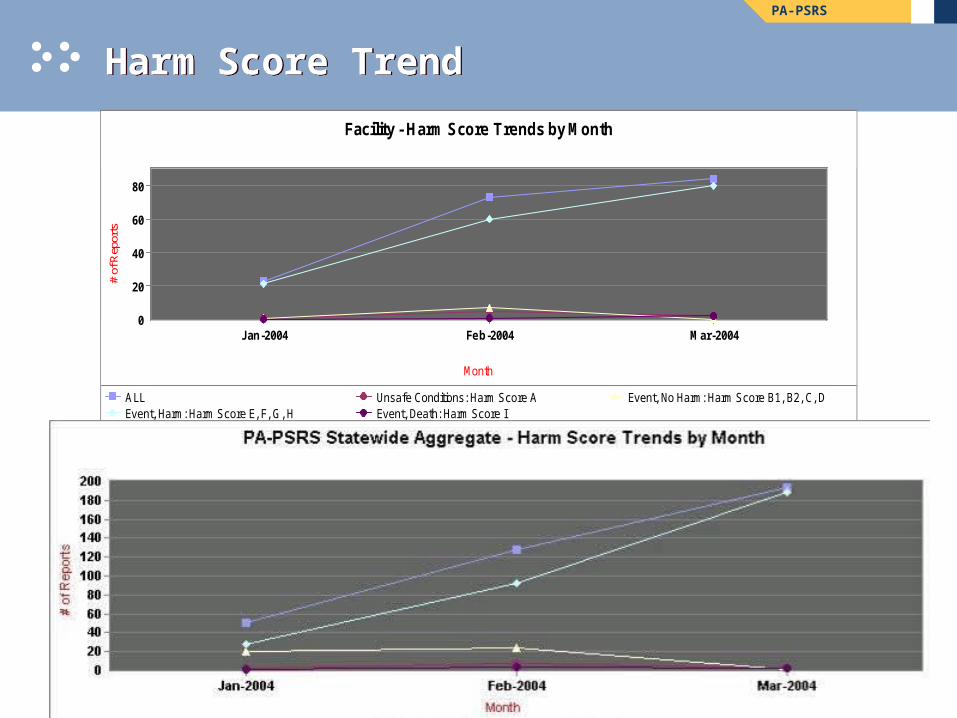
Harm Score TrendHarm Score Trend
ALL Unsafe Conditions: Harm Score A Event, No Harm: Harm Score B1, B2, C, DEvent, Harm: Harm Score E, F, G, H Event, Death: Harm Score I
0
20
40
60
80
Jan-2004 Feb-2004 Mar-2004
# of
Rep
orts
Facility - Harm Score Trends by MonthFacility - Harm Score Trends by Month
Month
PA-PSRS
PA - PSRS
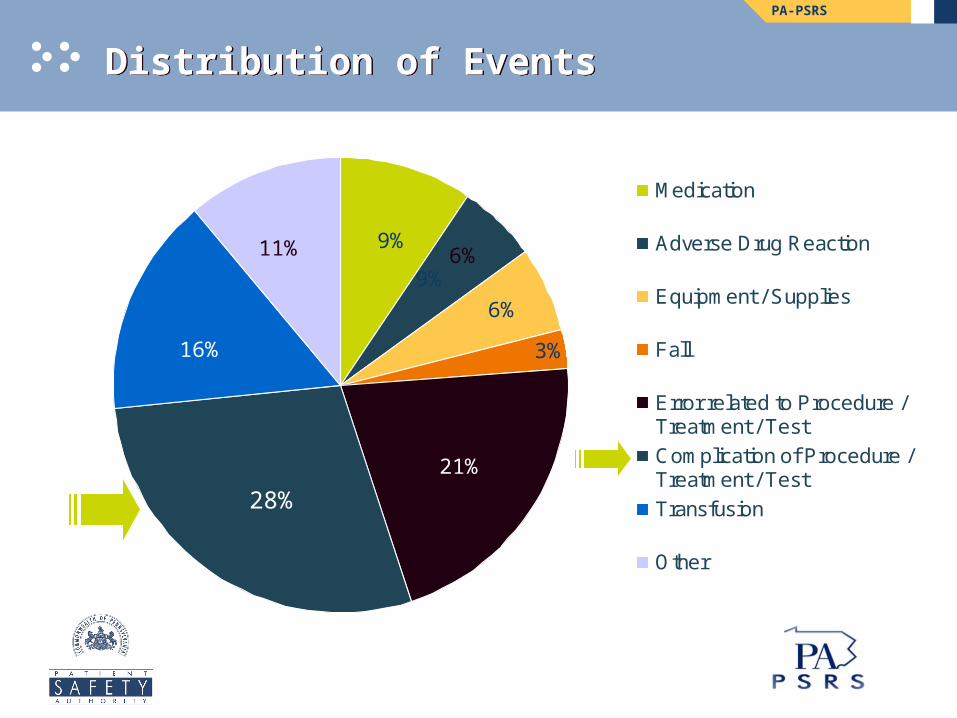
Distribution of EventsDistribution of Events
Slice 1 Slice 2 Slice 3 Slice 4
Medication
Adverse Drug Reaction
Equipment / Supplies
Fall
Error related to Procedure /Treatment / Test
Complication of Procedure /Treatment / Test
Transfusion
Other
9%
21%
28%
16%
11%
6%
9%
3%
6%
PA-PSRS

PA - PSRS
Event DistributionEvent Distribution
1. Complication follow ing surgery or invasive procedure
2. Anesthesia Event
3. Emergency Department
4. Maternal complication
5. Neonatal complication
6. Nosocomial Infection
7. Cardiopulmonary arrest outside of ICU setting
8. IV site complication (phlebitis, bruising, inf iltration)
9. Extravasation of drug or radiologic contrast
10. Catheter or tube problem
11. Onset of hypoglycemia during care
12. Complication follow ing spinal manipulative therapy
13. Other (specify)
Complication of Procedure / Test / TreatmentComplication of Procedure / Test / Treatment
29%
10%
8%
2%2%2%4%
2%2%
12%
12%
16%
PA-PSRS

PA - PSRS
Event Details by LocationEvent Details by Location
PA - PSRS
Culture of LearningCulture of Learning
The ultimate success of this reporting system will not be found solely in the data collected. Rather, improved patient safety will be the result of actions taken by individual facilities in response to what they learn through PA-PSRS.

PA - PSRS
PA Patient Safety AuthorityPA Patient Safety Authority
www.psa.state.pa.us


