

Metabolites 2012, 2, 1031-1059; doi:10.3390/metabo2041031
metabolites
ISSN 2218-1989 www.mdpi.com/journal/metabolites/
Article
Medicinal Plants: A Public Resource for Metabolomics and Hypothesis Development
Eve Syrkin Wurtele 1,2,*, Joe Chappell 3, A. Daniel Jones 4, Mary Dawn Celiz 4, Nick Ransom 1,2,
Manhoi Hur1, Ludmila Rizshsky 5, Matthew Crispin 1,2, Philip Dixon 6, Jia Liu 6, Mark P.
Widrlechner7 and Basil J. Nikolau 2,5
1 Department of Genetics, Cell and Developmental Biology, Iowa State University, Ames, IA 50011,
USA 2 Center for Metabolic Biology, The Plant Science Institute, Iowa State University, Ames, IA 50011,
USA 3 Department of Cellular and Molecular Biochemistry, University of Kentucky, Lexington, KY,
40536, USA 4 Department of Biochemistry & Molecular Biology and Deptment of Chemistry, Michigan State
University, East Lansing, MI 48824, USA 5 Department of Biochemistry, Biophysics and Molecular Biology, Iowa State University, Ames, IA
50011, USA 6 Department of Statistics, Iowa State University, Ames, IA 50011, USA 7 Department of Ecology, Evolution, and Organismal Biology and Department of Horticulture, Iowa
State University, Ames, IA 50011, USA
* Author to whom correspondence should be addressed; E-Mail: [email protected];
Tel.: +1-515-708-3232; Fax: +1-515-294-0803.
Received: 18 September 2012; in revised form: 30 October 2012 / Accepted: 31 October 2012 /
Published: 21 November 2012
Abstract: Specialized compounds from photosynthetic organisms serve as rich resources
for drug development. From aspirin to atropine, plant-derived natural products have had a
profound impact on human health. Technological advances provide new opportunities to
access these natural products in a metabolic context. Here, we describe a database and
platform for storing, visualizing and statistically analyzing metabolomics data from
fourteen medicinal plant species. The metabolomes and associated transcriptomes
(RNAseq) for each plant species, gathered from up to twenty tissue/organ samples that
have experienced varied growth conditions and developmental histories, were analyzed in
parallel. Three case studies illustrate different ways that the data can be integrally used to
OPEN ACCESS
Widrlechner

Metabolites 2012, 2 1032
generate testable hypotheses concerning the biochemistry, phylogeny and natural product
diversity of medicinal plants. Deep metabolomics analysis of Camptotheca acuminata
exemplifies how such data can be used to inform metabolic understanding of natural
product chemical diversity and begin to formulate hypotheses about their biogenesis.
Metabolomics data from Prunella vulgaris, a species that contains a wide range of
antioxidant, antiviral, tumoricidal and anti-inflammatory constituents, provide a case study
of obtaining biosystematic and developmental fingerprint information from metabolite
accumulation data in a little studied species. Digitalis purpurea, well known as a source of
cardiac glycosides, is used to illustrate how integrating metabolomics and transcriptomics
data can lead to identification of candidate genes encoding biosynthetic enzymes in the
cardiac glycoside pathway. Medicinal Plant Metabolomics Resource (MPM) [1] provides a
framework for generating experimentally testable hypotheses about the metabolic networks
that lead to the generation of specialized compounds, identifying genes that control their
biosynthesis and establishing a basis for modeling metabolism in less studied species. The
database is publicly available and can be used by researchers in medicine and
plant biology.
Keywords: database; metabolomics; specialized metabolites; medicinal; cardiac glycoside;
alkaloid; digitalis; terpene; phenolic
1. Introduction
Humans have relied for millennia on natural products for relief of pain and improvement of health.
Specialized metabolites from plants serve as rich resources for drug development. The molecular and
physiological effects of medicinal plant extracts and components are often characterized in research
studies of mammalian systems; almost 100 plant-derived compounds were in clinical trials in 2007,
and as of 2008, 68% of all pharmaceuticals were plant derived or plant inspired [2].
In part because they lack mobility, plants have evolved chemically-based strategies for defense and
attraction [3,4]. As a consequence, even low levels of tens of thousands of the hundreds of thousands
of metabolites that are synthesized across the plant kingdom interact with mammalian signaling
networks via variety of molecular mechanisms. However, metabolic diversity is poorly characterized
for most species that are used medicinally and indeed for plants in general. In addition, understanding
of the molecules and metabolic pathways that lead to the formation of already-known plant-derived
medicinal compounds is still incomplete. Modeling of metabolism requires computational technologies
acting on multidimensional data, integrated with informed biological understanding of metabolites and
pathways. In the case of medicinal plants (i.e., non-model-species), such data are scarce and difficult to
integrate into a meaningful biological framework. One feature that can facilitate studies of plant
metabolites and the corresponding pathways is that the content and profile of metabolite accumulation
vary widely with developmental stage, cell and tissue type, genotype, and environmental perturbation
[5–7]. A metabolomics-based analysis of natural products across multiple conditions is a first step
Metabolites 2012, 2 1033
towards elucidating the associated metabolic pathways and identifying enzymatic and regulatory genes
associated with these pathways.
The development of publicly-available genomic, transcriptomic, and more recently, metabolomic,
flux and proteomic data sets for model organisms has accelerated the understanding of metabolism and
metabolic networks [2,8–14]. Analogous data sets for medicinal plants will similarly revolutionize
how researchers approach, decipher, and model the accumulation of medicinal compounds, and
consequently enable the more effective development and utilization of medicinally active plant
metabolites. This manuscript describes an information-rich database platform for medicinal plants (Medicinal Plant Metabolomics Resource (MPMR , [1]) assembled through a large-scale,
collaborative effort, and illustrates how such an investment can impact many who work in the fields of
medicinal plant chemistry, biochemistry, metabolic modeling, and drug development. This resource is
linked to transcriptomics data for the same samples (Medicinal Plant Metabolomics Resource
(MPGR;[15]). The overall effort is part of the Medicinal Plant Consortium (MPC), an NIH-supported
project including 13 collaborating research units from 7 institutions focused on
providing transcriptomic [15] and metabolomic [1] resources for 14 key medicinal plants to the
worldwide research community for the advancement of drug production and development.
MPMR is meaningful to the wider research community because it is available to all researchers for
evaluation. A major challenge in evaluating complex datasets is how to best visualize these data to
readily extract new knowledge. Here, we detail the public database MPMR, and we illustrate with test
cases as to how the MPMR database can be used to extract information and provide a framework for
researchers to generate experimentally testable hypotheses about the metabolites and metabolic
networks that lead to the generation of specialized compounds.
2. Results and Discussion
Metabolomics data represent deep and comprehensive measures of the levels of metabolites in a
defined tissue. In order for metabolomics data to be seamlessly integrated with other global molecular
datasets that define the biological status of tissue(s), it needs to be organized and normalized in a
standard format that enables cross-referencing with multiple datasets. Integral to this organization are
the associated metadata that define the biological status of the tissue under analysis, and the methods
used to extract and analyze the metabolites. The MPMR database and interface provide the ability to
organize metabolomics data and metadata. The user interface and tools for MPMR were shaped in part
by discussions among various participants of the MPC.
Researchers can investigate the data using the tools within MPMR, or download it for additional
statistical or bioinformatics analysis. These data can inform researchers who are planning detailed
biochemical studies or who are devising a framework for a metabolic model for a medicinal plant species.
An analytical approach to metabolomics used for many species in MPMR is Liquid
Chromatography-Time-Of-Flight Mass Spectrometry (LC/TOF-MS); this method employs an
information-rich strategy, termed multiplexed collision-induced dissociation (multiplexed CID)
[16,17] that acquires mass spectra from 4 (or 5) different collision energies on the time-frame of
ultrahigh performance liquid chromatography (UHPLC). LC/TOF-MS generates accurate molecular
and fragment masses for all detected compounds, including low abundance intermediates, and yielded
lists of several hundred to several thousand detected signals for each sample [18]. In deep metabolite
Metabolites 2012, 2 1034
profiling of plant material, the number of detected metabolites far outstrips the number of known
natural products.
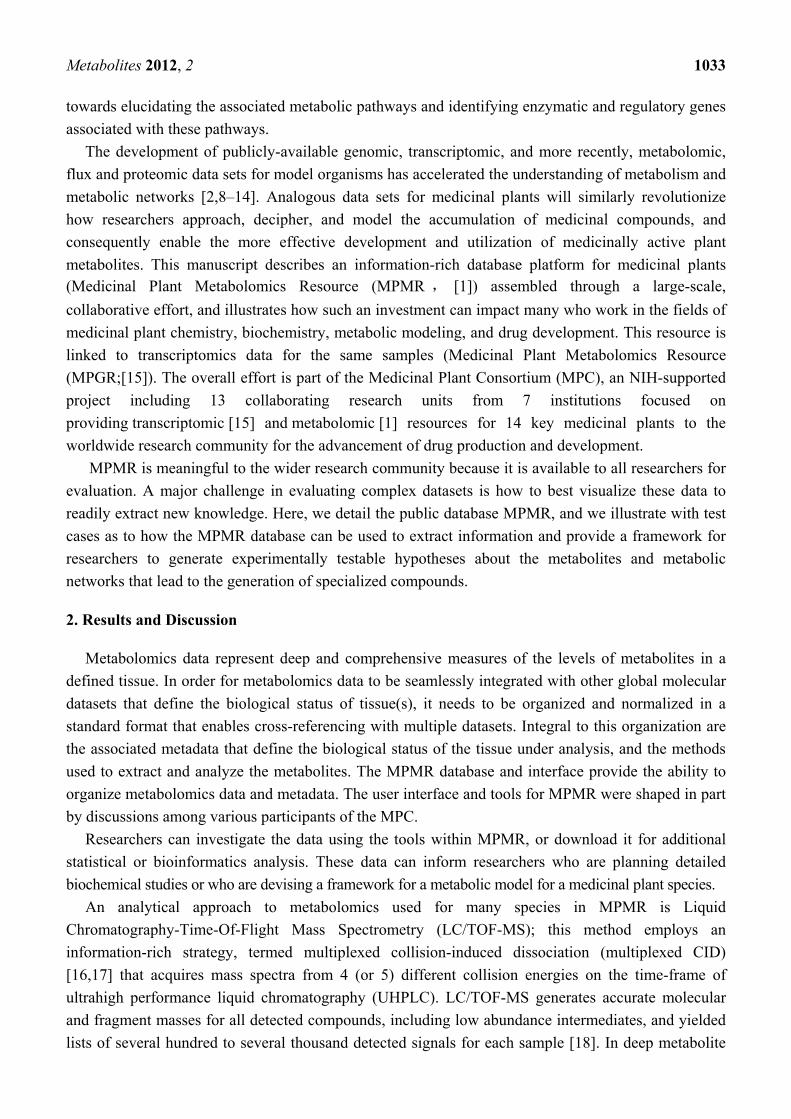
Figure 1. Scatterplots providing a rapid method for assessing the quality of metabolite
determinations.
Both panels are screenshots from MPMR. Upper panel: This example is from the Help section of MPMR, and contains an explanation of the plot features. The high scatter (low reproducibility) of data across the replicates from this sample might lead a user to considerable caution over data interpretation. Lower panel: The data from this sample have low scatter; replicates are quite similar to each other (Spearman correlation of 0.96–0.98).
Metabolites 2012, 2 1035
In addition, a variety of Gas Chromatography-Mass Spectrometry (GC-MS) protocols were used for
metabolite analysis. These incorporate a more targeted approach designed to highlight classes of
known metabolites. The GC-MS platforms may detect hundreds of metabolites, many of which are
also not identified.
Metabolomic analysis of medicinal plant samples yields a rich resource of information, and one that
is often ripe with surprises. To enable these data to be used by the community, the data are exported to
and accessible through MPMR. Metadata describing the plant material, extraction, separation and
analytical techniques are added. Various features are incorporated into MPMR to facilitate data
exploration. An interactive comparison of the replicates of each organ analyzed, using scatterplots
representing pairwise comparisons of replicates combined with Spearman correlations and bar graphs,
enables the user to quickly assess the general quality of the data (Figure 1). MPMR can be searched by
key words and molecular masses, and the data can be sorted in a variety of ways. Linked plots and
tables enable the user to track the data from various vantage points. Three case studies of how MPMR
can be used to inform a researcher are presented.
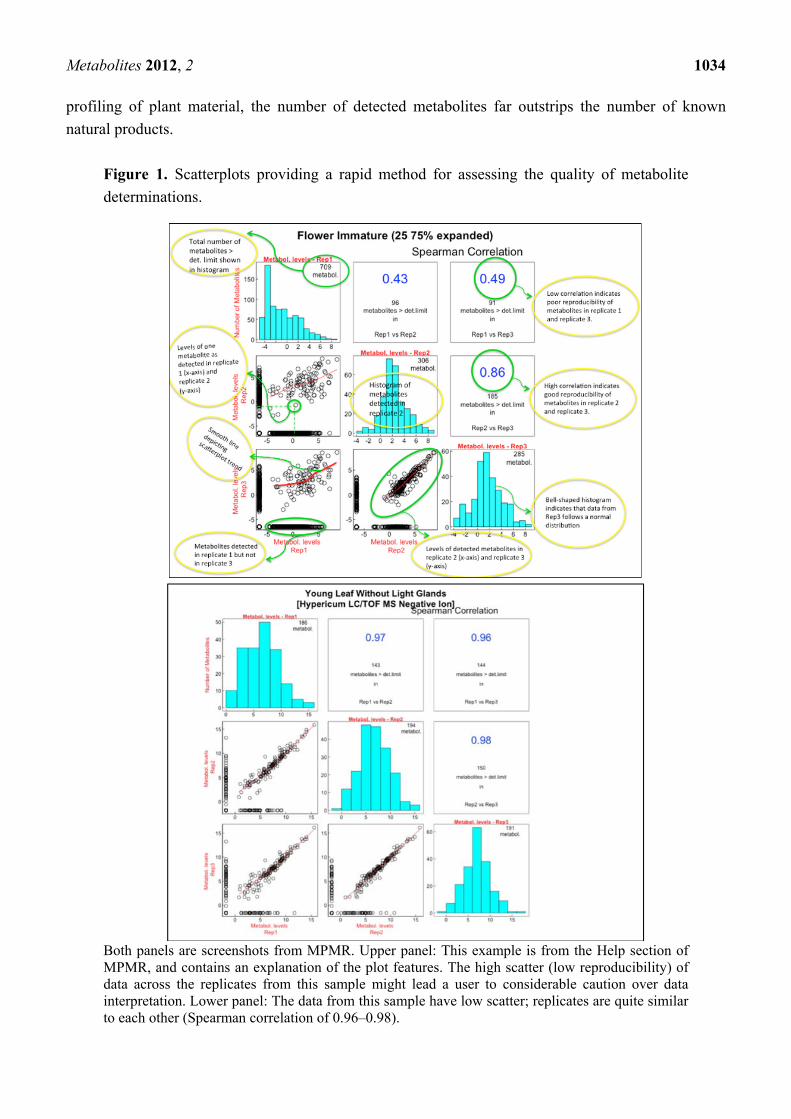
2.1. Case Study: Deep Metabolic Profiling of Camptotheca acuminata as an Approach for
Development of Hypotheses about the Camptothecin Biosynthesis Network
LC/TOF-MS analyses of C. acuminata Decne. (Cornaceae) (Chinese happy tree, source of the
anticancer compound camptothecin) revealed more than 50 abundant peaks, with more than 1900
additional signals extracted into the metabolite database. Camptothecin is a quinoline alkaloid derived
from an indole terpene alkaloid biosynthetic pathway [19]. The early steps in camptothecin
biosynthesis involve formation of terpenoid precursors (through 10-hydroxygeraniol) and tryptamine,
and these pathways must converge to form more complex intermediates (Figure 2). However, evidence
for intermediate steps in the pathway has remained elusive, with several putative intermediates missing
from the most extensive literature report of C. acuminata metabolite profiles [20].
Figure 2. Proposed steps in the intermediate and late stages of camptothecin biosynthesis.
camptothecin
N
N
O
O
OOH
NH
NH
O
H3COOC
OGlcH
strictosidine
NH
N
H
O
O
OGlcstrictosamide
NH
N
O
O
O
OGlc
H
H
N
N
O
O
OGlc
HH
H
3(S)-deoxy-pumiloside 3(S)-pumiloside
OH3COOC
HOGlc
HO
NH
N
H
O
O
OGlc
O
O
H
NH
N
O
O
O
OGlc
HOH
H
H
secologanin
NH
NH2
tryptamine
+
Metabolites 2012, 2 1036
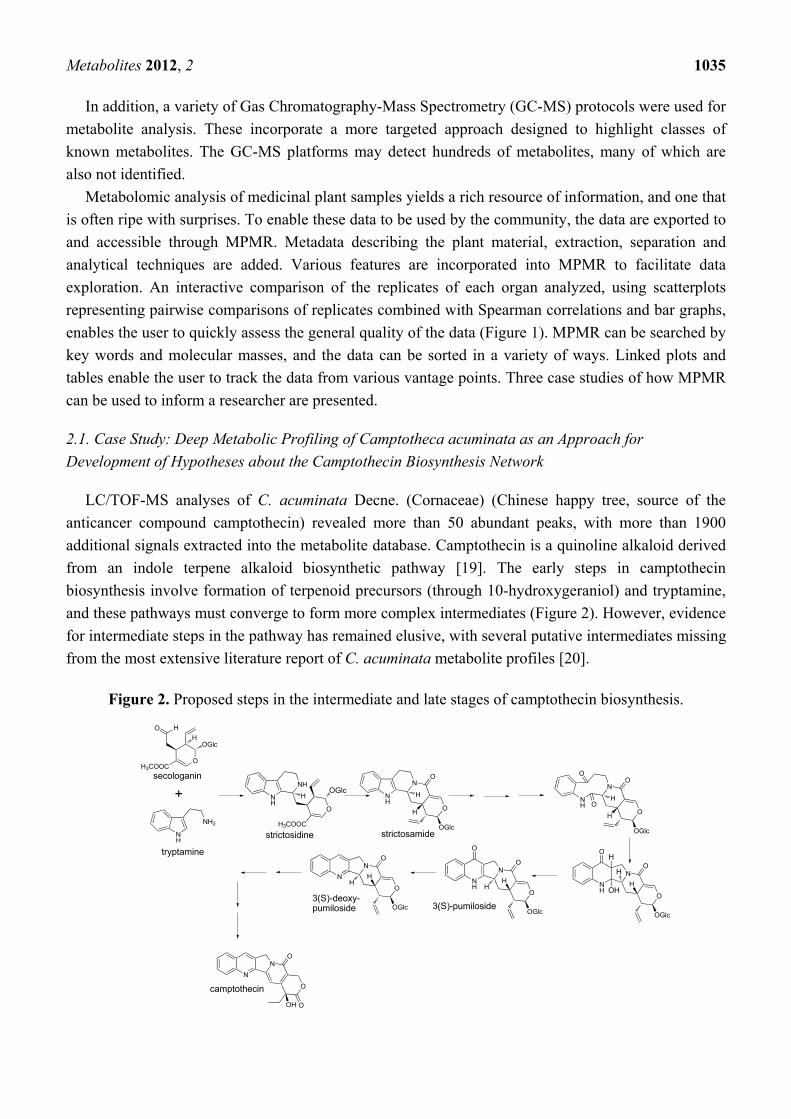
The complexity of the C. acuminata metabolome is reflected in Figure 3, which displays an
LC/TOF-MS chromatogram of a bark extract. One of the more interesting realizations derived from
these data is that several key intermediates were present as mixtures of isomers, and in many cases,
abundances of fragment ions were not sufficient to distinguish these isomers. In the latter stages of the
pathway, pairs of isomers were detected for strictosamide, pumiloside, deoxypumiloside, and other
metabolites including a putative ketolactam. The isomeric metabolites have yet to be purified for
complete structure elucidation, but one possibility is that they are stereoisomers with different
configurations at the 3-position. The similarity in the ratios of isomers indicates that enzymes that
catalyze these transformations may not exhibit much stereoselectivity in substrates.
Figure 3. UHPLC/TOF-MS profile of metabolites extracted from C. acuminata bark.
Chromatographic peaks are annotated with retention times and the mass of the most abundant ion in the corresponding mass spectrum. Multiple isomers were observed for secologanin, deoxypumiloside, pumiloside, and several other metabolites upstream of camptothecin.
A rapid way to compare the difference between two datasets is a volcano plot, and we have found
this approach to be very useful for visualizing metabolomics datasets and quickly identifying
metabolites that are significantly altered between the two datasets (Figure 4). In these plots, the ratio of
the abundance of each analyzed metabolite is calculated between two samples; this ratio is plotted on
the x-axis. The metabolomics data are analyzed statistically using a t-test, and each metabolite is
placed according to its P-value on the y-axis. Figure 4 represents metabolite abundances in young bark
versus immature leaves (25-75% expanded). This plot indicates that a subset of alkaloids, and all of the
detected alkaloid glycosides, are more abundant in young bark; however, several isomers of
camptothecin are more predominant in young leaves. The plot also provides an indication of the
statistical significance of the difference in abundance for each metabolite.

Metabolites 2012, 2 1037
Figure 4. Volcano plots illustrating the difference in metabolite levels between bark and
partially expanded young leaves, as shown in a screenshot from MPMR.
The ratio of the abundance of each metabolite is calculated between two samples and plotted on the x-axis. Each symbol represents a different metabolite. The data were analyzed statistically within MPMR. Each metabolite is located according to its P-value on the y-axis. Metabolites in the pink shaded area are considered differentially accumulated according to their adjusted P-value, between the two samples. If the user mouses over a metabolite, additional information about that compound is shown (white inset box).
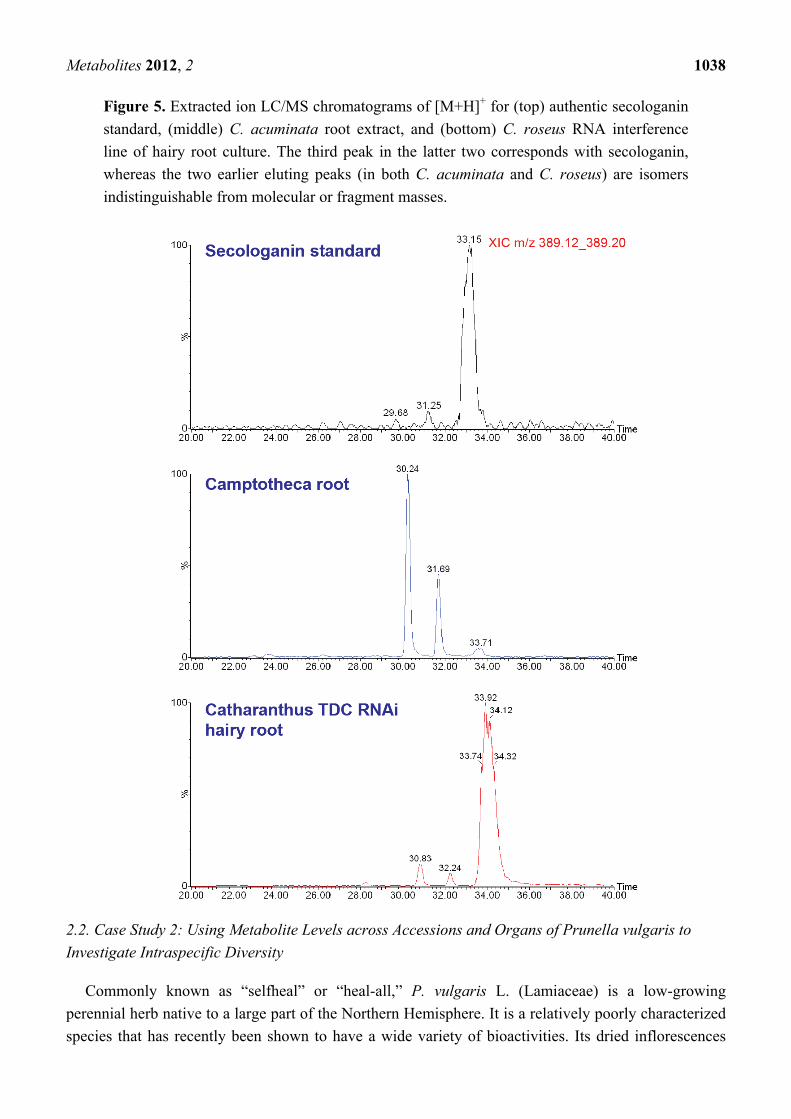
Additional review of the Camptotheca metabolome reveals several more surprises. First, the
proposed terpenoid intermediate secologanin [21,22] is barely detectable in any of the C. acuminata
organs and tissues that we analyzed. This led us to conduct a follow-up analysis of several plant
extracts, by using a slower UHPLC solvent gradient and a longer chromatographic column to better
resolve isomeric metabolites (Figure 5). Extracted ion chromatograms for the [M+H]+ ion of
secologanin contain two peaks corresponding to secologanin isomers with retention times that are
distinct from an authentic secologanin standard and from the major secologanin isomer in an extract of
Catharanthus roseus.
Metabolites 2012, 2 1038
Figure 5. Extracted ion LC/MS chromatograms of [M+H]+ for (top) authentic secologanin
standard, (middle) C. acuminata root extract, and (bottom) C. roseus RNA interference
line of hairy root culture. The third peak in the latter two corresponds with secologanin,
whereas the two earlier eluting peaks (in both C. acuminata and C. roseus) are isomers
indistinguishable from molecular or fragment masses.
2.2. Case Study 2: Using Metabolite Levels across Accessions and Organs of Prunella vulgaris to
Investigate Intraspecific Diversity
Commonly known as “selfheal” or “heal-all,” P. vulgaris L. (Lamiaceae) is a low-growing
perennial herb native to a large part of the Northern Hemisphere. It is a relatively poorly characterized
species that has recently been shown to have a wide variety of bioactivities. Its dried inflorescences
Metabolites 2012, 2 1039
have a long history of use in traditional Asian and European medicine [23-26] as a remedy for cancer,
sore throat, fever, and wounds. Recent data indicate that this species has potential to become an
economically important medicinal herb through the wide scope of biological activities associated with
P. vulgaris extracts [27-34]. Diverse bioactive compounds have been characterized from these
extracts. Aqueous extracts display antioxidant, antiviral, tumoricidal and anti-inflammatory properties
and are known to contain polyphenols and complex carbohydrates. P. vulgaris polysaccharides have
exhibited antiviral, immunomodulatory and anti-tumorigenic activity [28,34-39], whereas phenolic
constituents, such as rosmarinic acid, have antioxidant as well as immunomodulatory activity [33,40-
42]. Ethanolic extracts contain triterpenes and flavonoids [33,43,44], and several such compounds and
extracts have significant anti-inflammatory activity [45,46].
Because P. vulgaris has recently been shown to have a wide variety of bioactivities, but little
research characterizes biochemical aspects of this species, the goal of this study was to provide
information on metabolites across different accessions and developmental stages. These data would
provide a potential basis for standardization for this species, and would enable a researcher to gain a
quick understanding of what material they might want to employ in bioactivity assays or use to
investigate the metabolic reactions and networks that lead to the specialized components. We also use
the data to compare each accession by its metabolomic “fingerprint” and provide further understanding
of their provenances.
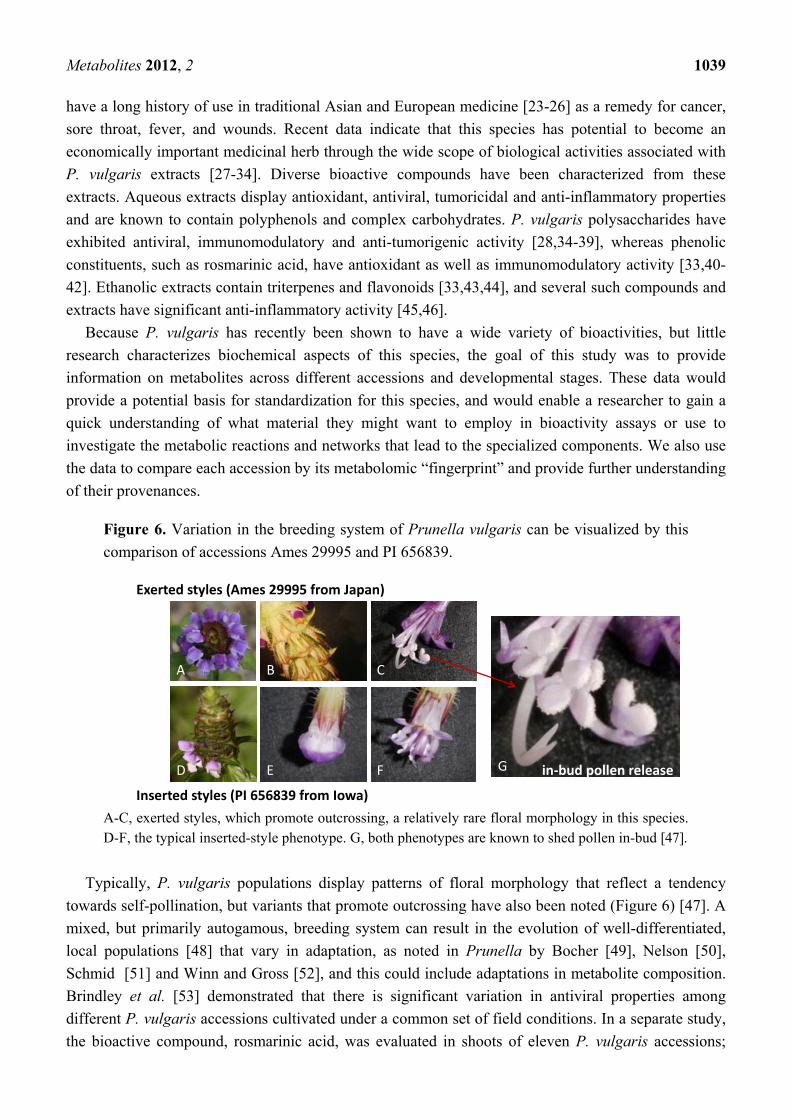
Figure 6. Variation in the breeding system of Prunella vulgaris can be visualized by this
comparison of accessions Ames 29995 and PI 656839.
A-C, exerted styles, which promote outcrossing, a relatively rare floral morphology in this species. D-F, the typical inserted-style phenotype. G, both phenotypes are known to shed pollen in-bud [47].
Typically, P. vulgaris populations display patterns of floral morphology that reflect a tendency
towards self-pollination, but variants that promote outcrossing have also been noted (Figure 6) [47]. A
mixed, but primarily autogamous, breeding system can result in the evolution of well-differentiated,
local populations [48] that vary in adaptation, as noted in Prunella by Bocher [49], Nelson [50],
Schmid [51] and Winn and Gross [52], and this could include adaptations in metabolite composition.
Brindley et al. [53] demonstrated that there is significant variation in antiviral properties among
different P. vulgaris accessions cultivated under a common set of field conditions. In a separate study,
the bioactive compound, rosmarinic acid, was evaluated in shoots of eleven P. vulgaris accessions;
A B C
D E F
Inserted styles (PI 656839 from Iowa)
Exerted styles (Ames 29995 from Japan)
in‐bud pollen release G
Metabolites 2012, 2 1040
these shoots were shown to differ by over 10-fold in concentrations of rosmarinic acid (Berhow et al.,
personal communication). These results indicate that there is likely a substantial genetic variation
among P. vulgaris populations, at least for metabolites that would be likely to confer differences in
bioactivity and pharmacological efficacy. Season of harvest can also influence metabolite composition,
as evidenced by Chen et al. [54], who documented seasonal changes in rosmarinic, ursolic, and
oleanolic acid concentrations in dried Prunella inflorescences.
With the increasing emergence of information about the properties of this species in the last decade,
P. vulgaris was incorporated into the medicinal plant germplasm collection conserved by the USDA-
ARS North Central Regional Plant Introduction Station (NCRPIS, Ames, IA) and from 2007 to 2011
was one of three medicinal-plant genera being studied in Iowa by the Center for Research on Botanical
Dietary Supplements[55]. Currently, the NCRPIS conserves 48 Prunella accessions from both Old and
New World origins (USDA-ARS GRIN[56]).
Five Prunella vulgaris accessions were chosen for metabolite fingerprinting analysis, based on
diverse locations from which they were sourced (Table 1). Four of these accessions were originally
sourced as wild populations from four different locations in North America, and one was collected
from a site in Eastern Europe (South Ossetia, Georgia). Seeds collected from these populations were
germinated and planted at the USDA North Central Regional Plant Introduction Station, Ames, IA.
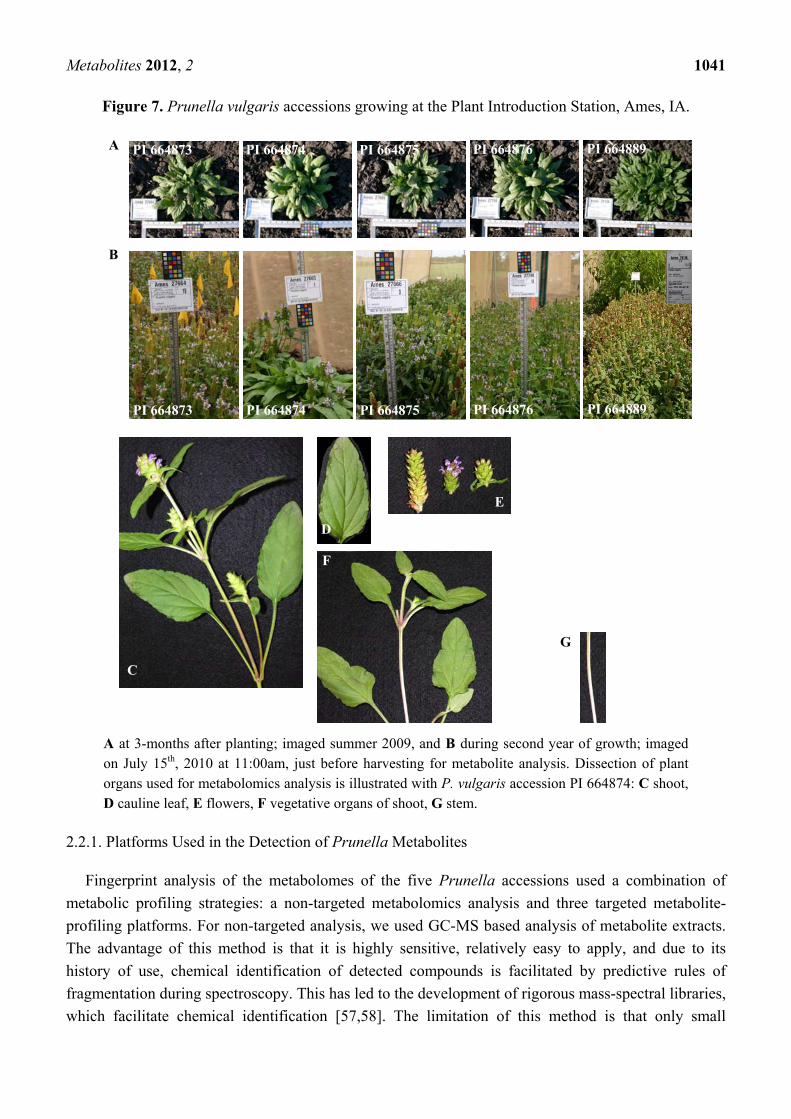
Figure 7 shows the appearance of these plants during the first two years of growth. By approximately
3-months after planting, the Georgia accession (PI 664889) showed a clearly distinguishable
morphological difference from the North American accessions; the former plants presenting a denser
appearance. The majority of the plants did not flower during the first year of growth. However, in the
second growth season, these plants flowered, and we collected intact aerial organs as illustrated in
Figure 7. The organs that were subjected to metabolomics analyses were: shoots, cauline leaves,
flowers, vegetative organs of shoots, and stems; metadata on these samples are provided at the MPMR
database.
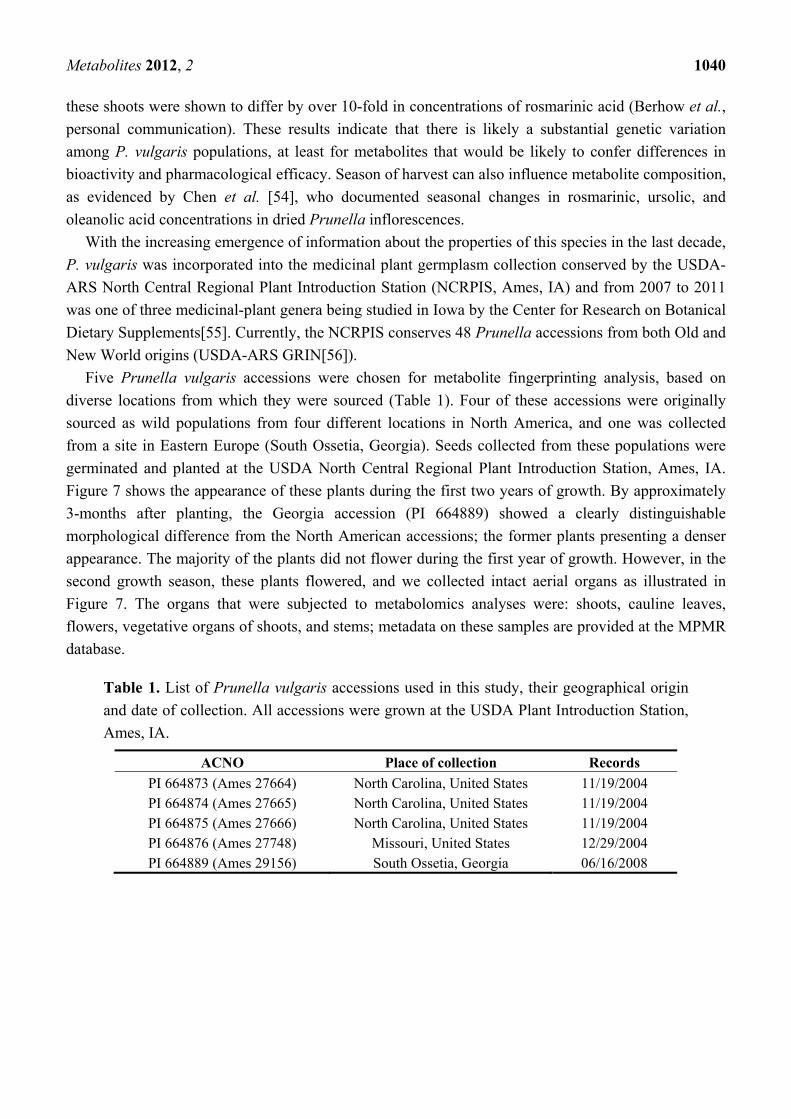
Table 1. List of Prunella vulgaris accessions used in this study, their geographical origin
and date of collection. All accessions were grown at the USDA Plant Introduction Station,
Ames, IA.
ACNO Place of collection Records
PI 664873 (Ames 27664) North Carolina, United States 11/19/2004 PI 664874 (Ames 27665) North Carolina, United States 11/19/2004 PI 664875 (Ames 27666) North Carolina, United States 11/19/2004 PI 664876 (Ames 27748) Missouri, United States 12/29/2004 PI 664889 (Ames 29156) South Ossetia, Georgia 06/16/2008
Metabolites 2012, 2 1041
Figure 7. Prunella vulgaris accessions growing at the Plant Introduction Station, Ames, IA.
A at 3-months after planting; imaged summer 2009, and B during second year of growth; imaged on July 15th, 2010 at 11:00am, just before harvesting for metabolite analysis. Dissection of plant organs used for metabolomics analysis is illustrated with P. vulgaris accession PI 664874: C shoot, D cauline leaf, E flowers, F vegetative organs of shoot, G stem.
2.2.1. Platforms Used in the Detection of Prunella Metabolites
Fingerprint analysis of the metabolomes of the five Prunella accessions used a combination of
metabolic profiling strategies: a non-targeted metabolomics analysis and three targeted metabolite-
profiling platforms. For non-targeted analysis, we used GC-MS based analysis of metabolite extracts.
The advantage of this method is that it is highly sensitive, relatively easy to apply, and due to its
history of use, chemical identification of detected compounds is facilitated by predictive rules of
fragmentation during spectroscopy. This has led to the development of rigorous mass-spectral libraries,
which facilitate chemical identification [57,58]. The limitation of this method is that only small
PI 664873 PI 664874 PI 664875 PI 664876 PI 664889 A
B
C
D
E
F
G
PI 664873 PI 664874 PI 664875 PI 664876 PI 664889
Metabolites 2012, 2 1042
compounds, of less than about 1000 Da, can be analyzed, and chemical derivatization is needed to
facilitate the volatilization of compounds into the gas-phase.
The three targeted metabolite-profiling platforms that had previously been used in analyzing the
metabolomes of Arabidopsis were used in these analyses, and they revealed the relative abundance of
21 amino acids, 119 surface lipids, and 83 fatty acids, and the non-targeted metabolomics platform
detected 222 metabolites (metadata via the extraction protocols and the identification of these
metabolites are provided in the MPMR database). This approach of combining different analytical
platforms enabled us to evaluate the relative abundance of nearly 450 Prunella metabolites. The
rationale for combining non-targeted and targeted metabolite analysis is complex, and is aimed at
maximizing the researcher’s ability to analytically access the “entire” metabolome of the samples,
while also accurately annotating the chemical identities of many detected metabolites. We have
chemically identified about 1/3 of the 450 Prunella metabolites that were detected, and most of these
were detected in the targeted metabolite analysis platforms. Although network topologies can be best
determined once chemical identities of metabolites are ascertained, all data can be used as a fingerprint
to evaluate differences and similarities among the samples.
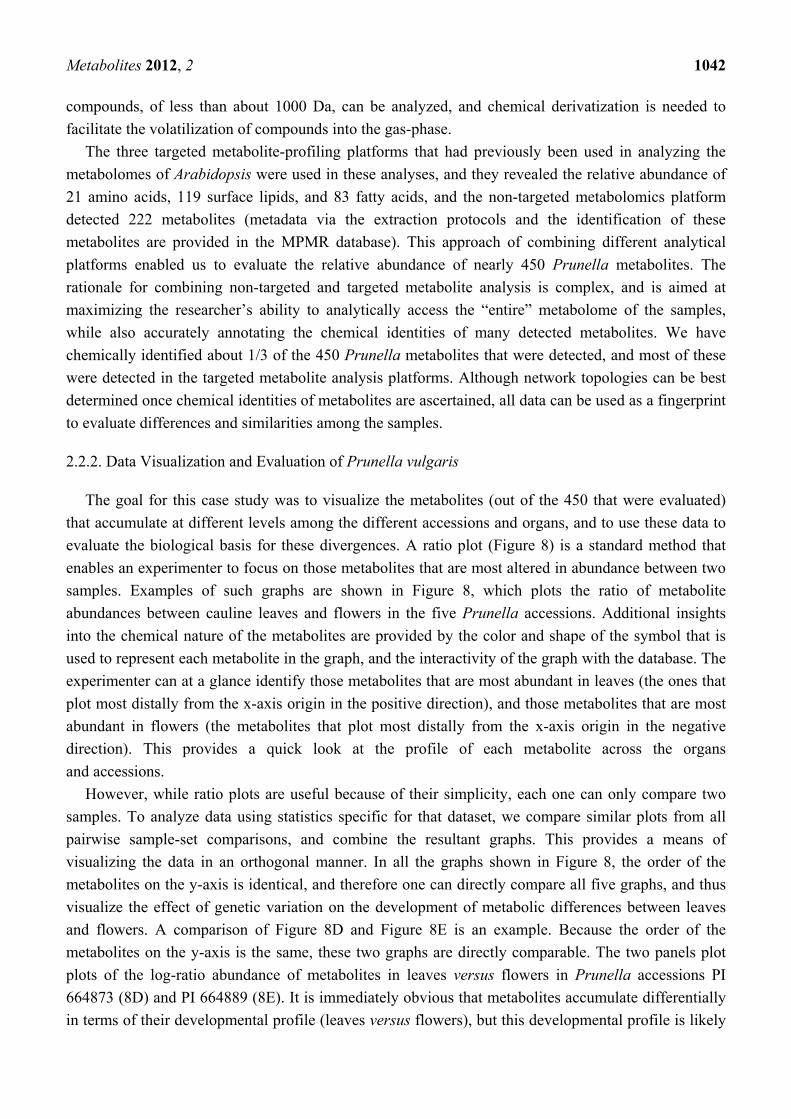
2.2.2. Data Visualization and Evaluation of Prunella vulgaris
The goal for this case study was to visualize the metabolites (out of the 450 that were evaluated)
that accumulate at different levels among the different accessions and organs, and to use these data to
evaluate the biological basis for these divergences. A ratio plot (Figure 8) is a standard method that
enables an experimenter to focus on those metabolites that are most altered in abundance between two
samples. Examples of such graphs are shown in Figure 8, which plots the ratio of metabolite
abundances between cauline leaves and flowers in the five Prunella accessions. Additional insights
into the chemical nature of the metabolites are provided by the color and shape of the symbol that is
used to represent each metabolite in the graph, and the interactivity of the graph with the database. The
experimenter can at a glance identify those metabolites that are most abundant in leaves (the ones that
plot most distally from the x-axis origin in the positive direction), and those metabolites that are most
abundant in flowers (the metabolites that plot most distally from the x-axis origin in the negative
direction). This provides a quick look at the profile of each metabolite across the organs
and accessions.
However, while ratio plots are useful because of their simplicity, each one can only compare two
samples. To analyze data using statistics specific for that dataset, we compare similar plots from all
pairwise sample-set comparisons, and combine the resultant graphs. This provides a means of
visualizing the data in an orthogonal manner. In all the graphs shown in Figure 8, the order of the
metabolites on the y-axis is identical, and therefore one can directly compare all five graphs, and thus
visualize the effect of genetic variation on the development of metabolic differences between leaves
and flowers. A comparison of Figure 8D and Figure 8E is an example. Because the order of the
metabolites on the y-axis is the same, these two graphs are directly comparable. The two panels plot
plots of the log-ratio abundance of metabolites in leaves versus flowers in Prunella accessions PI
664873 (8D) and PI 664889 (8E). It is immediately obvious that metabolites accumulate differentially
in terms of their developmental profile (leaves versus flowers), but this developmental profile is likely
Metabolites 2012, 2 1043
affected by the genetic diversity that is inherent in the two different accessions that are being
compared.
Figure 8. Differential accumulation of 340 metabolites between leaves and flowers among
five different Prunella accessions.
Figure 9 illustrates an approach to visually compare accessions based on relative metabolite
abundances, and use these data as fingerprints to distinguish the metabolic differences among the five
Prunella accessions. The ten graphs in this figure plot the relative abundance of all the detected
metabolites in all organs assayed by using the abundance of the metabolites in each accession as the
denominator in the calculation of the log-ratio values. In these graphs, the order of the metabolites is
identical, and therefore the pattern of the graphs is directly comparable. Therefore, the metabolic
relationship among the five accessions becomes a problem of pattern recognition – namely which two
patterns are most similar or most different from the other. We used a combination of pattern-
recognition algorithms and statistical evaluations to address this question.
‐7 0 7 ‐7 0 7 ‐7 0 7 ‐7 0 7 ‐7 0 7
A B C D E
A OS S
The coordinate on the x-axis of each graph plots the log(base 2)-ratio of the abundance of individual metabolites in leaves versus flowers. The order of the metabolites on the y-axis is identical in all five graphs. The five Prunella accessions are: PI 664873 A, PI 664874 B, PI 664875 C, PI 664876 D, and PI 664889 E. The 340 metabolites are categorized as: amino acids ( ), fatty acids ( ), organic acids ( ), phenolics ( ), sugars ( ), sugar acids ( ), sterols and triterpene ( ), and chemically unidentified ( ).
Metabolites 2012, 2 1044
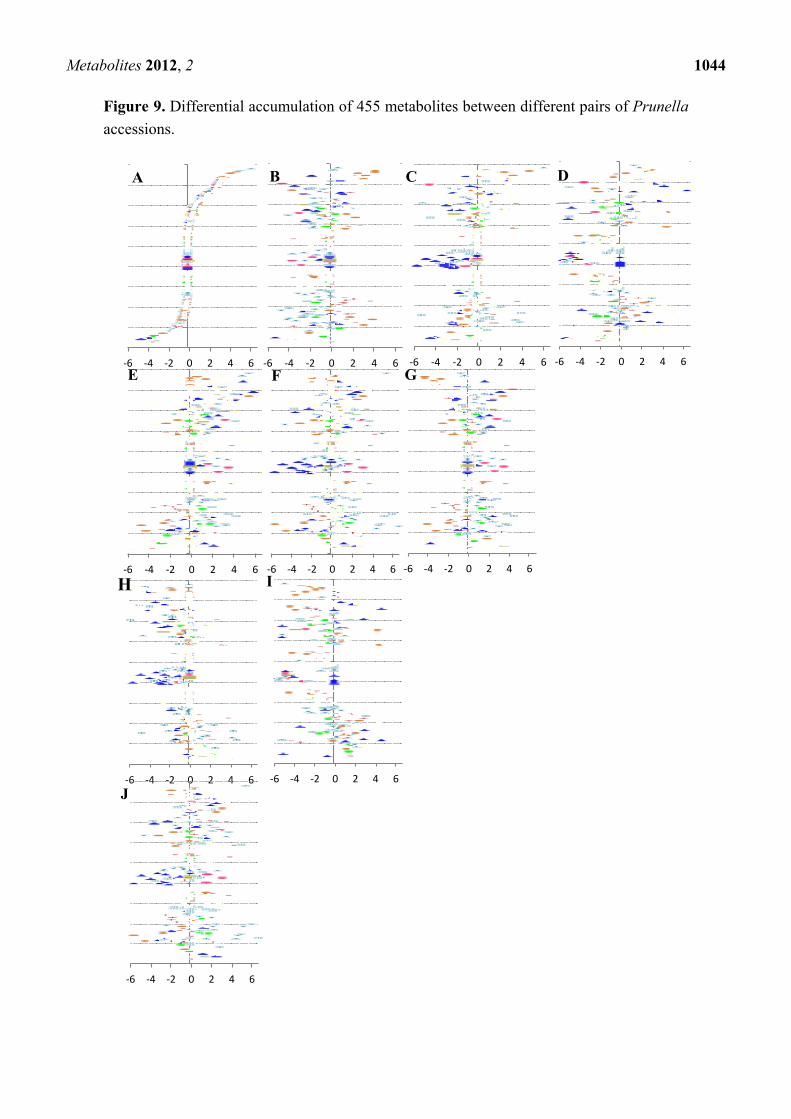
Figure 9. Differential accumulation of 455 metabolites between different pairs of Prunella
accessions.
‐6 ‐4 ‐2 0 2 4 6 ‐6 ‐4 ‐2 0 2 4 6 ‐6 ‐4 ‐2 0 2 4 6 ‐6 ‐4 ‐2 0 2 4 6
‐6 ‐4 ‐2 0 2 4 6
‐6 ‐4 ‐2 0 2 4 6 ‐6 ‐4 ‐2 0 2 4 6
‐6 ‐4 ‐2 0 2 4 6 ‐6 ‐4 ‐2 0 2 4 6
‐6 ‐4 ‐2 0 2 4 6
A B C D
E F G
H I
J
Metabolites 2012, 2 1045
2.2.3. Statistical analysis of the metabolomics data to evaluate systematic relationships among
Prunella accessions.
An approach to evaluate the metabolic profiling data is to integrate the relative abundance of all or a
subset of the evaluated analytes, and calculate statistical distances among the biological samples (i.e.,
the five Prunella accessions). Although there are many choices of statistical distance measures,
weighted Manhattan distance measure (Dij) is convenient, and has proven useful in analyzing
metabolomics data [59-61]. The weighted Manhattan distance measure computes the dissimilarity
between a pair of samples via the equation: Dij = 1k [|Yki - Ykj|/√[(Yki)
2 + (Ykj)2]/K
where: Dij is the weighted Manhattan distance between sample I and J; Yki is the abundance of
metabolite k in sample I, and Ykj is abundance of metabolite k in sample J; K is the total number of
metabolites. The term √[(Yki)2 + (Ykj)
2] estimates the standard deviation of the difference in
abundance.
One property of this distance measure is its invariance to multiplicative rescaling of metabolite
abundance data, which means the contribution of any metabolite to the value of Dij is the same no
matter what the datum point determines (i.e., a peak area, a relative abundance, or an absolute
concentration), as long as each of these quantities can be converted into another by multiplying by a
constant factor. Moreover, each metabolite data point contributes equally to the calculation of the
value of Dij irrespective of the magnitude of its abundance value. The statistical distance (Dij) between
each pair of distinct samples ranges between zero and 1.0. When the two samples express the identical
abundance for each metabolite the Dij = 0, and when the two samples have completely different
constituents, Dij = 1.0.
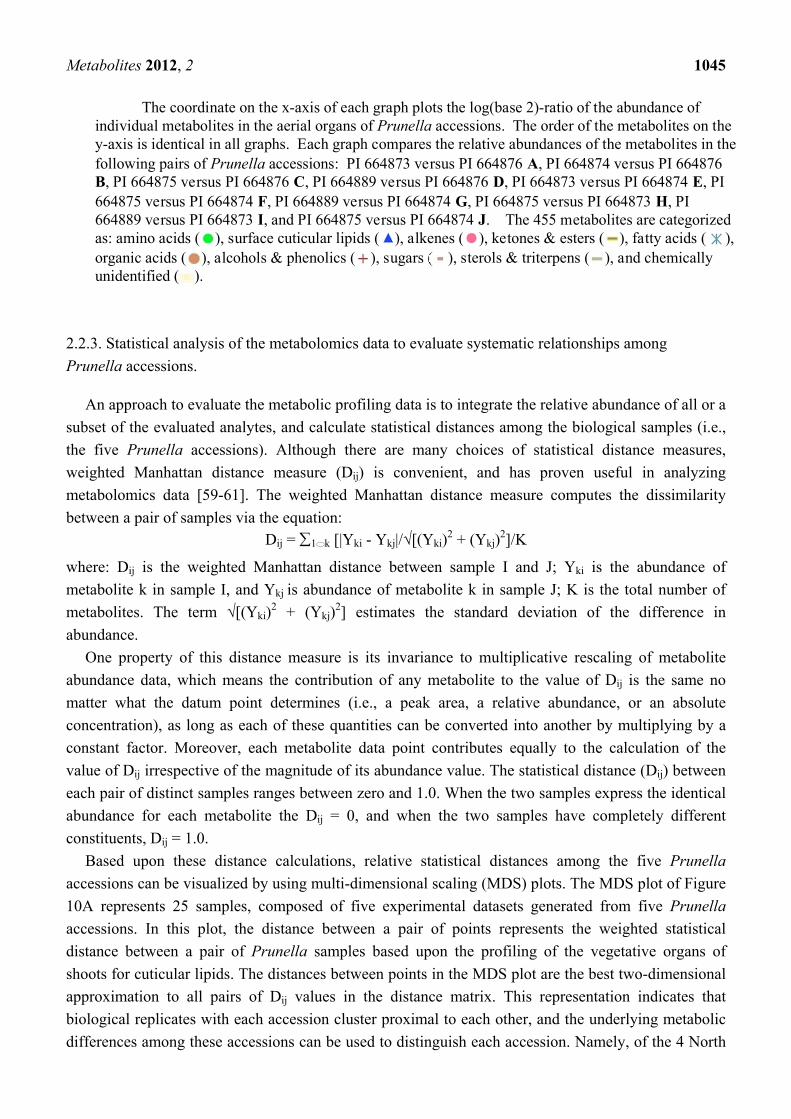
Based upon these distance calculations, relative statistical distances among the five Prunella
accessions can be visualized by using multi-dimensional scaling (MDS) plots. The MDS plot of Figure
10A represents 25 samples, composed of five experimental datasets generated from five Prunella
accessions. In this plot, the distance between a pair of points represents the weighted statistical
distance between a pair of Prunella samples based upon the profiling of the vegetative organs of
shoots for cuticular lipids. The distances between points in the MDS plot are the best two-dimensional
approximation to all pairs of Dij values in the distance matrix. This representation indicates that
biological replicates with each accession cluster proximal to each other, and the underlying metabolic
differences among these accessions can be used to distinguish each accession. Namely, of the 4 North
The coordinate on the x-axis of each graph plots the log(base 2)-ratio of the abundance of individual metabolites in the aerial organs of Prunella accessions. The order of the metabolites on the y-axis is identical in all graphs. Each graph compares the relative abundances of the metabolites in the following pairs of Prunella accessions: PI 664873 versus PI 664876 A, PI 664874 versus PI 664876 B, PI 664875 versus PI 664876 C, PI 664889 versus PI 664876 D, PI 664873 versus PI 664874 E, PI 664875 versus PI 664874 F, PI 664889 versus PI 664874 G, PI 664875 versus PI 664873 H, PI 664889 versus PI 664873 I, and PI 664875 versus PI 664874 J. The 455 metabolites are categorized as: amino acids ( ), surface cuticular lipids ( ), alkenes ( ), ketones & esters ( ), fatty acids ( ), organic acids ( ), alcohols & phenolics ( ), sugars ( ), sterols & triterpens ( ), and chemically unidentified ( ).
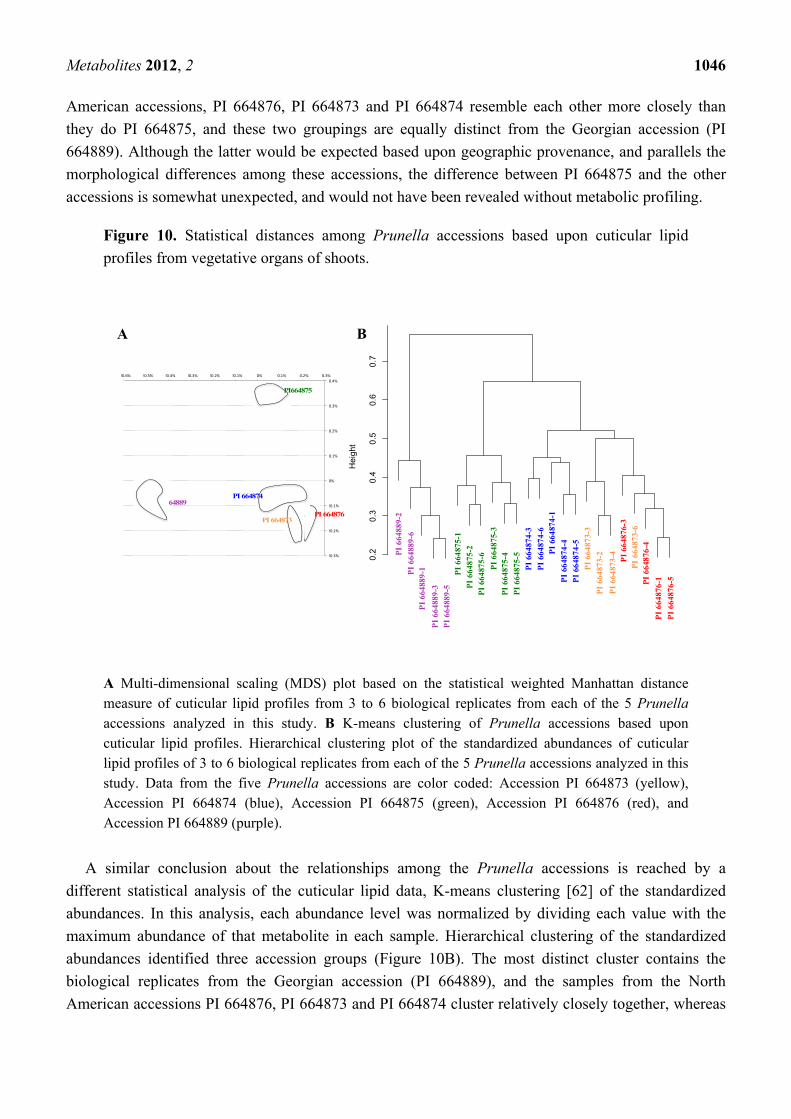
Metabolites 2012, 2 1046
American accessions, PI 664876, PI 664873 and PI 664874 resemble each other more closely than
they do PI 664875, and these two groupings are equally distinct from the Georgian accession (PI
664889). Although the latter would be expected based upon geographic provenance, and parallels the
morphological differences among these accessions, the difference between PI 664875 and the other
accessions is somewhat unexpected, and would not have been revealed without metabolic profiling.
Figure 10. Statistical distances among Prunella accessions based upon cuticular lipid
profiles from vegetative organs of shoots.
A Multi-dimensional scaling (MDS) plot based on the statistical weighted Manhattan distance measure of cuticular lipid profiles from 3 to 6 biological replicates from each of the 5 Prunella accessions analyzed in this study. B K-means clustering of Prunella accessions based upon cuticular lipid profiles. Hierarchical clustering plot of the standardized abundances of cuticular lipid profiles of 3 to 6 biological replicates from each of the 5 Prunella accessions analyzed in this study. Data from the five Prunella accessions are color coded: Accession PI 664873 (yellow), Accession PI 664874 (blue), Accession PI 664875 (green), Accession PI 664876 (red), and Accession PI 664889 (purple).
A similar conclusion about the relationships among the Prunella accessions is reached by a
different statistical analysis of the cuticular lipid data, K-means clustering [62] of the standardized
abundances. In this analysis, each abundance level was normalized by dividing each value with the
maximum abundance of that metabolite in each sample. Hierarchical clustering of the standardized
abundances identified three accession groups (Figure 10B). The most distinct cluster contains the
biological replicates from the Georgian accession (PI 664889), and the samples from the North
American accessions PI 664876, PI 664873 and PI 664874 cluster relatively closely together, whereas
A B) B
!0.3%
!0.2%
!0.1%
0%
0.1%
0.2%
0.3%
0.4%
!0.6% !0.5% !0.4% !0.3% !0.2% !0.1% 0% 0.1% 0.2% 0.3%
PI 664889
PI664875
PI 664874
PI 664873 PI 664876
1_2
1_6
1_1
1_3
1_5
5_1
5_2
5_6
5_3
5_4
5_5
4_3
4_6
4_1
4_4
4_5 3_
3
3_2
3_4
2_3
3_6
2_4
2_1
2_5
0.2
0.3
0.4
0.5
0.6
0.7
metabolite#22! 140
hclust (*, "average")distance
Hei
ght
PI
6648
89-1
PI
6648
89-2
PI
6648
89-5
PI
6648
75-2
PI
6648
75-4
PI
6648
75-5
PI
6648
75-6
PI
6648
75-1
PI
6648
74-1
PI
6648
74-4
PI
6648
74-5
PI
6648
74-3
PI
6648
74-6
PI
6648
73-3
PI
6648
73-2
PI
6648
73-4
P
I 66
4876
-3
PI
6648
76-1
PI
6648
76-4
PI
6648
76-5
PI
6648
89-6
PI
6648
89-3
PI
6648
75-3
PI
6648
73-6
Metabolites 2012, 2 1047
accession PI 664875 is placed equidistant from the other two groups, a conclusion much like that
reached from the MDS plot.
2.3. Case Study: Combined Metabolomics and Transcriptomics of Digitalis purpurea for Hypothesis
Development
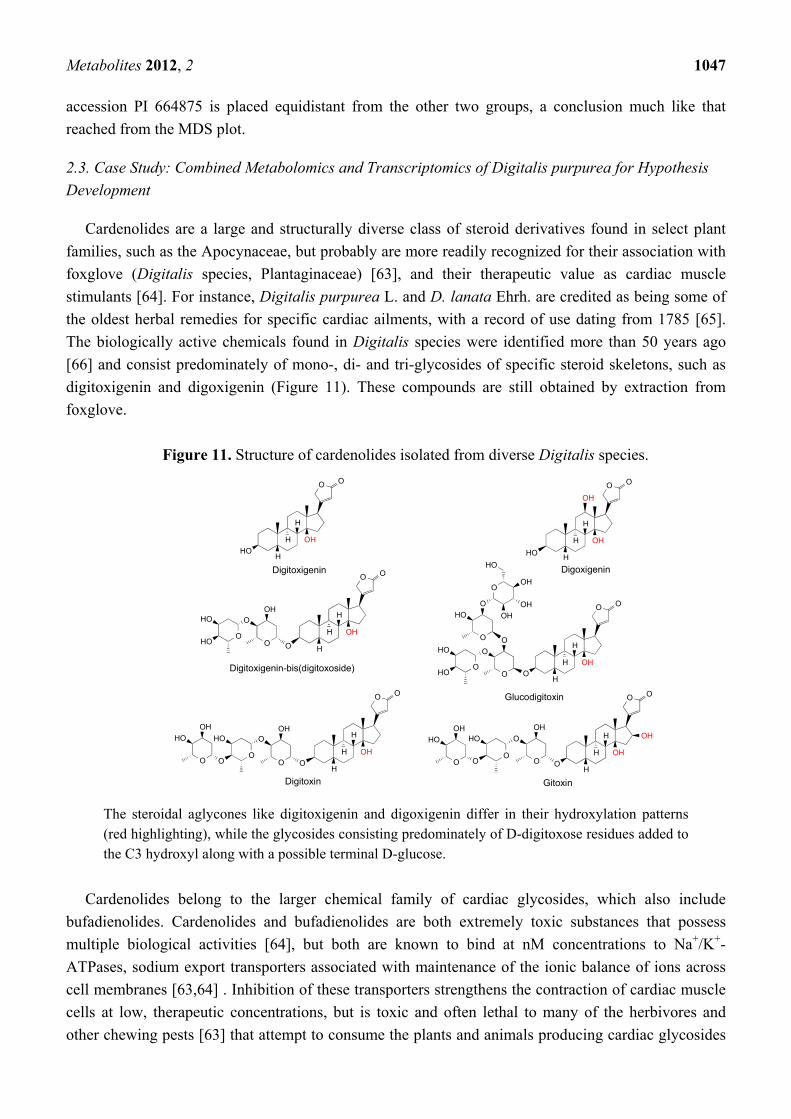
Cardenolides are a large and structurally diverse class of steroid derivatives found in select plant
families, such as the Apocynaceae, but probably are more readily recognized for their association with
foxglove (Digitalis species, Plantaginaceae) [63], and their therapeutic value as cardiac muscle
stimulants [64]. For instance, Digitalis purpurea L. and D. lanata Ehrh. are credited as being some of
the oldest herbal remedies for specific cardiac ailments, with a record of use dating from 1785 [65].
The biologically active chemicals found in Digitalis species were identified more than 50 years ago
[66] and consist predominately of mono-, di- and tri-glycosides of specific steroid skeletons, such as
digitoxigenin and digoxigenin (Figure 11). These compounds are still obtained by extraction from
foxglove.
Figure 11. Structure of cardenolides isolated from diverse Digitalis species.
The steroidal aglycones like digitoxigenin and digoxigenin differ in their hydroxylation patterns (red highlighting), while the glycosides consisting predominately of D-digitoxose residues added to the C3 hydroxyl along with a possible terminal D-glucose.
Cardenolides belong to the larger chemical family of cardiac glycosides, which also include
bufadienolides. Cardenolides and bufadienolides are both extremely toxic substances that possess
multiple biological activities [64], but both are known to bind at nM concentrations to Na+/K+-
ATPases, sodium export transporters associated with maintenance of the ionic balance of ions across
cell membranes [63,64] . Inhibition of these transporters strengthens the contraction of cardiac muscle
cells at low, therapeutic concentrations, but is toxic and often lethal to many of the herbivores and
other chewing pests [63] that attempt to consume the plants and animals producing cardiac glycosides
HO
H
H
OH
H
O O
Digitoxigenin
O
H
H
OH
H
O O
O
OOH
O
HO
HO
Digitoxigenin-bis(digitoxoside)
O
H
H
OH
H
O O
O
OOH
O
HO
OO
HO
OH
Digitoxin
HO
H
H
OH
H
O O
OH
Digoxigenin
O
H
H
OH
H
O O
O
O
OH
O
HO
OO
HO
OH
Gitoxin
OH
O
H
H
OH
H
O O
O
O
O
O
HO
HO
O
HO
O
O
HO
OH
OH
OH
Glucodigitoxin
Metabolites 2012, 2 1048
[67]. The major difference between these two classes of chemicals is that cardenolides contain a five-
membered lactone ring while the bufadienolides contain a six-membered lactone ring [64]. Equally
intriguing, cardenolides are found largely in plants, while the bufadienolides are associated with skin
glands of toxic toads [63]. As argued by Dobler et al. [63], given the structural similarities between the
cardenolides and bufadienolides, the development of the biosynthetic machinery for cardenolides in
plants and bufadienolides in amphibians may represent an example of convergent evolution.
The pharmaceutical availability of cardenolides has depended upon their natural sources because of
difficulties associated with their chemical syntheses [68]. Even more surprising is that the biosynthetic
pathways for these diverse cardenolides have not been completely worked out, and there are numerous
outstanding questions about their biosynthesis and accumulation. A better understanding of the
biosynthetic pathway(s) per se should be useful in modeling cardenolide accumulation, in the design of
molecular genetic screens to improve cardenolide end-product yield, and to develop plant lines
accumulating a greater diversity of cardenolide products that could be screened for new or enhanced
biological activities.
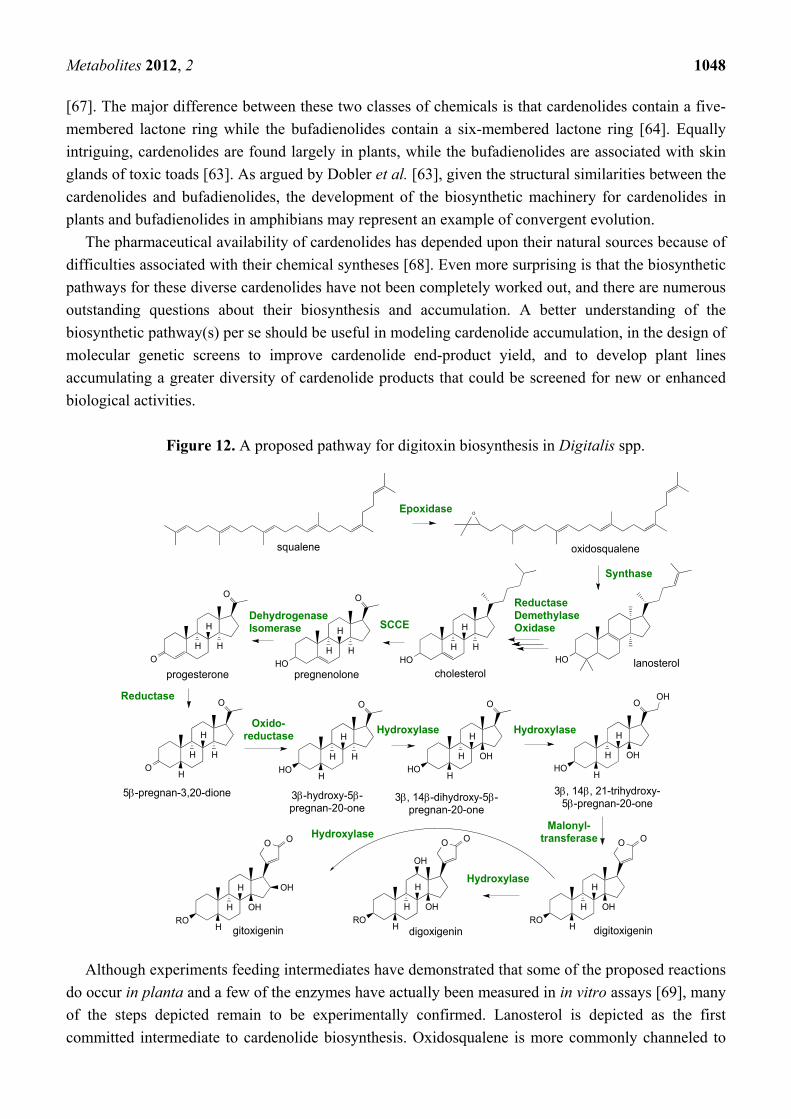
Figure 12. A proposed pathway for digitoxin biosynthesis in Digitalis spp.
Although experiments feeding intermediates have demonstrated that some of the proposed reactions
do occur in planta and a few of the enzymes have actually been measured in in vitro assays [69], many
of the steps depicted remain to be experimentally confirmed. Lanosterol is depicted as the first
committed intermediate to cardenolide biosynthesis. Oxidosqualene is more commonly channeled to
squalene
O
oxidosqualene
HOHO
H
H
H
HO
O
H
H
H
lanosterolcholesterolpregnenolone
O
O
H
H
H
O
O
H
H
H
5-pregnan-3,20-dione
H HO
O
H
H
H
HHO
O
H
H
OH
H
RO
H
H
OH
H
O O
RO
H
H
OH
H
O O
OH
RO
H
H
OH
H
O O
OH
progesterone
3-hydroxy-5-pregnan-20-one
3, 14-dihydroxy-5-pregnan-20-one
3, 14, 21-trihydroxy-5-pregnan-20-one
digitoxigenin
HO
O
H
H
OH
H
OH
digoxigeningitoxigenin
Epoxidase
Synthase
ReductaseDemethylaseOxidaseSCCE
DehydrogenaseIsomerase
Reductase
Oxido-reductase
Hydroxylase Hydroxylase
Hydroxylase
HydroxylaseMalonyl-
transferase
Metabolites 2012, 2 1049
cycloartenol, the well-established precursor to stigmasterol, sitosterol and campesterol, the dominant
sterols found in all plants, rather than to lanosterol. However, only lanosterol and not cycloartenol has
been demonstrated to be converted to cholesterol, and there is clear experimental precedent for the
conversion of cholesterol to the pregnane family of steroids in mammals [64]. Hence, most depictions
of the digitoxin biosynthetic pathway propose the lanosterol to cholesterol steps as intermediates, yet
there is scant experimental evidence for this. Furthermore, only a couple of the genes encoding for
enzymes in later steps of the pathway have been functionally characterized, such as that for the
progesterone 5-reductase [64].
A putative, but partial pathway for cardenolide biosynthesis is shown in Figure 12; it is based
largely on earlier precursor feeding studies and inferences taken from similar biochemical
transformations occurring in mammalian steroidal biosynthetic pathways [69]. The proposed pathway
also provides a means for directing attention to questions remaining to be resolved. For instance, are
the cardenolides derived from cholesterol or perhaps are they derived from other phytosterol
precursors, such as stigmasterol or sistosterol? While it has long been known that digitoxins
accumulate in leaves, it is not clear if the site of synthesis differs from the site of accumulation. Are
intermediates or end-products translocated between tissues? Once a biochemical pathway for
digitoxins has been worked out, another question is how might cardenolide biosynthesis be regulated
spatially and temporally relative to those pathways directing the sterol biosynthesis important for
membrane biogenesis? Are there separate pathways localized to distinct intracellular compartments, or
is there a central pipeline with bifurcation points where intermediates might be diverted to the
biosynthesis of one class of sterols versus another?
To address some of these questions, we developed metabolomics and transcriptomics resources for
Digitalis with the long-range aim of applying these tools to define and validate a cardenolide
biosynthetic pathway. Metabolite profiles assessed by high resolution LC/TOF-MS yielding
approximately 2000 different metabolites were recorded for each plant extract, with metabolite
validation from triplicate biological replications and duplicate technical replicates.
Figure 13 provides screen shots from MPMR of the metabolic profile for select metabolites in
various tissues of D. purpurea as a means for determining where cardenolides and putative
intermediates might be accumulating. Four of the metabolites known for their pharmacological
activities [63] were specifically monitored: digitoxigenin bis-digitoxoside; digitoxin; gitoxin; and
glucodigitoxin. Interestingly, while all 4 of these metabolites have been found in leaf extracts [66],
their distribution across diverse stages and organ types shows some striking differences. For instance,
while digitoxigenin bis-digitoxoside levels in leaves are significant, much higher levels are observed in
sepals and flowers (Figure 13A). In contrast, glucodigitoxin, another potent pharmacological
compound, appears to accumulate preferentially in leaves with virtually none in sepals and lesser
amounts in flowers (Figure 13B). Such an observation suggests that the glycotransferases specific for
elaborating the digitoxigenin bis-digitoxoside to glucodigitoxin are present and active in leaves, but
absent in sepals and only modestly in petals.

Metabolites 2012, 2 1050
Figure 13. Levels of select cardenolides and putative biosynthetic intermediates in various
tissues of Digitalis purpurea.
Metabolites were extracted from the indicated tissues, profiled by high resolution LC/TOF-MS and their relative abundance determined as described at http://metnetdb.org/mpmr_public/. A digitoxigenin bis-digitoxoside (m/z 652.422); B digitoxin (m/z 782.477); C gitoxin (m/z 789.469); D glucodigitoxin (m/z 944.536); E lanosterol-like (m/z 427.324); F cholesterol-like (m/z 387.199).
The D. purpurea metabolome was also screened for lanosterol-like and cholesterol-like metabolites
likely to be intermediates in the pathway, with the idea that if the digitoxigenin steroid skeleton were
synthesized in only one specific plant part, and then distributed throughout the plant for tissue-or
organ-specific elaboration, one might expect these metabolites to accumulate exclusively in the region
where their synthesis occurred. From the metabolite profiles (e.g., Figure 13E and F), this possibility
seems unlikely. Instead, the lanosterol-like metabolites appear to be present almost exclusively (Figure
13E) or, for the cholesterol-like metabolite, predominately (Figure 13F) in those plant parts where the
cardenolides accumulate. These results would argue that the enzymes for lanosterol biosynthesis and
the conversion of lanosterol to cholesterol should be present in all these tissues, and most abundant or
active in leaf and floral tissues.
We screened the D. purpurea transcriptome for candidates for genes encoding the enzymes
responsible for the biosynthesis of lanosterol and its conversion to cholesterol, and then examined the
relative abundance of each transcript in various organ types, as determined by a count of the number of
respective sequence reads found for each assembled contig [15] (Figure 14). The progesterone 5-
reductase contigs served as a technical control in this analysis, because only this gene and one other
relevant biosynthetic gene have been reported in the literature [70]. As illustrated in Figure 14, two
independent contigs for the progesterone 5-reductase were identified, each of which differ somewhat
from the progesterone 5-reductase gene previously characterized by Herl et al. [70]. The contigs
A B
C D
E F
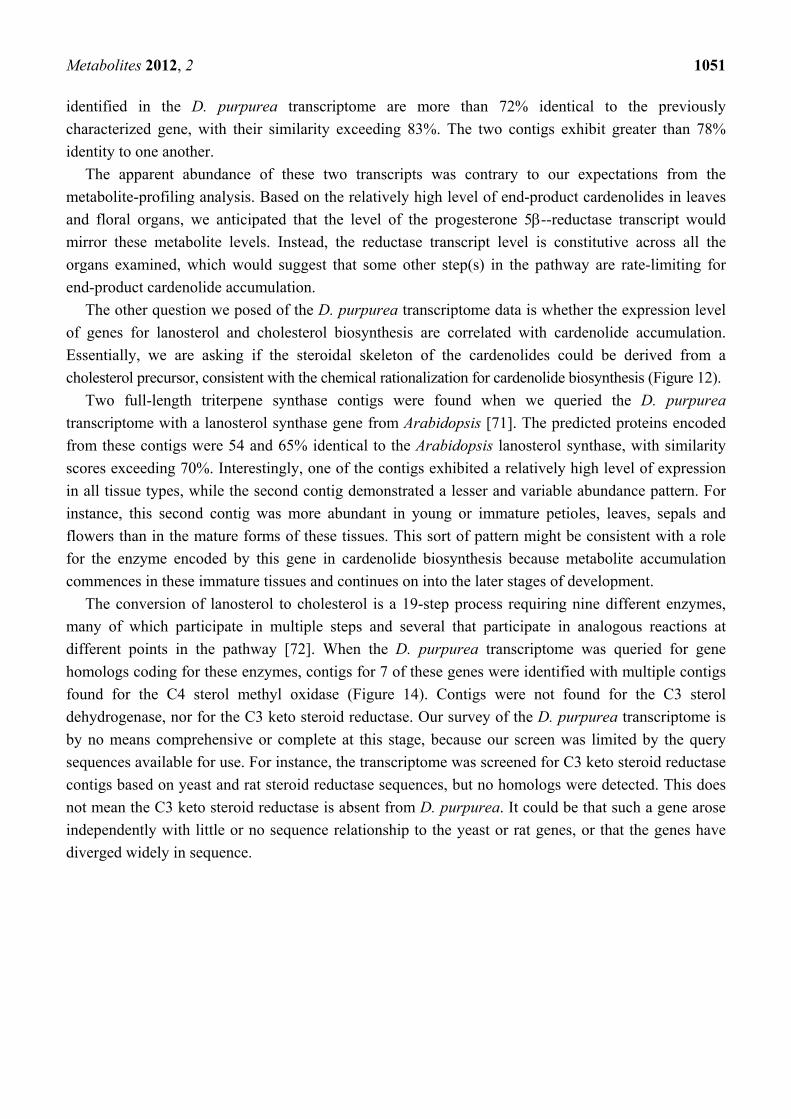
Metabolites 2012, 2 1051
identified in the D. purpurea transcriptome are more than 72% identical to the previously
characterized gene, with their similarity exceeding 83%. The two contigs exhibit greater than 78%
identity to one another.
The apparent abundance of these two transcripts was contrary to our expectations from the
metabolite-profiling analysis. Based on the relatively high level of end-product cardenolides in leaves
and floral organs, we anticipated that the level of the progesterone 5--reductase transcript would
mirror these metabolite levels. Instead, the reductase transcript level is constitutive across all the
organs examined, which would suggest that some other step(s) in the pathway are rate-limiting for
end-product cardenolide accumulation.
The other question we posed of the D. purpurea transcriptome data is whether the expression level
of genes for lanosterol and cholesterol biosynthesis are correlated with cardenolide accumulation.
Essentially, we are asking if the steroidal skeleton of the cardenolides could be derived from a
cholesterol precursor, consistent with the chemical rationalization for cardenolide biosynthesis (Figure 12).
Two full-length triterpene synthase contigs were found when we queried the D. purpurea
transcriptome with a lanosterol synthase gene from Arabidopsis [71]. The predicted proteins encoded
from these contigs were 54 and 65% identical to the Arabidopsis lanosterol synthase, with similarity
scores exceeding 70%. Interestingly, one of the contigs exhibited a relatively high level of expression
in all tissue types, while the second contig demonstrated a lesser and variable abundance pattern. For
instance, this second contig was more abundant in young or immature petioles, leaves, sepals and
flowers than in the mature forms of these tissues. This sort of pattern might be consistent with a role
for the enzyme encoded by this gene in cardenolide biosynthesis because metabolite accumulation
commences in these immature tissues and continues on into the later stages of development.
The conversion of lanosterol to cholesterol is a 19-step process requiring nine different enzymes,
many of which participate in multiple steps and several that participate in analogous reactions at
different points in the pathway [72]. When the D. purpurea transcriptome was queried for gene
homologs coding for these enzymes, contigs for 7 of these genes were identified with multiple contigs
found for the C4 sterol methyl oxidase (Figure 14). Contigs were not found for the C3 sterol
dehydrogenase, nor for the C3 keto steroid reductase. Our survey of the D. purpurea transcriptome is
by no means comprehensive or complete at this stage, because our screen was limited by the query
sequences available for use. For instance, the transcriptome was screened for C3 keto steroid reductase
contigs based on yeast and rat steroid reductase sequences, but no homologs were detected. This does
not mean the C3 keto steroid reductase is absent from D. purpurea. It could be that such a gene arose
independently with little or no sequence relationship to the yeast or rat genes, or that the genes have
diverged widely in sequence.
Metabolites 2012, 2 1052
Figure 14. The expression profile of contigs from D. purpurea with sequence similarity to
cardenolide metabolic enzymes.
The expression profiles are shown for contigs similar to lanosterol synthase (a triterpene synthase) and 7 of the 9 enzymes responsible for the conversion of lanosterol to cholesterol. The contigs similar to progesterone 5-reductase, a downstream enzyme in the cardenolide pathway that has been previously identified [70] are also shown. The contigs were identified by querying the D. purpurea transcriptome with sequences that had been previously identified in Arabidopsis, then using these contigs to determine their relative expression levels (fragments per 1,000 reads) from the D. purpurea expression matrix file downloadable from the MPGR website [15]. For triterpene synthase, C4 sterol methyloxidase, and progesterone 5-reductase, multiple full-length contigs were identified (the number of contigs is noted on figure). The D. purpurea contigs identified as homologs to the Arabidopsis counterpart: lanosterol synthase contig #s 2601 and 10,849; sterol 14 -demthylase contig # 53,096; ∆14 sterol reductase contig # 483; sterol 4 -methyloxidase contig # 10,035; C4 sterol methyl oxidase contig #s 7,765, 213, 3,227; C8,7 sterol isomerase contig # 2,000; ∆24 sterol reductase contig # 14,785; C7 dehydrocholesterol reductase contig # 361; progesterone 5-reductase contig #s 14,174 and 17,397.
0
100
200
300
0
100
200
300
400
0
50
100
150
200
250
0
25
50
75
100
root
youn
g pe
tiole
imm
atur
e pe
tiole
mat
ure
petio
le
youn
g lea
f
imm
atur
e lea
f
mat
ure
leaf
imm
atur
e se
pal
mat
ure
sepa
l
youn
g flo
wer
imm
atur
e flo
wer
mat
ure
flower
0
200
400
600
800
Triterpene cyclase (2)
C8,7 sterol isomerase ∆24 sterol reductase C7-dehydrocholesterol
reductase
Fra
gmen
ts p
er 1
,000
rea
ds
Sterol 14-demethylase ∆14-sterol reductase Sterol 4-methyloxidase
Progesterone 5-reductase (2)
C4 sterol methyloxidase (3)
Metabolites 2012, 2 1053
The transcript abundance profiles for these D. purpurea contigs were quite variable (Figure 14), and
it is difficult to discern the extent to which any of the transcript profiles exhibited a pattern correlating
with the accumulation patterns for the lanosterol or cholesterol-like metabolites (Figure 13). If
anything, the transcript profiles would suggest that D. purpurea is likely to have the enzymological
capacity for the conversion of lanosterol to cholesterol in many organs; ascertaining whether any of
these enzymes are limiting or regulatory for cardenolide biosynthesis must await more detailed studies
including measurement of the respective enzyme activities in each of these organ types.
In summary, the combined analyses of these metabolomics and transcriptomics data have provided
new insights into the biosynthetic pathways operating in D. purpurea and yielded testable hypotheses
about the role of specific enzymes and genes in cardenolide metabolism. As such, this effort has
helped to lay a foundation for the further enhancement of this plant species as a production platform
for this important class of pharmaceuticals and the potential for its development as a source for new
chemical entities addressing these and other medicinal needs.
3. Experimental Section
The metabolomes and transcriptomes of medicinal plant species were derived from analysis of up to
20 different plant materials/treatments including major organ types and three developmental stages
(young, immature and mature) for most taxa represented. For each species and experimental platform,
detailed metadata about plant material, extraction, chromatography, and analytical and computer
methodologies, are accessible from the corresponding section of the MPMR database. In brief, plant
materials were harvested, quick frozen in liquid nitrogen and stored at -80°C until processing. Samples
were extracted for metabolomic determinations by LC/TOF-MS according to Yeo et al [73].
(submitted), and in parallel for RNAseq [15]. For LC/TOF-MS analysis, peak detection, integration,
and retention-time alignment used automated data processing, based on Waters MarkerLynx software.
Export of peak areas was organized by definition of a measured signal based on mass-retention time
pairs, individual metabolites were identified (when sufficient information exists) and their relative
abundance measured on the basis of their molecular mass (atomic mass units) as reflected by their
parent ion generated upon ionization, plus adducts with various salts (i.e. NH4+ and Na+) and, in
special cases, possible oligomeric forms (i.e. twice the actual parent ion mass). For analysis by GC-
MS, compounds were extracted and analyzed by using targeted assays with known standards [14].
Data in MPMR are stored in a MySQL database. The data are accessed and sent to the client using
server-side PHP code. Charts are created using the Javascript charting package Highcharts [74]. The
site also uses JQuery [75] and Asynchronous Javascript and XML (AJAX; [76]) for both client-side
features (the UI, for example, is based on JQueryUI) and server communications (JQuery's AJAX
features are used for searching).
4. Conclusions
We describe a novel, publicly accessible database for medicinal plants, and its associated tools for
identifying genes and developing metabolic models of specialized pathways. At present, the
overwhelming majority of detected metabolites has yet to be annotated or identified. Such annotation
is complicated by the existence of multiple isomers of putative key metabolic intermediates.
Metabolites 2012, 2 1054
Measured metabolite levels provide an important resource for establishing functions of genes
responsible for medicinal compound accumulation in plant tissues. This is particularly true in the case,
as for most species in MPMR, when transcriptomics data have been gathered from the same samples
that were metabolically assayed.
The MPMR database itself can be considered a “live” resource. As methods for identification of
additional compounds increase, detailed analyses of the raw data will enable additional progress. The
data can inform modeling of the metabolic networks of specialized plant products both by the
researchers who deposited the data and by the broader research community. Characterized metabolic
pathways and networks are key to the metabolic engineering of natural product composition in the host
species, and to develop effective microbial expression platforms for these and structurally-related
compounds [3,6,77]. Moreover, combining genes of biosynthetic pathways from different medicinal
plants will enable the generation of novel classes of compounds that may not otherwise occur in nature
or be readily accessible by chemical synthesis. From a human-health perspective, these data and
techniques can enable bioengineering of plants both to produce larger quantities of medicinally-useful
compounds as well as to produce new specialized compounds with targeted therapeutic potentials.
Furthermore, modeling of wild plant populations can provide insights into the evolution of plant
natural products. Such models will benefit from a more complete understanding of the pathways and
the extent of enzyme promiscuity, and will depend on ambitious efforts to isolate intermediates and
establish their structures through NMR spectroscopy and/or x-ray crystallography.
Acknowledgments
Medicinal Plant Consortium (MPC) is a NIH supported project (GM092521) that consists of 13
collaborating research units from 7 institutions focused on providing transcriptomic and metabolomic
resources for 14 key medicinal plants to the worldwide research community. We are grateful to the
many valuable suggestions from researchers in the MPC on database features and content that would
enhance the usefulness of the data. Research on Prunella was also supported by NIH (P50AT004155)
from the National Center for Complementary & Alternative Medicine.
Conflict of Interest
The authors declare no conflict of interest.
References
1. Medicinal Plant Metabolomics Resource. Available online: http://metnetdb.org/mpmr_public/ (accessed on 12 November 2012).
2. Zhu, F.; Shi, Z.; Qin, C.; Tao, L.; Liu, X.; Xu, F.; Zhang, L.; Song, Y.; Zhang, J.; Han, B.; et al.
Therapeutic target database update 2012: A resource for facilitating target-oriented drug
discovery. Nucleic Acids Res. 2012, 40, D1128–1136.
3. Weng, J.K.; Philippe, R.N.; Noel, J.P. The rise of chemodiversity in plants. Science 2012, 336,
1667–1670.
4. Mithöfer, A.; Boland, W. Plant defense against herbivores: Chemical aspects. Annu Rev. Plant.
Biol 2012, 63, 431–450.

Metabolites 2012, 2 1055
5. Balandrin, M.F.; Klocke, J.A.; Wurtele, E.S.; Bollinger, W.H. Natural plant chemicals: Sources of
industrial and medicinal materials. Science 1985, 228, 1154–1160.
6. Crispin, M.C.; Wurtele, E.S. Use of Metabolomics and Transcriptomics to Gain Insights into the Regulation and Biosynthesis of Medicinal Compounds: Hypericum as a Model. In Biotechnology for Medicinal Plants: Propagation and Improvement; Springer: Berlin/Heidelberg, Germany, 2013; pp 395–411.
7. De Luca, V.; Salim, V.; Atsumi, S.M.; Yu, F. Mining the biodiversity of plants: A revolution in
the making. Science 2012, 336, 1658–1661. 8. Oliver, D.J.; Nikolau, B.; Wurtele, E.S. Functional genomics: High-throughput mRNA, protein,
and metabolite analyses. Metab. Eng. 2002, 4, 98–106. 9. Schilmiller, A.L.; Last, R.L.; Pichersky, E. Harnessing plant trichome biochemistry for the
production of useful compounds. Plant. J. 2008, 54, 702–711. 10. Schilmiller, A.L.; Pichersky, E.; Last, R.L. Taming the hydra of specialized metabolism: How
systems biology and comparative approaches are revolutionizing plant biochemistry. Curr Opin
Plant. Biol. 2012, 15, 338–344. 11. Lu, Y.; Savage, L.J.; Ajjawi, I.; Imre, K.M.; Yoder, D.W.; Benning, C.; Dellapenna, D.;
Ohlrogge, J.B.; Osteryoung, K.W.; Weber, A.P.; et al. New connections across pathways and
cellular processes: Industrialized mutant screening reveals novel associations between diverse
phenotypes in Arabidopsis. Plant. Physiol. 2008, 146, 1482–1500.
12. Messerli, G.; Nia, V.P.; Trevisan, M.; Kolbe, A.; Schauer, N.; Geigenberger, P.; Chen, J.C.;
Davison, A.C.; Fernie, A.R.; Zeeman, S.C. Rapid classification of phenotypic mutants of
Arabidopsis via metabolite fingerprinting. Plant. Physiology 2007, 143, 1484–1492.
13. Cottret, L.; Wildridge, D.; Vinson, F.; Barrett, M.P.; Charles, H.; Sagot, M.F.; Jourdan, F.
Metexplore: A web server to link metabolomic experiments and genome-scale metabolic
networks. Nucleic Acids Res. 2010, 38, W132–137.
14. Quanbeck, S.M.; Brachova, L.; Campbell, A.A.; Guan, X.; Perera, A.; He, K.; Rhee, S.Y.; Bais,
P.; Dickerson, J.A.; Dixon, P.; et al. Metabolomics as a hypothesis-generating functional
genomics tool for the annotation of Arabidopsis thaliana genes of "unknown function". Front.
Plant. Sci 2012, 3, 15.
15. Medicinal Plant Genomics Resource. Available online: http://medicinalplantgenomics.msu.edu/ (accessed on 12 November 2012).
16. Gu, L.; Jones, A.D.; Last, R.L. Broad connections in the arabidopsis seed metabolic network
revealed by metabolite profiling of an amino acid catabolism mutant. Plant. J. 2010, 61, 579–590. 17. Schilmiller, A.; Shi, F.; Kim, J.; Charbonneau, A.L.; Holmes, D.; Jones, A.D.; Last, R.L. Mass
spectrometry screening reveals widespread diversity in trichome specialized metabolites of
tomato chromosomal substitution lines. Plant. J. 2010, 62, 391–403.
18. Plumb, R.S.; Johnson, K.A.; Rainville, P.; Shockcor, J.P.; Williams, R.; Granger, J.H.; Wilson,
I.D. The detection of phenotypic differences in the metabolic plasma profile of three strains of
zucker rats at 20 weeks of age using ultra-performance liquid chromatography/orthogonal
acceleration time-of-flight mass spectrometry. Rapid Commun. Mass. Spectrom. 2006, 20,
2800–2806.
Metabolites 2012, 2 1056
19. Yamazaki, Y.; Kitajima, M.; Arita, M.; Takayama, H.; Sudo, H.; Yamazaki, M.; Aimi, N.; Saito,
K. Biosynthesis of camptothecin. In silico and in vivo tracer study from [1–13c]glucose. Plant
Physiol. 2004, 134, 161–170.
20. Montoro, P.; Maldini, M.; Piacente, S.; Macchia, M.; Pizza, C. Metabolite fingerprinting of
Camptotheca acuminata and the hplc-esi-ms/ms analysis of camptothecin and related alkaloids. J.
Pharm. Biomed. Anal. 2010, 51, 405–415. 21. Sheriha, G.M.; Rapoport, H. Biosynthesis of Camptotheca acuminata alkaloids. Phytochemistry
1976, 15, 505–508.
22. Battersby, A.R.; Burnett, A.R.; Parsons, P.G. Alkaloid biosynthesis. Part xiv. Secologanin: Its
conversion into ipecoside and its role as biological precursor of the indole alkaloids. J. Chem.Soc.
C-Org.1969, 1187–1192.
23. Chiej, R. The Macdonald Encyclopedia of Medicinal Plant; Macdonald & Co: London, UK,1984. 24. Hamada, T. Studies on the medicinal plant in the "sambutsu-cho" of higo province possessed by
the kumamoto clan (ii): On the medicina herbs. Yakushigaku Zasshi 1993, 28, 63–72. 25. Mattioli, P.A. Kreuterbuch. Verlegung Sigmund Feyerabends, Peter Fischers und Heinrich
Dacken: Frankfurt am main, 1586. 26. Pinkas, M.; Trotin, F.; Feng, M.; Torck, M. Use, chemistry and pharmacology of ten chinese
medicinal plants. Fitotherapia 1994, 65, 343–353.
27. Brindley, M.A.; Widrlechner, M.P.; McCoy, J.A.; Murphy, P.; Hauck, C.; Rizshsky, L.; Nikolau,
B.; Maury, W. Inhibition of lentivirus replication by aqueous extracts of Prunella vulgaris. Virol.
J. 2009, 6, 8–21.
28. Chiu, L.C.; Zhu, W.; Ooi, V.E. A polysaccharide fraction from medicinal herb Prunella vulgaris
downregulates the expression of herpes simplex virus antigen in vero cells. J. Ethnopharmacol.
2004, 93, 63–68.
29. Han, E.H.; Choi, J.H.; Hwang, Y.P.; Park, H.J.; Choi, C.Y.; Chung, Y.C.; Seo, J.K.; Jeong, H.G.
Immunostimulatory activity of aqueous extract isolated from Prunella vulgaris. Food Chem.
Toxicol. 2009, 47, 62–69.
30. Hwang, S.M.; Lee, Y.J.; Yoon, J.J.; Lee, S.M.; Kim, J.S.; Kang, D.G.; Lee, H.S. Prunella
vulgaris suppresses hg-induced vascular inflammation via nrf2/ho-1/enos activation. Int. J. Mol.
Sci. 2012, 13, 1258–1268.
31. Kageyama, S.; Kurokawa, M.; Shiraki, K. Extract of Prunella vulgaris spikes inhibits hiv
replication at reverse transcription in vitro and can be absorbed from intestine in vivo. Antivir.
Chem. Chemother. 2000, 11, 157–164.
32. Kim, S.H.; Huang, C.Y.; Tsai, C.Y.; Lu, S.Y.; Chiu, C.C.; Fang, K. The aqueous extract of
Prunella vulgaris suppresses cell invasion and migration in human liver cancer cells by
attenuating matrix metalloproteinases. Am. J. Chin. Med. 2012, 40, 643–656.
33. Psotova, J.; Kolar, M.; Sousek, J.; Svagera, Z.; Vicar, J.; Ulrichova, J. Biological activities of
Prunella vulgaris extract. Phytother. Res. 2003, 17, 1082–1087.
34. Zhang, Y.; But, P.P.H.; Xu, H.X.; Delaney, G.D.; Lee, S.H.S.; Lee, S.F. Chemical properties,
mode of action, and in vivo anti-herpes activities of a lignin-carbohydrate complex from Prunella
vulgaris. Antivir. Res. 2007, 75, 242–249.
Metabolites 2012, 2 1057
35. Feng, L.; Jia, X.B.; Shi, F.; Chen, Y. Identification of two polysaccharides from Prunella vulgaris
l. And evaluation on their anti-lung adenocarcinoma activity. Molecules 2010, 15, 5093–5103.
36. Fang, X.; Yu, M.M.; Yuen, W.H.; Zee, S.Y.; Chang, R.C. Immune modulatory effects of Prunella
vulgaris l. On monocytes/macrophages. Int J. Mol. Med. 2005, 16, 1109–1116.
37 Xu, H.X.; Lee, S.H.; Lee, S.F.; White, R.L.; Blay, J. Isolation and characterization of an anti-hsv
polysaccharide from Prunella vulgaris. Antivir. Res. 1999, 44, 43–54.
38. Tabba, H.D.; Chang, R.S.; Smith, K.M. Isolation, purification, and partial characterization of
prunellin, an anti-hiv component from aqueous extracts of Prunella vulgaris. Antivir. Res. 1989,
11, 263–273.
39. Feng, L.; Jia, X.B.; Jiang, J.; Zhu, M.M.; Chen, Y.; Tan, X.B.; Shi, F. Combination of active
components enhances the efficacy of Prunella in prevention and treatment of lung cancer.
Molecules 2010, 15, 7893–7906.
40. Huang, N.; Hauck, C.; Yum, M.Y.; Rizshsky, L.; Widrlechner, M.P.; McCoy, J.A.; Murphy, P.A.;
Dixon, P.M.; Nikolau, B.J.; Birt, D.F. Rosmarinic acid in Prunella vulgaris ethanol extract
inhibits lipopolysaccharide-induced prostaglandin e2 and nitric oxide in raw 264.7 mouse
macrophages. J. Agric. Food Chem. 2009, 57, 10579–10589.
41. Skottova, N.; Kazdova, L.; Oliyarnyk, O.; Vecera, R.; Sobolova, L.; Ulrichova, J. Phenolics-rich
extracts from silybum marianum and Prunella vulgaris reduce a high-sucrose diet induced
oxidative stress in hereditary hypertriglyceridemic rats. Pharmacol. Res. 2004, 50, 123–130.
42. Zdařilová, A.; Svobodová, A.; Šimánek, V.; Ulrichová, J. Prunella vulgaris extract and
rosmarinic acid suppress lipopolysaccharide-induced alteration in human gingival fibroblasts.
Toxicol. In Vitro 2009, 23, 386–392.
43. Du, D.; Cheng, Z.; Chen, D. A new unusual delta11(12)-oleane triterpene and anti-
complementary triterpenes from Prunella vulgaris spikes. Nat. Prod. Commun 2012, 7, 501–505.
44. Geuenich, S.; Goffinet, C.; Venzke, S.; Nolkemper, S.; Baumann, I.; Plinkert, P.; Reichling, J.;
Keppler, O.T. Aqueous extracts from peppermint, sage and lemon balm leaves display potent anti-
hiv-1 activity by increasing the virion density. Retrovirology 2008, 5, 27.
45. Ryu, S.Y.; Oak, M.H.; Yoon, S.K.; Cho, D.I.; Yoo, G.S.; Kim, T.S.; Kim, K.M. Anti-allergic and
anti-inflammatory triterpenes from the herb of Prunella vulgaris. Planta Med. 2000, 66, 358–360.
46. Jun, M.S.; Kim, H.S.; Kim, Y.M.; Kim, H.J.; Park, E.J.; Lee, J.H.; Lee, K.R.; Kim, Y.S.; Chang,
K.C. Ethanol extract of Prunella vulgaris var. Lilacina inhibits hmgb1 release by induction of
heme oxygenase-1 in lps-activated raw 264.7 cells and clp-induced septic mice. Phytother. Res.
PTR 2012, 26, 605–612.
47. Qu, L.; Widrlechner, M.P. Variation in the breeding system of Prunella vulgaris l. HortScience
2011, 46, 688–692.
48. Charlesworth, D. Evolution of plant breeding systems. Curr. Biol. 2006, 16, R726–735.
49. Bocher, T. Racial divergences in Prunella vulgaris in relation to habitat and climate. New
Phytologist 1949, 48, 285–314.
50. Nelson, A.P. Relationships between two subspecies in a population of Prunella vulgaris l.
Evolution 1963, 18, 43–51.
51. Schmid, B. Clonal growth in grassland perennials iii. Genetic variation and plasticity between and
within populations of bellis perennis and Prunella vulgaris. J. Ecol. 1985, 73, 819–830.
Metabolites 2012, 2 1058
52. Winn, A.; Gross, K. Latitudinal variation in seed weight and flower number in Prunella vulgaris.
Oecologia 1993, 93, 55–62.
53. Brindley, M.A.; Widrlechner, M.P.; McCoy, J.A.; Murphy, P.; Hauck, C.; Rizshsky, L.; Nikolau, B.; Maury, W. Inhibition of lentivirus replication by aqueous extracts of Prunella vulgaris. Virol. J. 2009, 6, 8.
54. Chen, Y.; Guo, Q.; Zhu, Z.; Zhang, L. Changes in bioactive components related to the harvest
time from the spicas of Prunella vulgaris. Pharm. Biol. 2012, 50, 1118–1122. 55. Center for Research on Botanical Dietary Supplements. Available online:
http://www.nwrc.iastate.edu/botanical/ (accessed on 12 November 2012).
56. USDA-ARS GRIN. Available online: http://www.ars-grin.gov/npgs/index.html (accessed on 12
November 2012).
57. Dehaven, C.D.; Evans, A.M.; Dai, H.; Lawton, K.A. Organization of gc/ms and lc/ms
metabolomics data into chemical libraries. J. Cheminform. 2010, 2, 9. 58. Kind, T.; Fiehn, O. Advances in structure elucidation of small molecules using mass
spectrometry. Bioanal. Rev. 2010, 2, 23–60. 59. Dixon, P.M.; Wu, L.; Widrlechner, M.P.; Wurtele, E.S. Weighted Distance Measures for
Metabolomic Data; Iowa State University: Ames, IA, 2009; pp 1–8.
60. Bais, P.; Moon-Quanbeck, S.M.; Nikolau, B.J.; Dickerson, J.A. Plantmetabolomics.Org: Mass
spectrometry-based arabidopsis metabolomics--database and tools update. Nucleic Acids Res.
2012, 40, D1216–1220. 61. Perera, M.A.; Qin, W.; Yandeau-Nelson, M.; Fan, L.; Dixon, P.; Nikolau, B.J. Biological origins
of normal-chain hydrocarbons: A pathway model based on cuticular wax analyses of maize silks.
Plant. J. 2010, 64, 618–632. 62. MacQueen, J. Some Methods for Classification and Analysis of Multivariate Observations; Fifth
Berkeley Symposium on Mathematical Statistics and Probability, Statistical Laboratory of the
University of California, Berkeley, 1967; Cam, L.M.L., Neyman, J., Eds.; University of California
Press: Berkeley, CL, USA; pp. 281–297. 63. Dobler, S.; Petschenka, G.; Pankoke, H. Coping with toxic plant compounds--the insect's
perspective on iridoid glycosides and cardenolides. Phytochemistry 2011, 72, 1593–1604. 64. Schoner, W.; Scheiner-Bobis, G. Endogenous and exogenous cardiac glycosides and their
mechanisms of action. Am. J. Cardiovasc. Drugs 2007, 7, 173–189. 65. Withering, W. An account of the foxglove and some of its medical uses: With practical remarks
on dropsy and other diseases. In The Classics of Medicine Library; Adams, L.B., Jr., Ed.; Division
of Gryphone Editions, Ltd.: Birmingham, Alabama, USA, 1785.
66. Wiegrebe, H.; Wichtl, M. High-performance liquid-chromatographic determination of
cardenolides in Digitalis leaves after solid-phase extraction. J. Chromatogr. 1993, 630, 402–407.
67. Krenn, L.; Kopp, B. Bufadienolides from animal and plant sources. Phytochemistry 1998, 48,
1–29. 68. Heasley, B. Chemical synthesis of the cardiotonic steroid glycosides and related natural products.
Chemistry 2012, 18, 3092–3120. 69. Kreis, W.; Hensel, A.; Stuhlemmer, U. Cardenolide biosynthesis in foxglove. Planta Medica
1998, 64, 491–499.
Metabolites 2012, 2 1059
70. Herl, V.; Fischer, G.; Müller-Uri, F.; Kreis, W. Molecular cloning and heterologous expression of
progesterone 5beta-reductase from Digitalis lanata ehrh. Phytochemistry 2006, 67, 225–231. 71. Ohyama, K.; Suzuki, M.; Kikuchi, J.; Saito, K.; Muranaka, T. Dual biosynthetic pathways to
phytosterol via cycloartenol and lanosterol in arabidopsis. Proc. Natl. Acad. Sci. USA 2009, 106,
725–730. 72. Risley, J.M. Cholesterol biosynthesis: Lanosterol to cholesterol. J. Chem.Edu. 2002, 79, 377–384.
73. Yeo, Y.S.; Nybo, E.; Chittiboyina, A.G.; Weerasooriya, A.D.; Wang, Y.H.; Góngora-Castillo, E.;
Vaillancourt, B.; Buell, C.R.; Penna, D.; Celiz, M.D.; et al. Functional identification of valerena-
1,10-diene synthase, a terpene synthase catalyzing a unique chemical cascade in the biosynthesis
of biologically active sesquiterpenes in Valeriana officinalis. J. Bio. Chem. 2012, Submitted for
publication. 74. Javascript charting package Highcharts. Available online: http://www.highcharts.com/ (accessed
on 12 November 2012).
75. JQuery. Available online: http://jquery.org/ (accessed on 12 November 2012).
76. Asynchronous Javascript and XML. Available online: http://developer.mozilla.org/en-
US/docs/AJAX (accessed on 12 November 2012).
77. Lee, J.W.; Na, D.; Park, J.M.; Lee, J.; Choi, S.; Lee, S.Y. Systems metabolic engineering of
microorganisms for natural and non-natural chemicals. Nat. Chem. Biol. 2012, 8, 536–546.
© 2012 by the authors; licensee MDPI, Basel, Switzerland. This article is an open access article
distributed under the terms and conditions of the Creative Commons Attribution license
(http://creativecommons.org/licenses/by/3.0/).


