Mesoscale Wind Atlas of South Africa
Kilian HagemannClimate Systems Analysis Group
University of Cape TownStellenbosch Seminar
27 March 2009

Presentation Overview
Summary of my entire PhD (breadth, not depth) Run MM5 at 18km resolution over SA Part 1) How model data was derived
Validation, optimisation of time period and configuration
Part 2) Mesoscale Wind Atlas Results Uncertainty, resource maps, potential estimation

Model Introduction
MM5 – non-hydrostatic regional/mesoscale climate model
Community model developed at Penn State University (forecasting and climate research)
Fully dynamic (time dependent) wind, temperature, pressure and humidity
Takes into account MANY surface parameters (topography, roughness, albedo etc.)

Model Validation - Observations
Use most reliable 17 SAWS stations (10m)

Model Validation - Statistics
Wind speed and standard deviation bias Daily cycle metrics – phase and amplitude Yearly cycle mean absolute error (MAE) Directional statistics – weighted MAE based on
12 sectors
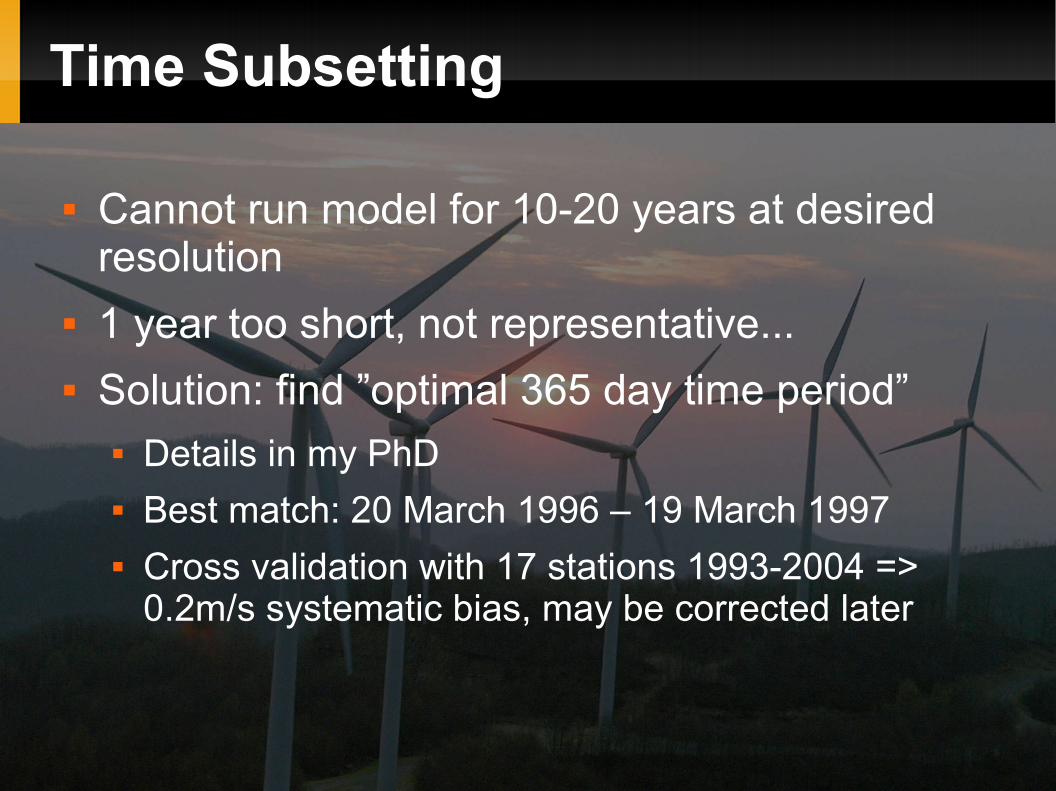
Time Subsetting
Cannot run model for 10-20 years at desired resolution
1 year too short, not representative... Solution: find ”optimal 365 day time period”
Details in my PhD Best match: 20 March 1996 – 19 March 1997 Cross validation with 17 stations 1993-2004 =>
0.2m/s systematic bias, may be corrected later

Parametrisations – overview
Large effort spent on determining ”optimal” configuration of model
Dozens of ”sensitivity runs” over limited EC domain
Investigating performance in terms of: All validation statistics Model factors such as LSM/PBL combinations Grid FDDA, observational nudging, cumulus

Parametrisations – LSM/PBL East London daily cycle

Final Model Domains

Fundamental Grid Constraints
Surface (topography, roughness etc.) smoothed out (18km)
Cannot distinguish between points within given grid cell
Gives good area average, not necessarily point estimate
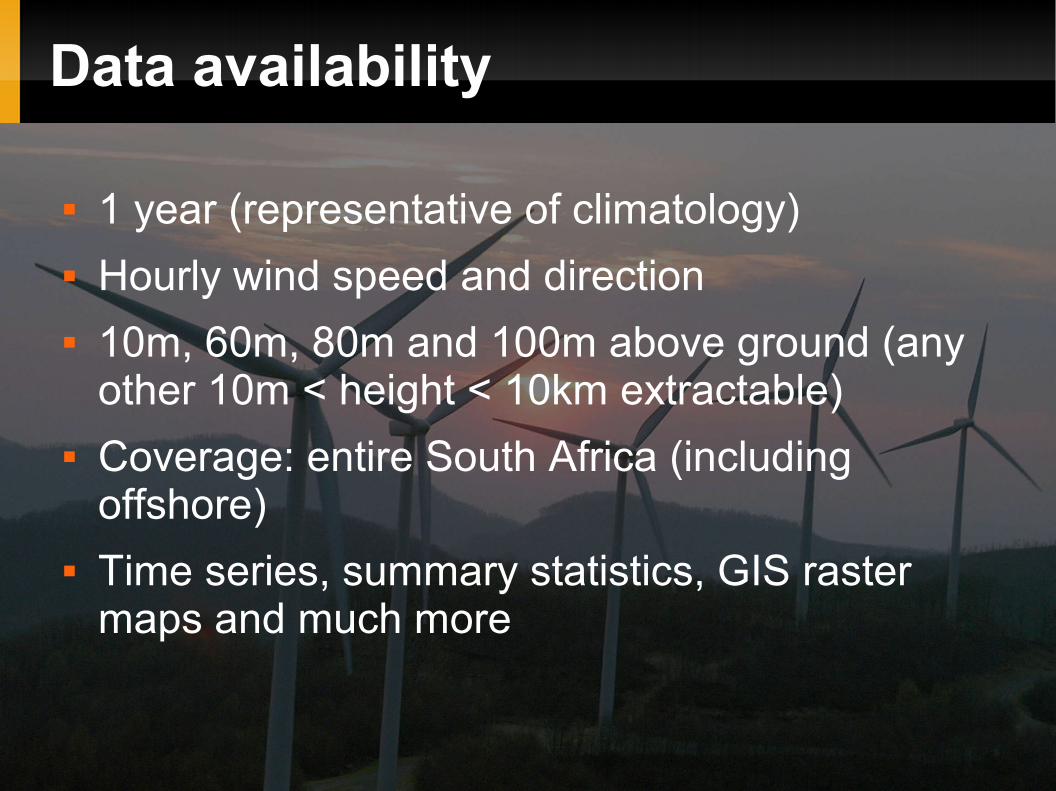
Data availability
1 year (representative of climatology) Hourly wind speed and direction 10m, 60m, 80m and 100m above ground (any
other 10m < height < 10km extractable) Coverage: entire South Africa (including
offshore) Time series, summary statistics, GIS raster
maps and much more

10m Wind Speed Bias

10m Daily Wind Speed Cycles

Coastal Wind Speed Cycle (Alexander Bay)

Inland Wind Speed Cycle (Bloemfontein)

Uncertainty Summary
Wind speed Bias ~ 0.2m/s (model too strong) Error +/- 0.7m/s (68% conf. Int.)
Daily Cycles Coast within +/- 1h of peak Coast bias 18% of peak, +/- 20% (68% conf.) Inland not reliable => useful enough for daily electricity demand profile
calculations (Andrew Marquard)

Average 10m Wind Speed Maps I
Diab 1995 18km MM5 2008
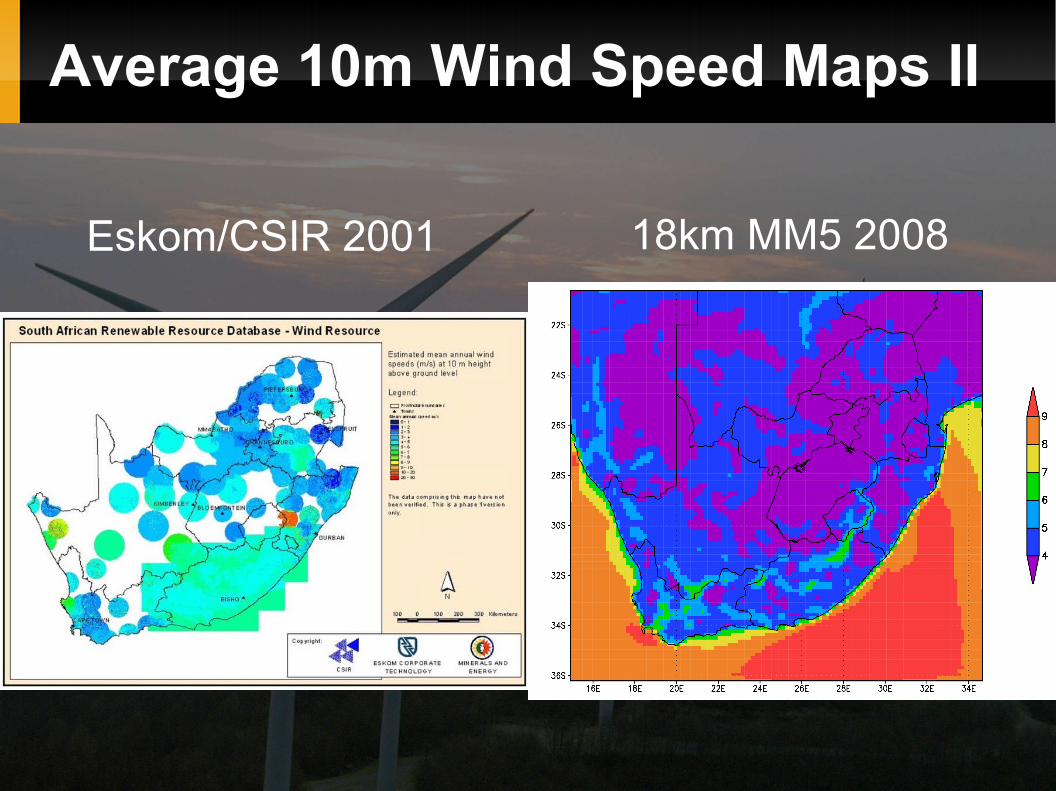
Average 10m Wind Speed Maps II
Eskom/CSIR 2001 18km MM5 2008

Total Potential Calculation
Integrate total wind potential by considering: Proximity to roads (minimum secondary) Proximity to transmission lines (>=66kV) Minimum capacity factor (2MW Vestas turbine) given hub height (60m, 80m or 100m) Density of 1 turbine per km2

Total Potential Calculation
Three scenarios:

Future Plans
SAWEP wind atlas project R25m, 4 year project Multi-stakeholder
Risoe, UCT, CSIR, SANERI, SAWEP, SAWS
Based on measurements AND mesoscale modelling

SAWEP Mesoscale Component
Phase 1 – known methodology by Risoe First map by next year (?)
Phase 2 – fully dynamic simulations, new methodology developed by myself, UCT and Risoe To be used all over the world Completed by 2012

My Current Business
Will NOT consult going forward PhD available from UCT Busy setting up a wind power development
business Integrating existing data, current knowledge
and future work into business If you want the data, expertise and/or
consulting feel free to invest ;-)