

23
METHODOLOGY FOR COMPILATION OF NATIONAL
CONSUMER PRICE INDEX (NCPI) - TANZANIA MAINLAND
Prepared and Edited by
Ruth Minja and Dale A. Smith
23
THE UNITED REPUBLIC OF TANZANIA
Methodology for Compilation of National Consumer Price Index (NCPI) - Tanzania Mainland
September 2010=100
National Bureau of Statistics,
Ministry of Finance and Economic Affairs
Dar es Salaam
December, 2010

23
CHAPTER 1: INTRODUCTION AND GENERAL CONCEPTS
A. INTRODUCTION
The Consumer Price Index (CPI) is a key economic indicator used by government, business,
labour, academia, and other organizations to monitor price movements of a fixed basket of
goods and services commonly purchased by households over a period of time. Nonetheless, as
time passes, consumption patterns change due to changes in consumer tastes, fashion,
technology, and, most importantly, changes in the relative prices of the goods and services in
the CPI market basket. These changes cause the fixed basket of goods and services to become
out of date and lead to an index that does not accurately reflect price change giving inaccurate
market signal to index users.
For developing countries the International Labour Organization (ILO) recommends rebasing the
CPI at least once every five years in order to update the CPI market basket for the changes in
the consumption patterns of the households in the target population. Since the item sample and
market basket weights for the previous CPI were based on expenditure data from the 2001
Household Budget Survey (HBS), it became urgent to rebase the index using the results of the
2007 HBS. This document presents the methodology that was used for compiling the new CPI
for October 2010 that was first disseminated in November 2010.
Table 1 of the Appendix presents a comparison of the different characteristics of the new NCPI
as opposed to those of the old NCPI. It will be noted that there are a number of significant
improvements that have been introduced for the new NCPI. These include an expanded
geographic coverage to include rural households in the CPI weights, a new market basket with
an updated list of items and weights, an updated sample of outlets for price collection,
improved index compilation techniques, and the use of a new internationally recommended
classification system (―Classification of Individual Consumption by Purpose (COICOP)‖).

24
B. WHAT THE CPI MEASURES
The CPI measures the changes in the price of a fixed basket of goods and services that are
commonly purchased by a majority of households in a given country over time. To ensure that
changes in the index reflect solely price changes, product specifications like quantities, quality
and type of outlets are kept unchanged over time, in so far as it is possible. When changes do
occur due to the closing of pricing outlets, or the discontinuance of a product that was being
priced, Similar outlets and/or products are introduced in a manner that ensures pure price
changes are reflected in the index. This is done by splicing these new outlet or products into
the index. In addition, it is also possible, in some cases, to carry out quality adjustments to the
index that adjust the index for changes in product specifications.
The CPI reflects the price movements and not the actual price levels of goods and services.
Suppose indices for bread and buns for a particular period show a price percentage change of
10 % and 20% respectively. This does not mean buns costs more than bread, but it simply
implies that the price of bread has risen by 10% while that of buns has risen by 20% from the
based period.
The CPI could also be used as proxy to the Cost of Living when the basket of goods and
services and the level of the households’ well being are stable. The Cost of Living Index (COLI)
indicates what one would need to spend in order to maintain a certain level of well being in the
face of changes in prices of goods and services. Consumers normally make substitutions of the
goods they purchase in order to maintain a certain standard of living when prices change.
However, it is very difficult to construct a COLI that holds the level of well being constant. The
problem is that spending habits change with variations in lifestyle, market conditions, income
levels, household composition and consumer preference. In order to construct a true COLI it is
necessary to have data on changes in consumption patterns on a monthly basis. This would
require an HBS each month. Although there is significant research in compiling certain types of
COLIs using historical data, it is not possible to compile a COLI on an ongoing basis. For this
reason all countries compile a CPI rather than a COLI.

34
.C. USES OF THE CPI
In Tanzania the CPI has many uses:
i. Indicator of price change—The CPI is the most common macro-economic
indicator of price change. It is often used in the formulation of monetary policy
and to identify the sources of price change.
ii. Adjustment of economic series—The CPI is used as a price deflator in the
compilation of real economic statistics and indicators, e.g., Gross Domestic
Product (GDP) at constant prices.
iii. For indexation of wages and salaries—Trade unions and employers use
the CPI for the indexation of wages and salaries in order to maintain the
purchasing power of the wages and salaries.
iv. For international comparisons—The CPI is used to compare the inflation
rate in Tanzania with that of other countries. These comparisons can then be
used to appraise the relative economic performance of Tanzania with that of
other countries. This may help determine economic and social policy for the
country.
.D. TYPES OF CPI PRODUCED IN TANZANIA
Several different types of consumer price indices will be compiled in Tanzania:
i. NCPI—the National CPI is compiled based on monetary expenditures relating to
consumption for all households both urban and rural with all levels of income. The NCPI
provides the headline estimate of inflation for the country.
ii. NCPI2—the weights for this index are based on monetary as well as non-monetary
consumption. Non-monetary consumption includes imputed rent for homeowners and
households living in rent free accommodations. The weights also reflect the market
value of goods produced for own consumption such as food produced and consumed at
home. Currently, the NCPI2 is compiled on an experimental basis for internal use. This
index will be used for indexation in compiling the national accounts and for other
economic research.

44
iii. HCPI—the Harmonized CPI is compiled by member states of SADC/COMESA on the
basis of strict guidelines. In particular, the HCPI weights do not include non-monetary
expenditures. In addition, components for health care and education are not currently
included. This index is compiled based on domestic expenditures that include
expenditures by diplomats and visitors to the country. Likewise, expenditures by
residents of Tanzania outside the country are not included. The HCPI will be released in
early 2011.
iv. CICPI—The Core Inflation CPI provides an estimate of the underlying inflation rate. The
CICPI is based on the NCPI. This index is compiled by excluding product and services
that demonstrate highly variable price change. These include certain fresh fruits and
vegetable and items such as fuel whose prices are determined exogenously to the
economy of Tanzania. Also excluded are prices for water and electricity which are
subsidized and administered by the government. It should be noted that the CICPI
would be compiled and disseminated by the National Bank of Tanzania (NBT) rather
than the NBS since it is an analytical index based on only part of the official NCPI.
E. REFERENCE POPULATION FOR THE CPI
i. The reference population for the CPI is all types of private resident households
from all socio-economic-economic and income groups. A CPI household may be
comprised of only one person, a couple, a family and/or non-related persons that
meet the definition of a household which depends mainly on the sharing of
household resources for meals and household expenses.
ii. Expenditures for both urban and rural households from all geographic areas of
the country are included.
iii. Institutional households such as groups of persons living in religious institutions,
educational institutions, hospitals, prisons and others are excluded.

54
F. SCOPE OF THE CPI
All household monetary expenditure related to personal household consumption fall
within the scope of the NCPI. However, business related household expenditures are
excluded. These include the purchase of stocks, bonds, business related capital, real
estate and any other business related expenses. In addition, expenditures related to
capital goods that are used for both business and personal purposes require special
treatment in determining the market basket weights. Consider, for example, the
purchase of a vehicle that is used for both business and personal purposes. Both the
purchase price as well of the cost of operating the vehicle, need to be divided between
personal or business consumption based on the proportion of use for business. The
business portion is excluded from the CPI weights.
Also excluded from the CPI are certain types of expenditures that are more related to
income than consumption. These include life insurance premiums income taxes, and
social security payments. Property taxes are excluded also. In addition, money transfers
are excluded from the CPI weights.
Although the value of non-monetary household consumption is excluded from the scope of the
NCPI, certain types of non-monetary consumption are included in the NCPI2. The most
important type of non-monetary consumption is own account production that can be classified
into several categories:
i. Goods produced for own consumption—these are goods mainly produced by
subsistence households. They include basic food items such as rice, wheat, maize,
vegetables, fruit, dairy products, fish, and meat. Some households may also produce
clothing and items of furniture for their own use.
ii. Owner-occupied housing services—these services are produced by all households
that own the dwelling in which they live. The homeowner purchases a dwelling and
pays the property taxes, fire insurance, and maintenance costs. The services
64
provided by this dwelling are then used (consumed) by the household. The value of
these services is usually measured by estimating the market value of the rent that
could be obtained for the dwelling. For the HBS, each household that owns a house
in which the household is living is asked to estimate the market value of the rent.
These data are then used to estimate imputed rent for homeowners. This imputed
rent for homeowners is included in the market basket weights for NCPI2. Imputed
rent is also estimated and included in the market basket weights for those
households living rent free.
iii. Other Own account household services—these are services produced by all
households. They include the preparation of meals, the care of children, the sick and
the elderly, cleaning and maintenance of dwellings and the transport of household
members. None of these goods and services is purchased by households. They are
consumed without the need to purchase because they are produced within the
household. These own account household services are excluded from both the NCPI
and the NCPI2.
.G. Classification and the structure of the new CPI market basket
The rebased NCPI follows the internationally recommended Classification of Individual
Consumption by Purpose (COICOP). The use of COICOP results in a change in the publication
format for the new NCPI. The composition of the 12 major groups of COICOP is significantly
different from the composition of the major groups of the old NCPI. Because of this difference,
the new NCPI are disseminated with indices for the 12 major groups of COICOP as well as
several additional index aggregations.
The 12 major groups of COICOP are:
1. Food and Non Alcoholic Beverages 2. Alcoholic Beverages, and Tobacco 3. Clothing and Footwear 4. Housing, Water, Electricity, Gas and Other Fuel 5. Furnishing, Housing Equipment and Routine Maintenance of the House 6. Health 7. Transport 8. Communication 9. Recreation and Culture

74
10. Education 11. Restaurants and hotels 12. Miscellaneous goods and services
The additional indices are;
Food and Non-alcoholic Beverages—combining food consumed at home and food consumed in restaurants
Energy and Fuels—combining electricity and other fuels for use at home with petrol and diesel
All Items Less Food All Items Less Food and Energy
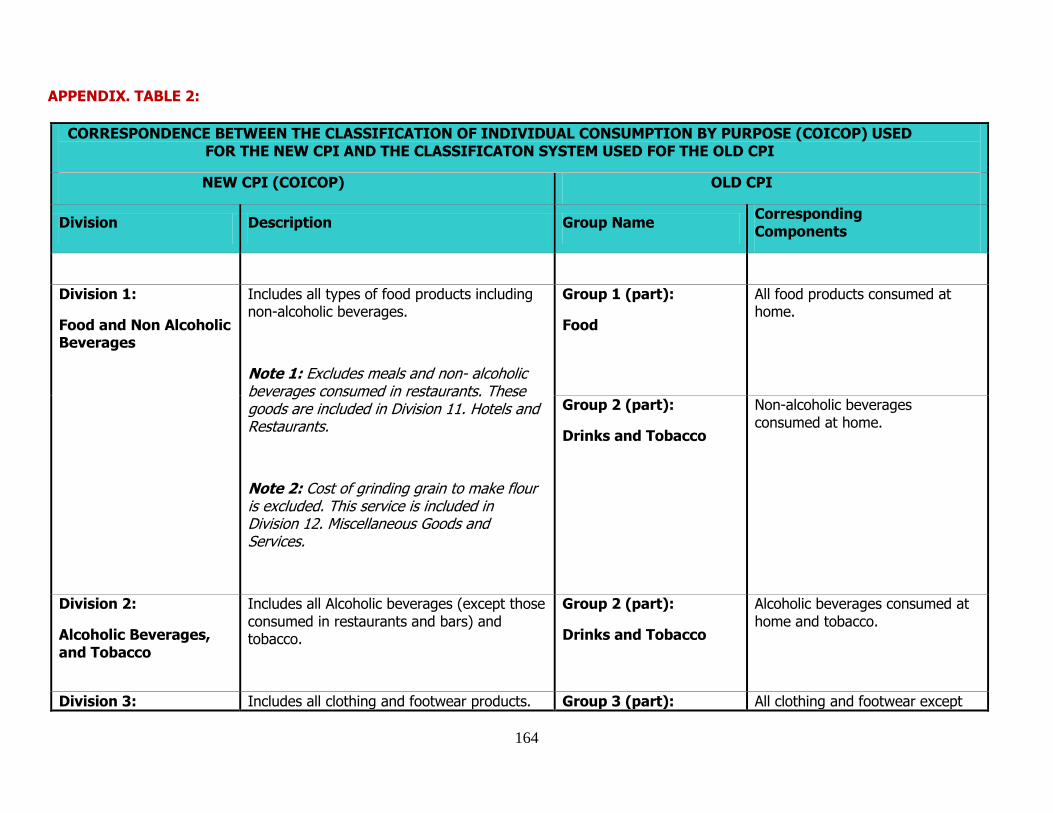
Table 2 of the Appendix provides a concordance between the major groups of the new
NCPI and the old NCPI. It will be noted that every major group of the new index is
composed of either partial components of the major groups of the old index, or a
combination of major groups of the old index. For this reason, it was decided that no
attempt would be made to link the index series backwards for the major groups of the
new NCPI. Nonetheless, the index series for these major groups are available from
October 2009 forward for the new NCPI since they must be used to calculate the 12
month changes for the first 12 months of the new index. However, these overlap
indices for the major groups are not appropriate for calculating official monthly index
series for the new index. The official NCPI was the old NCPI up through September of
2010.
CHAPTER 2: COMPARISON OF MARKET BASKET WEIGHT
Table 3 of the Appendix presents a comparison of the weights for the old NCPI, the new
NCPI, the HCPI, and the NCPI2. The weights for the first three index series are based
on monetary consumption, while the weights for the NCPI2 are based on both
monetary and non-monetary consumption. All of the series are derived using the 12
major groups (divisions) of the COICOP classification system. In order to derive these
weights for old NCPI it was necessary to map the old CPI weights into the 12 major

84
groups of COICOP. Nonetheless, the old index has not been compiled by this
classification system.
Column 3 of Table 3 of the Appendix contains the weights of the old NCPI which are
based on household expenditure data from urban households surveyed in the 2001
HBS. Column 4 refers to corresponding data obtained from both urban and rural
households from the 2007 HBS. As time passes consumption patterns change causing
expenditures to change. When comparing expenditure data from two time periods, it is
important to understand that expenditures are based on both quantities of goods and
services purchased and the prices of these goods and services. This means that
expenditures can change because of changing consumption patterns (based on
quantities) or changing prices. Since the goal of a CPI is to hold the quantities constant,
expenditure survey data from the HBS are generally updated for price change from the
period when the data were collected (the year of the HBS) to the period when the new
CPI is initiated. This meets the conceptual requirement for a Laspeyres index, i.e., that
quantities are held constant. Column 5, therefore, contains the 2007 HBS expenditure
weights updated for price change between calendar year 2007 and October 2009 when
the compilation of the new NCPI was initiated.
While it makes sense to update the HBS data for price change for compiling the new
NCPI, it must be remembered that the assumption justifying this procedure is that
quantities (consumption patterns) do not change. Although it would be better to use
expenditure data from a more recent HBS, thereby capturing the most recent changes
in consumption patterns, more recent data do not exist. This makes updating HBS
expenditure data for price change an imperfect process.
When comparing the weights from two sets of CPI weights from two different HBS
surveys, several types of comparisons can be made. The first is simply comparing the
HBS data directly without updating the weights for price change. The second is to
update the old CPI weights for price change to the year of the new HBS. This has not
yet been done. It would require some effort, since it must be done at the detailed item

94
level, and price indices have not been compiled at the detailed item level for the old
CPI.
In spite of the imperfect nature of the process of comparing the results of the two HBS
surveys, it is still worthwhile to make such comparisons. It will be noted that, under the
COICOP classification system, food is divided into two components—Food and Non-
Alcoholic Beverages (consumed at home) and Food and Beverages Consumed in
Restaurants (and other locations away from home). An approximate estimate of total
food is obtained by combining the weights for major groups 1 and 11. This is possible
since the weight of hotel accommodations is quite small. It can thus be noted that the
budget share of food has decreased from 60.9 percent to 49.4 percent between the two
surveys. It should be noted that the data are not directly comparable since the data
from the old were based on urban areas only.
CHAPTER 3: SELECTION OF THE BASKET OF GOODS AND SERVICES
AND OUTLETS FOR MONTHLY PRICE COLLECTION
A. General Principles used in selecting the new CPI basket of goods and
Services
In the new CPI basket of goods and services, all products with expenditure shares of at
least 0.001 were included. Availability of products in the markets for a reasonable
period of time and the possibility of specifying a clear product description to ensure
constant quality over time were also considered. With the exception of certain essential
products such as salt and soap, products with expenditure shares below the threshold
were not selected. However, their expenditure shares were distributed across other
products within the subgroup in which they reside. In this manner the price movements
for these items are represented by the price movement of products included in the new
CPI market basket.

104
B. New items included in the CPI basket
The number of items selected for pricing has been expanded from 207 in the old CPI to
224 in the new CPI. The following are some the new items selected:
Industrially bred live chicken (Big)
Baby foods excluding milk Millet grain Chapati Gas Sofas
Repair and maintenance of vehicles including spare parts Mobile phone Services Musical systems Still Cameras Primary school fee – Private
Dhobi--Laundry (kufua na kupasi) Dental services (Kung'oa jino) Internet services DVD/VCD player Perfumes for Ladies
Apples (Imported) Bitter tomatoes (Nyanya chungu) Green peas (Njegere -zilizomenywa) Honey from large bees Fruit juices Industrial made, Bottled
Shorts - kaptula - KADET/KHAKI Motorcycle fare (Shortest distance one passenger) Bajaj fare (Shortest distance one passenger) Simple Hairdressing for Women
C. ITEMS FROM THE OLD CPI BASKET THAT WERE ELIMINATED
The following are some of the items that have been removed from the CPI market
basket:
Men’s kanzu Men’s shuka (msuli wa kuvaa) Hurricane lamp
Kettle (non- electric) Aspirin

114
D. PRINCIPLES FOR SELECTING NEW CPI OUTLETS
The new CPI basket list of goods and services was tested for pricing in the Arusha and
Dodoma regions to assess possible outlets for price collection and the availability of
these goods and services. The outlets selected for monthly pricing are those commonly
visited by households. In determining the number of outlets to be covered,
consideration was given to the price variability across outlets. For those products with
large price variation, more outlets were selected, e.g., clothing and footwear, fresh
fruits and vegetables, etc. Correspondingly, for items whose prices are relatively
uniform and standard, fewer outlets were selected. E.g., Electricity and water bill.
Types of outlets selected for both food and non food items include: open markets,
supermarkets, neighborhood shops, groceries, restaurants, hotels, shopping centers
and other retail outlets. For price-regulated items such as school fees and utilities, price
data are obtained from the relevant authorities.
For the monthly price survey, prices are collected in urban Regional Headquarters in all
21 regions in approximately four outlets per item. For non-processed food items, price
collectors go to the shops/markets on three consecutive days for price collection. The
food items are purchased and weighed . The prices are then converted to price per kilo,
or other standard unit of measurement, for index compilation.
CHAPTER 4: INDEX COMPILATION
The CPI for Tanzania is compiled using an Excel-based software that employs the current period
to previous period price relative version of the Laspeyres index compilation formula. This
formula is sometimes referred to as the modified Laspeyres index formula. It should be noted
that although the modified index compilation formula is algebraically equivalent to the current
period to base period version of the Laspeyres index compilation formula, the modified
Laspeyres formula allows more flexibility for introducing new items, new outlets, and new
product specifications when substitutions of outlets or products are necessary. Quality
adjustments are also facilitated with the modified Laspeyres index formula.

124
Elementary aggregates for obtaining the first level of detailed price relatives for the index are
compiled using a matched price geometric mean formula. Since no expenditure weights are
available at the price quotation level, the geometric mean is considered to be a superior formula
for compiling these aggregates. Nonetheless, the higher level aggregations for the new CPI are
carried out using weighted arithmetic means consistent with the Laspeyres index calculation
formula.
CHAPTER 5: DISSEMINATION
The NBS disseminates the NCPI on a preannounced schedule on approximately the 15th of the
month following the reference month of the index. It is disseminated to all users at the same
time through a press conference and on the NBS website. No one outside of the NBS has access
to the index prior to its publication.
The monthly press release contains index data on monthly and 12 month (year-on-year same
month) index changes at the national level for the all items NCPI and for the 12 major groups
based on the COICOP classification system. The press release also provides analysis of the
major price changes that occurred during the month. In addition, the press release presents
NCPI historical data by means of a linked historical series with a reference base of September
2010=100. The link month for linking the old NCPI to the new NCPI is September 2010. This
linked historical series is also provided in Table 4 of the Appendix.

144
APPENDIX. TABLE 1:
TANZANIA. COMPARISON OF THE NEW NCPI WITH THE OLD NCPI
Item
Number
Item New CPI Old CPI Comments
1. Types of indices compiled NCPI, NCPI2, HCPI, Core Inflation CPI
NCPI The NCPI2 is compiled for internal use only.
2. Geographic coverage 21 regions 20Regions Arusha Region was divided into two separate regions: Arusha and Manyara after 2001 HBS
3. Population coverage on CPI weights Urban and rural Urban
4. Source of market basket weights 2007 HBS 2001 HBS
Household sample size for HBS 10,756 22,178 Although the 2001 HBS covered both urban and rural households, only data from the urban households was used for the NCPI weights.
5. Reference base September 2010=100 December 2001=100
6. Classification system COICOP (eight digit expanded version of COICOP)
National classification system (six digits)
7. Number of major groups 12 divisions 12 major groups There are significant differences in the composition of the major groups. See Appendix 2 for a concordance between the two classification systems by major group.
8. Compilation of elementary aggregates Geometric mean Arithmetic mean Using geometric means for elementary aggregates is the internationally

154
recommended procedure.
9. Higher Level Index formula Modified Laspeyres Modified Laspeyres
10. Aggregation level at which weights are applied Six digit level Five digit level Applying the weight at a more detailed level is a significant improvement to the index compilation methodology for the new index.
11. Monthly index release date Approximately the 15th of the month following the reference month for the index.
Approximately the 15th of the month following the reference month for the index.
164
APPENDIX. TABLE 2:
CORRESPONDENCE BETWEEN THE CLASSIFICATION OF INDIVIDUAL CONSUMPTION BY PURPOSE (COICOP) USED FOR THE NEW CPI AND THE CLASSIFICATON SYSTEM USED FOF THE OLD CPI
NEW CPI (COICOP) OLD CPI
Division Description Group Name Corresponding Components
Division 1:
Food and Non Alcoholic Beverages
Includes all types of food products including non-alcoholic beverages.
Note 1: Excludes meals and non- alcoholic beverages consumed in restaurants. These goods are included in Division 11. Hotels and Restaurants.
Note 2: Cost of grinding grain to make flour is excluded. This service is included in Division 12. Miscellaneous Goods and Services.
Group 1 (part):
Food
All food products consumed at home.
Group 2 (part):
Drinks and Tobacco
Non-alcoholic beverages consumed at home.
Division 2:
Alcoholic Beverages, and Tobacco
Includes all Alcoholic beverages (except those consumed in restaurants and bars) and tobacco.
Group 2 (part):
Drinks and Tobacco
Alcoholic beverages consumed at home and tobacco.
Division 3: Includes all clothing and footwear products. Group 3 (part): All clothing and footwear except

174
Clothing and Footwear Clothing and Footwear
school uniforms.
Group 11 (part):
Education
School uniforms.
Division 4:
Housing, Water, Electricity, Gas and Other Fuel
Includes actual rent paid by households, imputed rent (excluded for the Monetary CPI—NCPI, and included for the monetary and non-monetary CPI—NCPI2), water, electricity, gas and other fuels.
Group 4:
Rent
For the NCPI, paid rent only.
For the NCPI2, both paid rent and imputed rent.
Group 5:
Fuel, Power and Water
Expenditure on fuel, power and water
Division 5:
Furnishing, Housing Equipment and Routine Maintenance of the House
Includes all expenditures on furnishing, household equipment and routine maintenance of the house (minor maintenance).
Group 6:
Furniture and Household Equipments
Expenditure on furniture and household equipment:
Group 7:
Household Operations and Maintenance
Expenditure on household operations and maintenance
Division 6:
Health
Includes all expenditures on health.
Group 8 (part):
Personal Care and Health
Expenditure on Health
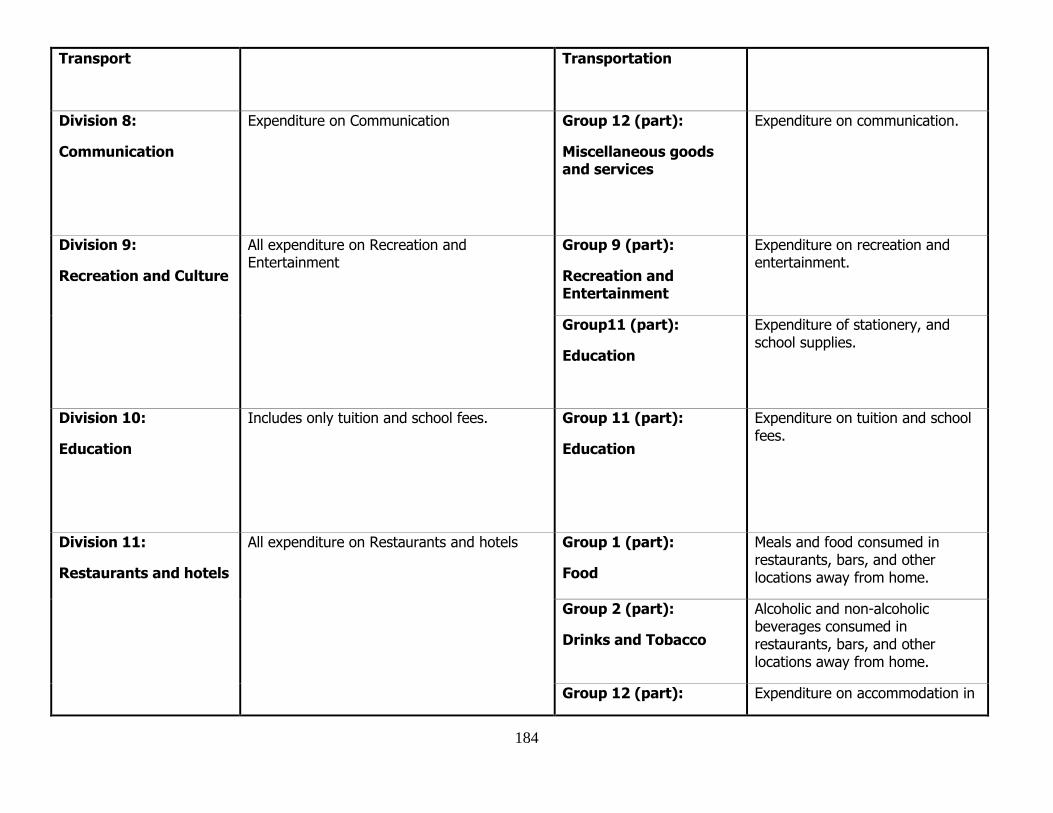
Division 7: Includes transportation expenditures. Group10 (part): Expenditure on Transportation.
184
Transport
Transportation
Division 8:
Communication
Expenditure on Communication
Group 12 (part):
Miscellaneous goods and services
Expenditure on communication.
Division 9:
Recreation and Culture
All expenditure on Recreation and Entertainment
Group 9 (part):
Recreation and Entertainment
Expenditure on recreation and entertainment.
Group11 (part):
Education
Expenditure of stationery, and school supplies.
Division 10:
Education
Includes only tuition and school fees.
Group 11 (part):
Education
Expenditure on tuition and school fees.
Division 11:
Restaurants and hotels
All expenditure on Restaurants and hotels Group 1 (part):
Food
Meals and food consumed in restaurants, bars, and other locations away from home.
Group 2 (part):
Drinks and Tobacco
Alcoholic and non-alcoholic beverages consumed in restaurants, bars, and other locations away from home.
Group 12 (part): Expenditure on accommodation in
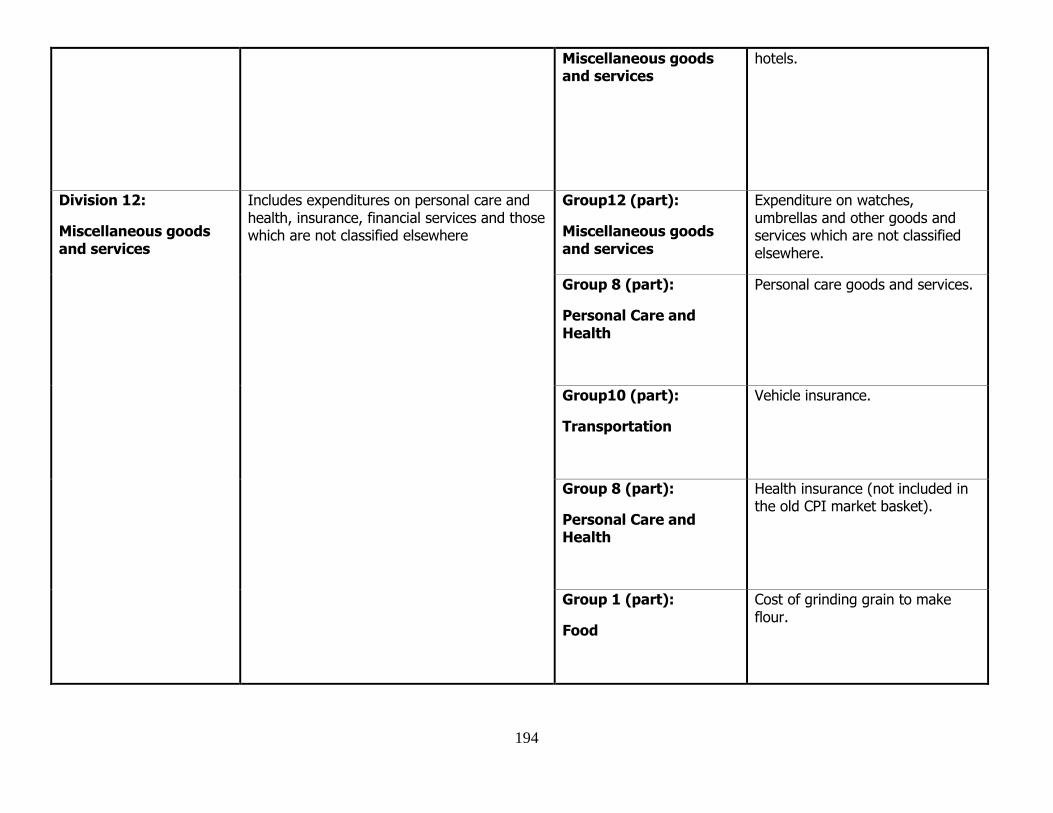
194
Miscellaneous goods and services
hotels.
Division 12:
Miscellaneous goods and services
Includes expenditures on personal care and health, insurance, financial services and those which are not classified elsewhere
Group12 (part):
Miscellaneous goods and services
Expenditure on watches, umbrellas and other goods and services which are not classified elsewhere.
Group 8 (part):
Personal Care and Health
Personal care goods and services.
Group10 (part):
Transportation
Vehicle insurance.
Group 8 (part):
Personal Care and Health
Health insurance (not included in the old CPI market basket).
Group 1 (part):
Food
Cost of grinding grain to make flour.
204
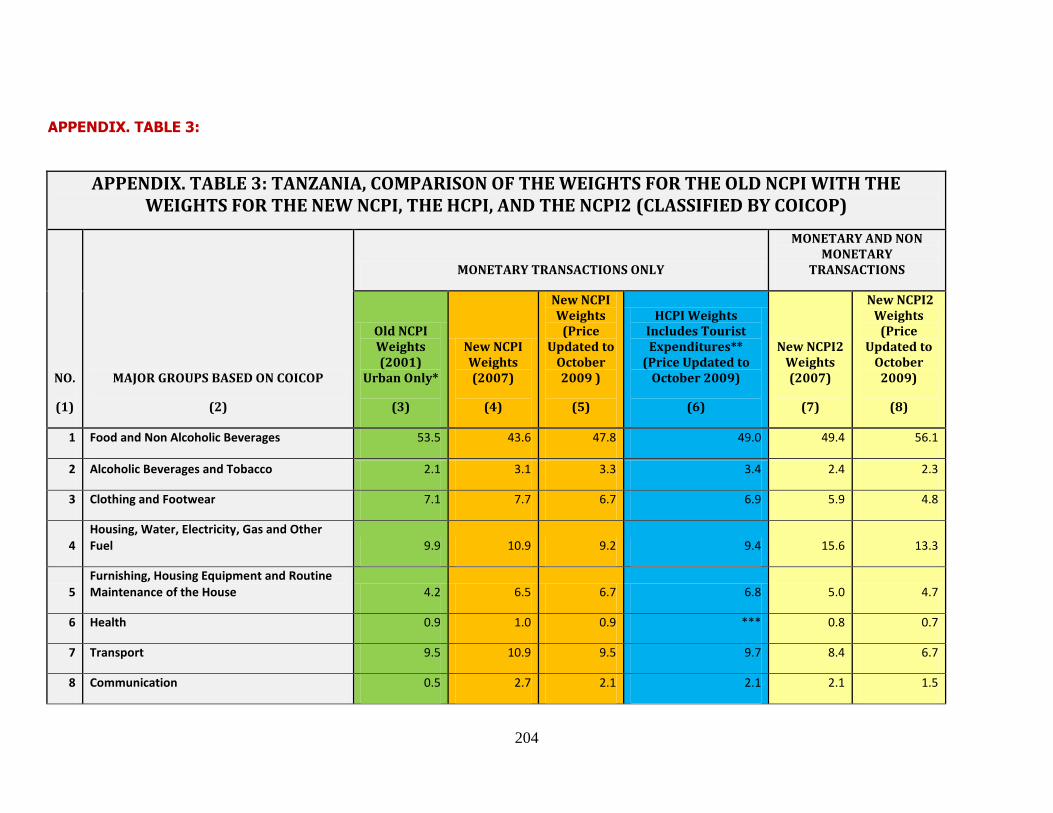
APPENDIX. TABLE 3:
APPENDIX. TABLE 3: TANZANIA, COMPARISON OF THE WEIGHTS FOR THE OLD NCPI WITH THE WEIGHTS FOR THE NEW NCPI, THE HCPI, AND THE NCPI2 (CLASSIFIED BY COICOP)
NO.
(1)
MAJOR GROUPS BASED ON COICOP
(2)
MONETARY TRANSACTIONS ONLY
MONETARY AND NON MONETARY
TRANSACTIONS
Old NCPI Weights (2001)
Urban Only*
(3)
New NCPI Weights (2007)
(4)
New NCPI Weights
(Price Updated to
October 2009 )
(5)
HCPI Weights Includes Tourist Expenditures**
(Price Updated to October 2009)
(6)
New NCPI2 Weights (2007)
(7)
New NCPI2 Weights
(Price Updated to
October 2009)
(8)
1 Food and Non Alcoholic Beverages 53.5 43.6 47.8 49.0 49.4 56.1
2 Alcoholic Beverages and Tobacco 2.1 3.1 3.3 3.4 2.4 2.3
3 Clothing and Footwear 7.1 7.7 6.7 6.9 5.9 4.8
4 Housing, Water, Electricity, Gas and Other Fuel 9.9 10.9 9.2 9.4 15.6 13.3
5 Furnishing, Housing Equipment and Routine Maintenance of the House 4.2 6.5 6.7 6.8 5.0 4.7
6 Health 0.9 1.0 0.9 *** 0.8 0.7
7 Transport 9.5 10.9 9.5 9.7 8.4 6.7
8 Communication 0.5 2.7 2.1 2.1 2.1 1.5

214
9 Recreation and Culture 0.9 1.4 1.3 1.4 1.1 0.9
10 Education 1.8 1.5 1.7 *** 1.2 1.2
11 Restaurants and hotels 7.4 5.8 6.4 6.7 4.5 4.6
12 Miscellaneous goods and services 2.1 4.9 4.5 4.7 3.8 3.2
TOTAL 100.0 100.0 100.0 100.0 100.0 100.0
* The old NCPI was based on market basket weights derived from urban household expenditures only. All other data in the table are for both urban and rural households.
** Tourist expenditures on HCPI weights are in Transport, Recreation and Culture, Accommodation Service, and Restaurants and Hotels.
*** Stage One implementation of HCPI excludes Health and Education.

23
APPENDIX TABLE 4: NCPI linked index series, December 2001- October 2010
(September 2010=100)
LINKED NATIONAL CONSUMER PRICE INDEX FROM DECEMBER, 2001 TO OCTOBER, 2010
PERIOD
(Col 1)
Old NCPI Dec
2001=100
(Col 2)
Old NCPI September 2010=100
(Col 3)
New NCPI September 2010=100
(Col 4)
Linked NCPI
September 2010 = 100
(Col 5)
Linked NCPI
1 Month Percent Change
(Col 6)
Linked NCPI
12 Month Percent Change
(Col 7)
Dec-01 100.00 55.19 55.19
Dec-02 107.32 59.23 59.23 1.9 7.3
Dec-03 113.31 62.53 62.53 1.7 5.6
Dec-04 118.53 65.41 65.41 0.4 4.6
Dec-05 125.54 69.28 69.28 1.7 5.9
Dec-06 133.90 73.90 73.90 2.1 6.7
Dec-07 142.47 78.62 78.62 1.3 6.4
Dec-08 161.70 89.24 89.24 2.3 13.5
Jan-09 166.40 91.83 91.83 2.9 12.9
Feb-09 169.29 93.43 93.43 1.7 13.3
Mar-09 170.30 93.98 93.98 0.6 13.0
Apr-09 169.70 93.65 93.65 -0.4 12.0
May-09 168.80 93.16 93.16 -0.5 11.3
Jun-09 168.10 92.77 92.77 -0.4 10.7
Jul-09 168.90 93.21 93.21 0.5 10.9
Aug-09 169.60 93.60 93.60 0.4 12.1
Sep-09 173.40 95.70 95.70 2.2 12.1
Oct-09 175.30 96.74 95.88 96.74 1.1 12.7
Nov-09 177.70 98.07 94.96 98.07 1.4 12.5
Dec-09 181.50 100.17 96.35 100.17 2.1 12.2
Jan-10 184.50 101.82 97.82 101.82 1.7 10.9

24
Feb-10 185.60 102.43 98.99 102.43 0.6 9.6
Mar-10 185.70 102.48 99.90 102.48 0.1 9.0
Apr-10 185.60 102.43 100.47 102.43 -0.1 9.4
May-10 182.20 100.55 100.12 100.55 -1.8 7.9
Jun-10 180.20 99.45 99.89 99.45 -1.1 7.2
Jul-10 179.50 99.06 99.56 99.06 -0.4 6.3
Aug-10 180.80 99.78 99.94 99.78 0.7 6.6
Sep-10 181.20 100.00 100.00 100.00 0.2 4.5
Oct-10 99.90 99.90 -0.1 4.2
DESCRIPTION OF TABLE 4: TANZANIA, LINKING THE OLD NCPI TO THE NEW NCPI AT THE ALL ITEMS LEVEL
Table 4 presents the linked NCPI at the all items level. The old NCPI (December 2001=100) is
found in Column 2. Although monthly indices are available for the entire period, only the
December index values are presented for the years 2001 through 2008. In Column 3 the index
values for the old NCPI have been rebased to September 2010=100. September 2010 is the
link month as well as the reference base for the new index. It should be noted that this type of
rebasing, where only the reference base of the index series is changed, does not have any
effect on the percent changes reflected by the index series. Column 4 contains the new NCPI
with a reference base of September 2010=100. Since both the old NCPI in Column 3 and the
new NCPI in Column 4 have the same reference base, both index series have the index value
of 100.00 in September 2010. By taking advantage of this fact the linked NCPI that appears in
Column 5 can be constructed by simply splicing the two index series together at the link month
of September 2010.
Columns 6 and 7 contain the 1 month and 12 month percent changes respectively for the linked
NCPI. The 1 month changes can be obtained directly from the linked index series since the
linked series is continuous for monthly price change. The 12 month changes for the old NCPI
can also be obtained from the linked index series up through September 2010. However, in
order to obtain the 12 month changes after September 2010 it necessary to use the index
values from the new NCPI found in Column 4. This will ensure that the 12 month percent
changes are based on the same index weights. It is for this reason precisely that there is a 12
month overlap period for the old and the new NCPI. However, it is important to note that the
official index for Tanzania is the old NCPI up through September 2010, and the new NCPI
beginning in October 2010.


