

Metso’s Financial Statements Review for 2015January 1 – December 31, 2015
Financial Statements
Review 2015
Metso’s Financial Statements ReviewJanuary 1 – December 31, 2015
Figures in brackets refer to the corresponding period in 2014, unless other-
wise stated. The Process Automation Systems (PAS) business was divested
on April 1, 2015, and is not included in the Flow Control segment’s figures
for April–December 2015. Figures for 2014 and all comparison periods prior
to the divestment include PAS. Like-for-like comparisons are made with a
separate note.
Fourth-quarter 2015 in brief • Orders received EUR 758 million (EUR 801 million, or EUR 721 million excluding PAS), of which
EUR 440 million (EUR 481 million, or EUR 446 million excluding PAS) were services orders.
• Net sales EUR 754 million (EUR 1,018 million, or EUR 921 million excluding PAS), of which EUR 481 million services (EUR 572 million, or EUR 525 million excluding PAS).
• EBITA before non-recurring items EUR 91 million and 12.0% of net sales (EUR 138 million and 13.5%, or EUR 120 million and 13.0% excluding PAS).
Full-year 2015 in brief • Weak economic growth in emerging markets and low commodity prices had a negative
impact on the demand for capital equipment in the mining and oil & gas industries.
• Orders received EUR 3,027 million (EUR 3,409 million), or EUR 2,965 million (EUR 3,074 million) excluding PAS. Services orders totaled EUR 1,913 million (EUR 2,052 million), or EUR 1,879 million (EUR 1,910 million) excluding PAS.
• Net sales EUR 2,977 million (EUR 3,658 million), or EUR 2,923 million (EUR 3,363 million) excluding PAS. Services net sales totaled EUR 1,869 million (EUR 2,007 million) or EUR 1,840 million (EUR 1,869 million) excluding PAS.
• EBITA before non-recurring items EUR 347 million and 11.7 percent of net sales (EUR 460 million and 12.6%), or EUR 356 million and 12.2 percent (EUR 426 million and 12.7%) excluding PAS.
• Strong free cash flow of EUR 341 million (EUR 204 million).
• Divestment of the Process Automation Systems business resulted in a gain of EUR 252 million.
• Earnings per share EUR 2.95 (EUR 1.25).
• Strong balance sheet with gearing of 10.6 percent (45.6%).
• The Board will propose to the AGM a dividend of EUR 1.05 (EUR 1.05 and extra dividend of EUR 0.40).
2
Metso’s Financial Statements Review for 2015
Outlook for 2016Metso has changed its guidance policy and will discontinue publishing financial guidance as of the beginning of 2016. Instead of numerical financial guidance on the development of our net sales and profitability, we will share our views on the overall trading conditions, expected demand develop-ment in our end markets, as well as some financial information, such as expected capital expenditure and restructuring costs during the current financial year.
Metso’s overall trading conditions are expected to weaken somewhat in 2016 compared to 2015. Demand for our products and services is expected to develop as follows:
• remain weak for mining equipment and satisfactory for mining services
• remain satisfactory for aggregates equipment and services
• remain satisfactory for Flow Control products related to customers’ new investments and good for Flow Control services
We expect to invoice EUR 1.1 billion from our year-end 2015 backlog during 2016. Internal efficiency actions will continue to improve competitiveness and mitigate price pressure that can be seen in the markets that are facing weak or satisfactory demand. Restructuring costs are expected to be lower than in 2015. Capital expenditure without acquisitions and net financial costs are expected to be on the same level as in 2015.
3
Metso’s Financial Statements Review for 2015
EUR millionQ4/
2015Q4/
2014 Change % 2015 2014 Change %
Orders received 758 801 -5 3,027 3,409 -11
Services orders 440 481 -9 1,913 2,052 -7
% of orders received 58 60 63 60
Order backlog at the end of the year 1,268 1,575 -19
Net sales 754 1,018 -26 2,977 3,658 -19
Services net sales 481 572 -16 1,869 2,007 -7
% of net sales 64 56 63 55
Earnings before interest, tax and amortization (EBITA) and non-recurring items 91 138 -34 347 460 -25
% of net sales 12.0 13.5 11.7 12.6
Operating profit* 67 101 -33 555 351 58
% of net sales 8.9 9.9 18.7 9.6
Earnings per share, EUR 0.35 0.36 -3 2.95 1.25 136
Free cash flow 59 63 -6 341 204 67
Return on capital employed (ROCE) before taxes ** 25.7 16.4
Equity-to-asset ratio at the end of the year, % 48.3 40.5
Net gearing at the end of the year, % 10.6 45.6
Personnel at the end of the year 12,375 15,644 -21
Key figures
President and CEO Matti Kähkönen:
Last year we achieved fairly good results overall, despite a weaken-ing demand in many of our end markets. Our profitability (EBITA margin before non-recurring items) remained on a good level, 12.2 percent compared to 12.7
percent in 2014, while orders and net sales declined. These figures do not include the divested PAS business. The gain from the PAS divestment increased our operating profit (EBIT) to EUR 555 million and earnings per share to EUR 2.95. I would also want to highlight the substantial progress in Metso’s safety culture, seen in the decreasing number of work-related incidents. The number of recorded incidents decreased by 28 percent from the previous year, and the incident frequency rate was 2.6 com-pared to 3.9 in 2014.
We also continued to make good progress in making Metso an increasingly better and more competitive com-
pany. We have renewed our product and services offering to meet our customers’ changing needs, and we have imple-mented new business models so that our organizations are structurally lighter, responsibilities are clear in all areas, and we are generally more flexible in reacting to changes in the business environment.
This report features our renewed guidance policy, which follows industry practice. Metso is today a product and services-focused company, with less internal volatility than before. From this perspective this change is a natural step for us and independent of prevailing market conditions. Our renewed market outlook statement will provide the capital markets with sufficient information to form a justified opin-ion on Metso’s future development.
Thanks to our motivated personnel, competitive services, product offering, flexible operating models, strong balance sheet and financial position, I am confident that we will con-tinue to do well in 2016 and beyond.
Figures for full-year 2015, Q4/2014 and full-year 2014 include Process Automation Systems. * Operating profit for full-year 2015 includes the gain on the disposal of the PAS business.** ROCE for full-year 2015 includes the gain on the disposal of the PAS business.
4
Metso’s Financial Statements Review for 2015

Operating environment in 2015
Activity in our customer industries remained challenging in 2015, due to declining commodity prices and weaker eco-nomic growth in China and other emerging markets. Demand for mining equipment remained weak and general trading conditions were roughly unchanged throughout the year. Customers’ cost saving initiatives had some adverse effect on our mining services in some regions, but overall activity remained fairly stable with significant differences between market areas. Demand for aggregates equipment and ser-vices deteriorated from the previous year, primarily due to the slowdown in emerging markets. The demand for valves for new capex projects in the oil & gas industry was lower compared to the previous year, but this was somewhat offset by the stable demand in other process industries. The demand for services was also stable.
Full-year 2015 orders and order backlog
Mainly as a result of the divestment of PAS, the Group’s orders declined 11 percent and totaled EUR 3,027 million (EUR 3,409 million) in 2015. Services orders declined 7 percent and totaled EUR 1,913 million (EUR 2,052 million). Minerals’ orders decreased 4 percent, while Flow Control’s orders were down 27 percent as a result of the divestment of PAS. Excluding PAS, the Group’s order intake in 2015 declined 4 percent from 2014, mainly due to declining orders for aggregates equipment and services. Excluding PAS, Flow Control’s orders declined 2 percent. The order backlog at the end of December 2015 totaled EUR 1,268 million (EUR 1,575 million, or EUR 1,400 million excluding PAS), and we expect 88 percent of the backlog to be delivered in 2016. The current market environment will continue to pose risks to the delivery of orders in the backlog.
Full-year 2015 net sales and financial performance
Net sales in 2015 decreased to EUR 2,977 million (EUR 3,658 million), and services accounted for 63 percent of net sales or EUR 1,869 million (EUR 2,007 million). Excluding PAS, full-year net sales totaled EUR 2,923 million (EUR 3,363 million). Minerals’ net sales decreased 18 percent primarily due to lower equip-ment sales. Flow Control’s net sales decreased 21 percent due to the divestment of PAS. Excluding PAS, Flow Control’s net sales grew 6 percent.
EBITA before non-recurring items declined 25 percent and was EUR 347 million (EUR 460 million) or 11.7 percent of net sales (12.6%). The decline was due to the PAS divestment as well as the lower net sales of mining and aggregates equipment.
Operating profit (EBIT) in 2015 totaled EUR 555 million or 18.7 percent of net sales (EUR 351 million and 9.6%). Non-recurring items totaled EUR 226 million in 2015 (EUR -90 million), of which EUR 252 million is attributable to the gain on the divestment of PAS. Non-recurring items are detailed in the tables section.
Net financing expenses in 2015 were EUR 39 million (EUR 69 million). Interest expenses accounted for EUR 28 million (EUR 38 million), interest income for EUR 8 million (EUR 9 million), for-eign exchange losses for EUR 4 million (EUR 5 million loss), and other net financial expenses for EUR 15 million (EUR 35 million).
Profit before taxes was EUR 516 million (EUR 282 million) in 2015. The effective tax rate for 2015 was 14 percent (33%). The low rate was a result of the tax exempt gain from the PAS divest-ment. The operational tax rate for 2015 was around 30 percent. Net cash generated by operating activities totaled EUR 360 mil-lion (EUR 256 million) and free cash flow was EUR 341 million (EUR 204 million). Earnings per share totaled EUR 2.95 (EUR 1.25).
EUR millionQ4/
2015Q4/
2014 Change % 2015 2014 Change %
Orders received 758 721 5 2,965 3,074 -4
Services orders 440 446 -1 1,879 1,910 -2
Net sales 754 921 -18 2,923 3,363 -13
Services net sales 481 525 -9 1,840 1,869 -2
Earnings before interest, tax and amortization (EBITA) and non-recurring items 91 120 -24 356 426 -16
% of net sales 12.0 13.0 12.2 12.7
Return on capital employed (ROCE) before taxes, % 16.1 -
Personnel at the end of the year 12,375 14,072 -12
Key Figures excluding PAS
5
Metso’s Financial Statements Review for 2015
Q4/2015 Change %
Q4/2015Change % using
constant rates2015
Change %
2015Change % using
constant rates
Minerals 8 8 -4 -7
Services business -3 -1 -2 -5
Flow Control -3 -8 -2 -9
Services business 4 5 1 -3
Metso total 5 4 -4 -7
Services business -1 0 -2 -4
Currency impact on orders receivedcompared to the same period in 2014 and according to the current Group structure
Currency impact on net salescompared to the same period in 2014 and according to the current Group structure
Q4/2015 Change %
Q4/2015Change % using
constant rates2015
Change %
2015Change % using
constant rates
Minerals -23 -22 -18 -20
Services business -11 -8 -3 -4
Flow Control 4 -1 6 -2
Services business 0 -2 2 -2
Metso total -18 -18 -13 -16
Services business -9 -7 -2 -4
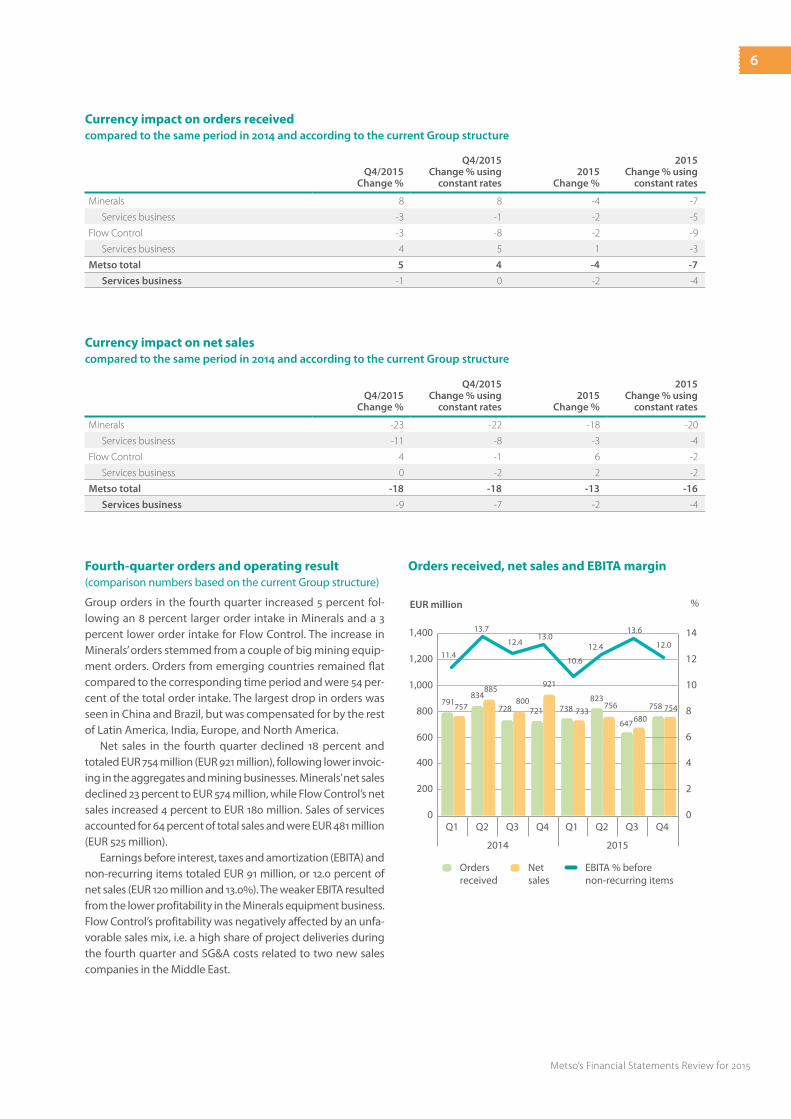
Fourth-quarter orders and operating result (comparison numbers based on the current Group structure)
Group orders in the fourth quarter increased 5 percent fol-lowing an 8 percent larger order intake in Minerals and a 3 percent lower order intake for Flow Control. The increase in Minerals’ orders stemmed from a couple of big mining equip-ment orders. Orders from emerging countries remained flat compared to the corresponding time period and were 54 per-cent of the total order intake. The largest drop in orders was seen in China and Brazil, but was compensated for by the rest of Latin America, India, Europe, and North America.
Net sales in the fourth quarter declined 18 percent and totaled EUR 754 million (EUR 921 million), following lower invoic-ing in the aggregates and mining businesses. Minerals’ net sales declined 23 percent to EUR 574 million, while Flow Control’s net sales increased 4 percent to EUR 180 million. Sales of services accounted for 64 percent of total sales and were EUR 481 million (EUR 525 million).
Earnings before interest, taxes and amortization (EBITA) and non-recurring items totaled EUR 91 million, or 12.0 percent of net sales (EUR 120 million and 13.0%). The weaker EBITA resulted from the lower profitability in the Minerals equipment business. Flow Control’s profitability was negatively affected by an unfa-vorable sales mix, i.e. a high share of project deliveries during the fourth quarter and SG&A costs related to two new sales companies in the Middle East.
0Q1
200
400
600
800
1,000
1,200
1,400
EUR million
791
Orders received
Net sales
EBITA % beforenon-recurring items
0
2
4
6
8
10
12
14
%
757834
885
728800
721
921
738 733
823756
11.4
13.7
12.413.0
10.6
12.4
Q2 Q3 Q4
647680
13.6
2014
Q1 Q2 Q3 Q4
2015
758 754
12.0
Orders received, net sales and EBITA margin
6
Metso’s Financial Statements Review for 2015
Financial position
Continued focus on capital efficiency resulted in a decline in net working capital. This decline was largely attributed to invento-ries and receivables and had a EUR 64 million positive impact on the Group’s cash flow (EUR 75 million negative impact) in 2015.
Metso’s liquidity position remains solid. Total cash assets at the end of 2015 were EUR 657 million (EUR 292 million), of which EUR 67 million (EUR 13 million) was invested in financial instru-ments with an initial maturity exceeding three months, and the remaining EUR 590 million (EUR 279 million) is accounted for as cash and cash equivalents. Metso has a committed EUR 500 million revolving credit facility, which is undrawn.
The Group’s balance sheet remains strong. Net interest-bearing liabilities totaled EUR 153 million at the end of Decem-ber (EUR 561 million) and gearing was 10.6 percent (45.6%). The equity-to-asset ratio was 48.3 percent (40.5%).
In September 2015, Metso decided to continue with only one rating service provider. After evaluation, the rating relation-ship with Moody’s Investor Service ended and cooperation with Standard & Poor’s Ratings Services continued. Moody’s future ratings will be based on publicly available information only. There were no changes in our credit rating during the report-ing period.
Standard & Poor’s Ratings Services latest rating dated April 2015: long-term corporate credit rating BBB and short-term A-2, outlook stable.
Capital expenditure
Gross capital expenditure in 2015, excluding business acquisi-tions, was EUR 46 million (EUR 74 million). Maintenance invest-ments accounted for 80 percent, i.e. EUR 36 million (81% and EUR 60 million). Capital expenditure in 2016 is expected to be on the same level as in 2015.
7
Metso’s Financial Statements Review for 2015
Reporting Segments
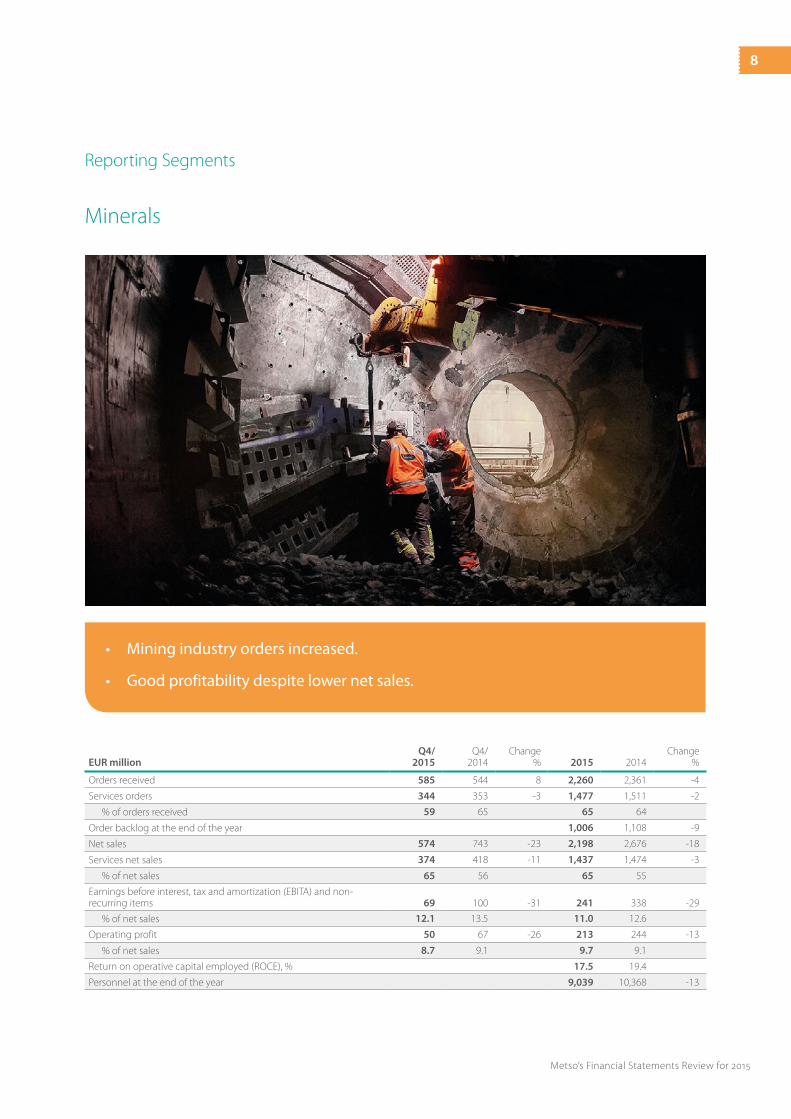
Minerals
EUR millionQ4/
2015Q4/
2014Change
% 2015 2014Change
%
Orders received 585 544 8 2,260 2,361 -4
Services orders 344 353 -3 1,477 1,511 -2
% of orders received 59 65 65 64
Order backlog at the end of the year 1,006 1,108 -9
Net sales 574 743 -23 2,198 2,676 -18
Services net sales 374 418 -11 1,437 1,474 -3
% of net sales 65 56 65 55
Earnings before interest, tax and amortization (EBITA) and non-recurring items 69 100 -31 241 338 -29
% of net sales 12.1 13.5 11.0 12.6
Operating profit 50 67 -26 213 244 -13
% of net sales 8.7 9.1 9.7 9.1
Return on operative capital employed (ROCE), % 17.5 19.4
Personnel at the end of the year 9,039 10,368 -13
• Miningindustryordersincreased.
• Goodprofitabilitydespitelowernetsales.
8
Metso’s Financial Statements Review for 2015
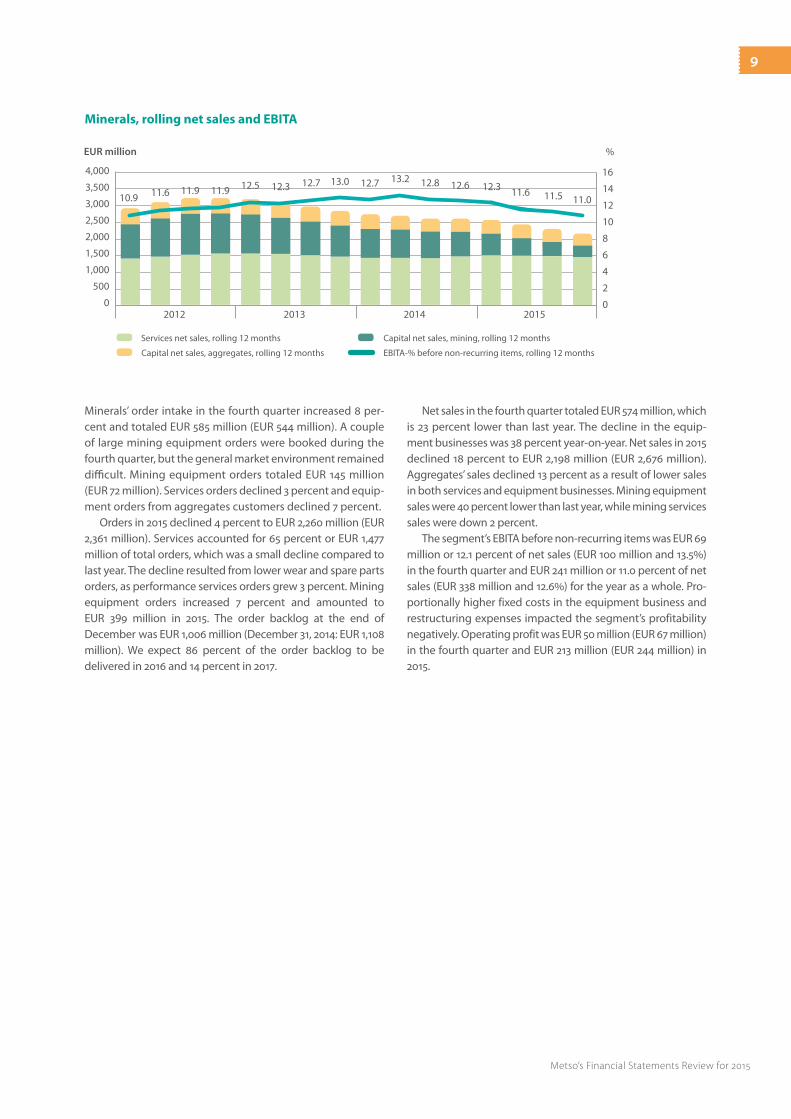
Minerals’ order intake in the fourth quarter increased 8 per-cent and totaled EUR 585 million (EUR 544 million). A couple of large mining equipment orders were booked during the fourth quarter, but the general market environment remained difficult. Mining equipment orders totaled EUR 145 million (EUR 72 million). Services orders declined 3 percent and equip-ment orders from aggregates customers declined 7 percent.
Orders in 2015 declined 4 percent to EUR 2,260 million (EUR 2,361 million). Services accounted for 65 percent or EUR 1,477 million of total orders, which was a small decline compared to last year. The decline resulted from lower wear and spare parts orders, as performance services orders grew 3 percent. Mining equipment orders increased 7 percent and amounted to EUR 399 million in 2015. The order backlog at the end of December was EUR 1,006 million (December 31, 2014: EUR 1,108 million). We expect 86 percent of the order backlog to be delivered in 2016 and 14 percent in 2017.
Net sales in the fourth quarter totaled EUR 574 million, which is 23 percent lower than last year. The decline in the equip-ment businesses was 38 percent year-on-year. Net sales in 2015 declined 18 percent to EUR 2,198 million (EUR 2,676 million). Aggregates’ sales declined 13 percent as a result of lower sales in both services and equipment businesses. Mining equipment sales were 40 percent lower than last year, while mining services sales were down 2 percent.
The segment’s EBITA before non-recurring items was EUR 69 million or 12.1 percent of net sales (EUR 100 million and 13.5%) in the fourth quarter and EUR 241 million or 11.0 percent of net sales (EUR 338 million and 12.6%) for the year as a whole. Pro-portionally higher fixed costs in the equipment business and restructuring expenses impacted the segment’s profitability negatively. Operating profit was EUR 50 million (EUR 67 million) in the fourth quarter and EUR 213 million (EUR 244 million) in 2015.
Minerals, rolling net sales and EBITA
Services net sales, rolling 12 months Capital net sales, mining, rolling 12 months
EBITA-% before non-recurring items, rolling 12 monthsCapital net sales, aggregates, rolling 12 months
0
2
4
6
8
10
12
14
0
500
1,000
1,500
2,000
2,500
3,000
3,500
4,000
%EUR million
2012 2013 2014 2015
10.9 11.6 11.9 11.9 12.5 12.3 12.7 13.0 12.7 13.2 12.8 12.6 12.3 11.6 11.5 11.0
16
9
Metso’s Financial Statements Review for 2015
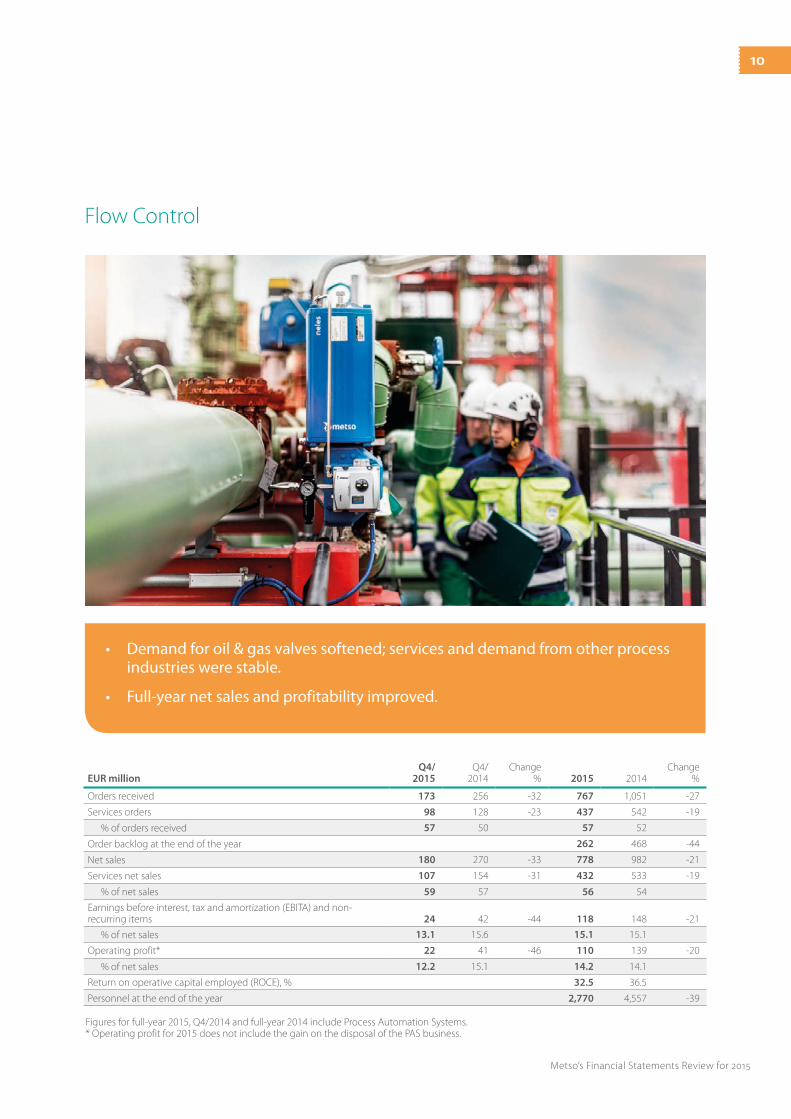
Flow Control
• Demandforoil&gasvalvessoftened;servicesanddemandfromotherprocessindustries were stable.
• Full-yearnetsalesandprofitabilityimproved.
Figures for full-year 2015, Q4/2014 and full-year 2014 include Process Automation Systems. * Operating profit for 2015 does not include the gain on the disposal of the PAS business.
EUR millionQ4/
2015Q4/
2014Change
% 2015 2014Change
%
Orders received 173 256 -32 767 1,051 -27
Services orders 98 128 -23 437 542 -19
% of orders received 57 50 57 52
Order backlog at the end of the year 262 468 -44
Net sales 180 270 -33 778 982 -21
Services net sales 107 154 -31 432 533 -19
% of net sales 59 57 56 54
Earnings before interest, tax and amortization (EBITA) and non-recurring items 24 42 -44 118 148 -21
% of net sales 13.1 15.6 15.1 15.1
Operating profit* 22 41 -46 110 139 -20
% of net sales 12.2 15.1 14.2 14.1
Return on operative capital employed (ROCE), % 32.5 36.5
Personnel at the end of the year 2,770 4,557 -39
10
Metso’s Financial Statements Review for 2015
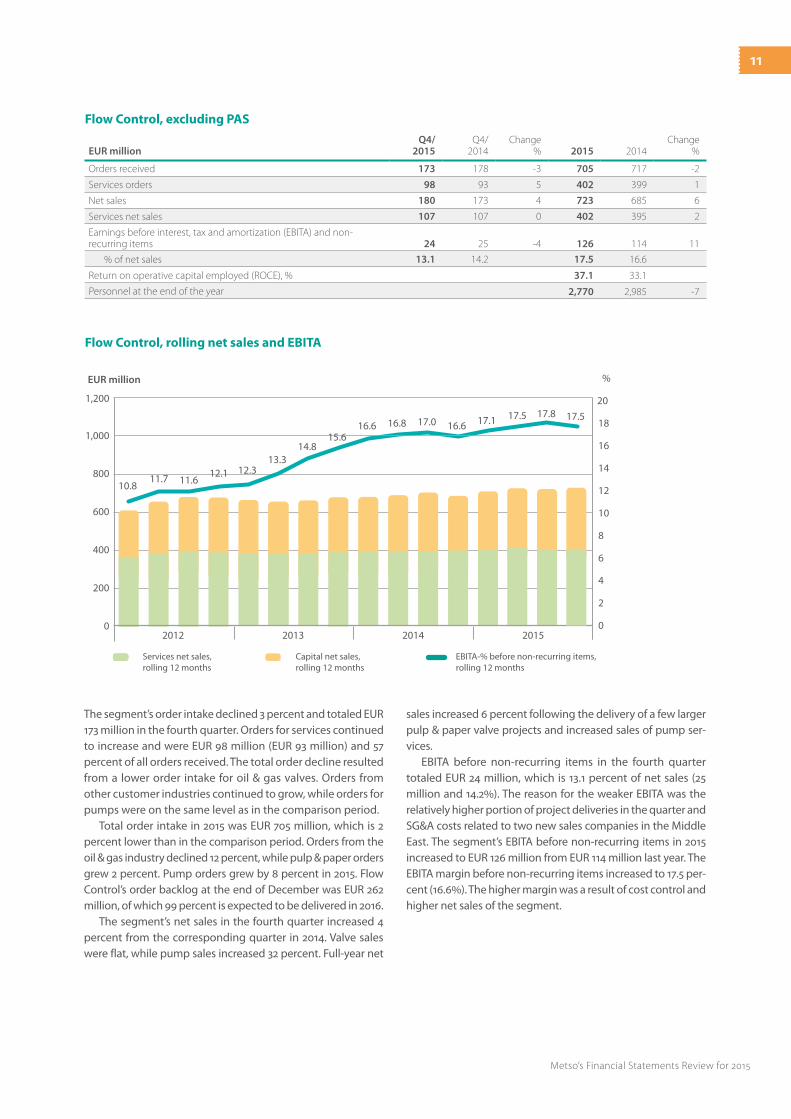
The segment’s order intake declined 3 percent and totaled EUR 173 million in the fourth quarter. Orders for services continued to increase and were EUR 98 million (EUR 93 million) and 57 percent of all orders received. The total order decline resulted from a lower order intake for oil & gas valves. Orders from other customer industries continued to grow, while orders for pumps were on the same level as in the comparison period.
Total order intake in 2015 was EUR 705 million, which is 2 percent lower than in the comparison period. Orders from the oil & gas industry declined 12 percent, while pulp & paper orders grew 2 percent. Pump orders grew by 8 percent in 2015. Flow Control’s order backlog at the end of December was EUR 262 million, of which 99 percent is expected to be delivered in 2016.
The segment’s net sales in the fourth quarter increased 4 percent from the corresponding quarter in 2014. Valve sales were flat, while pump sales increased 32 percent. Full-year net
sales increased 6 percent following the delivery of a few larger pulp & paper valve projects and increased sales of pump ser-vices.
EBITA before non-recurring items in the fourth quarter totaled EUR 24 million, which is 13.1 percent of net sales (25 million and 14.2%). The reason for the weaker EBITA was the relatively higher portion of project deliveries in the quarter and SG&A costs related to two new sales companies in the Middle East. The segment’s EBITA before non-recurring items in 2015 increased to EUR 126 million from EUR 114 million last year. The EBITA margin before non-recurring items increased to 17.5 per-cent (16.6%). The higher margin was a result of cost control and higher net sales of the segment.
Flow Control, rolling net sales and EBITA
EUR millionQ4/
2015Q4/
2014Change
% 2015 2014Change
%
Orders received 173 178 -3 705 717 -2
Services orders 98 93 5 402 399 1
Net sales 180 173 4 723 685 6
Services net sales 107 107 0 402 395 2
Earnings before interest, tax and amortization (EBITA) and non-recurring items 24 25 -4 126 114 11
% of net sales 13.1 14.2 17.5 16.6
Return on operative capital employed (ROCE), % 37.1 33.1
Personnel at the end of the year 2,770 2,985 -7
Flow Control, excluding PAS
0
200
400
600
800
%EUR million
2012 2013 2014 2015
10.811.7 11.6
12.1 12.313.3
14.815.6
16.6 16.8 17.0 16.6 17.1
0
2
4
6
8
10
12
14
16
1817.5
1,000
2017.8
1,200
Services net sales, rolling 12 months
EBITA-% before non-recurring items,rolling 12 months
Capital net sales, rolling 12 months
17.5
11
Metso’s Financial Statements Review for 2015
Divestments
On April 1, 2015 Metso closed the disposal of Process Auto-mations Systems (PAS) business. The PAS business included process automation solutions for pulp, paper and power industries, covering automation and quality control systems, analyzers and measurements and related services and was reported in Metso’s Flow Control segment. PAS had 1,657 employees and annual net sales of around EUR 300 million. The final cash consideration was EUR 312 million and Metso booked a gain of EUR 252 million on the transaction in its sec-ond quarter results.
On April 13, 2015, Metso completed the divestment of its Tampere foundry in Finland to the Finnish company TEVO Oy. In conjunction with the sale, the foundry’s 130 employees trans-ferred to TEVO. The divestment was treated as a sale of fixed assets.
Research and technology development
Metso’s research and technology development (RTD) network encompasses approximately 20 units around the world. Metso actively develops and protects new technologies, processes, and service solutions, and the RTD network made 93 (141) invention disclosures during 2015, resulting in 21 (33) priority patent applications. As of the end of 2015, 293 (428) Metso inventions were protected by patents. Research and devel-opment expenses in 2015 totaled EUR 40 million, which is 1.3 percent of net sales (EUR 59 million and 1.6%). The decline from last year was a result of the divestment of PAS. Expenses related to intellectual property rights amounted to EUR 2 mil-lion in 2015 (EUR 3 million).
Minerals continued its strategic research and development program with a target of creating the next-generation miner-als concentrator technology together with partners. New solu-tions for improving the efficiency of mining operations were developed. For example, a new mill drive system is cost efficient to install, operate and maintain. Several new solutions were launched for the aggregates industry. These included a new Nordberg® NP13(TM) impact crusher and a Nordberg® HP5(TM) high-performance cone crusher. Metso also introduced two new screening product ranges, Metso PREMIER Screens(TM) and Metso COMPACT Screens(TM), to serve different customers’ unique needs. Minerals’ Services business focused on devel-oping new wear solutions, spare parts, performance services, and a life-cycle services offering globally close to our custom-ers. Metso expanded the Megaliner(TM) mill lining concept to include grinding mill heads. A new maintenance platform was developed for changing jaw crusher wear parts. These solutions are examples of increasing safety, decreasing downtime and improving the efficiency of services.
Flow Control’s valve business made several product releases to improve safety and energy efficiency for our oil and gas cus-tomers. A new high-pressure ball valve (XH) was released to give customers a safe and reliable solution for multiple high-pres-sure applications. For industrial gas applications, a new energy-saving, metal-seated butterfly valve for cryogenic and oxygen services (BWX) was released. The intelligent positioner portfolio was expanded with a new NDX valve controller that is specially designed from a globe valve operation point of view. The NDX
features reliable and safe functionality. It is extremely fast and easy to install and enables huge time savings when commis-sioning a valve. Flow Control’s pump business, launched mill discharge metal and rubber-lined slurry pumps with the latest hydraulic technology, and specifically sized for today’s larger mills. These massive pumps are offered with high chrome iron or rubber-lined wear components and are designed to have higher operational efficiency.
Health, safety and environment
Prioritizing the health, safety and wellbeing of our employees, customers and partners in all our operations is fundamental to everyone at Metso. Our goal is to guarantee a safe working environment for our employees, and we are committed to taking the right actions. Metso’s safety culture has improved significantly, which can been seen in the decrease in work-related incidents.
During 2015 we were able to cut the number of recordable incidents by 28 % compared to 2014. LTIF (lost-time incident frequency) in 2015 was 2.6 (3.9) – the target being less than one. LTIF reflects the number of incidents resulting in an absence of at least one workday per million hours worked. Metso’s long-term target is zero work-related incidents.
We put special focus on few specific proactive areas of safety in 2015. One is Metso HIRA, the hazard identification and risk assessment approach to identify, assess and control hazards. We also further developed our risk observation reporting and con-tinued our management training. In 2015 the focus of our yearly safety campaign, Metso safety pledge, was on safety conversa-tions. Safety conversations are general discussions about safety between a manager and employee. Our internal HSE audit was carried out in 22 locations.
Sustainable use of resources underpins the long-term suc-cess of our business. A global operating environment brings opportunities and risks that we must recognize throughout our value chain. We have Metso-wide targets to reduce water usage by 15% and waste by 15% by 2020. We have ambitious targets to significantly reduce the energy consumption and the carbon dioxide emissions of our own production.
Personnel
Metso had 12,375 employees at the end of December 2015. Minerals had 9,039 employees and Flow Control 2,770. The head office and support functions employed 566 persons. Compared to end of 2014, headcount declined by 1,329 in Minerals and by 1,787 in Flow Control, of which 1,657 is attrib-utable to the divestment of PAS. Personnel in emerging mar-kets accounted for 49 percent (50%). The average number of personnel in 2015 was 13,872.
12
Metso’s Financial Statements Review for 2015
Decisions of the Annual General Meeting
Metso’s Annual General Meeting was held on March 27, 2015, in Helsinki, Finland. The AGM approved the Financial State-ments for 2014 and discharged the members of the Board of Directors and the President and CEO from liability for the 2014 financial year.
The Annual General Meeting decided that a dividend of EUR 1.05 per share will be paid for the financial year ended on December 31, 2014. In addition, the Board of Directors was authorized to decide on the payment of an extra dividend of up to EUR 0.40 per share if the disposal of the Process Automa-tion Systems business to Valmet was completed. On July 24, the Board decided to use this authorization and the full extra dividend was paid on August 4, 2015.
The Annual General Meeting also approved the proposal of the Board of Directors to authorize the Board to decide on the repurchase of Metso shares. The Nomination Board’s Pro posals concerning Board members and their remuneration were also approved. Authorized Public Accountant Ernst & Young was elected as the company’s Auditor until the end of the next Annual General Meeting.
Board of Directors
The Annual General Meeting confirmed the number of Board members as seven and elected Mikael Lilius as Chairman of the Board and Christer Gardell as Vice Chairman. Wilson Brumer, Ozey K. Horton Jr., Lars Josefsson, Nina Kopola and Eeva Sipilä were re-elected for a new term. The term of office of Board members will last until the end of the next AGM.
The Board elected the members of its Audit Committee and the Remuneration and HR Committee as follows:
• Audit Committee consists of Eeva Sipilä (Chairman), Lars Josefsson and Nina Kopola.
• Remuneration and HR Committee consists of Mikael Lilius (Chairman), Christer Gardell and Ozey K. Horton Jr.
After the reporting period, on February 3, 2016, Metso Corporation’s Nomination Board announced that it will pro-pose to the next Annual General Meeting that the number of members of the Board of Directors will be seven and that Mikael Lilius, Christer Gardell, Wilson Brumer, Ozey K. Horton, Jr., Lars Josefsson and Nina Kopola will be re-elected as mem-bers of the Board of Directors and further that Peter Carlsson is elected as a new member. Mikael Lilius is proposed to be re-elected as the Chairman of the Board of Directors and Christer Gardell as the Vice-Chairman.
More information on the proposed Board members and independence assessment is available on company’s website at www.metso.com.
Changes in Metso’s Executive Team
Two appointments were made to Metso’s Executive Team on July 23, 2015, with immediate effect. Perttu Louhiluoto was appointed President, Services, and John Quinlivan was appointed President, Flow Control. The former President of Services, Juha Silvennoinen, did not continue in Metso.
With these appointments, Metso’s Executive Team consists of:
• Matti Kähkönen, President and CEO (Chairman of the Executive Team)
• Harri Nikunen, CFO and Deputy to the CEO • João Ney Colagrossi, President, Minerals • Perttu Louhiluoto, President, Services • John Quinlivan, President, Flow Control • Merja Kamppari, Senior Vice President, Human Resources • Simo Sääskilahti, Senior Vice President, Strategy and Business Development.
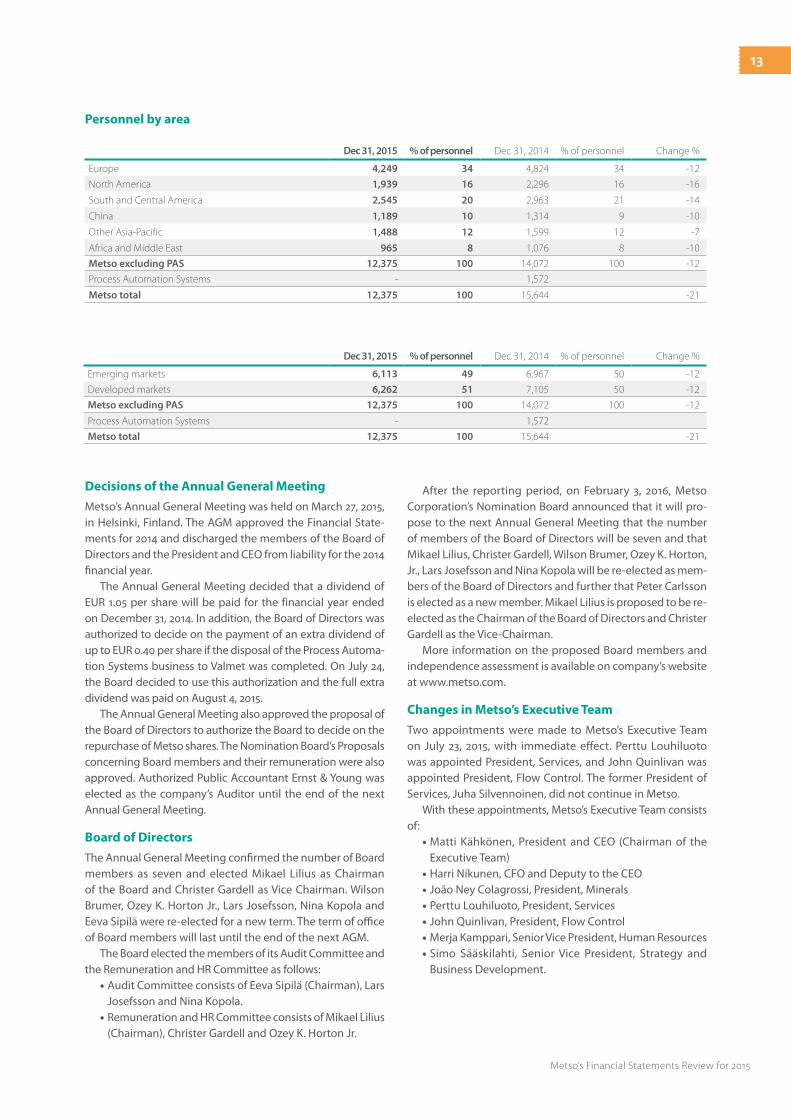
Dec 31, 2015 % of personnel Dec 31, 2014 % of personnel Change %
Europe 4,249 34 4,824 34 -12
North America 1,939 16 2,296 16 -16
South and Central America 2,545 20 2,963 21 -14
China 1,189 10 1,314 9 -10
Other Asia-Pacific 1,488 12 1,599 12 -7
Africa and Middle East 965 8 1,076 8 -10
Metso excluding PAS 12,375 100 14,072 100 -12
Process Automation Systems - 1,572
Metso total 12,375 100 15,644 -21
Personnel by area
Dec 31, 2015 % of personnel Dec 31, 2014 % of personnel Change %
Emerging markets 6,113 49 6,967 50 -12
Developed markets 6,262 51 7,105 50 -12
Metso excluding PAS 12,375 100 14,072 100 -12
Process Automation Systems - 1,572
Metso total 12,375 100 15,644 -21
13
Metso’s Financial Statements Review for 2015

Corporate Governance Statement
Metso will publish a separate Corporate Governance State-ment for 2015 that complies with the recommendations of the Finnish Corporate Governance Code for listed companies and also covers other central areas of corporate governance. The statement will be published on our website, separately from the Board of Directors’ Report.
Shares and share capital
On December 31, 2015, Metso Corporation’s share capital was EUR 140,982,843.80, and the total number of shares 150,348,256. At the end of 2015, Metso Corporation held a total of 363,718 of the company’s own shares, which represent 0.2 percent of all Metso shares and votes. Metso’s market capitalization at year-end, excluding shares held by the company, was EUR 3,105 million.
In 2015, 150,739,847 Metso shares were traded on the NAS-DAQ OMX Helsinki, equivalent to a turnover of EUR 3,640 million. Metso’s share price on the NASDAQ OMX Helsinki decreased 16
percent, from EUR 24.68 to EUR 20.70, in 2015. At the same time, the NASDAQ OMX Helsinki portfolio index, OMX Helsinki CAP, increased 11 percent. The highest quotation of Metso’s share on the NASDAQ OMX Helsinki in 2015 was EUR 29.55 and the lowest EUR 17.31. The average trading price for the year was EUR 24.15.
Metso’s ADS (American Depositary Shares) are traded in the United States on the International OTCQX market. The ADS price at year-end 2015 was USD 5.92. During 2015, the highest trading price for Metso’s ADS in the United States was USD 8.22 and the lowest USD 4.88.
Flaggings
Under the provisions of the Finnish Securities Markets Act, shareholders of listed companies have an obligation to notify both the Finnish Financial Supervision Authority and the listed company of changes in their holdings. Metso is not aware of any shareholders’ agreement regarding the Metso shares or voting rights.
Release date Flagging date Shareholder ThresholdNumber of
shares % of shares
Nov 30, 2015 Nov 26, 2015 BlackRock Inc. below 5% - -
Nov 16, 2015 Nov 12, 2015 BlackRock Inc. above 5% 7,524,136 5.0
Aug 20, 2015 Aug 19, 2015 BlackRock Inc. below 5% - -
June 23, 2015 June 18, 2015 BlackRock Inc. above 5% 7,674,531 5.1
June 11, 2015 June 11, 2015 BlackRock Inc. below 5% - -
March 27, 2015 March 23, 2015 BlackRock Inc. above 5% 7,524,029 5.0
March 12, 2015 March 11, 2015 BlackRock Inc. below 5% - -
March 12, 2015 March 10, 2015 BlackRock Inc. above 5% 7,528,875 5.0
Feb 6, 2015 Feb 6, 2015 Cevian Capital Partners Ltd. * above 10% 20,813,714 13.84
Feb 6, 2015 Feb 6, 2015 Cevian Capital II Masterfund * below 5% 0 0
*Transfer between funds. The transaction did not have any impact on the total amount of shares held by Cevian.
Flagging notifications in 2015
Share-based incentive plans
Metso’s share ownership plans are part of the remunera-tion and commitment program for management. All reward shares are acquired through public trading and do not have a diluting effect on share value. For further information, see our Corporate Governance Statement for 2015.
Events after the reporting period
On February 3, 2016, Eeva Sipilä, M.Sc. (Econ.), CEFA, was appointed Metso’s Chief Financial Officer (CFO) starting August 1, 2016. She joins Metso from Cargotec Corporation, where she has worked as Executive Vice President and CFO. Metso’s current CFO, Harri Nikunen, continues in his current role until the end of July, after which he takes on new respon-sibilities within the company.
Short-term business risks and market uncertainties
Uncertainties surrounding economic growth globally might affect our customer industries and weaken the demand for Metso’s products and services. A significant slowdown in global growth might further reduce market size and lead to tougher price competition. Our backlog, projects under nego-
tiation and other business operations might also be adversely affected by political turbulence seen, for example, in Eastern Europe, Russia and the Middle East.
A prolonged uncertainty in the Chinese economy might affect our business negatively through declining foreign invest-ments made in the country and falling commodity prices. Low commodity prices reduce the investment appetite and cut spending among our customers. This may cause projects to be postponed, delayed or discontinued. A tougher pricing envi-ronment also makes it harder to integrate increasing labor and manufacturing costs into our prices.
Exchange rate fluctuations are likely to increase with eco-nomic uncertainty, although the wide geographical scope of our operations reduces the impact of any individual currency. Metso Group hedges currency exposure linked to firm delivery and purchase agreements.
Economic uncertainty could lead to short-term financing deficits and indirect adverse effects on Metso’s operations due to our customers’ reduced investment appetite. Sufficient fund-ing and financing is crucial at all times in order to ensure the continuity of our own operations. Our current cash assets and funding are considered sufficient to secure liquidity and flex-ibility in the short and long run.
14
Metso’s Financial Statements Review for 2015
Helsinki, February 3, 2016
Metso Corporation’s Board of Directors
It should be noted that certain statements herein which are not historical facts, including, without limitation, those regarding expectations for general economic development and the market situation, expectations for customer industry profitability and investment willingness, expectations for company growth, development and profitability, and the realization of synergy benefits and cost savings, and statements preceded by “expects,” “estimates,” “forecasts” or similar expressions, are forward-looking statements. These statements are based on current decisions and plans and currently known factors. They involve risks and uncertainties that may cause the actual results to materially differ from the results currently expected by the company.
Such factors include, but are not limited to:(1) general economic conditions, including fluctuations in exchange
rates and interest levels, which influence the operating environment and profitability of customers and thereby the orders received by the company and their margins,
(2) the competitive situation, especially significant technological solutions developed by competitors,
(3) the company’s own operating conditions, such as the success of production, product development and project management and their continuous development and improvement,
(4) the success of pending and future acquisitions and restructuring.
Outlook for 2016
Metso has changed its guidance policy and will discontinue publishing financial guidance as of the beginning of 2016. Instead of numerical financial guidance on the development of our net sales and profitability, we will share our views on the overall trading conditions, expected demand development in our end markets, as well as some financial information, such as expected capital expenditure and restructuring costs during the current financial year.
Metso’s overall trading conditions are expected to weaken somewhat in 2016 compared to 2015. Demand for our products and services is expected to develop as follows:
• remain weak for mining equipment and satisfactory for mining services
• remain satisfactory for aggregates equipment and ser-vices
• remain satisfactory for Flow Control products related to customers’ new investments and good for Flow Control services
We expect to invoice EUR 1.1 billion from our year-end 2015 backlog during 2016. Internal efficiency actions will continue
to improve competitiveness and mitigate price pressure that can be seen in the markets that are facing weak or satisfactory demand. Restructuring costs are expected to be lower than in 2015. Capital expenditure without acquisitions and net financial costs are expected to be on the same level as in 2015.
Board of Directors’ proposal on the use of profit
The Company’s distributable funds on December 31, 2015, totaled EUR 917,679,762.79, of which the net profit for 2015 was EUR 543,811,588.67.
The Board of Directors proposes that a dividend of EUR 1.05 per share be paid based on the balance sheet to be adopted for the financial year, which ended December 31, 2015, and that the remaining portion of the profit is retained and included in the Company’s unrestricted equity.
Annual General Meeting 2016
Metso Corporation’s Annual General Meeting 2016 will be held on Monday, March 21, 2016 at the Finlandia Hall in Helsinki ( Mannerheimintie 13, FI-00100 Helsinki). The Board will convene the meeting by separate invitation.
15
Metso’s Financial Statements Review for 2015

EUR million 10-12/2015 10-12/2014 1-12/2015 1-12/2014
Net sales 754 1,018 2,977 3,658
Cost of goods sold -534 -719 -2,062 -2,579
Gross profit 220 299 915 1,079
Selling, general and administrative expenses -149 -189 -593 -683
Other operating income and expenses, net -3 -10 234 -46
Share in profits of associated companies -1 1 -1 1
Operating profit 67 101 555 351
Financial income and expenses, net -8 -17 -39 -69
Profit before taxes 59 84 516 282
Income taxes -6 -28 -74 -93
Profit 53 56 442 189
Attributable to:
Shareholders of the company 53 55 442 188
Non-controlling interests 0 1 0 1
Profit 53 56 442 189
Earnings per share
Basic, EUR 0.35 0.36 2.95 1.25
Diluted, EUR 0.35 0.36 2.95 1.25
Consolidated statement of income
EUR million 10-12/2015 10-12/2014 1-12/2015 1-12/2014
Profit 53 56 442 189
Items that may be reclassified to profit or loss in subsequent periods:
Cash flow hedges, net of tax 0 -1 2 -3
Available-for-sale equity investments, net of tax -2 0 -2 0
Currency translation on subsidiary net investments 5 -1 -19 33
3 -2 -19 30
Items that will not be reclassified to profit or loss:
Defined benefit plan actuarial gains (+) / losses (-), net of tax 12 -19 12 -19
Other comprehensive income (+) / expense (-) 15 -21 -7 11
Total comprehensive income (+) / expense (-) 68 35 435 200
Attributable to:
Shareholders of the company 68 34 435 199
Non-controlling interests 0 1 0 1
Total comprehensive income (+) / expense (-) 68 35 435 200
Consolidated statement of comprehensive income
This Financial Statements Review has been prepared in accordance with
IAS 34 ‘Interim Financial Reporting’. The same accounting policies have been
applied in the Annual Financial Statements. The figures in this Financial
Statements Review are based on the audited Financial Statements 2015.
16
Metso’s Financial Statements Review for 2015
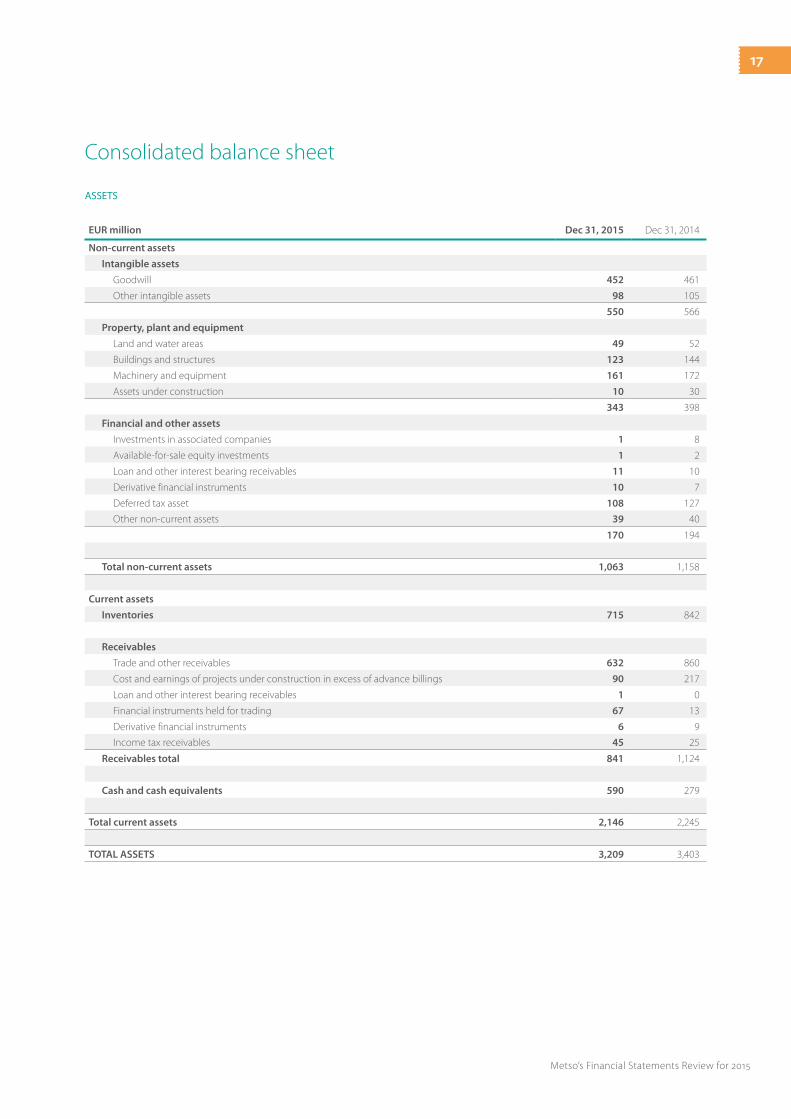
Consolidated balance sheet
ASSETS
EUR million Dec 31, 2015 Dec 31, 2014
Non-current assets
Intangible assets
Goodwill 452 461
Other intangible assets 98 105
550 566
Property, plant and equipment
Land and water areas 49 52
Buildings and structures 123 144
Machinery and equipment 161 172
Assets under construction 10 30
343 398
Financial and other assets
Investments in associated companies 1 8
Available-for-sale equity investments 1 2
Loan and other interest bearing receivables 11 10
Derivative financial instruments 10 7
Deferred tax asset 108 127
Other non-current assets 39 40
170 194
Total non-current assets 1,063 1,158
Current assets
Inventories 715 842
Receivables
Trade and other receivables 632 860
Cost and earnings of projects under construction in excess of advance billings 90 217
Loan and other interest bearing receivables 1 0
Financial instruments held for trading 67 13
Derivative financial instruments 6 9
Income tax receivables 45 25
Receivables total 841 1,124
Cash and cash equivalents 590 279
Total current assets 2,146 2,245
TOTAL ASSETS 3,209 3,403
17
Metso’s Financial Statements Review for 2015

SHAREHOLDERS’ EQUITY AND LIABILITIES
EUR million Dec 31, 2015 Dec 31, 2014
Long-term interest bearing debt 765 791
Short-term interest bearing debt 57 72
Cash and cash equivalents -590 -279
Other interest bearing assets -79 -23
Net interest bearing liabilities 153 561
NET INTEREST BEARING LIABILITIES
EUR million Dec 31, 2015 Dec 31, 2014
Equity
Share capital 141 141
Cumulative translation adjustments -71 -52
Fair value and other reserves 302 302
Retained earnings 1,064 830
Equity attributable to shareholders 1,436 1,221
Non-controlling interests 8 8
Total equity 1,444 1,229
Liabilities
Non-current liabilities
Long-term debt 765 791
Post employment benefit obligations 99 121
Provisions 27 22
Derivative financial instruments 7 6
Deferred tax liability 15 13
Other long-term liabilities 2 3
Total non-current liabilities 915 956
Current liabilities
Current portion of long-term debt 27 1
Short-term debt 30 71
Trade and other payables 469 630
Provisions 68 104
Advances received 164 277
Billings in excess of cost and earnings of projects under construction 54 88
Derivative financial instruments 9 22
Income tax liabilities 29 25
Total current liabilities 850 1,218
Total liabilities 1,765 2,174
TOTAL SHAREHOLDERS' EQUITY AND LIABILITIES 3,209 3,403
18
Metso’s Financial Statements Review for 2015

EUR million 10-12/2015 10-12/2014 1-12/2015 1-12/2014
Cash flows from operating activities:
Profit 53 56 442 189
Adjustments to reconcile profit to net cash provided by operating activities
Depreciation and amortization 19 20 69 75
Financial income and expenses, net 8 17 39 69
Income taxes 6 28 74 93
Other 3 20 -232 74
Change in net working capital -6 -21 64 -75
Cash flows from operations 83 120 456 425
Financial income and expenses, net paid -10 -6 -24 -43
Income taxes paid -7 -26 -72 -126
Net cash provided by operating activities 66 88 360 256
Cash flows from investing activities:
Capital expenditures on fixed assets -15 -28 -46 -74
Proceeds from sale of fixed assets 4 1 17 8
Business acquisitions, net of cash acquired - - - -19
Proceeds from sale of businesses, net of cash sold 1 - 305 -
Proceeds from (+)/ Investments in (-) financial assets 2 5 -56 7
Other - -5 -5 -13
Net cash provided by (+) / used in (-) investing activities -8 -27 215 -91
Cash flows from financing activities:
Dividends paid - - -217 -150
Net funding -7 -36 -40 -215
Other - - 0 0
Net cash provided by (-) / used in (-) financing activities -7 -36 -257 -365
Net increase (+) / decrease (-) in cash and cash equivalents 51 25 318 -200
Effect from changes in exchange rates 2 -1 -7 12
Cash and cash equivalents at beginning of period 537 255 279 467
Cash and cash equivalents at end of period 590 279 590 279
Condensed consolidated cash flow statement
EUR million 10-12/2015 10-12/2014 1-12/2015 1-12/2014
Net cash provided by operating activities 66 88 360 256
Capital expenditures on maintenance investments -11 -26 -36 -60
Proceeds from sale of fixed assets 4 1 17 8
Free cash flow 59 63 341 204
FREE CASH FLOW
19
Metso’s Financial Statements Review for 2015

EUR millionShare
capital
Cumulativetranslation
adjustments
Fair valueand other
reservesRetainedearnings
Equityattributable to
shareholders
Non-controlling
interestsTotal
equity
Balance at Jan 1, 2014 141 -85 305 812 1,173 8 1,181
Profit - - - 188 188 1 189
Other comprehensive income (+) / expense (-)
Cash flow hedges, net of tax - - -3 - -3 - -3
Available-for-sale equity investments, net of tax - - 0 - 0 - 0
Currency translation on subsidiary net investments - 33 - - 33 - 33
Defined benefit plan actuarial gains (+) / losses (-), net of tax - - - -19 -19 - -19
Total comprehensive income (+) / expense (-) - 33 -3 169 199 1 200
Dividends - - - -150 -150 0 -150
Share-based payments, net of tax - - 0 0 0 - 0
Other - - 0 -1 -1 -1 -2
Changes in non-controlling interests - - - 0 0 0 0
Balance at December 31, 2014 141 -52 302 830 1,221 8 1,229
Balance at Jan 1, 2015 141 -52 302 830 1,221 8 1,229
Profit - - - 442 442 0 442
Other comprehensive income (+) / expense (-)
Cash flow hedges, net of tax - - 2 - 2 - 2
Available-for-sale equity investments, net of tax - - -2 - -2 - -2
Currency translation on subsidiary net investments - -19 - - -19 - -19
Defined benefit plan actuarial gains (+) / losses (-), net of tax - - - 12 12 - 12
Total comprehensive income (+) / expense (-) - -19 0 454 435 0 435
Dividends - - - -217 -217 0 -217
Share-based payments, net of tax - - 1 -1 0 - 0
Other - - -1 1 0 0 0
Changes in non-controlling interests - - - -3 -3 0 -3
Balance at December 31, 2015 141 -71 302 1,064 1,436 8 1,444
Consolidated statement of changes in shareholders’ equity
20
Metso’s Financial Statements Review for 2015
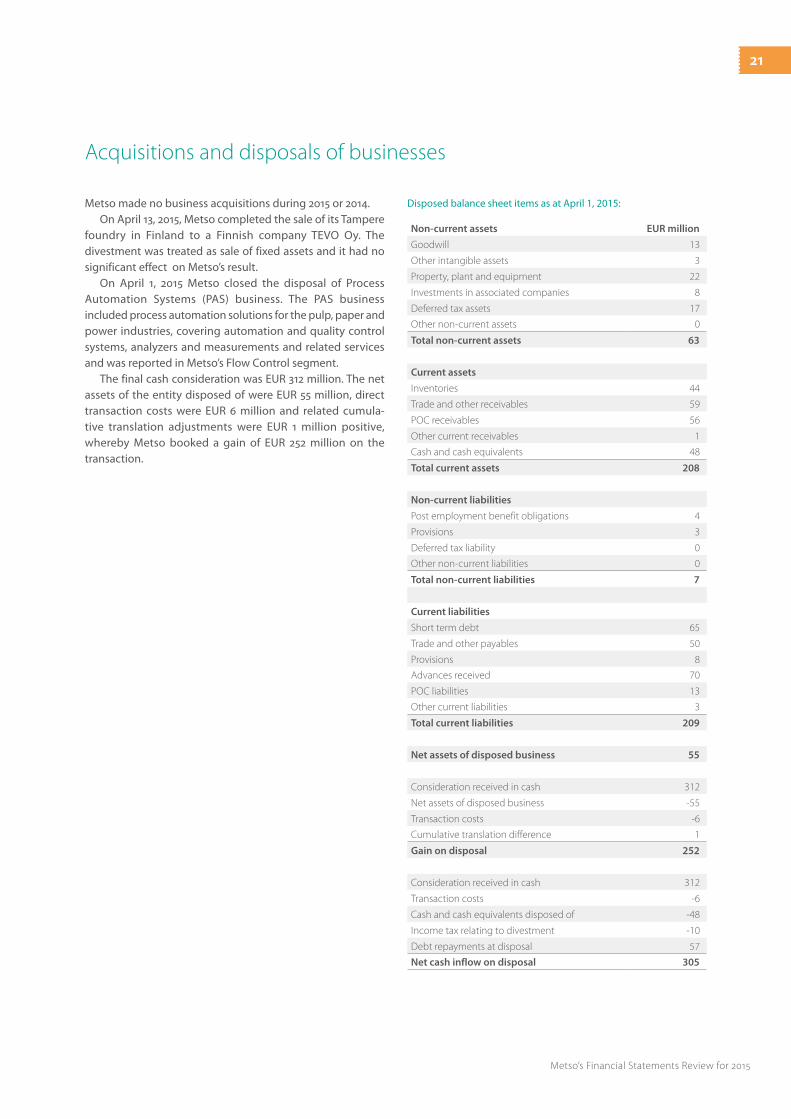
Metso made no business acquisitions during 2015 or 2014. On April 13, 2015, Metso completed the sale of its Tampere
foundry in Finland to a Finnish company TEVO Oy. The divestment was treated as sale of fixed assets and it had no significant effect on Metso’s result.
On April 1, 2015 Metso closed the disposal of Process Automation Systems (PAS) business. The PAS business included process automation solutions for the pulp, paper and power industries, covering automation and quality control systems, analyzers and measurements and related services and was reported in Metso’s Flow Control segment.
The final cash consideration was EUR 312 million. The net assets of the entity disposed of were EUR 55 million, direct transaction costs were EUR 6 million and related cumula-tive translation adjustments were EUR 1 million positive, whereby Metso booked a gain of EUR 252 million on the transaction.
Acquisitions and disposals of businesses
Non-current assets EUR million
Goodwill 13
Other intangible assets 3
Property, plant and equipment 22
Investments in associated companies 8
Deferred tax assets 17
Other non-current assets 0
Total non-current assets 63
Current assets
Inventories 44
Trade and other receivables 59
POC receivables 56
Other current receivables 1
Cash and cash equivalents 48
Total current assets 208
Non-current liabilities
Post employment benefit obligations 4
Provisions 3
Deferred tax liability 0
Other non-current liabilities 0
Total non-current liabilities 7
Current liabilities
Short term debt 65
Trade and other payables 50
Provisions 8
Advances received 70
POC liabilities 13
Other current liabilities 3
Total current liabilities 209
Net assets of disposed business 55
Consideration received in cash 312
Net assets of disposed business -55
Transaction costs -6
Cumulative translation difference 1
Gain on disposal 252
Consideration received in cash 312
Transaction costs -6
Cash and cash equivalents disposed of -48
Income tax relating to divestment -10
Debt repayments at disposal 57
Net cash inflow on disposal 305
Disposed balance sheet items as at April 1, 2015:
21
Metso’s Financial Statements Review for 2015
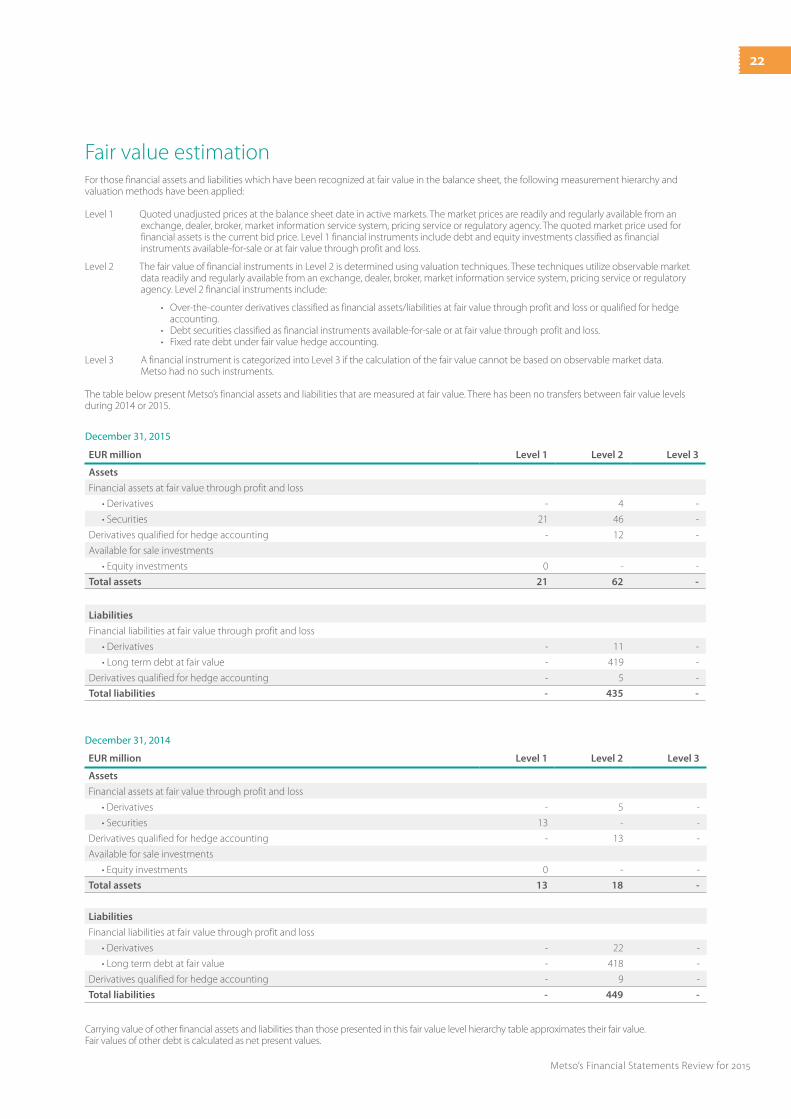
Fair value estimation
EUR million Level 1 Level 2 Level 3
Assets
Financial assets at fair value through profit and loss
• Derivatives - 4 -
• Securities 21 46 -
Derivatives qualified for hedge accounting - 12 -
Available for sale investments
• Equity investments 0 - -
Total assets 21 62 -
Liabilities
Financial liabilities at fair value through profit and loss
• Derivatives - 11 -
• Long term debt at fair value - 419 -
Derivatives qualified for hedge accounting - 5 -
Total liabilities - 435 -
December 31, 2015
EUR million Level 1 Level 2 Level 3
Assets
Financial assets at fair value through profit and loss
• Derivatives - 5 -
• Securities 13 - -
Derivatives qualified for hedge accounting - 13 -
Available for sale investments
• Equity investments 0 - -
Total assets 13 18 -
Liabilities
Financial liabilities at fair value through profit and loss
• Derivatives - 22 -
• Long term debt at fair value - 418 -
Derivatives qualified for hedge accounting - 9 -
Total liabilities - 449 -
December 31, 2014
For those financial assets and liabilities which have been recognized at fair value in the balance sheet, the following measurement hierarchy and valuation methods have been applied:
Level 1 Quoted unadjusted prices at the balance sheet date in active markets. The market prices are readily and regularly available from an exchange, dealer, broker, market information service system, pricing service or regulatory agency. The quoted market price used for financial assets is the current bid price. Level 1 financial instruments include debt and equity investments classified as financial instruments available-for-sale or at fair value through profit and loss.
Level 2 The fair value of financial instruments in Level 2 is determined using valuation techniques. These techniques utilize observable market data readily and regularly available from an exchange, dealer, broker, market information service system, pricing service or regulatory agency. Level 2 financial instruments include:
• Over-the-counter derivatives classified as financial assets/liabilities at fair value through profit and loss or qualified for hedge accounting.
• Debt securities classified as financial instruments available-for-sale or at fair value through profit and loss. • Fixed rate debt under fair value hedge accounting.
Level 3 A financial instrument is categorized into Level 3 if the calculation of the fair value cannot be based on observable market data. Metso had no such instruments.
The table below present Metso’s financial assets and liabilities that are measured at fair value. There has been no transfers between fair value levels during 2014 or 2015.
Carrying value of other financial assets and liabilities than those presented in this fair value level hierarchy table approximates their fair value. Fair values of other debt is calculated as net present values.
22
Metso’s Financial Statements Review for 2015
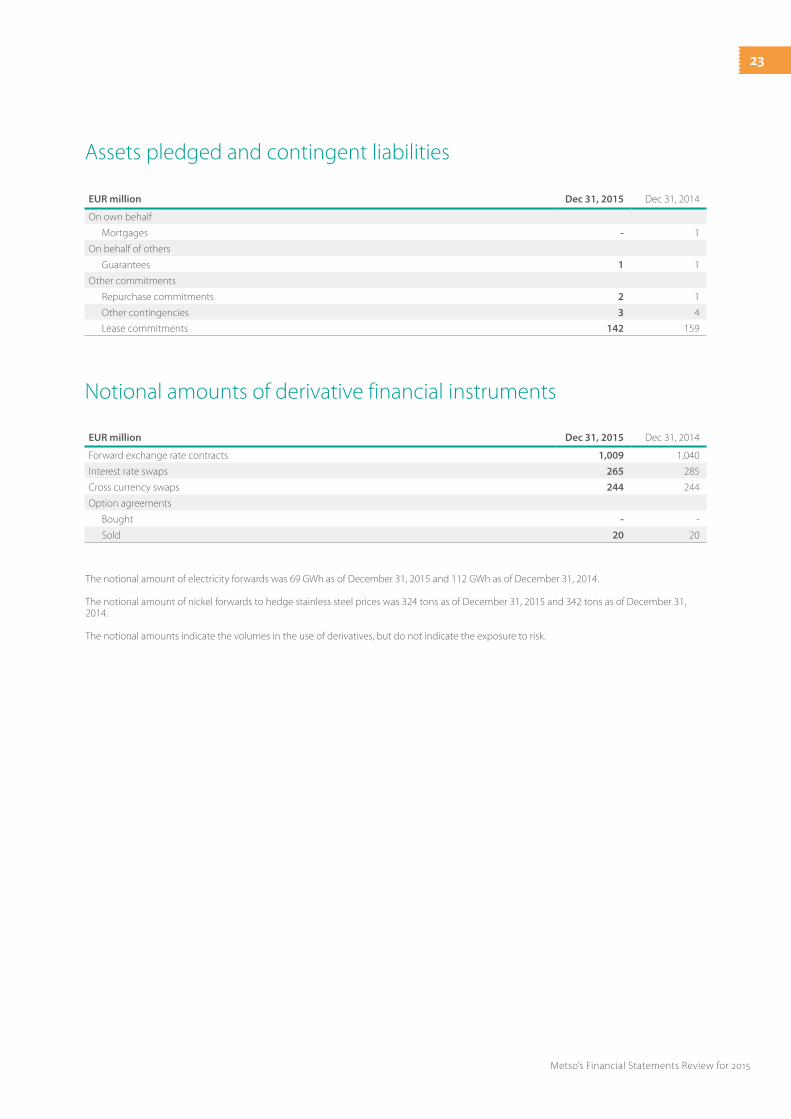
EUR million Dec 31, 2015 Dec 31, 2014
On own behalf
Mortgages - 1
On behalf of others
Guarantees 1 1
Other commitments
Repurchase commitments 2 1
Other contingencies 3 4
Lease commitments 142 159
EUR million Dec 31, 2015 Dec 31, 2014
Forward exchange rate contracts 1,009 1,040
Interest rate swaps 265 285
Cross currency swaps 244 244
Option agreements
Bought - -
Sold 20 20
Assets pledged and contingent liabilities
Notional amounts of derivative financial instruments
The notional amount of electricity forwards was 69 GWh as of December 31, 2015 and 112 GWh as of December 31, 2014.
The notional amount of nickel forwards to hedge stainless steel prices was 324 tons as of December 31, 2015 and 342 tons as of December 31, 2014. The notional amounts indicate the volumes in the use of derivatives, but do not indicate the exposure to risk.
23
Metso’s Financial Statements Review for 2015
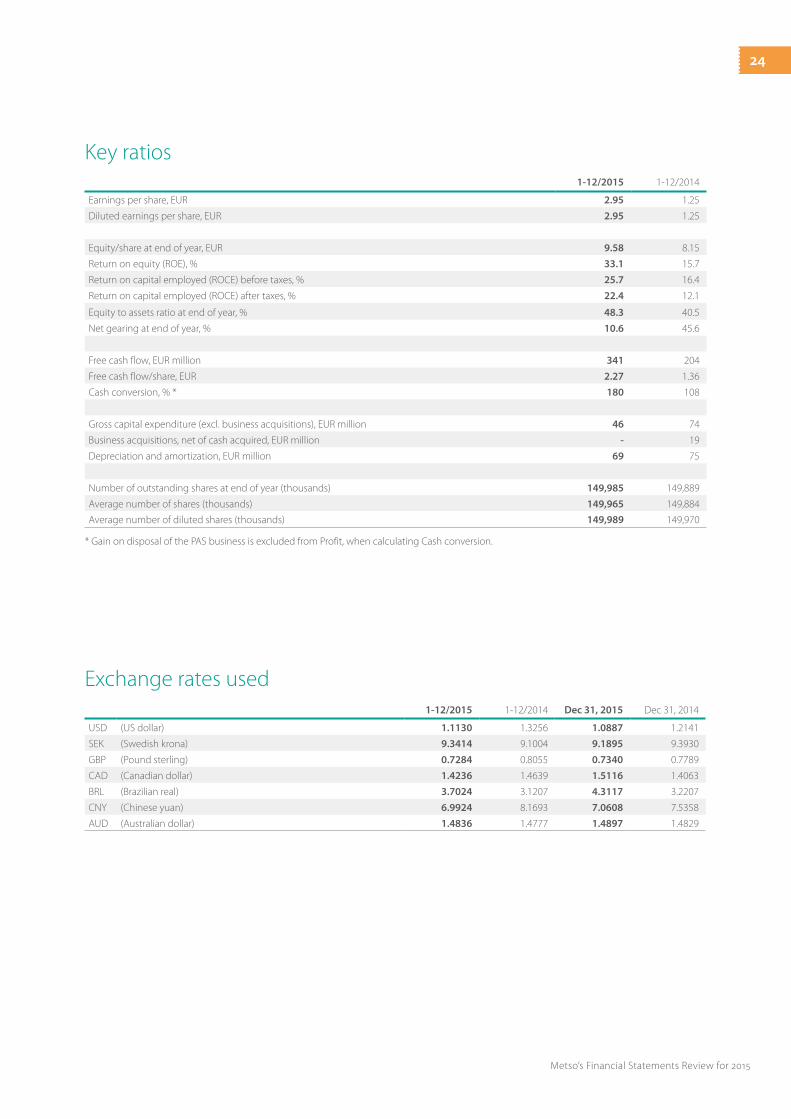
1-12/2015 1-12/2014
Earnings per share, EUR 2.95 1.25
Diluted earnings per share, EUR 2.95 1.25
Equity/share at end of year, EUR 9.58 8.15
Return on equity (ROE), % 33.1 15.7
Return on capital employed (ROCE) before taxes, % 25.7 16.4
Return on capital employed (ROCE) after taxes, % 22.4 12.1
Equity to assets ratio at end of year, % 48.3 40.5
Net gearing at end of year, % 10.6 45.6
Free cash flow, EUR million 341 204
Free cash flow/share, EUR 2.27 1.36
Cash conversion, % * 180 108
Gross capital expenditure (excl. business acquisitions), EUR million 46 74
Business acquisitions, net of cash acquired, EUR million - 19
Depreciation and amortization, EUR million 69 75
Number of outstanding shares at end of year (thousands) 149,985 149,889
Average number of shares (thousands) 149,965 149,884
Average number of diluted shares (thousands) 149,989 149,970
1-12/2015 1-12/2014 Dec 31, 2015 Dec 31, 2014
USD (US dollar) 1.1130 1.3256 1.0887 1.2141
SEK (Swedish krona) 9.3414 9.1004 9.1895 9.3930
GBP (Pound sterling) 0.7284 0.8055 0.7340 0.7789
CAD (Canadian dollar) 1.4236 1.4639 1.5116 1.4063
BRL (Brazilian real) 3.7024 3.1207 4.3117 3.2207
CNY (Chinese yuan) 6.9924 8.1693 7.0608 7.5358
AUD (Australian dollar) 1.4836 1.4777 1.4897 1.4829
Key ratios
Exchange rates used
* Gain on disposal of the PAS business is excluded from Profit, when calculating Cash conversion.
24
Metso’s Financial Statements Review for 2015
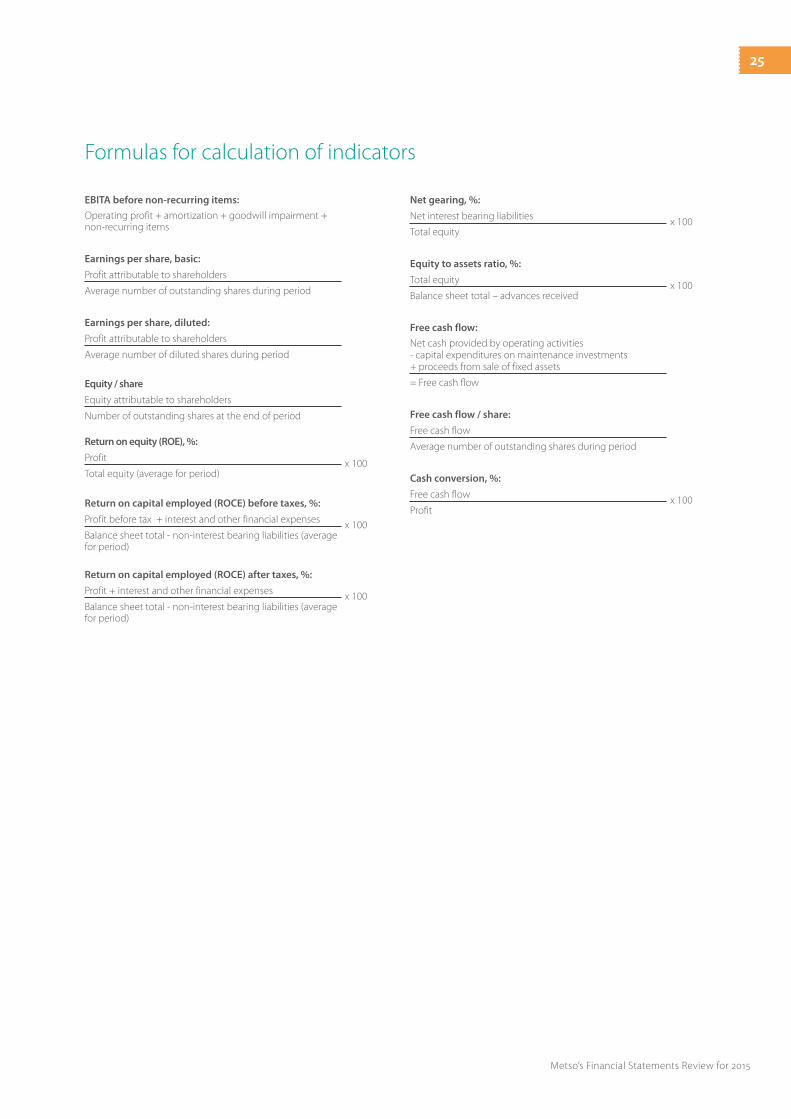
Formulas for calculation of indicators
EBITA before non-recurring items:
Operating profit + amortization + goodwill impairment + non-recurring items
Earnings per share, basic:
Profit attributable to shareholders
Average number of outstanding shares during period
Earnings per share, diluted:
Profit attributable to shareholders
Average number of diluted shares during period
Equity / share
Equity attributable to shareholders
Number of outstanding shares at the end of period
Return on equity (ROE), %:
Profit x 100Total equity (average for period)
Return on capital employed (ROCE) before taxes, %:
Profit before tax + interest and other financial expenses x 100Balance sheet total - non-interest bearing liabilities (average for period)
Return on capital employed (ROCE) after taxes, %:
Profit + interest and other financial expenses x 100Balance sheet total - non-interest bearing liabilities (average for period)
Net gearing, %:
Net interest bearing liabilities x 100Total equity
Equity to assets ratio, %:
Total equity x 100Balance sheet total – advances received
Free cash flow:
Net cash provided by operating activities- capital expenditures on maintenance investments+ proceeds from sale of fixed assets
= Free cash flow
Free cash flow / share:
Free cash flow
Average number of outstanding shares during period
Cash conversion, %:
Free cash flow x 100Profit
25
Metso’s Financial Statements Review for 2015
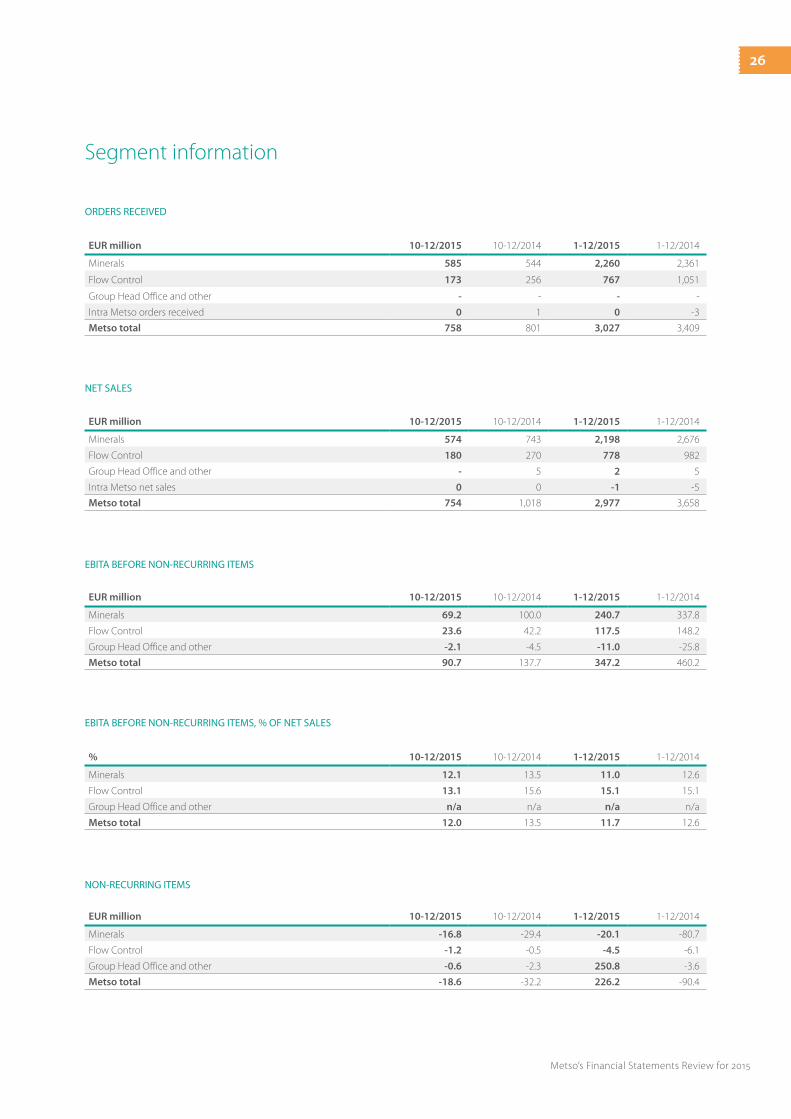
Segment information
EUR million 10-12/2015 10-12/2014 1-12/2015 1-12/2014
Minerals 574 743 2,198 2,676
Flow Control 180 270 778 982
Group Head Office and other - 5 2 5
Intra Metso net sales 0 0 -1 -5
Metso total 754 1,018 2,977 3,658
NET SALES
EUR million 10-12/2015 10-12/2014 1-12/2015 1-12/2014
Minerals 69.2 100.0 240.7 337.8
Flow Control 23.6 42.2 117.5 148.2
Group Head Office and other -2.1 -4.5 -11.0 -25.8
Metso total 90.7 137.7 347.2 460.2
EBITA BEFORE NON-RECURRING ITEMS
% 10-12/2015 10-12/2014 1-12/2015 1-12/2014
Minerals 12.1 13.5 11.0 12.6
Flow Control 13.1 15.6 15.1 15.1
Group Head Office and other n/a n/a n/a n/a
Metso total 12.0 13.5 11.7 12.6
EBITA BEFORE NON-RECURRING ITEMS, % OF NET SALES
EUR million 10-12/2015 10-12/2014 1-12/2015 1-12/2014
Minerals -16.8 -29.4 -20.1 -80.7
Flow Control -1.2 -0.5 -4.5 -6.1
Group Head Office and other -0.6 -2.3 250.8 -3.6
Metso total -18.6 -32.2 226.2 -90.4
NON-RECURRING ITEMS
EUR million 10-12/2015 10-12/2014 1-12/2015 1-12/2014
Minerals 585 544 2,260 2,361
Flow Control 173 256 767 1,051
Group Head Office and other - - - -
Intra Metso orders received 0 1 0 -3
Metso total 758 801 3,027 3,409
ORDERS RECEIVED
26
Metso’s Financial Statements Review for 2015
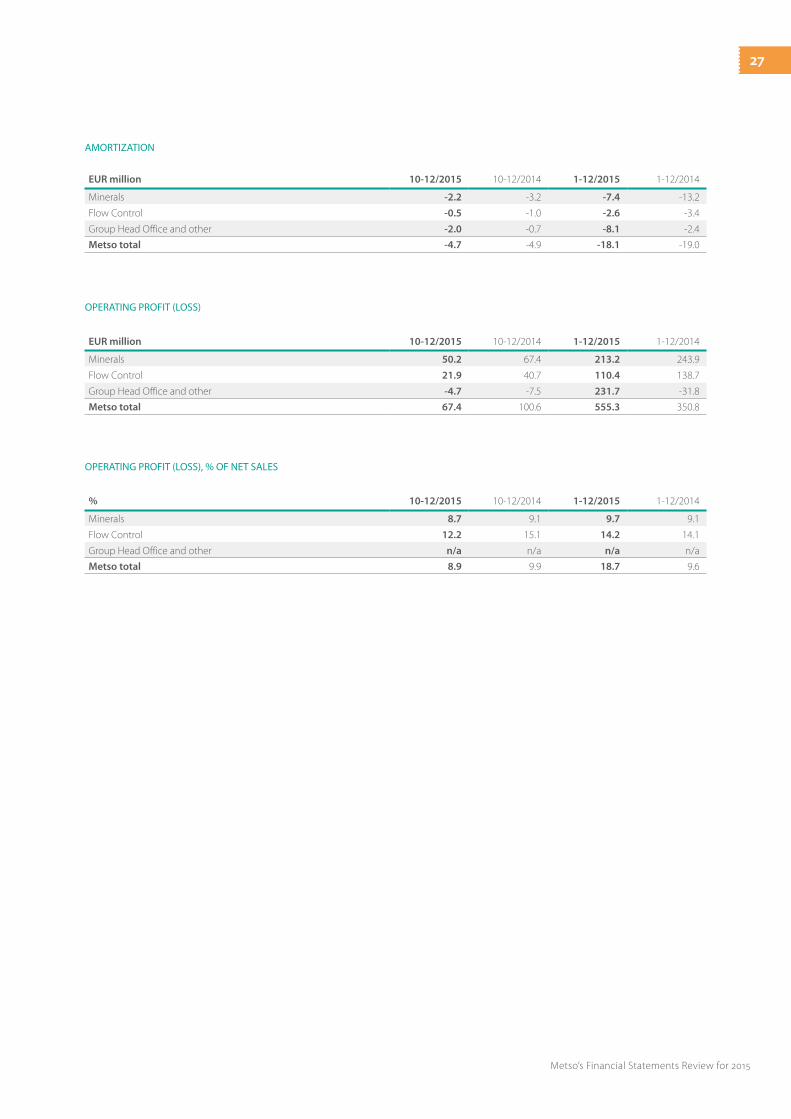
EUR million 10-12/2015 10-12/2014 1-12/2015 1-12/2014
Minerals 50.2 67.4 213.2 243.9
Flow Control 21.9 40.7 110.4 138.7
Group Head Office and other -4.7 -7.5 231.7 -31.8
Metso total 67.4 100.6 555.3 350.8
OPERATING PROFIT (LOSS)
% 10-12/2015 10-12/2014 1-12/2015 1-12/2014
Minerals 8.7 9.1 9.7 9.1
Flow Control 12.2 15.1 14.2 14.1
Group Head Office and other n/a n/a n/a n/a
Metso total 8.9 9.9 18.7 9.6
OPERATING PROFIT (LOSS), % OF NET SALES
EUR million 10-12/2015 10-12/2014 1-12/2015 1-12/2014
Minerals -2.2 -3.2 -7.4 -13.2
Flow Control -0.5 -1.0 -2.6 -3.4
Group Head Office and other -2.0 -0.7 -8.1 -2.4
Metso total -4.7 -4.9 -18.1 -19.0
AMORTIZATION
27
Metso’s Financial Statements Review for 2015
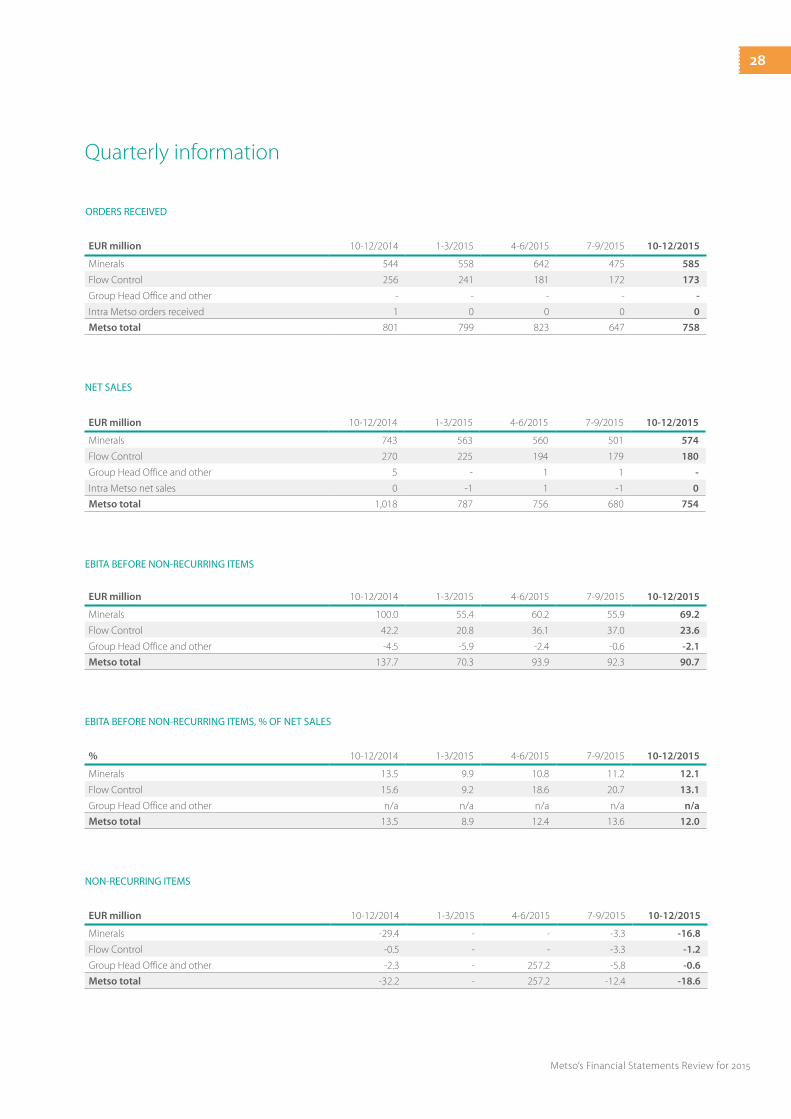
EUR million 10-12/2014 1-3/2015 4-6/2015 7-9/2015 10-12/2015
Minerals 743 563 560 501 574
Flow Control 270 225 194 179 180
Group Head Office and other 5 - 1 1 -
Intra Metso net sales 0 -1 1 -1 0
Metso total 1,018 787 756 680 754
NET SALES
EUR million 10-12/2014 1-3/2015 4-6/2015 7-9/2015 10-12/2015
Minerals 100.0 55.4 60.2 55.9 69.2
Flow Control 42.2 20.8 36.1 37.0 23.6
Group Head Office and other -4.5 -5.9 -2.4 -0.6 -2.1
Metso total 137.7 70.3 93.9 92.3 90.7
EBITA BEFORE NON-RECURRING ITEMS
% 10-12/2014 1-3/2015 4-6/2015 7-9/2015 10-12/2015
Minerals 13.5 9.9 10.8 11.2 12.1
Flow Control 15.6 9.2 18.6 20.7 13.1
Group Head Office and other n/a n/a n/a n/a n/a
Metso total 13.5 8.9 12.4 13.6 12.0
EBITA BEFORE NON-RECURRING ITEMS, % OF NET SALES
EUR million 10-12/2014 1-3/2015 4-6/2015 7-9/2015 10-12/2015
Minerals -29.4 - - -3.3 -16.8
Flow Control -0.5 - - -3.3 -1.2
Group Head Office and other -2.3 - 257.2 -5.8 -0.6
Metso total -32.2 - 257.2 -12.4 -18.6
NON-RECURRING ITEMS
Quarterly information
EUR million 10-12/2014 1-3/2015 4-6/2015 7-9/2015 10-12/2015
Minerals 544 558 642 475 585
Flow Control 256 241 181 172 173
Group Head Office and other - - - - -
Intra Metso orders received 1 0 0 0 0
Metso total 801 799 823 647 758
ORDERS RECEIVED
28
Metso’s Financial Statements Review for 2015

% 10-12/2014 1-3/2015 4-6/2015 7-9/2015 10-12/2015
Minerals 9.1 9.6 10.4 10.2 8.7
Flow Control 15.1 8.6 18.6 18.4 12.2
Group Head Office and other n/a n/a n/a n/a n/a
Metso total 9.9 8.3 45.9 11.1 8.9
OPERATING PROFIT (LOSS), % OF NET SALES
EUR million Dec 31, 2014 Mar 31, 2015 June 30, 2015 Sep 30, 2015 Dec 31, 2015
Minerals 1,337 1,308 1,252 1,167 1,162
Flow Control 376 389 329 322 321
Group Head Office and other 379 494 695 718 784
Metso total 2,092 2,191 2,276 2,207 2,267
Capital employed includes only external balance sheet items.
CAPITAL EMPLOYED
EUR million Dec 31, 2014 Mar 31, 2015 June 30, 2015 Sep 30, 2015 Dec 31, 2015
Minerals 1,108 1,120 1,109 1,004 1,006
Flow Control 468 510 300 285 262
Group Head Office and other - - - 1 -
Intra Metso order backlog -1 1 2 0 0
Metso total 1,575 1,631 1,411 1,290 1,268
ORDER BACKLOG
PERSONNEL
EUR million 10-12/2014 1-3/2015 4-6/2015 7-9/2015 10-12/2015
Minerals -3.2 -1.6 -1.9 -1.7 -2.2
Flow Control -1.0 -1.3 -0.1 -0.7 -0.5
Group Head Office and other -0.7 -2.0 -2.1 -2.0 -2.0
Metso total -4.9 -4.9 -4.1 -4.4 -4.7
AMORTIZATION
EUR million 10-12/2014 1-3/2015 4-6/2015 7-9/2015 10-12/2015
Minerals 67.4 53.8 58.3 50.9 50.2
Flow Control 40.7 19.4 36.1 33.0 21.9
Group Head Office and other -7.5 -7.9 252.7 -8.4 -4.7
Metso total 100.6 65.3 347.1 75.5 67.4
OPERATING PROFIT (LOSS)
Dec 31, 2014 Mar 31, 2015 June 30, 2015 Sep 30, 2015 Dec 31, 2015
Minerals 10,368 10,182 9,739 9,267 9,039
Flow Control 4,557 4,495 2,927 2,814 2,770
Group Head Office and other 719 673 658 583 566
Metso total 15,644 15,350 13,324 12,664 12,375
29
Metso’s Financial Statements Review for 2015
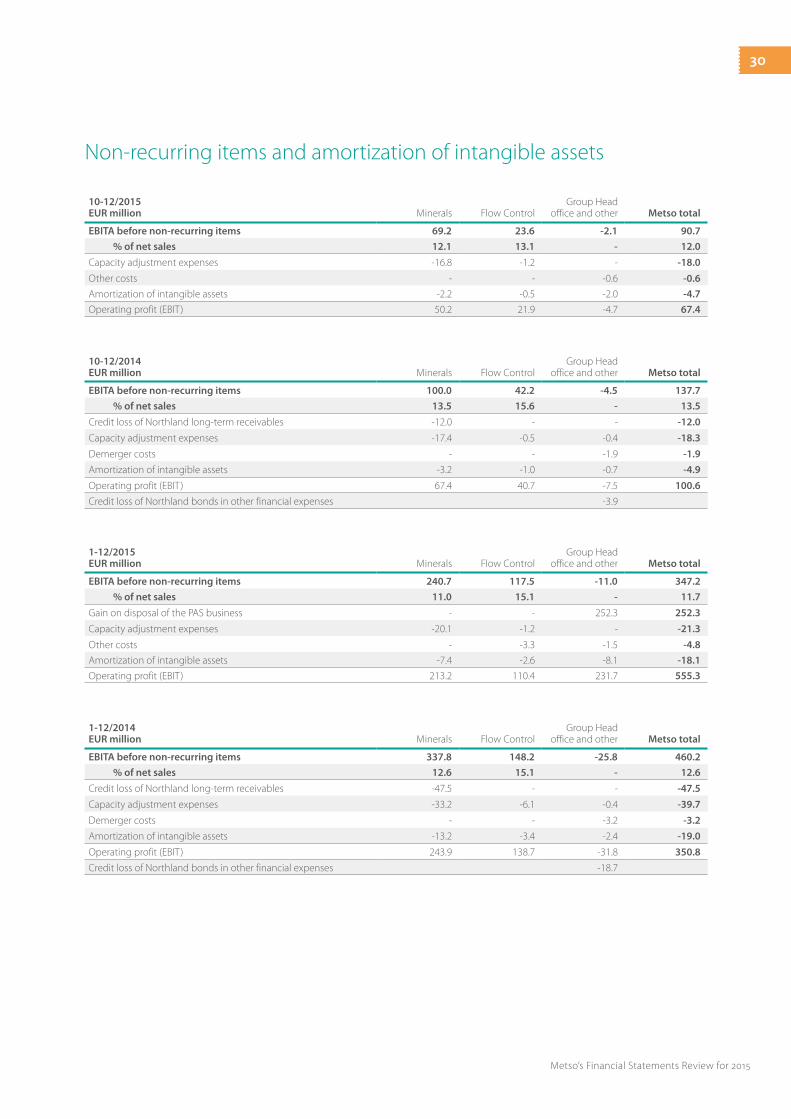
10-12/2015 EUR million Minerals Flow Control
Group Head office and other Metso total
EBITA before non-recurring items 69.2 23.6 -2.1 90.7
% of net sales 12.1 13.1 - 12.0
Capacity adjustment expenses -16.8 -1.2 - -18.0
Other costs - - -0.6 -0.6
Amortization of intangible assets -2.2 -0.5 -2.0 -4.7
Operating profit (EBIT) 50.2 21.9 -4.7 67.4
Non-recurring items and amortization of intangible assets
10-12/2014 EUR million Minerals Flow Control
Group Head office and other Metso total
EBITA before non-recurring items 100.0 42.2 -4.5 137.7
% of net sales 13.5 15.6 - 13.5
Credit loss of Northland long-term receivables -12.0 - - -12.0
Capacity adjustment expenses -17.4 -0.5 -0.4 -18.3
Demerger costs - - -1.9 -1.9
Amortization of intangible assets -3.2 -1.0 -0.7 -4.9
Operating profit (EBIT) 67.4 40.7 -7.5 100.6
Credit loss of Northland bonds in other financial expenses -3.9
1-12/2015 EUR million Minerals Flow Control
Group Head office and other Metso total
EBITA before non-recurring items 240.7 117.5 -11.0 347.2
% of net sales 11.0 15.1 - 11.7
Gain on disposal of the PAS business - - 252.3 252.3
Capacity adjustment expenses -20.1 -1.2 - -21.3
Other costs - -3.3 -1.5 -4.8
Amortization of intangible assets -7.4 -2.6 -8.1 -18.1
Operating profit (EBIT) 213.2 110.4 231.7 555.3
1-12/2014 EUR million Minerals Flow Control
Group Head office and other Metso total
EBITA before non-recurring items 337.8 148.2 -25.8 460.2
% of net sales 12.6 15.1 - 12.6
Credit loss of Northland long-term receivables -47.5 - - -47.5
Capacity adjustment expenses -33.2 -6.1 -0.4 -39.7
Demerger costs - - -3.2 -3.2
Amortization of intangible assets -13.2 -3.4 -2.4 -19.0
Operating profit (EBIT) 243.9 138.7 -31.8 350.8
Credit loss of Northland bonds in other financial expenses -18.7
30
Metso’s Financial Statements Review for 2015
Metso Corporation, Group Head Office, Fabianinkatu 9 A, PO Box 1220, FIN-00101 Helsinki, FinlandTel. +358 20 484 100 • Fax +358 20 484 101 • www.metso.com
Metso’s Financial Reporting and Events
Metso’s Interim Reviews in 2016 will be published as follows: January–March on April 22, January–June on July 21, and January–September on October 21.
Metso Corporation’s Annual General Meeting 2016 will be held on Monday, March 21, 2016.


