

The
Uni
vers
ity o
f Auc
klan
dN
ew Z
eala
nd
Microsimulationmodels in
New Zealand
Workshop on Microsimulation Models in Asia-Pacific Region February 12, 2015
Roy Lay-Yee (Senior Research Fellow) COMPASS Research CentreUniversity of Auckland, New Zealandemail: [email protected]: www.compass.auckland.ac.nz
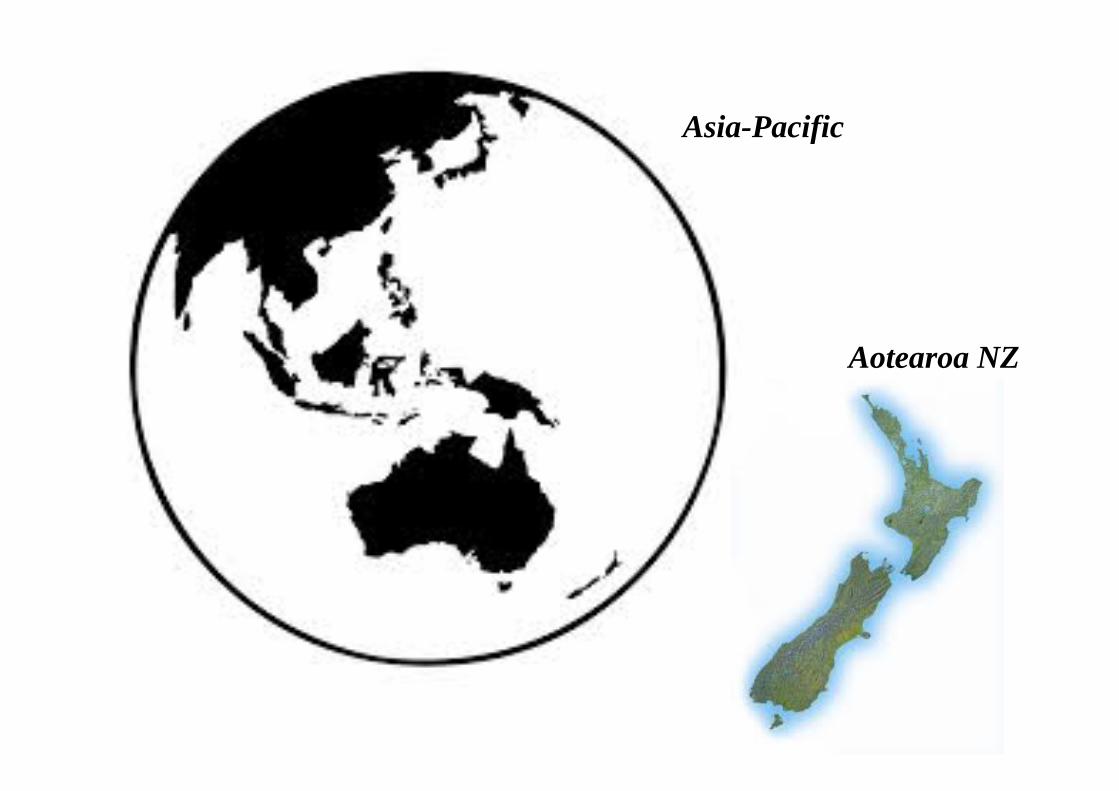
Aotearoa NZ
Asia-Pacific
The
Uni
vers
ity o
f Auc
klan
dN
ew Z
eala
ndOutline
COMPASS Research Centre
Role of microsimulation in public policy development
Our microsimulation models
Lessons learnt (and challenges)
International collaboration
Conclusion3

The
Uni
vers
ity o
f Auc
klan
dN
ew Z
eala
ndCOMPASS Research:The Team
COMPASS = Centre of Methods and Policy Application in the Social Sciences
~10 years, public grant-fundedBig user of existing data (analysis & modelling)Simulation models mostly policy-oriented
4

The
Uni
vers
ity o
f Auc
klan
dN
ew Z
eala
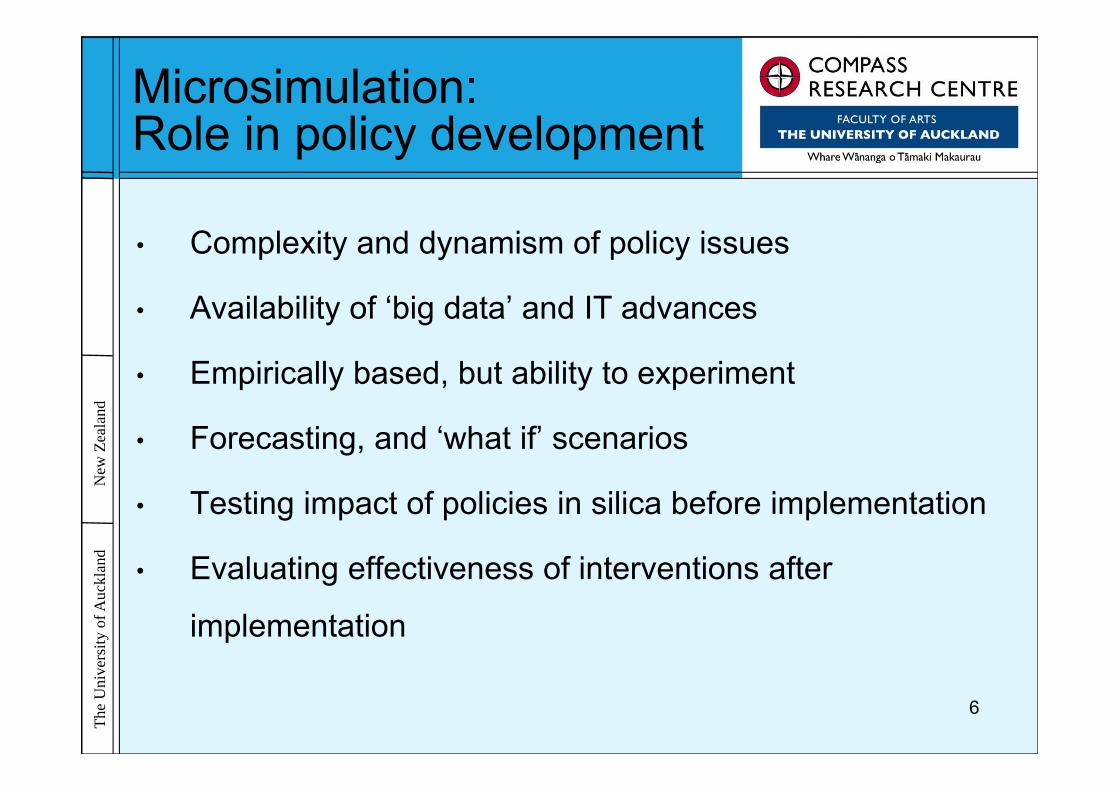
ndMicrosimulation: Role in policy development
• Complexity and dynamism of policy issues
• Availability of ‘big data’ and IT advances
• Empirically based, but ability to experiment
• Forecasting, and ‘what if’ scenarios
• Testing impact of policies in silica before implementation
• Evaluating effectiveness of interventions after
implementation
6

The
Uni
vers
ity o
f Auc
klan
dN
ew Z
eala
ndPolicy decision support
1. Add value to existing data
2. Present data within a realistic analytical framework
3. Use literature-derived estimates where appropriate
4. Construct a desk-based “tool” for interrogation
5. Work with colleagues in policy agencies throughout
7

Model Year Locality Type Life stage Domain Software Data Funder Collaborators End‐users
MOSC 2005‐8 NZ ABM/MSM Adults Marriage market, residential segregation
NetLogoRepastJava
Census Marsden UOA
PCASO 2005‐8 NZ Static discrete‐time MSM
Older people Health care SAS NATMEDCANZHSANHS
HRC UOANatSem
BCASO 2009‐12 NZ Dynamic discrete‐time MSM
Older people Health & social care R NZHSNZDSCensus
HRC UOANatSem
MEL‐C 2009‐13 NZ Dynamic discrete‐time MSM
Children Health, education, conduct
Java R
CHDSDMDHSPIFSTHNRCensus2006
MBIE UOANatSemStatCan
MOEMOHMOJMSDTe Puni KokiriFamilies CommissionChildren’s Commissioner
KNOW‐LAB
2013‐16 World Dynamic discrete‐time MSM
Children & young people
Health, education, conduct, etc.
JavaR
Published literature
MBIE UOAStatCan
COMPASS Simulation Suite
8

Mt Ngauruhoe – Bryan Lay-Yee
The
Uni
vers
ity o
f Auc
klan
dN
ew Z
eala
ndOutline
COMPASS Research Centre
Role of microsimulation in public policy development
Our microsimulation models
Lessons learnt (and challenges)
International collaboration
Conclusion10
The
Uni
vers
ity o
f Auc
klan
dN
ew Z
eala
ndOur microsimulation models- what about them?
11
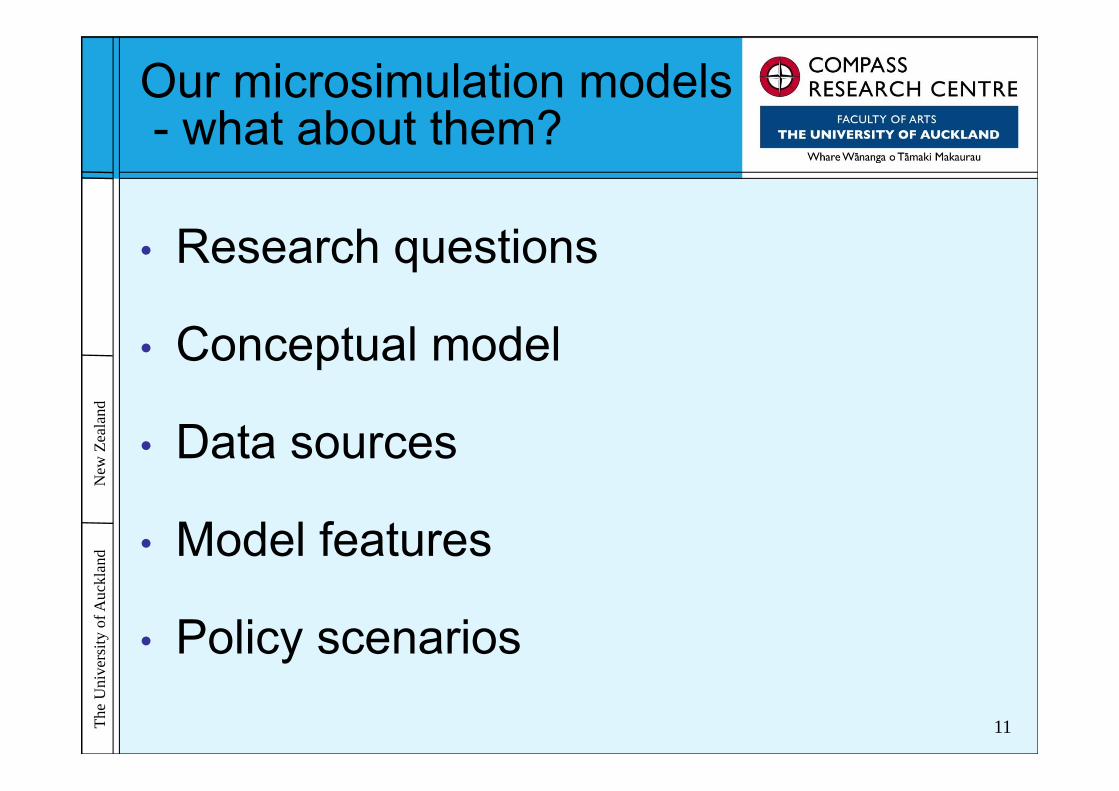
• Research questions
• Conceptual model
• Data sources
• Model features
• Policy scenarios
The
Uni
vers
ity o
f Auc
klan
dN
ew Z
eala
ndOur microsimulation models- which are they?
12
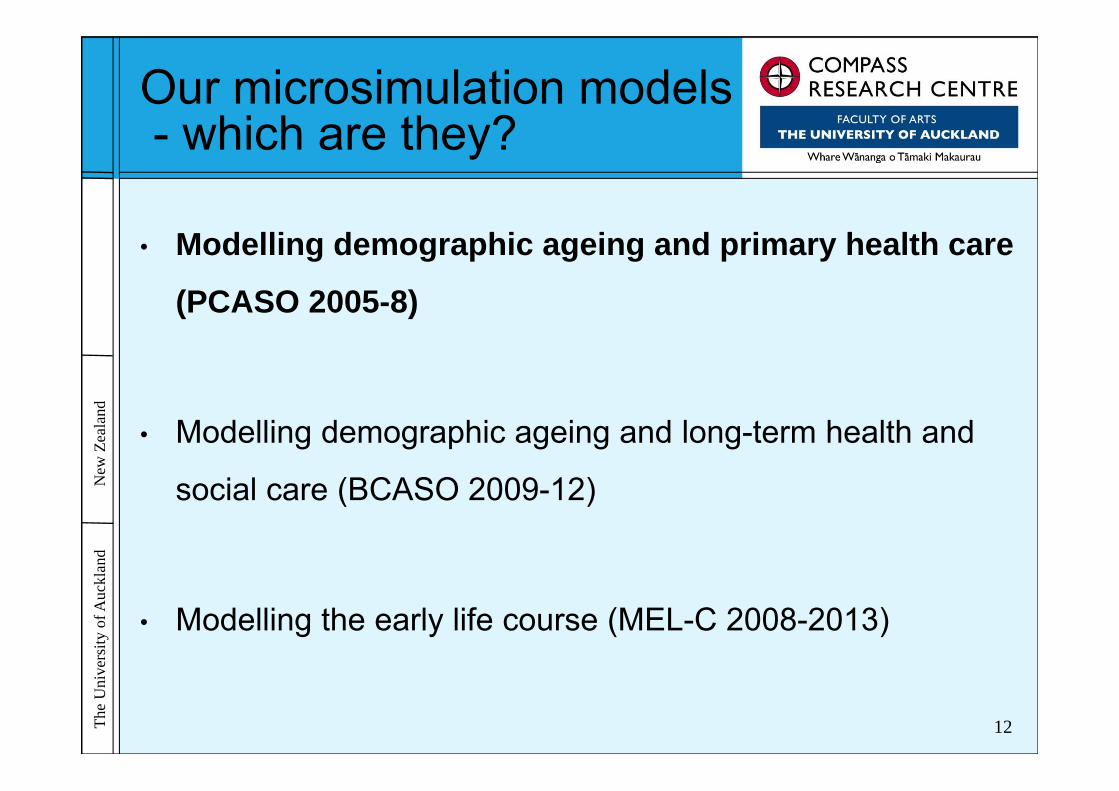
• Modelling demographic ageing and primary health care
(PCASO 2005-8)
• Modelling demographic ageing and long-term health and
social care (BCASO 2009-12)
• Modelling the early life course (MEL-C 2008-2013)
The
Uni
vers
ity o
f Auc
klan
dN
ew Z
eala
ndPCASO: Research questions
13
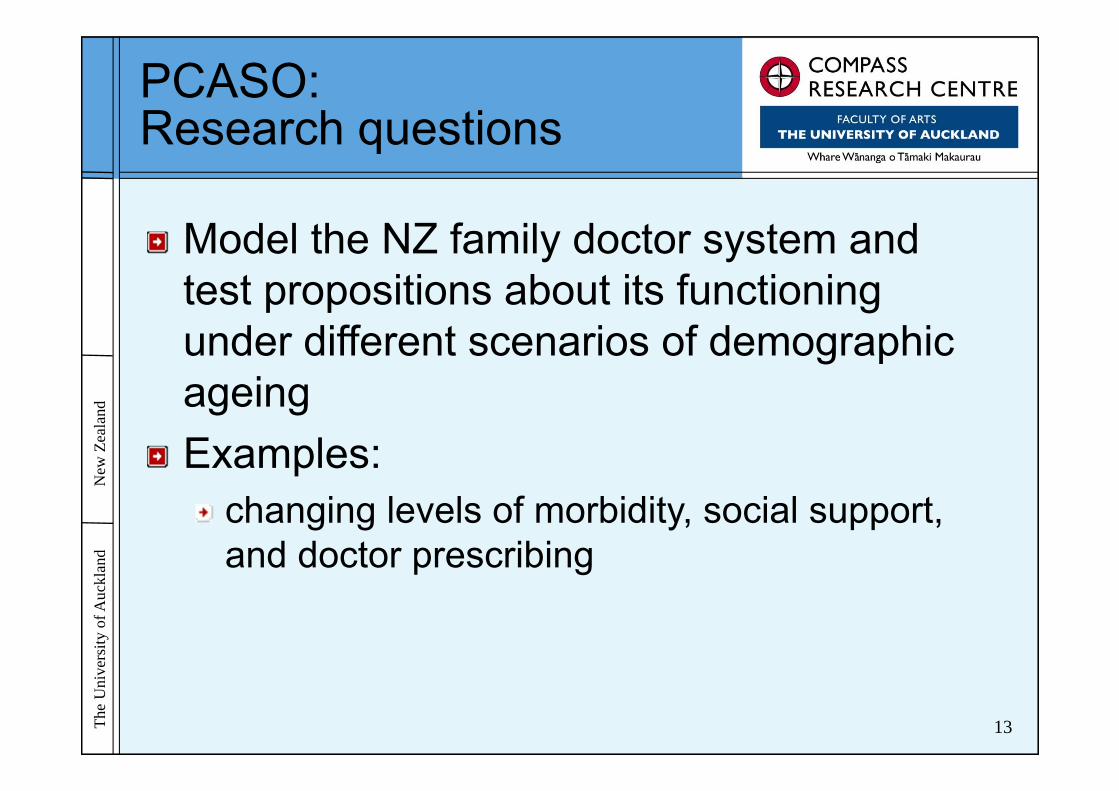
Model the NZ family doctor system and test propositions about its functioning under different scenarios of demographic ageingExamples:
changing levels of morbidity, social support, and doctor prescribing
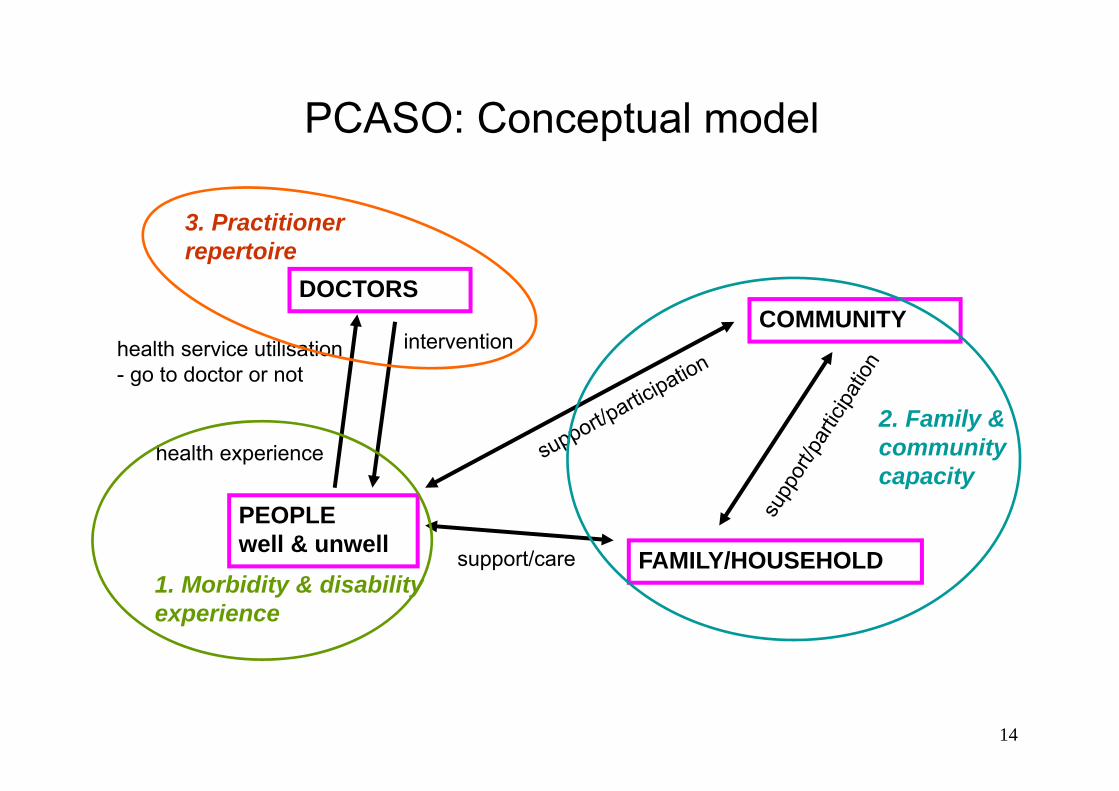
PCASO: Conceptual model
DOCTORSCOMMUNITY
PEOPLE well & unwell FAMILY/HOUSEHOLD
health experience
intervention
support/care
health service utilisation- go to doctor or not
14
1. Morbidity & disability experience
2. Family & community capacity
3. Practitioner repertoire
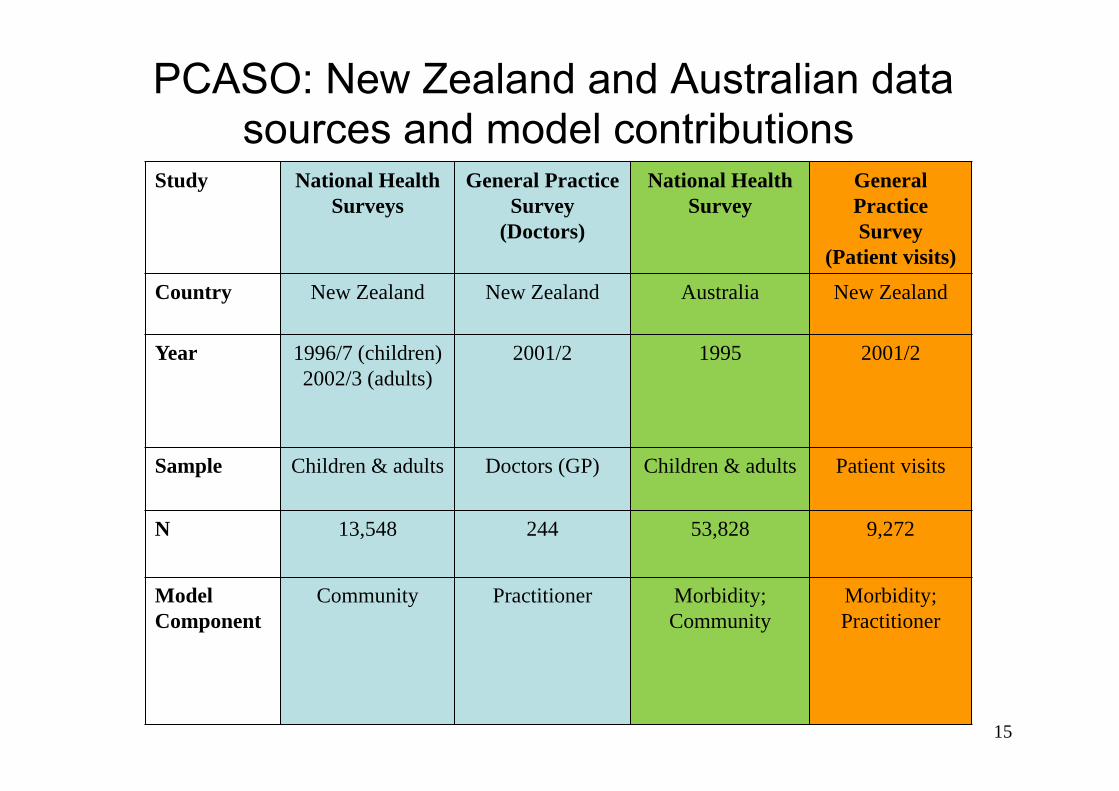
PCASO: New Zealand and Australian data sources and model contributions
Study National Health Surveys
General Practice Survey
(Doctors)
National Health Survey
General Practice Survey
(Patient visits)
Country New Zealand New Zealand Australia New Zealand
Year 1996/7 (children)2002/3 (adults)
2001/2 1995 2001/2
Sample Children & adults Doctors (GP) Children & adults Patient visits
N 13,548 244 53,828 9,272
Model Component
Community Practitioner Morbidity; Community
Morbidity; Practitioner
15
The
Uni
vers
ity o
f Auc
klan
dN
ew Z
eala
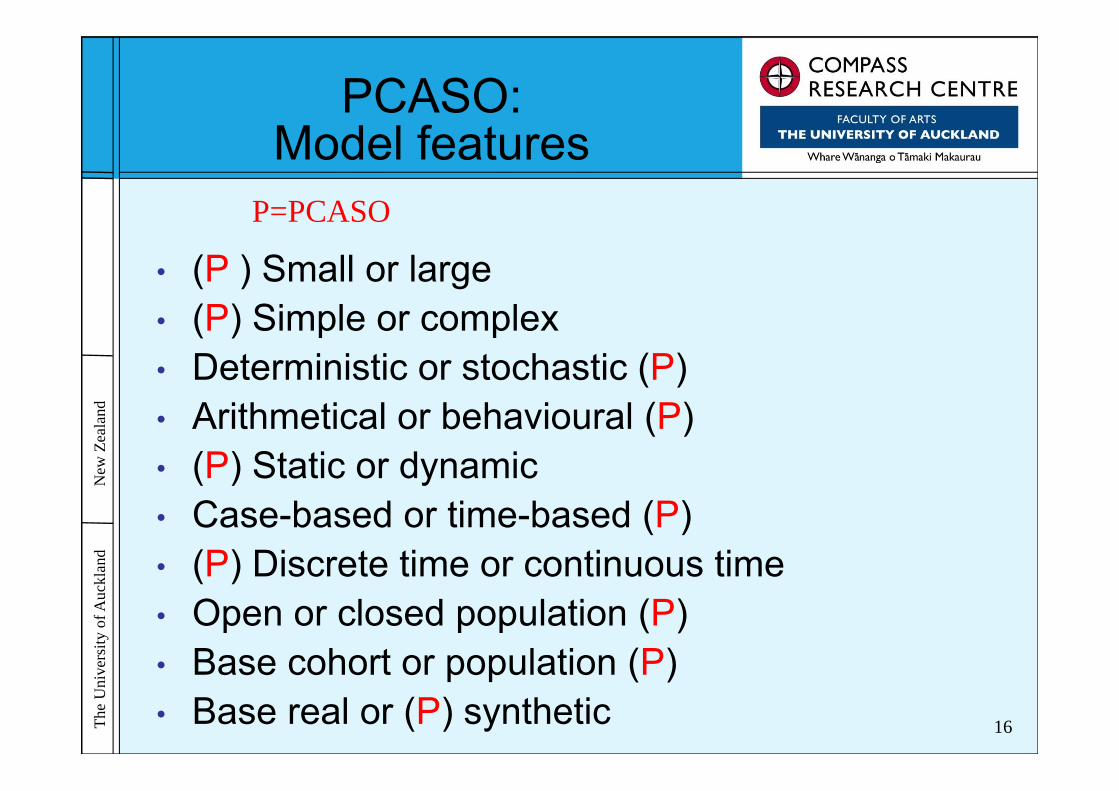
ndPCASO:
Model features
16
P=PCASO
• (P ) Small or large • (P) Simple or complex • Deterministic or stochastic (P)• Arithmetical or behavioural (P)• (P) Static or dynamic• Case-based or time-based (P)• (P) Discrete time or continuous time• Open or closed population (P)• Base cohort or population (P)• Base real or (P) synthetic
17
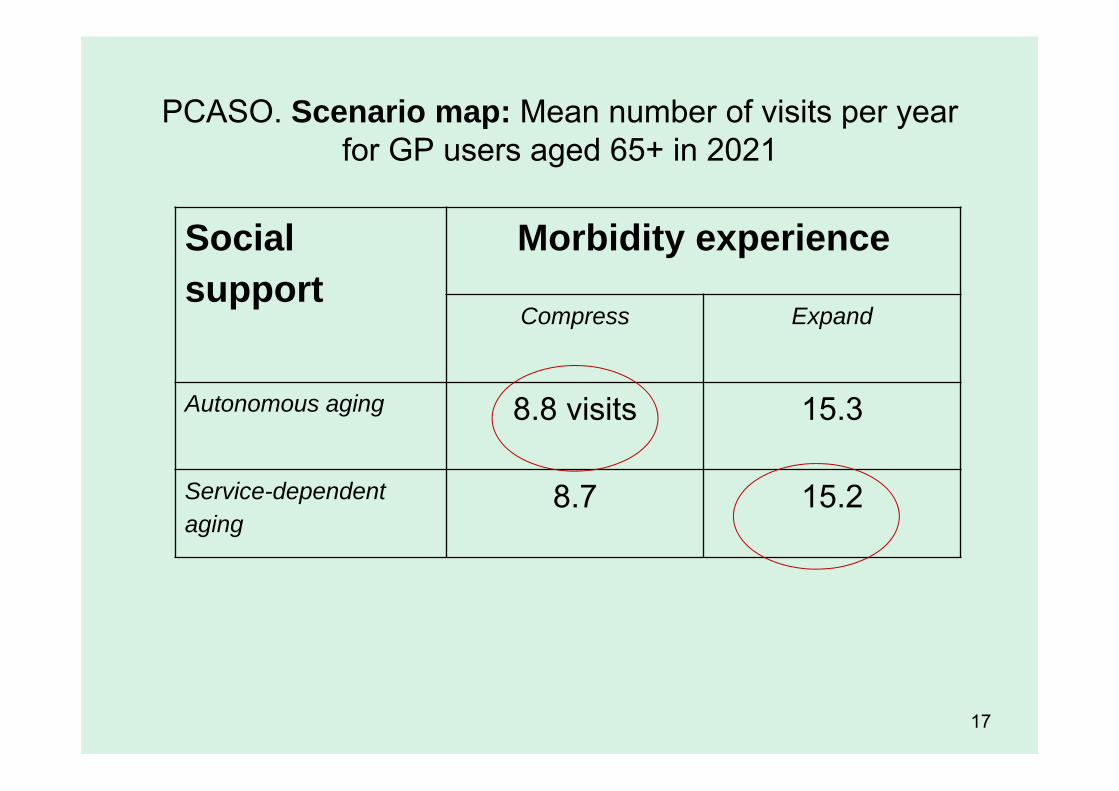
PCASO. Scenario map: Mean number of visits per year for GP users aged 65+ in 2021
Social support
Morbidity experience
Compress Expand
Autonomous aging 8.8 visits 15.3
Service-dependent aging
8.7 15.2
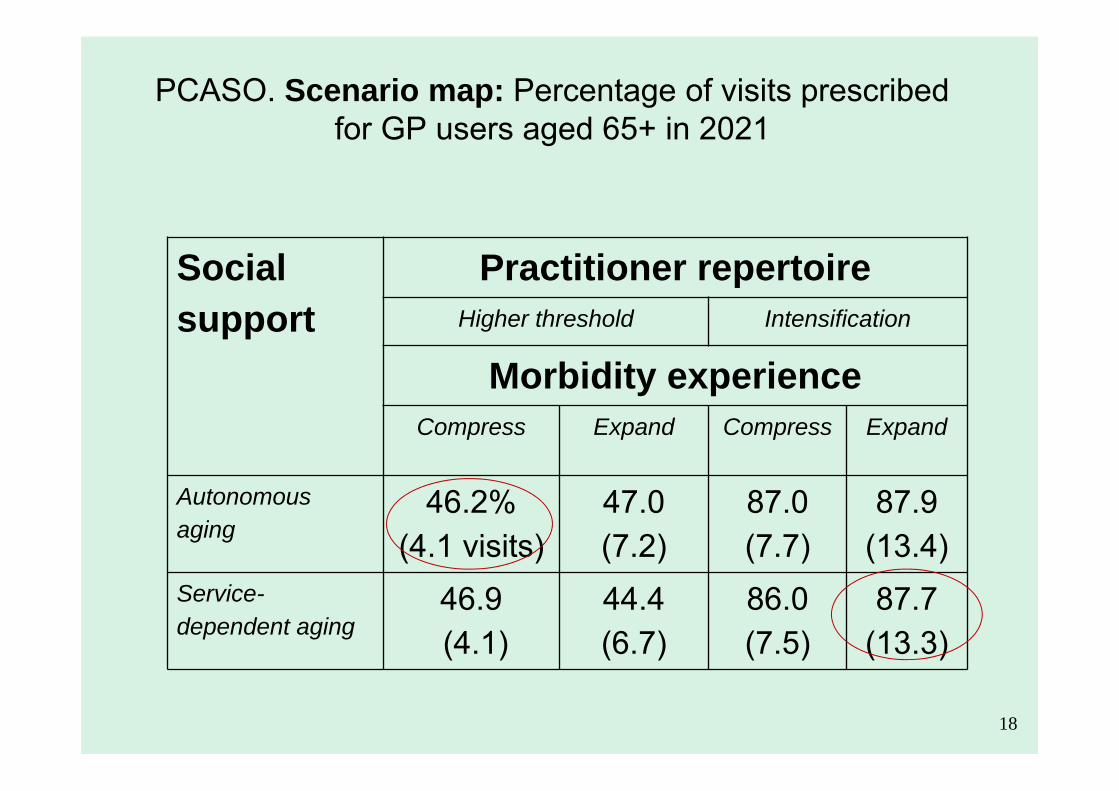
PCASO. Scenario map: Percentage of visits prescribed for GP users aged 65+ in 2021
Social support
Practitioner repertoireHigher threshold Intensification
Morbidity experienceCompress Expand Compress Expand
Autonomous aging
46.2%(4.1 visits)
47.0 (7.2)
87.0(7.7)
87.9(13.4)
Service-dependent aging
46.9(4.1)
44.4(6.7)
86.0(7.5)
87.7(13.3)
18
The
Uni
vers
ity o
f Auc
klan
dN
ew Z
eala
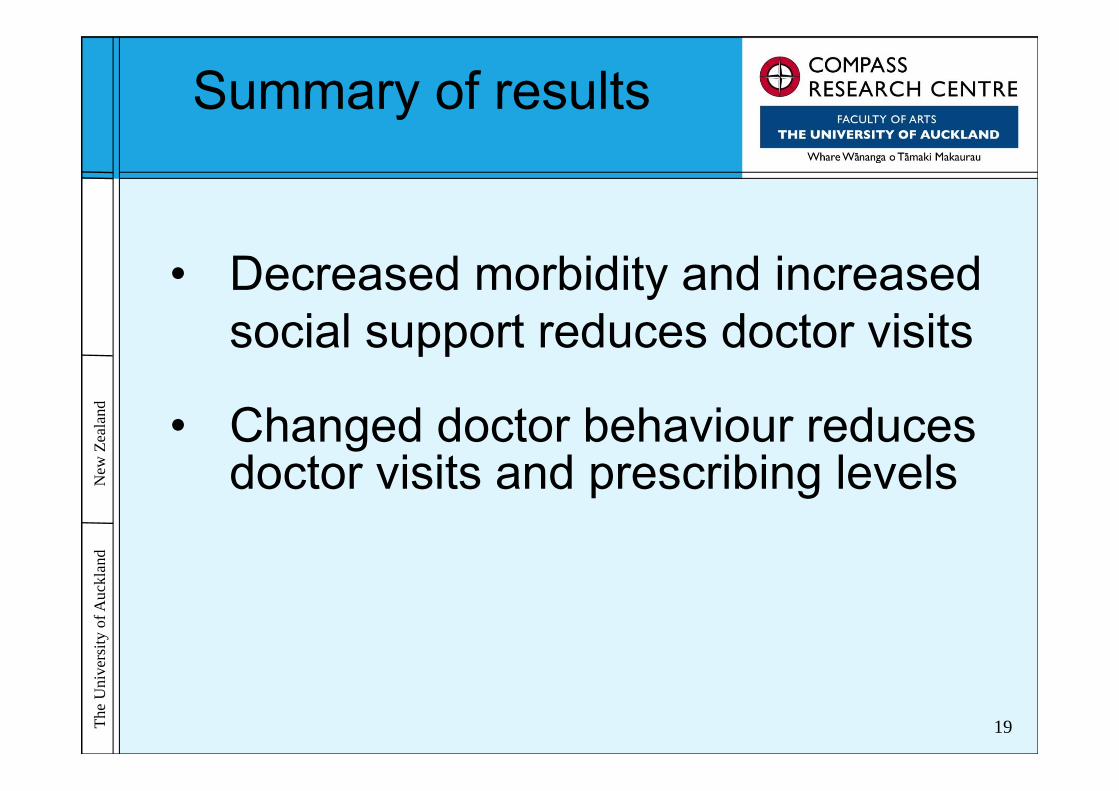
ndSummary of results
19
• Decreased morbidity and increased social support reduces doctor visits
• Changed doctor behaviour reduces doctor visits and prescribing levels

Mt Taranaki – Bryan Lay-Yee

The
Uni
vers
ity o
f Auc
klan
dN
ew Z
eala
ndOur microsimulation models- which are they?
21
• Modelling demographic ageing and primary health care
(PCASO 2005-8)
• Modelling demographic ageing and long-term health
and social care (BCASO 2009-12)
• Modelling the early life course (MEL-C 2008-2013)
The
Uni
vers
ity o
f Auc
klan
dN
ew Z
eala
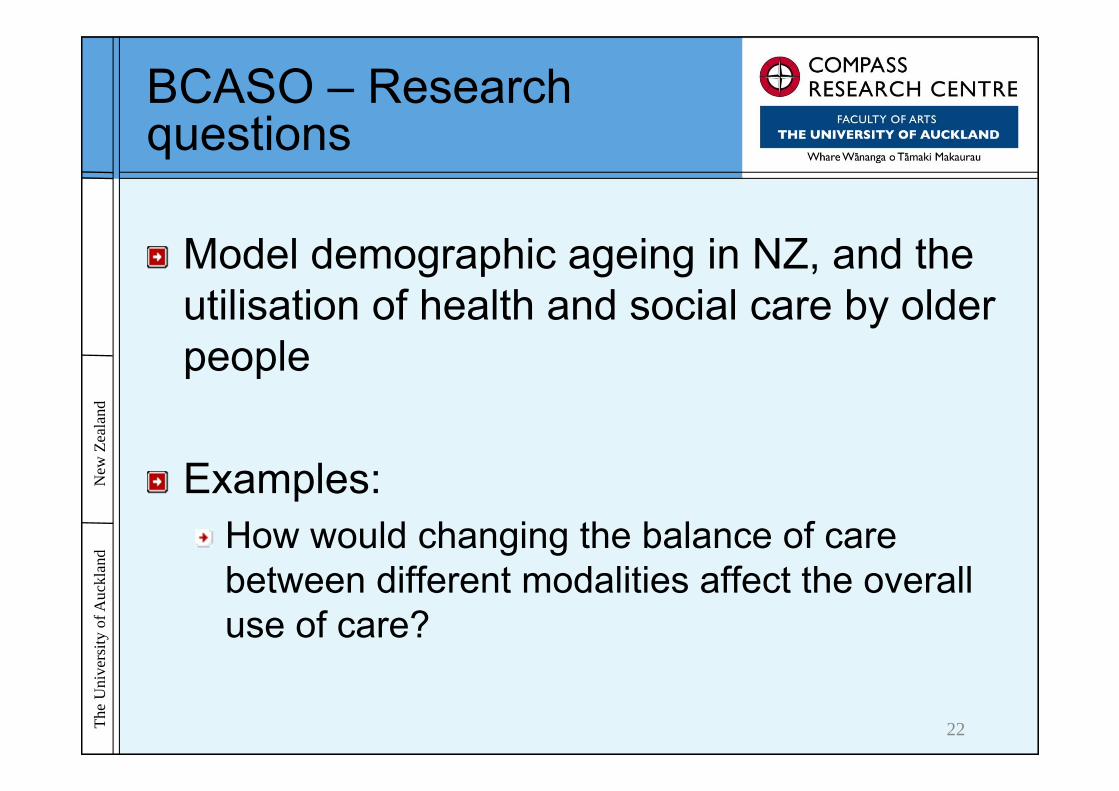
ndBCASO – Research questions
22
Model demographic ageing in NZ, and the utilisation of health and social care by older people
Examples:How would changing the balance of care between different modalities affect the overall use of care?
The
Uni
vers
ity o
f Auc
klan
dN
ew Z
eala
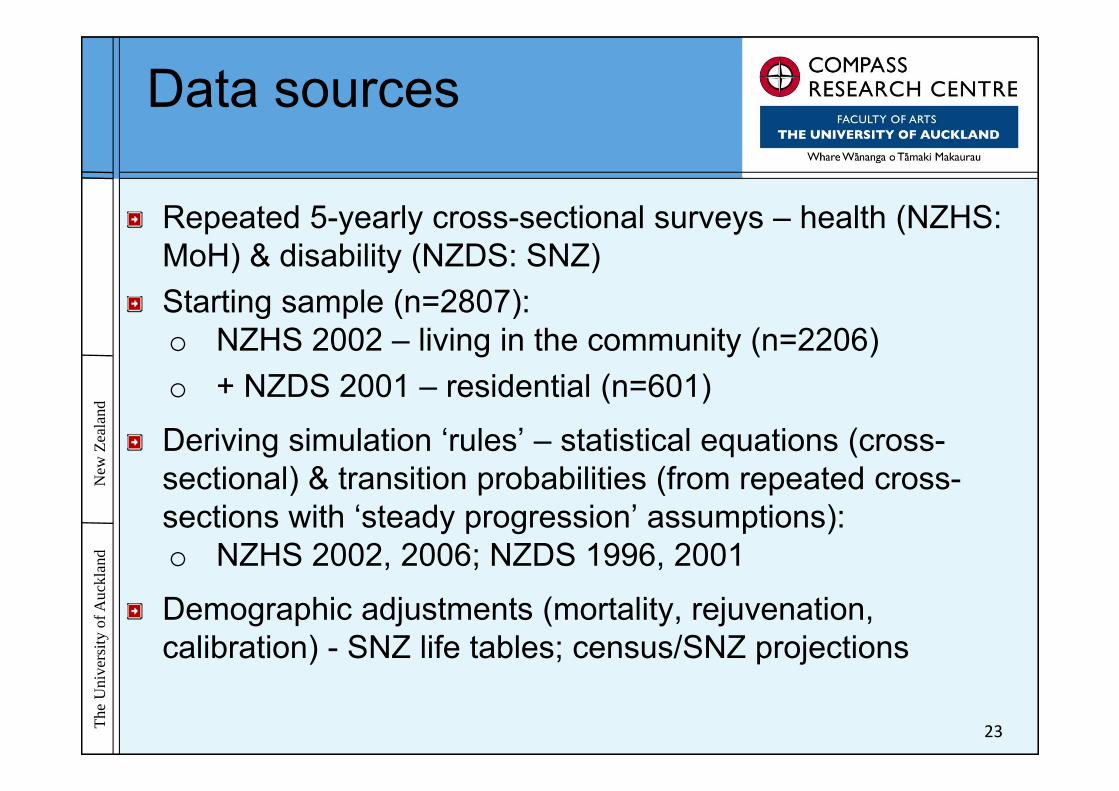
ndData sources
Repeated 5-yearly cross-sectional surveys – health (NZHS: MoH) & disability (NZDS: SNZ) Starting sample (n=2807): o NZHS 2002 – living in the community (n=2206) o + NZDS 2001 – residential (n=601)
Deriving simulation ‘rules’ – statistical equations (cross-sectional) & transition probabilities (from repeated cross-sections with ‘steady progression’ assumptions):o NZHS 2002, 2006; NZDS 1996, 2001
Demographic adjustments (mortality, rejuvenation, calibration) - SNZ life tables; census/SNZ projections
23
The
Uni
vers
ity o
f Auc
klan
dN
ew Z
eala
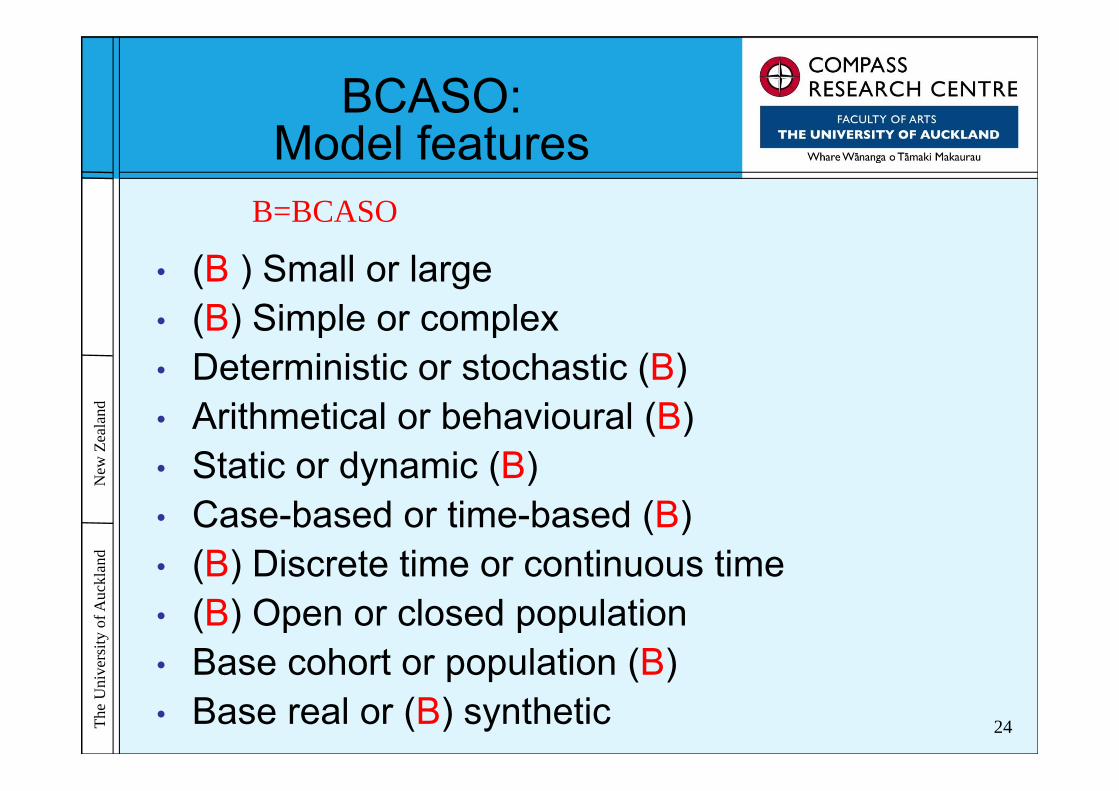
ndBCASO:
Model features
24
B=BCASO
• (B ) Small or large • (B) Simple or complex • Deterministic or stochastic (B)• Arithmetical or behavioural (B)• Static or dynamic (B)• Case-based or time-based (B)• (B) Discrete time or continuous time• (B) Open or closed population • Base cohort or population (B)• Base real or (B) synthetic
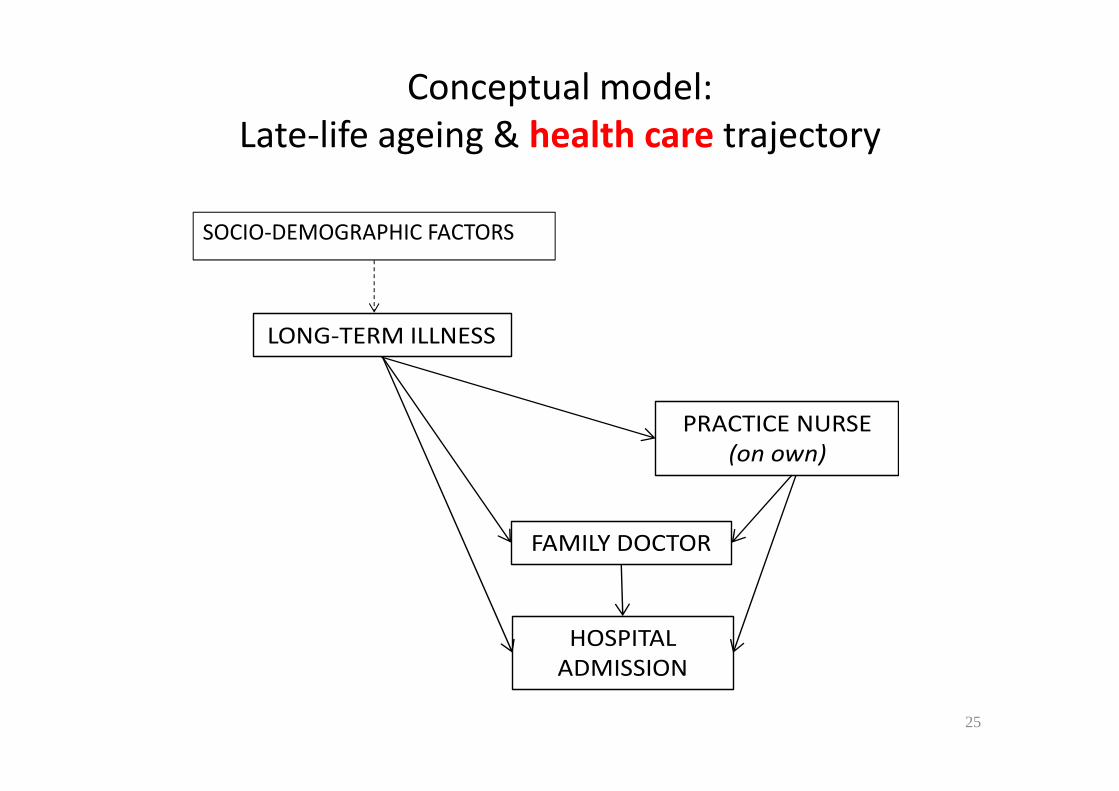
Conceptual model: Late‐life ageing & health care trajectory
PRACTICE NURSE (on own)
HOSPITAL ADMISSION
FAMILY DOCTOR
LONG‐TERM ILLNESS
25
SOCIO‐DEMOGRAPHIC FACTORS

Results: Increasing practice nurse use for older people living in the community, 2021
• Care scenario ‐ increasing level of practice nurse use (e.g. 85+ & ‘All’) reduced family doctor visits (by 6%), and hospital admissions (by 60%)
26
Simulations Health care modalities
Practice nurse (on own) (%)
Family doctor 5+ visits p. yr. (%)
Public hospital admission (%)
Aged 65+ Aged 85+ Aged 65+ Aged 85+ Aged 65+ Aged 85+
2021
Base projection 43.3 42.4 43.5 48.8 21.8 23.1
Care scenario
5% increase 43.5 50.5 21.9 22.4
10% increase 43.4 50.4 21.9 21.9
20% increase 43.2 48.4 21.5 17.2
50% increase 42.4 47.9 21.0 13.0
All 40.6 46.0 19.8 9.3
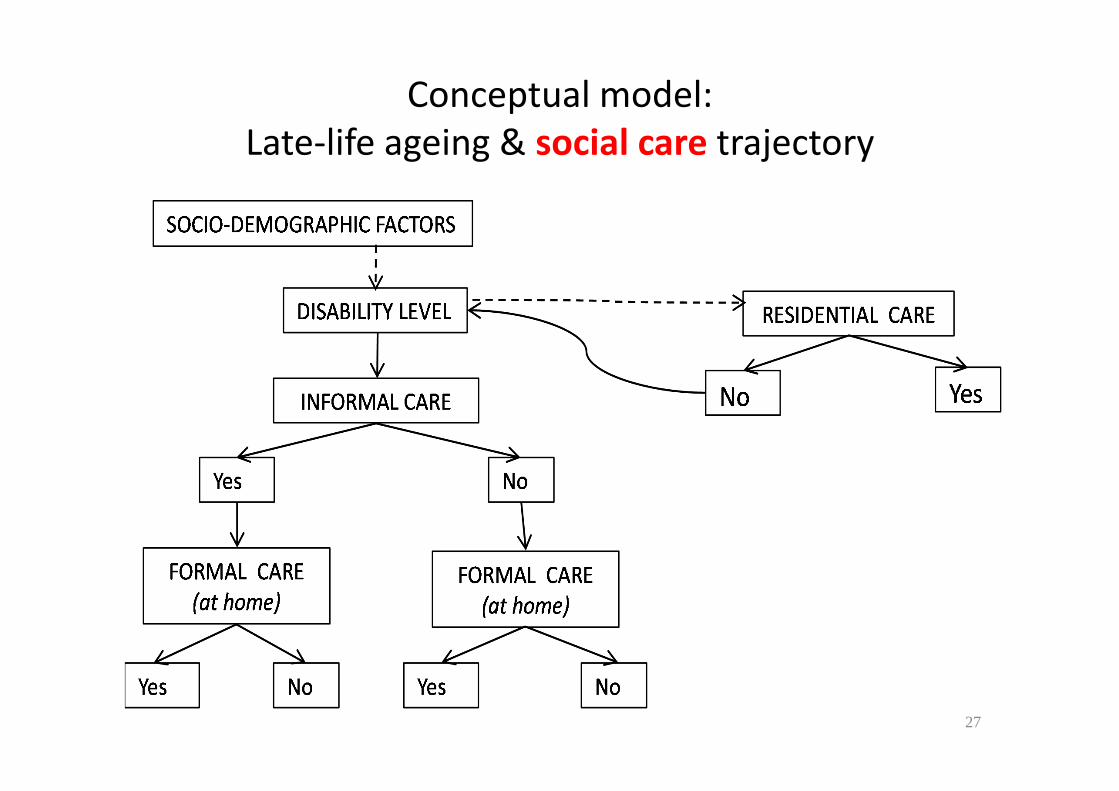
Conceptual model: Late‐life ageing & social care trajectory
27

Results: Achieving reductions in residential care for people aged 65+, 2021
• Base projection ‐ 2001 to 2021 shows increases in residential care (up 3%)• Care scenario ‐ setting reduced levels of residential care (e.g. by 20%) show that such
reductions can be achieved by moderate increases in community care – informal (by 2%) and formal (by 2%)
28
Simulations Social care modalities(for householders with some level of disability and residents)Any informal (%) Any formal (%) Residential (%)
2001Base status quo 31.3 31.3 10.7
2021Base projection 36.1 31.9 11.0
Care scenario 36.1 31.9 5% reduction
36.7 32.4 10% reduction
36.9 32.6 20% reduction
38.3 34.1 50% reduction
The
Uni
vers
ity o
f Auc
klan
dN
ew Z
eala
ndSummary of results
29
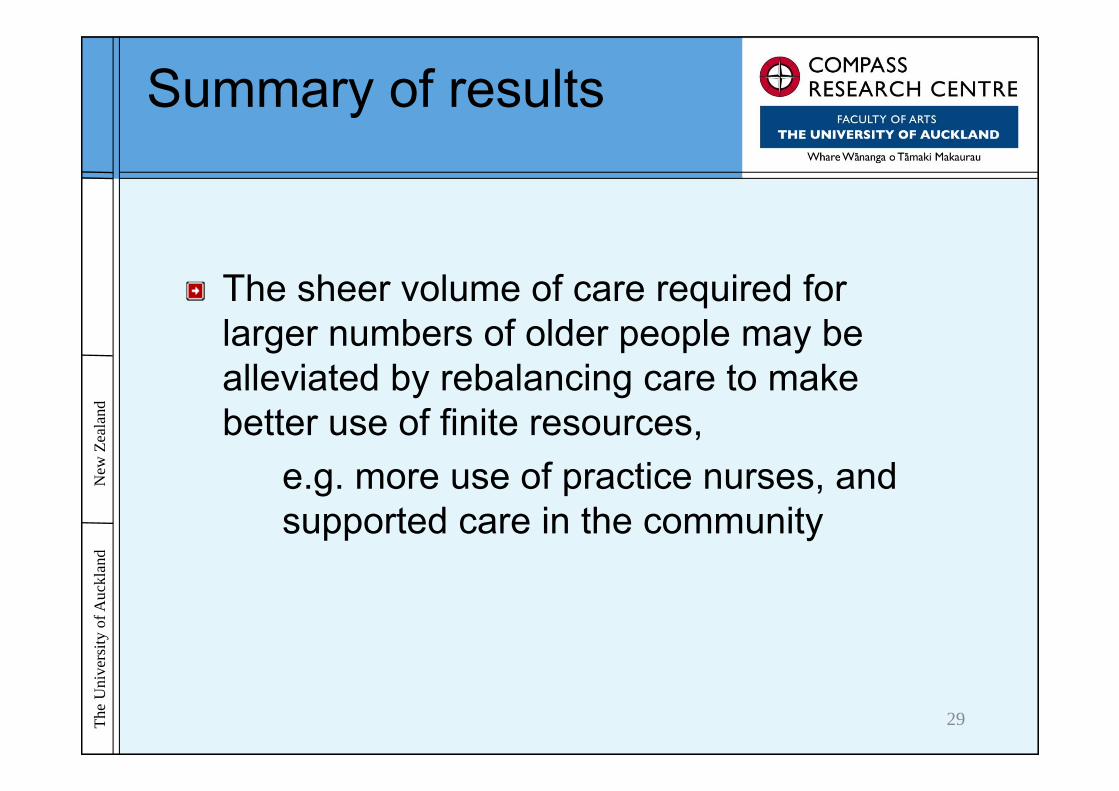
The sheer volume of care required for larger numbers of older people may be alleviated by rebalancing care to make better use of finite resources,
e.g. more use of practice nurses, and supported care in the community

Mt Tongariro – Bryan Lay-Yee

The
Uni
vers
ity o
f Auc
klan
dN
ew Z
eala
ndOur microsimulation models- which are they?
31
• Modelling demographic ageing and primary health care
(PCASO 2005-8)
• Modelling demographic ageing and long-term health and
social care (BCASO 2009-12)
• Modelling the early life course (MEL-C 2008-2013)

The
Uni
vers
ity o
f Auc
klan
dN
ew Z
eala
ndMEL-C: Research questions
Model key determinants of child outcomes in the early life course
Examples: What is the effect of improving various determinants on access to GP care?
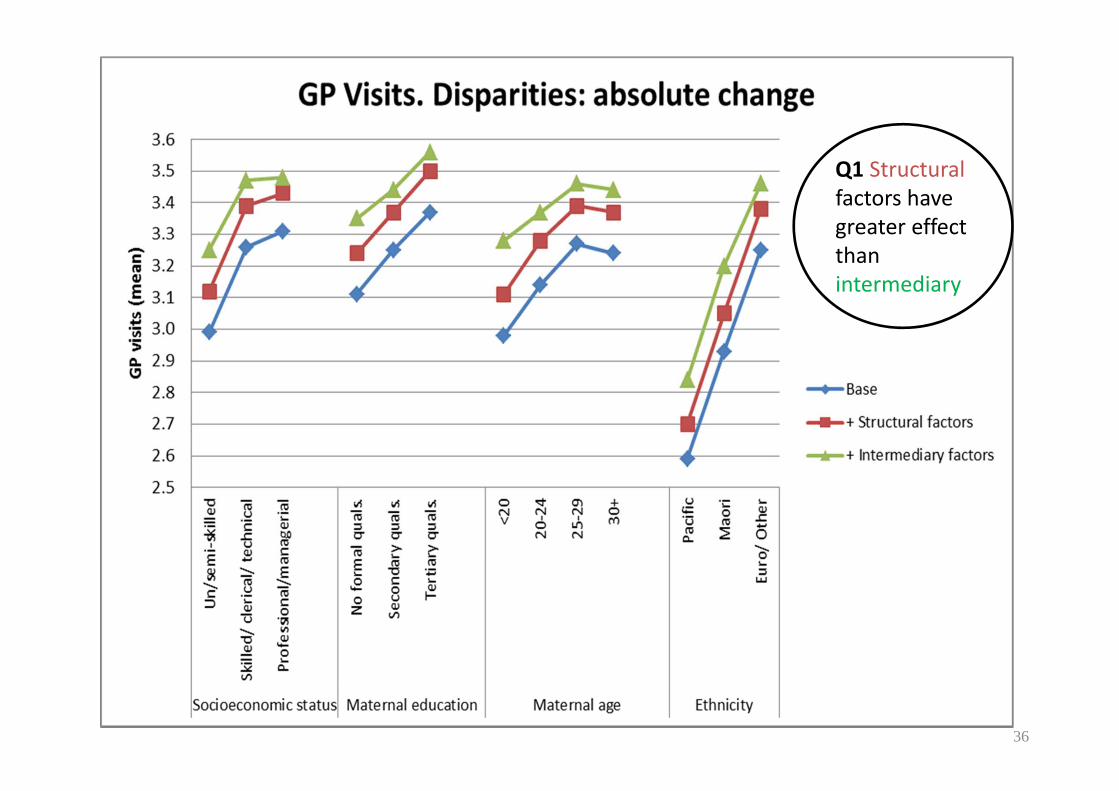
Q1. Are structural or intermediary factors more influential? Q2. Is there greater impact on socially disadvantaged groups?
32

Model of structural and intermediary influences on child outcomes (Christchurch study data only)
Structural factors (fixed)
Child• Gender• EthnicityParental• Age (at birth of child)• Ethnicity• EducationFamilial• Socio‐economic position
(at birth of child)
Proxy indicators (modifiable)
Family composition• Single‐ or two‐parent• Number of childrenIncome source• Parent employment• Welfare dependence
Intermediary factors (modifiable)
• Owned/ rented home• Overcrowding• Accommodation type• Change of parent• Change of residence• Parental smoking
GP visits
Outcomes
33

The
Uni
vers
ity o
f Auc
klan
dN
ew Z
eala
ndFour Studies, and NZ Census
Christchurch Health & Development Study (CHDS)• 1265 children born in Christchurch 1977
Dunedin Multidisciplinary Health & Development Study (DMHDS)
• 1037 children born in Dunedin 1972/3
Pacific Islands Families Study (PIFS)• 1398 children born at Middlemore Hospital, 2000, with at least one
parent of Pacific Islands ethnicity
Te Hoe Nuku Roa Study (THNR) Longitudinal study of Māori households (beginning 1995)568 children (0-12)
NZ Census 2006 • Used to create synthetic base-file of10,000 composite children
34

The
Uni
vers
ity o
f Auc
klan
dN
ew Z
eala
ndMEL-C:
Model features
35
M=MEL-C
• Small or (M) large • (M) Simple or complex • Deterministic or stochastic (M)• Arithmetical or behavioural (M)• Static or dynamic (M)• Case-based or time-based (M)• (M) Discrete time or continuous time• (M) Open or closed population • Base cohort or population (M)• Base real or (M) synthetic
36
Q1 Structural factors have greater effect than intermediary
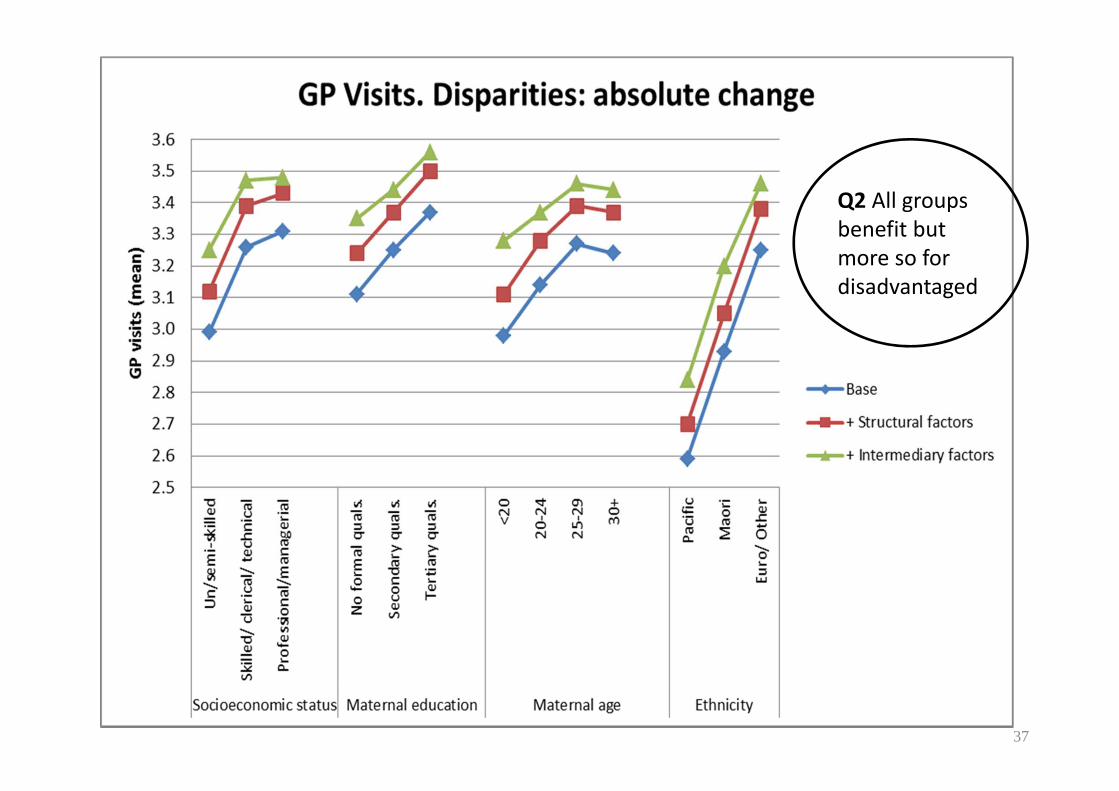
37
Q2 All groups benefit but more so for disadvantaged

The
Uni
vers
ity o
f Auc
klan
dN
ew Z
eala
ndSummary of results
Q1: Effect of modifiable structural factors is greater than of intermediary factors
Q2: “Inverse” effect gradient: i.e. progressively more positive impact on outcome with greater social disadvantage
38

Mahuia Rapids – Bryan Lay-Yee

The
Uni
vers
ity o
f Auc
klan
dN
ew Z
eala
ndOutline
COMPASS Research Centre
Role of microsimulation in public policy development
Our microsimulation models
Lessons learnt (and challenges)
International collaboration
Conclusion40
The
Uni
vers
ity o
f Auc
klan
dN
ew Z
eala
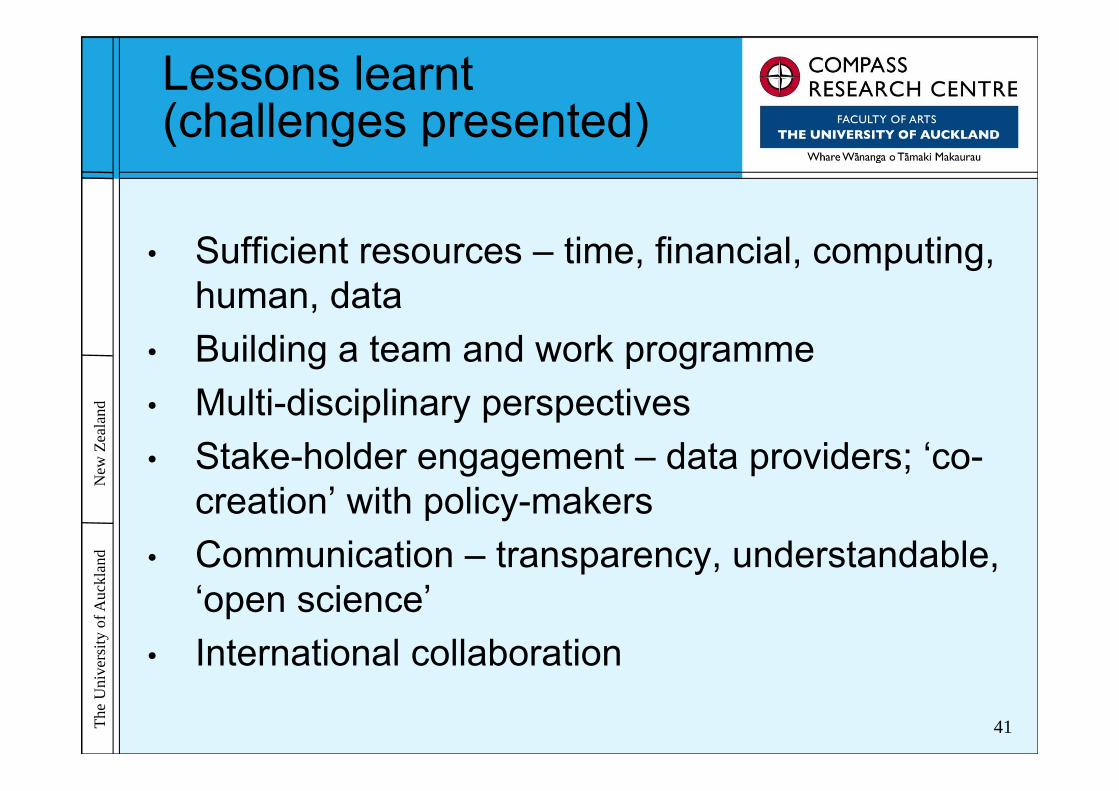
ndLessons learnt (challenges presented)
• Sufficient resources – time, financial, computing, human, data
• Building a team and work programme• Multi-disciplinary perspectives• Stake-holder engagement – data providers; ‘co-
creation’ with policy-makers• Communication – transparency, understandable,
‘open science’• International collaboration
41

The
Uni
vers
ity o
f Auc
klan
dN
ew Z
eala
ndInternational collaboration – ‘making the circle wide’
• Sharing expertise – concepts; methods• Sharing data sources• Not having to ‘re-invent the wheel’; synergies• Developing and adhering to accepted best practice
standards• Resource-effective (incl. cost); co-funding• Cross-national comparisons• Examples:
• Specific projects above – Australia, Europe, Canada • eGovPolinet consortium – world-wide
42

eGovPoliNet Consortium“Multidisciplinary group of experts in ICT enabled solutions for public governance and policy modelling.”
University of Koblenz-Landau (coordinator), GermanyTechnical University Kosice, SlovakiaTechnical University Delft, NetherlandsCentre for Research and Technology Hellas (CERTH), GreeceVolterra Partners LLP, United KingdomInnova SPA, ItalyFree University Brussels, BelgiumUniversity Laval, CanadaBrunel University, United KingdomCenter for Technology in Government, University at Albany, United States of AmericaUniversity Groningen, NetherlandsUniversity of Auckland, New ZealandKhmelniskiy National University, UkrainePontifícia Universidade Católica do Paraná, Brazil UN University International Institute for Software Technology (UNUIIST), People's Republic of ChinaMoscow State University, Russian Federation University College Dublin, National University of Ireland, Dublin, IrelandUniversity of Technology Sydney, AustraliaEA European Academy of Technology and Innovation Assessment GmbH, GermanySt Petersburg National Research University of Information Technologies Mechanics & Optics, Russian Fed.
43

The
Uni
vers
ity o
f Auc
klan
dN
ew Z
eala
ndConclusion
Micro-simulation and decision support/inquiry systemWith the right empirical and conceptual anchoring, and working closely with colleagues in the policy process, our tool could be the basis of a more evidence-informed policy approach
Future plansInsert effect estimates from the literature (knowledge laboratory)
Assess more complex interventions and outcomes
Improve causal power of underlying statistical analysis
Broaden stake-holder engagement
Further develop international linkages
44
The
Uni
vers
ity o
f Auc
klan
dN
ew Z
eala
ndSelected Research Outputs
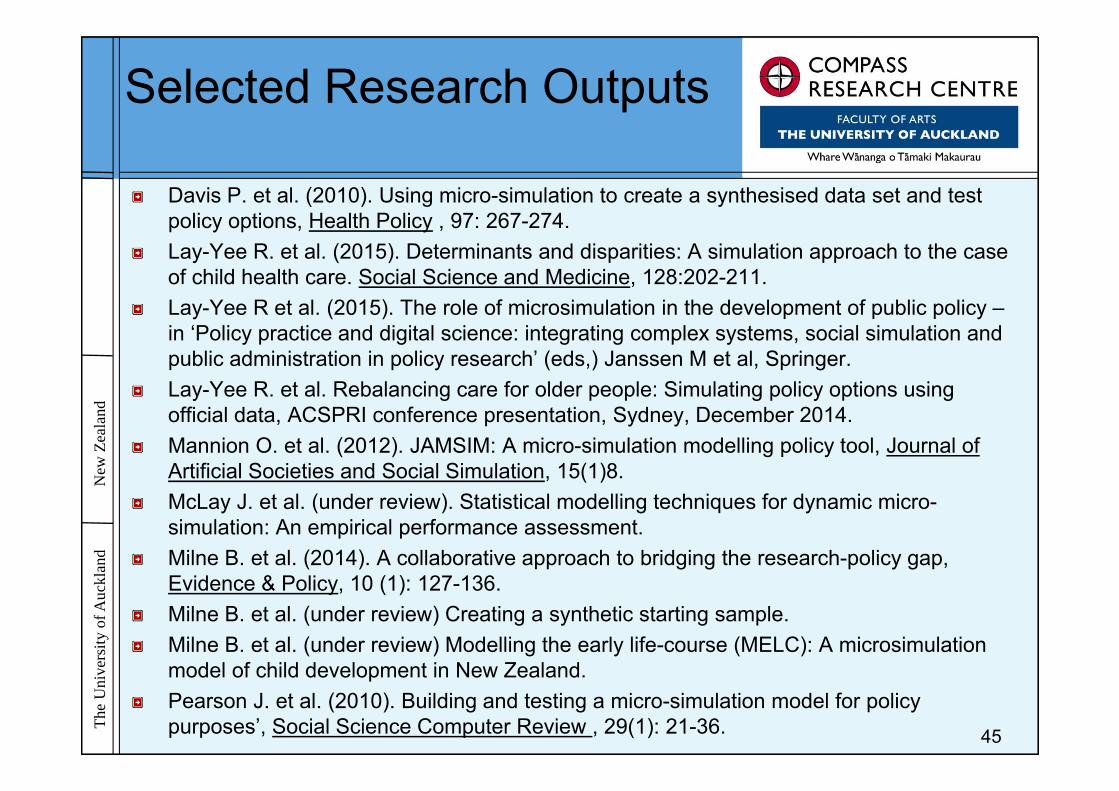
Davis P. et al. (2010). Using micro-simulation to create a synthesised data set and test policy options, Health Policy , 97: 267-274.Lay-Yee R. et al. (2015). Determinants and disparities: A simulation approach to the case of child health care. Social Science and Medicine, 128:202-211.Lay-Yee R et al. (2015). The role of microsimulation in the development of public policy –in ‘Policy practice and digital science: integrating complex systems, social simulation and public administration in policy research’ (eds,) Janssen M et al, Springer.Lay-Yee R. et al. Rebalancing care for older people: Simulating policy options using official data, ACSPRI conference presentation, Sydney, December 2014.Mannion O. et al. (2012). JAMSIM: A micro-simulation modelling policy tool, Journal of Artificial Societies and Social Simulation, 15(1)8.McLay J. et al. (under review). Statistical modelling techniques for dynamic micro-simulation: An empirical performance assessment.Milne B. et al. (2014). A collaborative approach to bridging the research-policy gap, Evidence & Policy, 10 (1): 127-136.Milne B. et al. (under review) Creating a synthetic starting sample.Milne B. et al. (under review) Modelling the early life-course (MELC): A microsimulation model of child development in New Zealand.Pearson J. et al. (2010). Building and testing a micro-simulation model for policy purposes’, Social Science Computer Review , 29(1): 21-36. 45
Hamilton's Gap Sunset– Bryan Lay-Yee
The
Uni
vers
ity o
f Auc
klan
dN
ew Z
eala
nd
Microsimulationmodels in
New Zealand (Aotearoa)Workshop on Microsimulation Models in Asia-Pacific Region February 12, 2015
Roy Lay-Yee COMPASS Research CentreUniversity of Auckland, New Zealandemail: [email protected]: www.compass.auckland.ac.nz


