

Policy Advisory CommitteePolicy Advisory Committee
August 14, 2009August 14, 2009
presented bypresented byCambridge Systematics, Inc.Cambridge Systematics, Inc.KimleyKimley--Horn and Associates, Inc.Horn and Associates, Inc.TKDA, Inc.TKDA, Inc.
Minnesota Comprehensive Statewide Freight and Passenger Rail Plan

1
Agenda
Introductions and Opening Comments• Dave Christianson – Project Manager, MnDOT • Tim Henkel – Division Director, MnDOT
Presentation on State Rail Plan, Cambridge Systematics, Inc.• Study Overview, Marc Cutler• Outreach Update, Randy Halvorson• Freight Rail Demand, Andreas Aeppli• Passenger Rail Demand, Marc Cutler• Passenger/Freight Integration, Paul Danielson• Performance Measures, Erika Witzke• Next Steps, Marc Cutler
Discussion – Randy Halvorson
Study OverviewMarc Cutler

3
Project Phases
Project PhaseProject Phase DescriptionDescription TaskTaskRail VisionRail Vision
Inventory Freight System and Passenger Inventory Freight System and Passenger Rail PlansRail Plans
Integration of passenger and freight Integration of passenger and freight planning, and development of performance planning, and development of performance criteria criteria Plan Development Plan Development –– Needs, Institutional Needs, Institutional Arrangements, Programs, FinancingArrangements, Programs, Financing
Phase IPhase I Task 1Task 1
Phase IIPhase II Tasks 2 and 3Tasks 2 and 3
Phase IIIPhase III Tasks 4 and 5Tasks 4 and 5
Phase IVPhase IV Tasks 6Tasks 6--99
Continuous Public OutreachContinuous Public Outreach Task 10Task 10
Final ReportFinal Report Task 11Task 11

4
Schedule
Mar 1 Apr 2 May 3 Jun 4 Jul 5 Aug 6Task
1. Create Vision
2. Inventory Rail Freight System
3. Identify PassengerRail Network
4. Integrate Freight and Passenger Planning
5. Parameters for Corridor Priority
6. Establish Investment Needs
7. Role of Private versus Public Sectors
8. Institutional Guidance
9. Funding and Programming
10. Public Outreach
11. Final Report
End Task
Month
Sep 7 Oct 8 Nov 9 Dec 10
Start Task Key Outreach Activities

Public OutreachPublic OutreachRandy Halvorson, FacilitatorRandy Halvorson, Facilitator

6
Outreach Activities Since Open Houses and Last PAC/TAC Meetings
Minnesota HSR Commission – June, July, AugustJoint Meeting – St. Paul, June 26• Fresh Energy• Housing Preservation Project• Transit for Livable Communities
Minnesota Regional and Shortline Railroads Annual Conference – Grand Rapids, July 12-14United Transportation Union (UTU) – St. Paul, July 15Twin Cities and Western RR – Glencoe, July 15Railroad shippers – West Central MN, AugustIndividual stakeholder meetings
• Growth and Justice• Sierra Club• 1,000 Friends of Minnesota
7
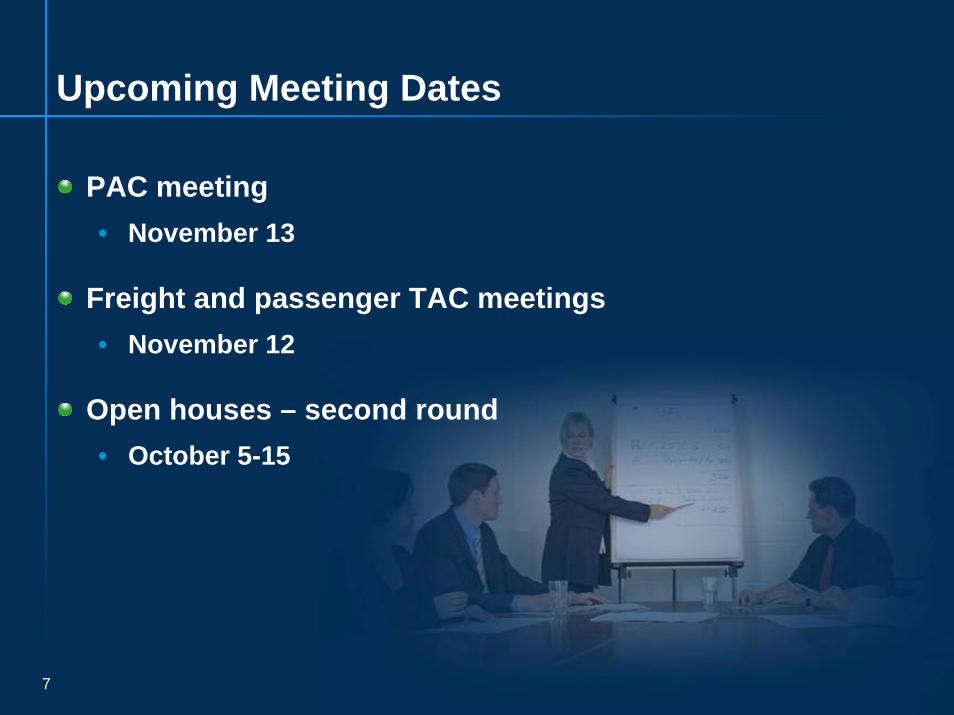
Upcoming Meeting Dates
PAC meeting• November 13
Freight and passenger TAC meetings• November 12
Open houses – second round• October 5-15

Freight Rail DemandFreight Rail Demand
Andreas AeppliAndreas Aeppli

9
Freight Rail Demand
What drives demand for freight – Minnesota’s economic structure and future industry prospects
Minnesota’s multimodal freight system
Future trends

10
Economic Size of Leading Minnesota MetrosJobs and Gross Product
Source:Source: Bureau of Economic Analysis; *Moorhead componentBureau of Economic Analysis; *Moorhead componentof Fargoof Fargo--Moorhead included in “Rest of Minnesota”. Moorhead included in “Rest of Minnesota”.
0
25
50
75
100
125
150
175
200
Twin Cities Rest ofMinnesota
Duluth Fargo-Moorhead*
Rochester St. Cloud Mankato0
250
500
750
1,000
1,250
1,500
1,750
2,000
Gross Product (in $billions) Employment (in thousands)
Gross Product (Dollars in Billions) Jobs (in Thousands)

11
Key Minnesota IndustriesJobs and Contribution to Gross State Product
Sources: Bureau of Economic Analysis and Bureau of Labor Statistics.
0
10
20
30
40
Dis
trib
utio
n,W
areh
ousi
ng,
and
Ret
ail
Man
ufac
turin
g
Con
stru
ctio
n
Agr
icul
ture
and
Food
Pape
r and
Woo
d
Life
Sci
ence
s
Ener
gy
Min
ing
0
100
200
300
400
500
Gross Product (in $billions) Employment (in thousands)
GDP (Dollars in Billions) Jobs (in Thousands)

12
U.S. and Minnesota Modal Usage
Other19%
Truck44%
Rail30%
Water7%
Truck Rail
Water Other
Other7%
Water6%
Rail38%
Truck49%
Truck Rail
Water Other
Overall U.S. Minnesota
Tonnage
Value
Truck88%
Other5%Water
1%Rail4%
Air 2%
Truck Rail WaterAir Other
Other1%
Truck81%
Air0%Water
0%Rail18%
Truck Rail Water
Air Other

13
Traffic Characteristics Vary Greatly Between Rail and Other Modes
10% of rail versus almost 50% of truck tonnage moves intrastate
Only 13% of all truck tonnage moves through the state
Intrastate23%
Outbo und25%
Inbo und21%
T hro ugh31%
All Modes – 2007
0
20
40
60
80
100
120
140
160
180
Inbo und Outbo und T hro ugh Intrastate
200720202030
Tons (in Millions)
Rail
14
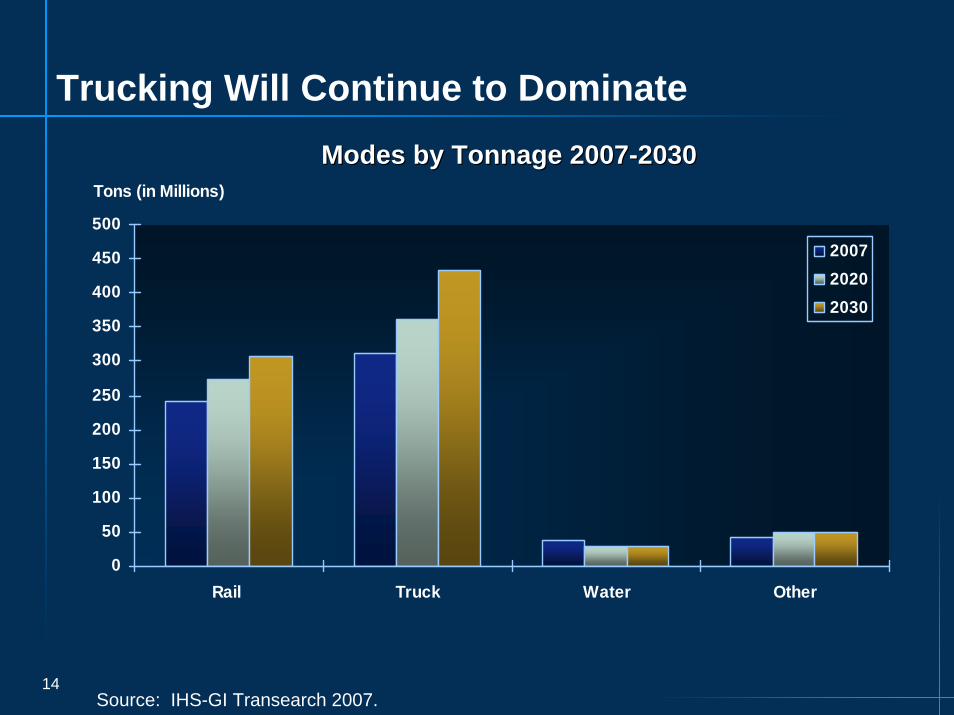
Trucking Will Continue to Dominate
0
50
100
150
200
250
300
350
400
450
500
Rail Truck Water Other
200720202030
Tons (in Millions)
Modes by Tonnage 2007Modes by Tonnage 2007--20302030
Source: IHS-GI Transearch 2007.

15
2007 Intermodal Units Constituted 1/3 of Rail Traffic
C arlo ad93%
Intermo dal
7%
Split by Tonnage
Carload93%
Intermodal7%
Carload65%
Intermodal35%
Split by Units
Carload65%
Intermodal35%
Source: IHS-GI Transearch 2007.
16
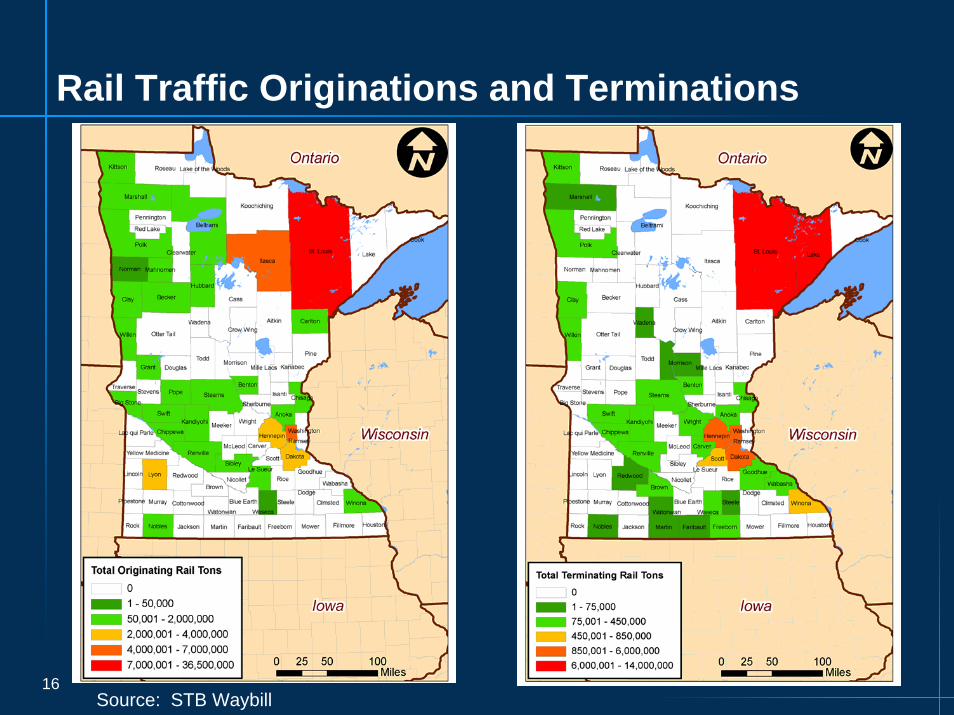
Rail Traffic Originations and Terminations
Source: STB Waybill

17
Future Growth in Tonnage on Minnesota’s Rail Network - 2007 and 2030
Source: IHS-GI Transearch 2007.
18
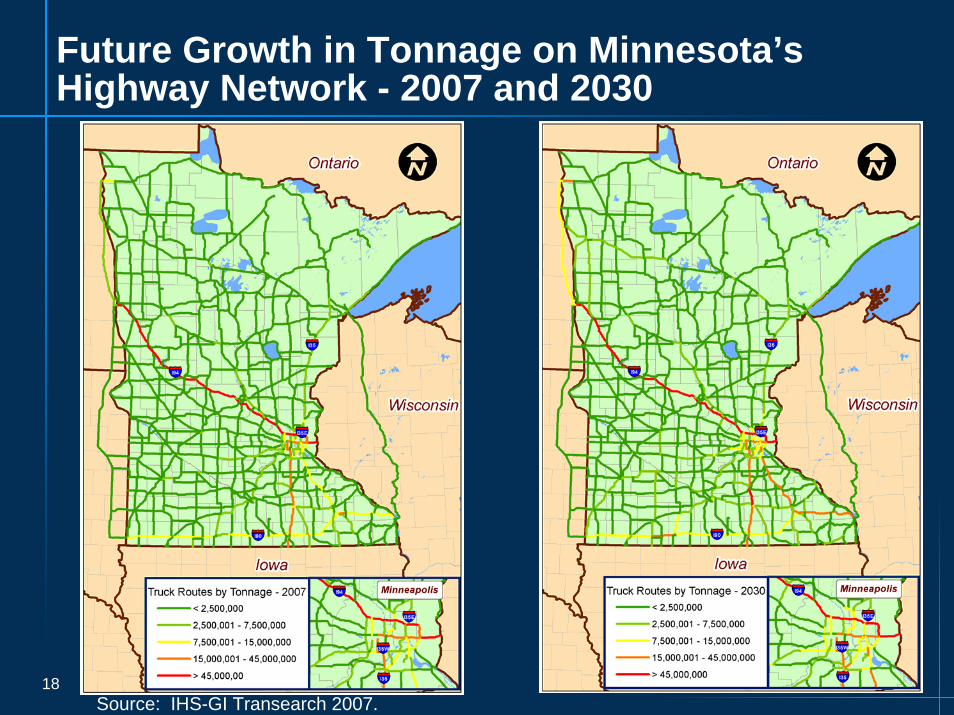
Future Growth in Tonnage on Minnesota’s Highway Network - 2007 and 2030
Source: IHS-GI Transearch 2007.

19
Smaller Railroads are Important to Minnesota
Smaller railroads handled 4.6% of all traffic, 5.5% of traffic that has a Minnesota origin or destination.
Traffic TypeTraffic TypeNonNon--Class I Class I
Carloads (2007)Carloads (2007) All RailroadsAll Railroads % of Total Carloads% of Total Carloads
InboundInbound 17,61517,615 412,594412,594 4.3%4.3%
OutboundOutbound 46,72446,724 567,736567,736 8.2%8.2%
ThroughThrough 38,60138,601 1,083,6001,083,600 3.6%3.6%
IntrastateIntrastate 7,2667,266 316,727316,727 2.3%2.3%

20
A Few Conclusions for Freight
As in most regions, at 81% of value and 49% of tonnage, highways handled the majority freight trafficBut, at 19% for value and 38% of tonnage, rail is a very important component of Minnesota’s multimodal freight systemMix of industries and geography play to railroad’s strengths of handling high volumes over long distancesIHS-Global Insight forecast predicts 25% growth in rail tonnage through 2030. However, while it attributes substantial growth to intermodal, anticipated growth in coal is questionableCross-border traffic with Canada is significant, accounting for 18% of all tonnage in 2007, and expected growth of 61% by value through 2030.8.2% of originated carloads start their trip on a short line.

Passenger Rail Demand
Marc Cutler
22
Passenger Rail Corridors Studied
Corridors that connect to the Twin Cities
Some corridors begin with commuter rail studies
Other corridors have been the subject of intercity passenger rail and high speed rail studies
Still others have been suggested

23
Intercity Passenger Rail Corridors

24
Ridership Forecasting Scope
Synthesize available information about the railroad network and passenger rail demand
Developed spreadsheet model to analyze future (2030) baseline• Consistent demand analysis to integrate with other factors
such as cost and capacity• Conservative demand assumptions• Apples to apples comparison
What this is NOT• A substitute for full regional demand modeling• The last word on ridership forecasts• Policy direction

25
Estimated Total Annual Trips (in Millions)2005
InIn--StateState
St. CloudSt. Cloud 11.011.0
HinckleyHinckley 5.85.8
RochesterRochester 4.84.8
DuluthDuluth 4.34.3
MankatoMankato 3.73.7
WillmarWillmar 1.61.6
Red WingRed Wing 1.01.0
Out of StateOut of State
ChicagoChicago 9.79.7
Eau ClaireEau Claire 5.85.8
MilwaukeeMilwaukee 4.44.4
MadisonMadison 4.24.2
FargoFargo 3.93.9
Des MoinesDes Moines 2.92.9

26
Forecast Annual Rail Demand – In State2030
RidershipRidership(in Thousands)(in Thousands) Mode ShareMode Share
St. CloudSt. Cloud 713713 5.5%5.5%
HinckleyHinckley 283283 4.4%4.4%
MankatoMankato 228228 5.6%5.6%
Rochester Rochester 224224 3.7%3.7%
NorthfieldNorthfield 111111 5.5%5.5%
DuluthDuluth 101101 2.6%2.6%
27
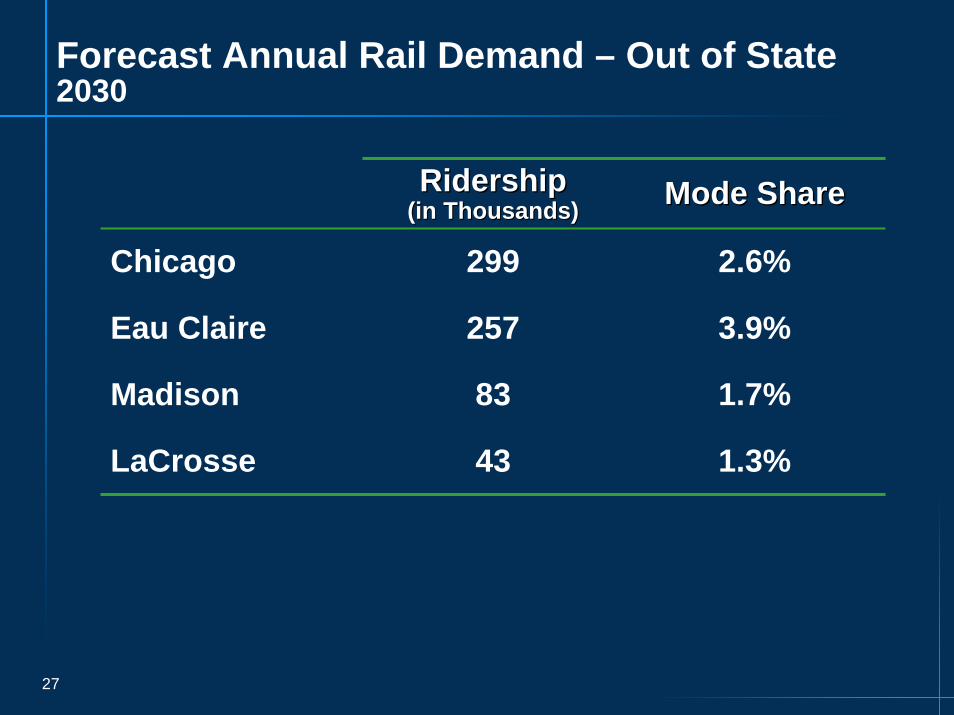
Forecast Annual Rail Demand – Out of State2030
RidershipRidership(in Thousands)(in Thousands) Mode ShareMode Share
Chicago 299 2.6%
Eau Claire 257 3.9%
Madison 83 1.7%
LaCrosse 43 1.3%

28
Sensitivity Tests
Multicentered growth – does not significantly impact conclusions
Higher overall state growth (+10%) – same as above
Diversion of all Rochester air trips to HSR via MSP –adds 450,000 trips for a total of 700,000
Inclusion of Superior adds 28,000 to Duluth ridershipfor a total of 129,000
MWRRI via Rochester = 524,000 versus387,000 via River Route
Doubling of gas prices = doubling of ridership

2929
Passenger/Freight Integration
Paul Danielson

3030
Passenger/Freight IntegrationTrack Capacity

3131
Passenger/Freight IntegrationCurrent LOS

3232
Passenger/Freight IntegrationFuture LOS
3333
Passenger/Freight IntegrationPTC
The Rail Safety Improvement Act of 2008 requires widespread installation of Positive Train Control (PTC) systems by 2015 for all Class I railroads and those entities providing regularly scheduled intercity or commuter rail passenger service.
PTC systems utilize integrated command, control, communications, and information systems technologies to prevent train-to-train collisions, casualties to roadway workers and damage to their equipment, and overspeedderailments.
The systems can vary in complexity and sophistication.

3434
Passenger/Freight Integration Corridor Conditions – Tier I
CorridorCorridorPotential Potential RidershipRidership
Track Track ConditionCondition
Available Available CapacityCapacity
Coon Rapids Coon Rapids –– Big LakeBig Lake HighHigh GoodGood MediumMedium
Big Lake Big Lake –– St. CloudSt. Cloud HighHigh GoodGood LowLow
Minneapolis Minneapolis –– WillmarWillmar MediumMedium FairFair HighHigh
Minneapolis Minneapolis –– St. Paul (BNSF)St. Paul (BNSF) HighHigh FairFair MediumMedium
Minneapolis Minneapolis –– St. Paul (CP)St. Paul (CP) HighHigh FairFair MediumMedium
St. Paul St. Paul –– HastingsHastings HighHigh FairFair HighHigh
Hastings Hastings –– WinonaWinona HighHigh FairFair HighHigh
St. Paul St. Paul –– NorthfieldNorthfield MediumMedium FairFair HighHigh
Northfield Northfield –– Albert Lea (Kansas City)Albert Lea (Kansas City) LowLow GoodGood HighHigh
Minneapolis Minneapolis –– MankatoMankato MediumMedium FairFair HighHigh
St. Paul St. Paul –– Eau Claire, WIEau Claire, WI MediumMedium FairFair HighHigh
3535
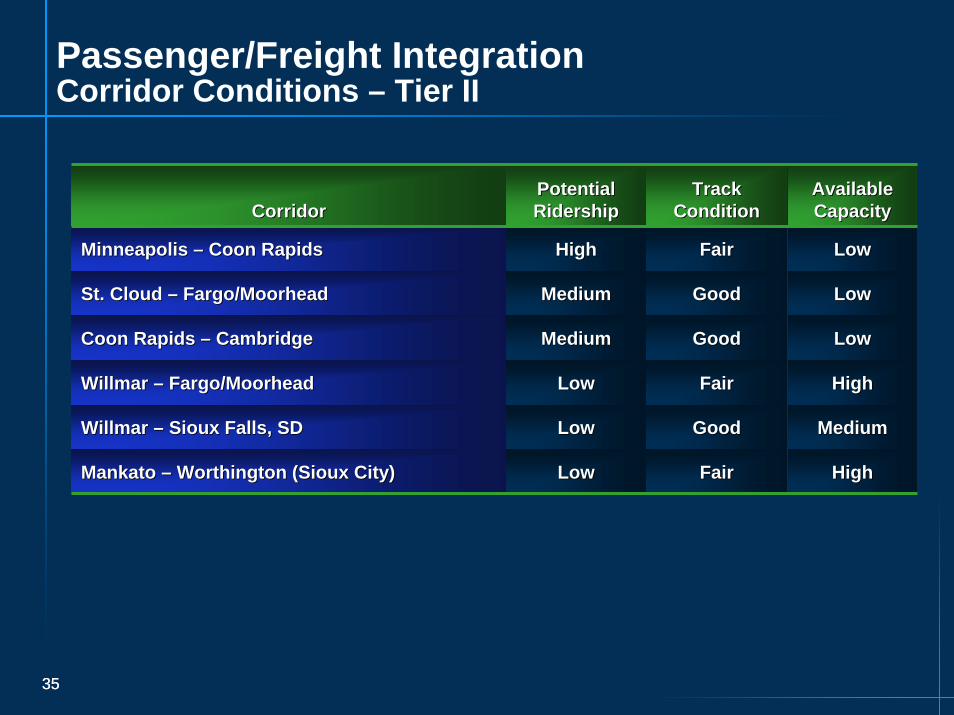
Passenger/Freight IntegrationCorridor Conditions – Tier II
CorridorCorridorPotential Potential RidershipRidership
Track Track ConditionCondition
Available Available CapacityCapacity
Minneapolis Minneapolis –– Coon RapidsCoon Rapids HighHigh FairFair LowLow
St. Cloud St. Cloud –– Fargo/MoorheadFargo/Moorhead MediumMedium GoodGood LowLow
Coon Rapids Coon Rapids –– CambridgeCambridge MediumMedium GoodGood LowLow
Willmar Willmar –– Fargo/MoorheadFargo/Moorhead LowLow FairFair HighHigh
Willmar Willmar –– Sioux Falls, SDSioux Falls, SD LowLow GoodGood MediumMedium
Mankato Mankato –– Worthington (Sioux City)Worthington (Sioux City) LowLow FairFair HighHigh

3636
Passenger/Freight IntegrationCorridor Conditions – Tier III
CorridorCorridorPotential Potential RidershipRidership
Track Track ConditionCondition
Available Available CapacityCapacity
Cambridge Cambridge –– DuluthDuluth MediumMedium FairFair LowLow
Rochester Rochester –– Owatonna Owatonna –– St. PaulSt. Paul LowLow FairFair HighHigh
Rochester Rochester –– Owatonna Owatonna –– Minneapolis Minneapolis LowLow PoorPoor HighHigh
Rochester Rochester –– WinonaWinona LowLow PoorPoor HighHigh
Minneapolis Minneapolis –– Norwood/Young AmericaNorwood/Young America LowLow PoorPoor HighHigh
Norwood/Young America Norwood/Young America –– MontevideoMontevideo LowLow PoorPoor HighHigh

37
Performance Measures
Erika Witzke

38
Performance MeasuresMethodology
Identified relevant topics/issues for evaluation
Reviewed planning efforts by MnDOT
Literature search on other DOTs, Amtrak, other rail operators, FRA efforts
Assembled separate measures for freightand passenger rail
Developed common list of performance measures

39
Rail Performance Measures
System Performance – capacity, speed, annual production of ton/miles, ridership
System Condition – track, bridges, crossings
Connectivity/Accessibility – proximity to users, commercial terms, modes
Safety & Security – at-grade crossings, hazmat
Environmental – positive and negative impacts of construction and operations
Financial/Economic – Capital costs, operations, taxes, jobs, economic development, cost/benefit comparisons

40
Developing Criteria for Public Rail Investment
Acceptable Cost versus Public Benefits
Ability of private sector to contribute to project funding
Significant Utility – Good Ridership, New Service Access
Addresses a Verified Need – Accommodates new passenger service, freight growth, or corrects bottleneck
Exhibits Multiple Benefits – combination of intercity passenger, local/commuter, and freight operations and capacity
Contributes to State’s Priorities – Environmental and green growth goals, reduced energy use, safety, enhanced land use, improved travel options, life style and competitiveness
Timeliness of Implementation

41
Next Steps
Marc Cutler

42
Phase IV Tasks
Task 6 – Establish Investment Needs• Estimate benefits versus performance measures• Estimate high-level costs
Task 7 – Determine Public versus Private Sector Roles
Task 8 – Provide Public Sector Institutional Guidance
Task 9 – Funding and Programming
Task 10 – Outreach • Second round of Open Houses – Oct• Final PAC/TAC meetings – Nov

DiscussionRandy Halvorson, Facilitator


