

1 Copyright © 2012 Mahindra & Mahindra Ltd. All rights reserved. 1
Nov. 2013
M&M Investor Presentation
2
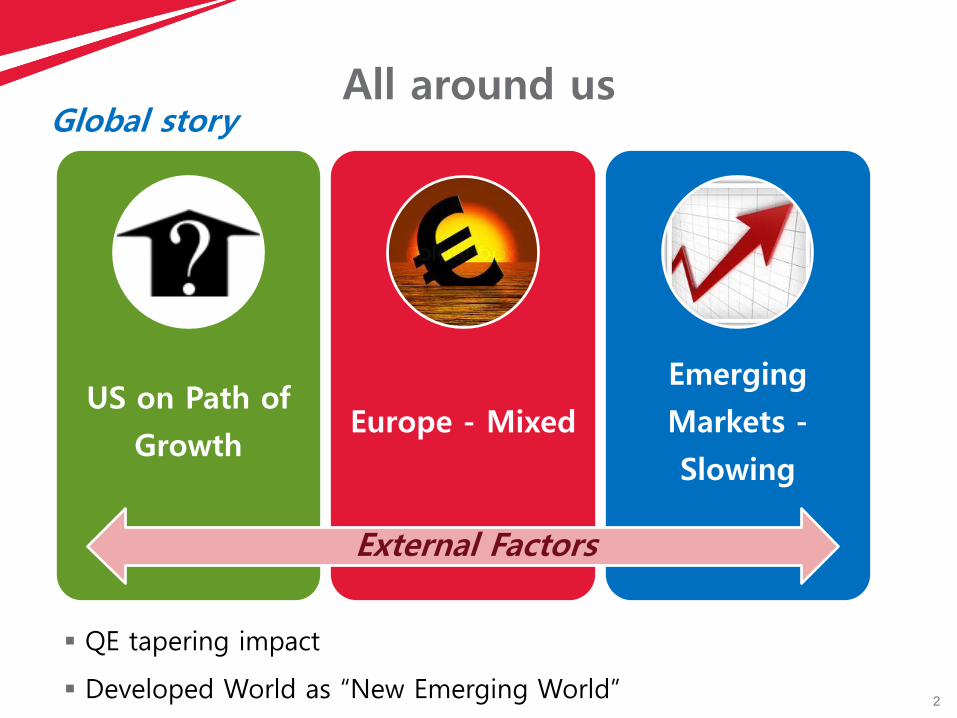
All around us
US on Path of
Growth Europe - Mixed
Emerging
Markets -
Slowing
External Factors
Global story
QE tapering impact
Developed World as “New Emerging World”

3
Political Uncertainty
Policy Action
GDP Growth
Current Account Deficit
Cost of Borrowing
Investment Slowdown
All around us
India story
FY 2014 will be crucial one to watch

4
Double-Edged Sword
Global Domestic

5
Business Sectors
Automotive & Farm Equipment
Aftermarket
Hospitality
Mahindra Partners (Steel, Retail, Trade, Logistics, Boats,
Energy, Media)
2 Wheeler
Systech
Information Technology
Real Estate
Defence Systems
Financial Services
The Mahindra Group comprises 10 business sectors with a presence in 18 Industries

6
Mahindra Group
Market leader in Utility Vehicles in India
Market leader in Tractors in India.
Number One Global tractor manufacturer (Single legal entity)
Mahindra Finance : Leader in rural financing
Tech Mahindra : Leader in Telecom Software
Mahindra Holidays : Leader in ‘Time Share’
Business Leadership

7
Mahindra & Mahindra Ltd.
M&M is one of India's leading utility vehicle and tractor manufacturers
Market leader – for H1FY14 – in UVs (market share 42.8%) and in Tractors
(market share 41.0%)
Equity Structure of the company –
– 25.3% Promoter & Promoter Group, 74.7% Public (44.6% Foreign)
As at Sept. 30, 2013
Manufacturing plants all across India –
– Auto plants – 6, Tractor plants – 7, Foundry plant – 1
– Subsidiaries – Total - 130 , Operational – 62 As at Sept. 30, 2013
Company Overview

8
Life Insurance Corporation of India
Golboot Holdings Ltd (Goldman Sachs)
Dodge & Cox
ICICI Prudential Life Insurance Ltd
First State Investments
Capital Group
General Insurance Corporation of India
Government of Singapore
The New India Assurance Company Ltd
Vanguard Emerging Markets Stock Index
Fund
J P Morgan Group
Top 10 Shareholders with > 1%
Shareholding Pattern …. 30 Sept., 2013
Promoter and
Promoter Group 25.3%
FII / NRI / GDR
44.6%
Insurance Cos.
15.1%
FI / MF / Banks 1.5%
Individuals 13.5%
9
Financials

10
Financial Highlights
Growth in Total income
Rs 9,888 crs
Rs 10,787 crs
-8%
Q2 – FY14 Vs Q2 – FY13 (M&M + MVML)
Rs 1,254 crs
Rs 1,280 crs
-2%
Rs 1,028 crs
Rs 978 crs
5%
Growth in EBIDTA Growth in PAT Growth in PAT

11
Financial Highlights
Growth in Total income
Rs 43,655 crs
Rs 35,005 crs
25%
FY13 Vs FY12 (M&M + MVML)
Rs 5,329 crs
Rs 4,150 crs
28%
Rs 3,634 crs
Rs 2,997 crs
21%
Growth in EBIDTA Growth in PAT
Rs 3,544 crs
Rs 2,740 crs
29%
Growth in PAT
* On like to like comparison, excluding one time benefit of Rs. 257
crores on account of MADPL merger from FY 2012 & Rs. 91 crs in FY 13
of Exceptional Gain on sale of MHRIL shares
Adjusted PAT*
12
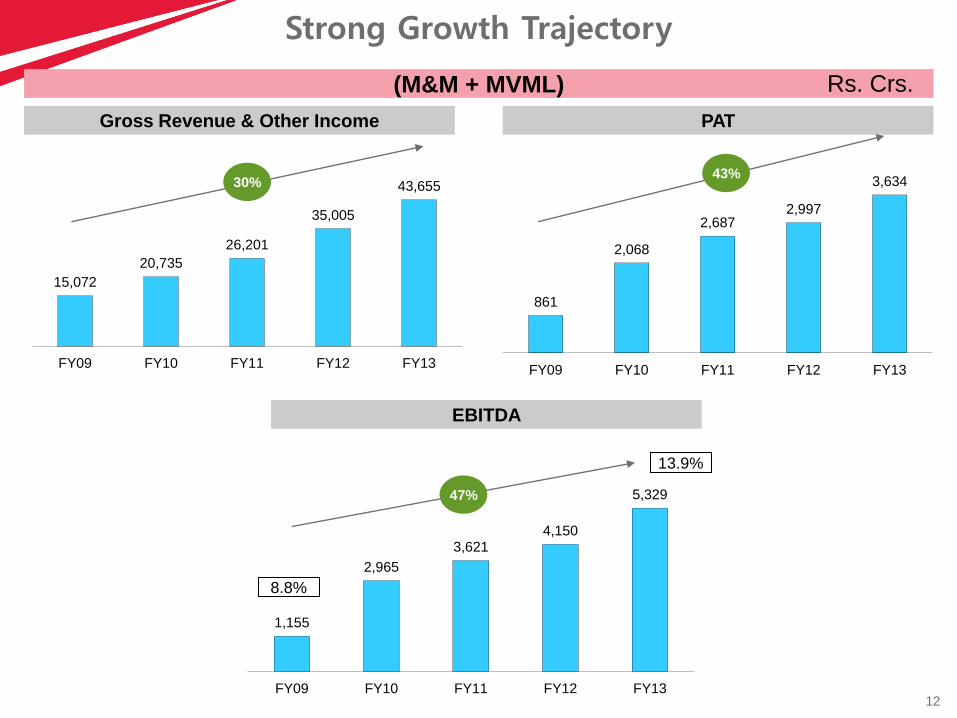
Strong Growth Trajectory
Gross Revenue & Other Income PAT
861
2,068
2,687 2,997
3,634
FY09 FY10 FY11 FY12 FY13
(M&M + MVML)
15,072
20,735
26,201
35,005
43,655
FY09 FY10 FY11 FY12 FY13
30% 43%
EBITDA
1,155
2,965
3,621 4,150
5,329
FY09 FY10 FY11 FY12 FY13
47%
8.8%
13.9%
Rs. Crs.

13 Copyright © 2012 Mahindra & Mahindra Ltd. All rights reserved.
Delivering consistent, long term value
Last 5 years
Note: Adjusted for Bonus & Stock-split Ex Dividend price
Last 11 years
4.1
Last 21 years
6.5
40.4
1.5
1.5
3.2
3.74
7.15
31.54
0 10 20 30 40
Gold
Sensex
M&M
As at 30th September

14
Original Investment Cost Vs. CMP
As on 30th, Sept. 2013 Cost Market Value
Listed Companies
Subsidiaries 3589 14,656
Associates 649 8,282
Total 4,238 22,938
Rs. Crs

15
Unlocking Shareholders Value – Since 2005
Corporate Actions
Bonus Issue – FY 2005 – 1:1
Stock Split – FY 2011 – 1:2
Global Alliance
CIE – Mahindra Deal

16 Copyright © 2012 Mahindra & Mahindra Ltd. All rights reserved.
Strong Credit Profile
0.81
0.45
0.32 0.37
0.3 0.24 0.26
F 2
009
F 2
010
F 2
011
F 2
012
F 2
013
Q2F
13
Q2F
14
2.94
1.12
0.82 0.98 0.76 0.64 0.71
F 2
009
F 2
010
F 2
011
F 2
012
F 2
013
Q2F
13
Q2F
14
DE Ratio M&M + MVML
Gearing Multiple M&M + MVML
Stable Rating AA+ by CRISIL/ICRA/CARE *
* Rating is for M&M Ltd (Standalone Company)
“Healthy financial risk profile supported by considerable financial flexibility arising from market value of investments” - Crisil ‘s Credit Rating Report, April 2013

17
One of the first issuer of GDR of US$ 75 mn in 1993
One of the first issuer of FCCB of US$ 100 mn in 1996
First to issue Rs. 500 Cr. 50 year bullet tenure debentures
XBRL filing – 69 companies within MCA deadline
Financial Milestones

18
Marathon Runner
Prudent Capital Allocation Support growth with Strategic Acquisition Maintain strong Credit Rating
Deliver long term shareholder value
19
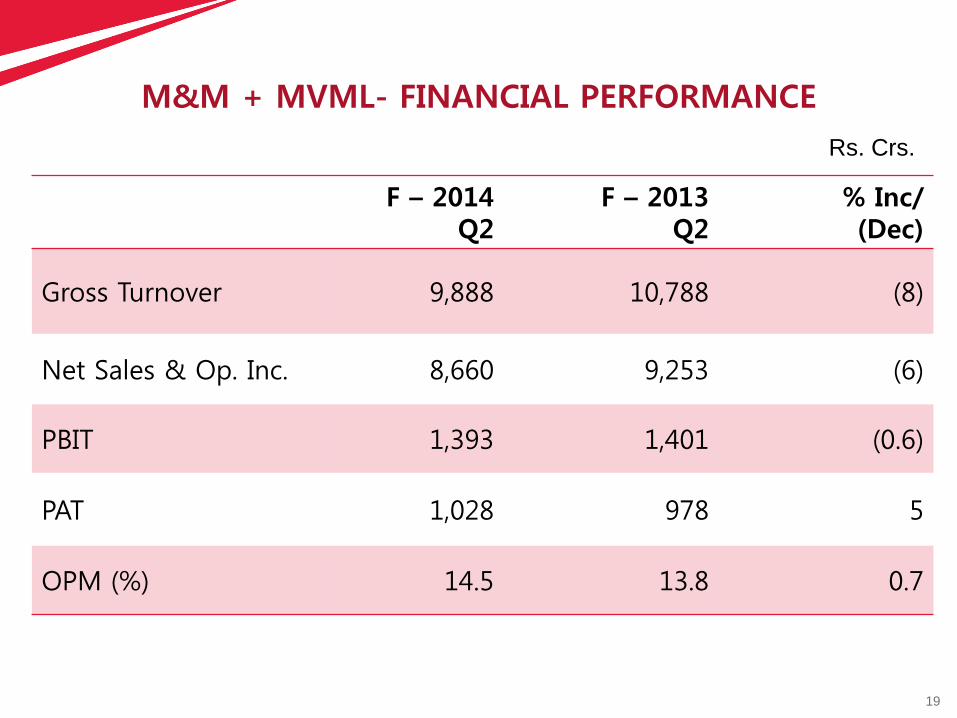
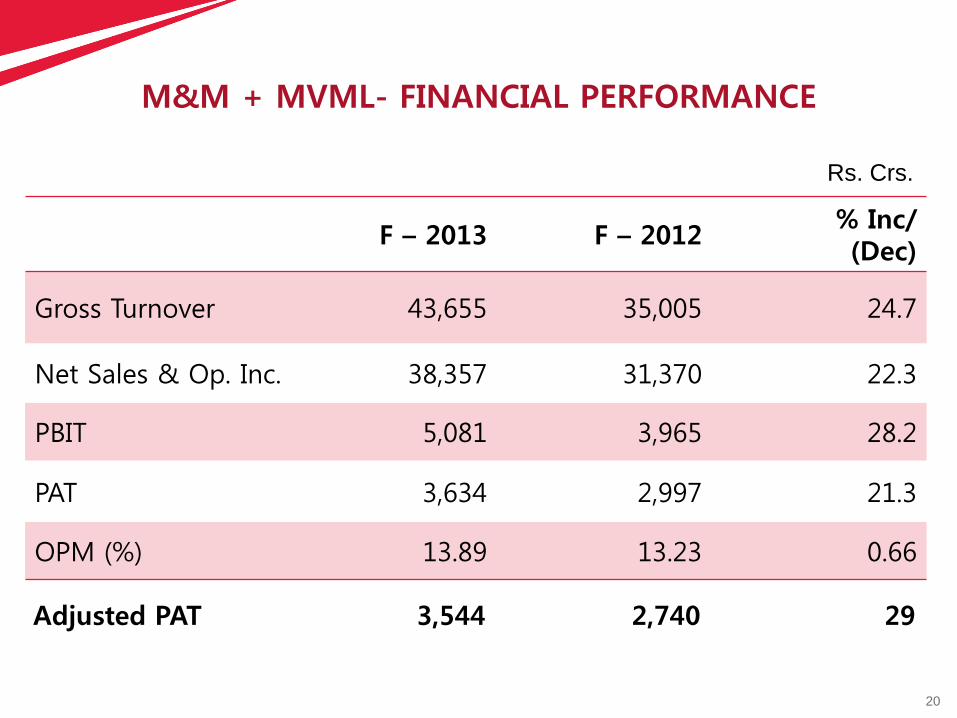
M&M + MVML- FINANCIAL PERFORMANCE
F – 2014 Q2
F – 2013 Q2
% Inc/ (Dec)
Gross Turnover 9,888 10,788 (8)
Net Sales & Op. Inc. 8,660 9,253 (6)
PBIT 1,393 1,401 (0.6)
PAT 1,028 978 5
OPM (%) 14.5 13.8 0.7
Rs. Crs.
20
M&M + MVML- FINANCIAL PERFORMANCE
F – 2013 F – 2012 % Inc/ (Dec)
Gross Turnover 43,655 35,005 24.7
Net Sales & Op. Inc. 38,357 31,370 22.3
PBIT 5,081 3,965 28.2
OPM (%) 13.89 13.23 0.66
PAT 3,634 2,997 21.3
Adjusted PAT 3,544 2,740 29
Rs. Crs.

21
M&M + MVML - BALANCE SHEET
F -2013 F -2012
Source of Funds
Shareholder’s Funds 15,055 12,219
Loan Funds * 4,464 4,544
Deferred Tax Liability 756 589
Total 20,275 17,352
* Includes current maturities of Long Term Liabilities
Rs. Crs.

22
M&M + MVML - BALANCE SHEET
F -2013 F -2012
Application of Funds
Fixed Assets 7,747 6,889
Investments 10,894 9,474
Long Term Loans & Advances 2,562 1,734
Cash & Bank Balances 1,823 1,291
Proposed Dividend (891) (869)
Other Assets (Net) (1860) (1167)
Total 20,275 17,352
Rs. Crs.

23
Segment wise Financials
F – 2014 Q2
Inc / (Dec)
F – 2013 Inc / (Dec)
Segment Revenue AS* 5,555 (16%) 26,489 34%
FES 3,148 19% 11,990 3%
Segment Results@ AS* 624 (23%) 3,117 45%
FES 534 36% 1,858 1%
Segment ROS % AS* 11.2% (0.9%) 11.8% 1%
FES 17% 2% 15.5% 0%
Capital Employed AS* 6,881 16% 6,167 20%
FES 3,320 18% 2,504 7%
Rs. Crs.
@.- After Exceptional Items
* - AS+MVML

24
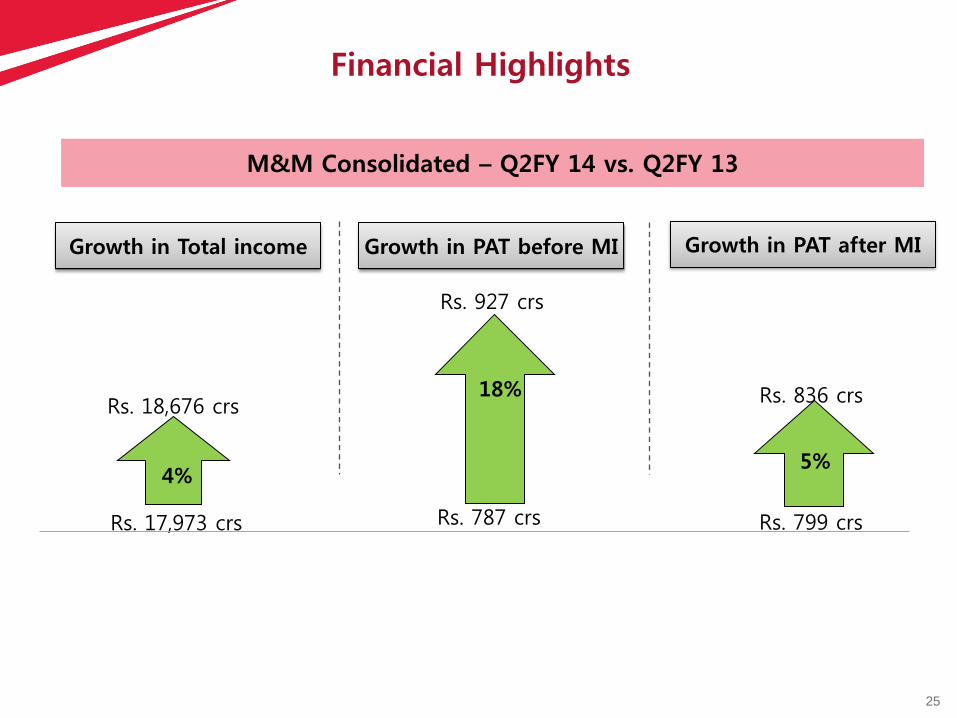
25
Rs. 836 crs
Rs. 799 crs
5%
Financial Highlights
Growth in Total income
Rs. 18,676 crs
Rs. 17,973 crs
4%
M&M Consolidated – Q2FY 14 vs. Q2FY 13
Rs. 927 crs
Rs. 787 crs
18%
Growth in PAT before MI Growth in PAT after MI

26
Rs. 4,099 crs
Rs. 3,127 crs
31%
Financial Highlights
Growth in Total income
Rs. 74,403 crs
Rs. 63,358 crs
17%
M&M Consolidated – FY 13 vs. FY 12
Rs. 7,449 crs
Rs. 6,245 crs
19%
Growth in EBIDTA Growth in PAT after MI
27
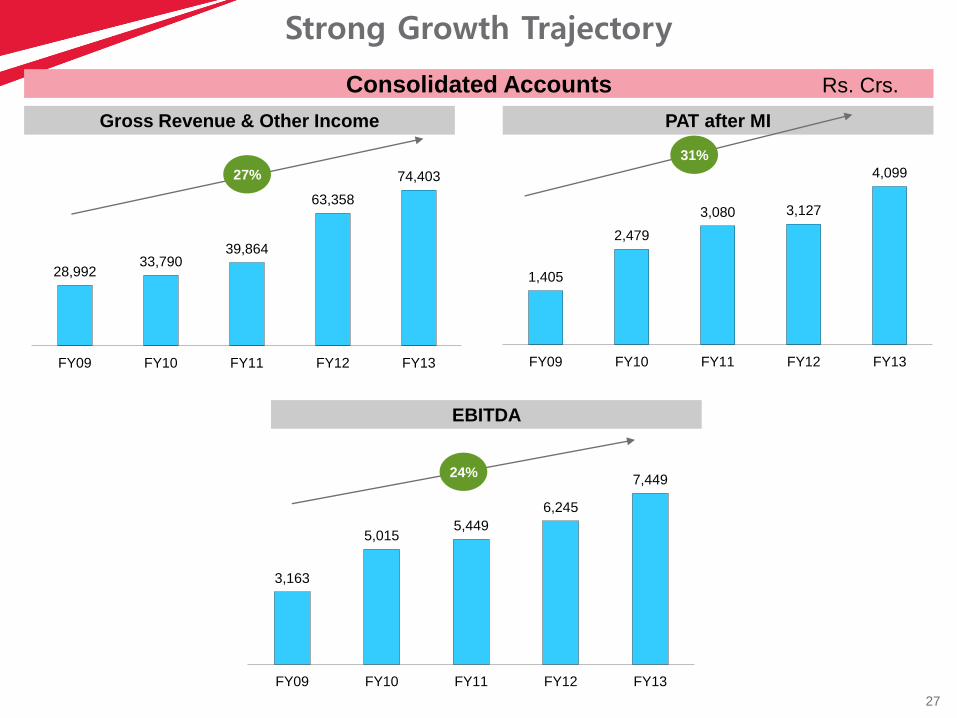
Strong Growth Trajectory
Gross Revenue & Other Income PAT after MI
1,405
2,479
3,080 3,127
4,099
FY09 FY10 FY11 FY12 FY13
Consolidated Accounts
28,992 33,790
39,864
63,358
74,403
FY09 FY10 FY11 FY12 FY13
27%
31%
EBITDA
3,163
5,015 5,449
6,245
7,449
FY09 FY10 FY11 FY12 FY13
24%
Rs. Crs.

28
M&M Group Consolidated Results
# includes share in profits of Associates
F – 2014 Q2
F – 2013 Q2
% Inc/ (Dec)
Gross Income & Other Income
18,676 17,973 3.9
PAT before MI # 927 787 17.8
PAT after MI 836 799 4.6
Rs. Crs.

29
M&M Group Consolidated Results
# includes share in profits of Associates
F – 2013 F – 2012 % Inc/ (Dec)
Net Sales & Op. Income 68,735 59,398 15.7
PAT before MI # 4,129 3,060 34.9
PAT after MI 4,099 3,127 31.1
Rs. Crs.

30
Group Companies – Top 4 PAT Earners
Q2F14 – Rs.232 crs
Q2F13 – Rs.193 crs
21%
MMFSL
Q2F14 – Rs.29 crs
Q2F13 – Rs. 27 crs
MHRIL
7%
Q2 F14 – Rs. 717 crs
Q2 F13 – Rs. 456 crs
58%
TML
Q2 F14 – Rs.7 crs
Q2 F13 –Rs. (39) crs
SYMC
118%

31
Automotive
Revenue
10,475
3%
10,165
Q2FY 14
Q2FY 13
Automotive
Results
501
20%
625
Q2FY 14
Q2FY 13
Fin. Services
Revenue
1,293
33%
973
Fin. Service
Results
359
25%
288
IDS
Revenue
199
46%
136
IDS
Results
47
13%
41
Hospitality
Revenue
204
13%
181
Hospitality
Results
35
7%
Q2FY 14
Q2FY 13
Q2FY 14
Q2FY 13
Segment Details
Segment Results is before Exceptional items
Rs. Crs.

32
Farm Equip.
Revenue
3,742
22%
3,059
Q2FY 14
Q2FY 13
Farm Equip.
Results
532
66%
321
Q2FY 14
Q2FY 13
Others
Revenue
790
31%
603
Others
Results
(143)
64%
(88)
Segment Details
Segment Results is before Exceptional items
Rs. Crs.

33
Systech
Revenue
1,290
3%
1,250
Q2FY 14
Q2FY 13
Systech
Results
(12)
18%
(10)
Q2FY 14
Q2FY 13
STP *
Revenue
275
29%
389
STP *
Results
20
22%
25
IT Services
Revenue
65
88%
556
IT Services
Results
7
89%
64
Segment Details
* STP – Steel Trading & processing Segment Results is before Exceptional items
Rs. Crs.

34
Automotive Sector
35
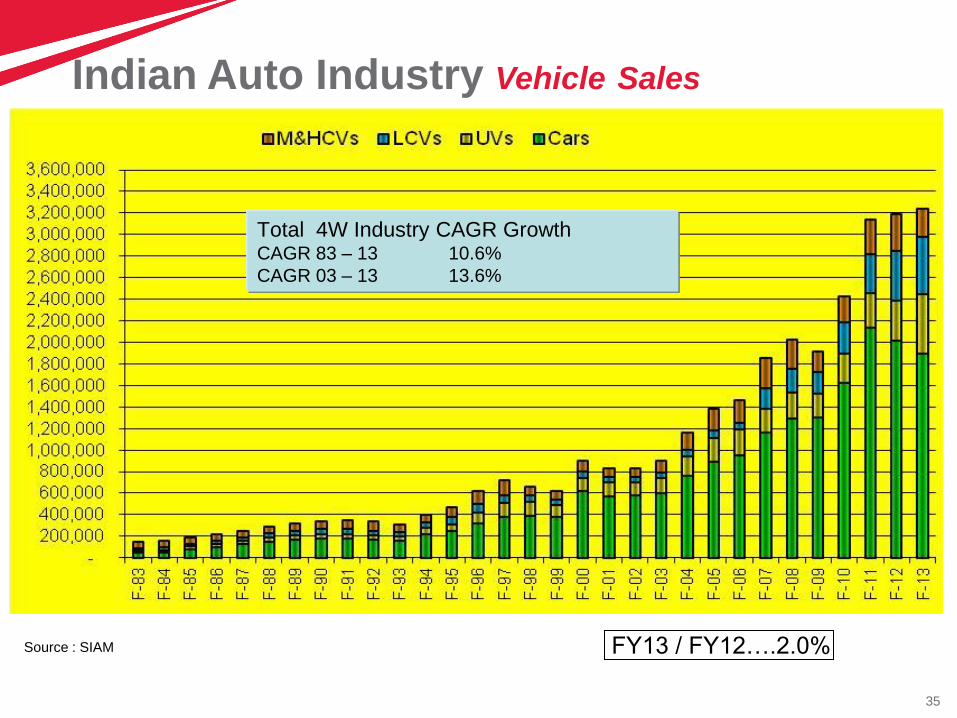
Indian Auto Industry Vehicle Sales
Total 4W Industry CAGR Growth CAGR 83 – 13 10.6%
CAGR 03 – 13 13.6%
FY13 / FY12….2.0% Source : SIAM

36
M&M Auto Sector sales – Domestic + Export
87117
145 149178
231 230
298
377
483
563
F03 F04 F05 F06 F07 F08 F09 F10 F11 F12 F13
Total AS Sales (‘000)
21%
CAGR
37
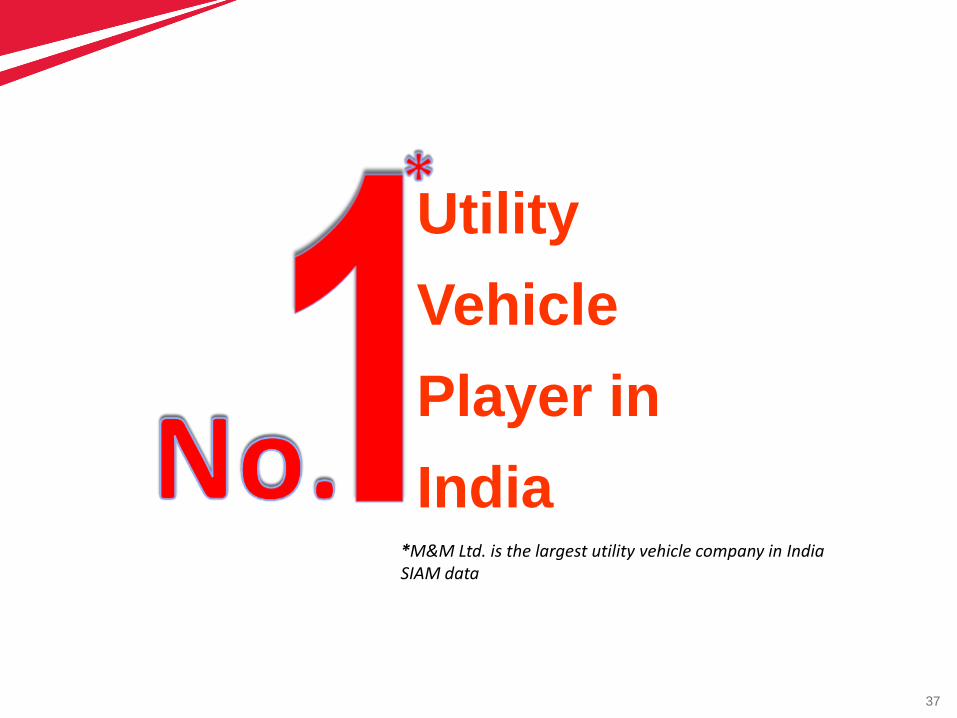
*M&M Ltd. is the largest utility vehicle company in India SIAM data
Utility
Vehicle
Player in
India

38
20
L
5L 12 .5L 15
L
10
L
7 .4L 10 .8L
8L 11 .5L
11 .0L 14 .7L
18 .5L 20 .6L
6 .7L 7 .4L
5 .9L 7 .7L
Presence across all price points

39
6 .2
L
1L 3L 4L 2L
3 .4L
1 .62L 1 .69L
1 .9L
5L
4 .1L 4 .5L
5 .5L
5 .5L 6 .2L
3 .7L 3 .8L
3 .7L 3 .5L
Presence across all price points

40
H1F14 Domestic Market Performance Period : April – September
UV Total
Cars (Verito)
MPV Total
LCV < 2T
2T > LCV < 3.5T
3W Total
AD (Dom.) Total
LCV > 3.5 T Total
MHCV (Goods)
AS (Dom.) Total
Non Participating Segments
MHCV Passenger
MCV Goods
Cars (Excl. Super Compact)
AS (Dom.) Total
Segment H1 F14Actual
243,640 -4.8%
164,879 33.2%
101,834 -9.8%
87,016 -26.6%
94,447 17.1%
239,539 -4.4%
931,355 -1.2%
39,688 -12.6%
44,375 -30.9%- 0.0%
1,015,418 -3.5%- 0.0%- 0.0%
22,791 -11.1%
38,331 -25.2%
690,439 -10.7%
1,766,979 -7.1%
Industry
GrowthH1 F14Actual
104,357 -14.0%
6,134 -21.2%
14,773 -4.2%
15,223 -28.0%
55,194 19.4%
28,409 -8.4%
224,090 -7.8%
3,429 -27.8%
917 -33.3%- 0.0%
228,436 -8.3%- 0.0%- 0.0%
- 0.0%
- 0.0%
- 0.0%
228,436 -8.3%
M&M AS
GrowthH1 F14 H1 F13
Actual Actual
42.8% 47.4%
3.7% 6.3%
14.5% 13.7%
17.5% 17.8%
58.4% 57.3%
11.9% 12.4%
24.1% 25.8%
8.6% 10.5%
2.1% 2.1% 0.0% 0.0%
22.5% 23.7% 0.0% 0.0% 0.0% 0.0%
0.0% 0.0%
0.0% 0.0%
0.0% 0.0%
12.9% 13.1%
M&M Mkt. Share

41
M&M International Market Performance
F13 Concern Markets
• Sri Lanka 18% Mkt. drop + duty impact
• Bangladesh 63% Mkt. drop
• Bhutan 77% Regulation for import payment
F13 Growth Markets
• South Africa 57%
• Chile 48%
• Nepal 47%
High growth in FY13 H1, Slowdown from FY13 H2 onwards …
12,956
18,190
H1 F12 H1 F13
H1 F13
20,313
15,601
F13 F14
Apr-Sept
16,220 14,226
H2 F12 H2 F13
H2 F13
12% 40% 23%
42
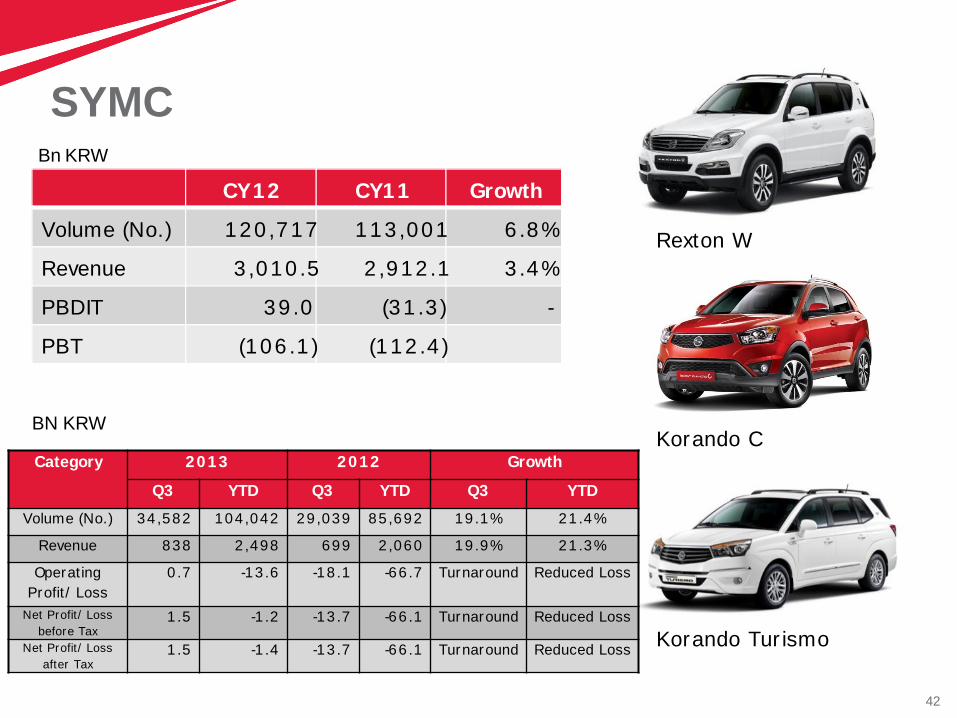
SYMC
Korando Tur ismo
Rexton W
Korando C
CY 12 CY11 Growth
Volume (No.) 120 ,717 113 ,001 6 .8%
Revenue 3 ,010 .5 2 ,912 .1 3 .4%
PBDIT 39 .0 (31 .3 ) -
PBT (106 .1 ) (112 .4 )
H1 CY 14 H1 CY13 Growth
Bn KRW
Category 2013 2012 Growth
Q3 YTD Q3 YTD Q3 YTD
Volume (No.) 34 ,582 104 ,042 29 ,039 85 ,692 19 .1% 21 .4%
Revenue 838 2 ,498 699 2 ,060 19 .9% 21 .3%
Operating
Profit / Loss
0 .7 -13 .6 -18 .1 -66 .7 Turnaround Reduced Loss
Net Profit/ Loss
before Tax 1 .5 -1 .2 -13 .7 -66 .1 Turnaround Reduced Loss
Net Profit/ Loss
after Tax 1 .5 -1 .4 -13 .7 -66 .1 Turnaround Reduced Loss
BN KRW

43
Improved Customer Satisfaction Sales Satisfaction Index (2013)
803
820
841
2011 2012 2013
Rank – 8 th
Rank – 6 th
Rank – 3 rd
M&M Rank
Source: 2013 JD Power Sales Satisfaction Study

44
Improved Customer Satisfaction Customer Satisfaction Index (2013)
Source: 2013 JD Power Customer Satisfaction Study
744
798
813
2011 2012 2013
Rank –
11 th
Rank –
5 th
Rank – 4 th
M&M Rank

45
Presence in every nook and corner
Sales Network – 1372 Service Network - 1231
Network reaching more than 70% of the districts in India
Reaching 900+ towns/semi-urban and rural areas across the country

46
Financial Performance – AD + MVML
Q2FY2014 %YoY FY2013 %YoY
Segment Revenue Rs. 5,555 -16% Rs. 26,489 34%
Segment Results (after
exceptional items)
Rs.624 -23% Rs. 3,118 45%
Segment capital
employed
Rs. 6,881 16% Rs. 6,167 20%
Rs. Crs.

47
Farm Equipment Sector
48
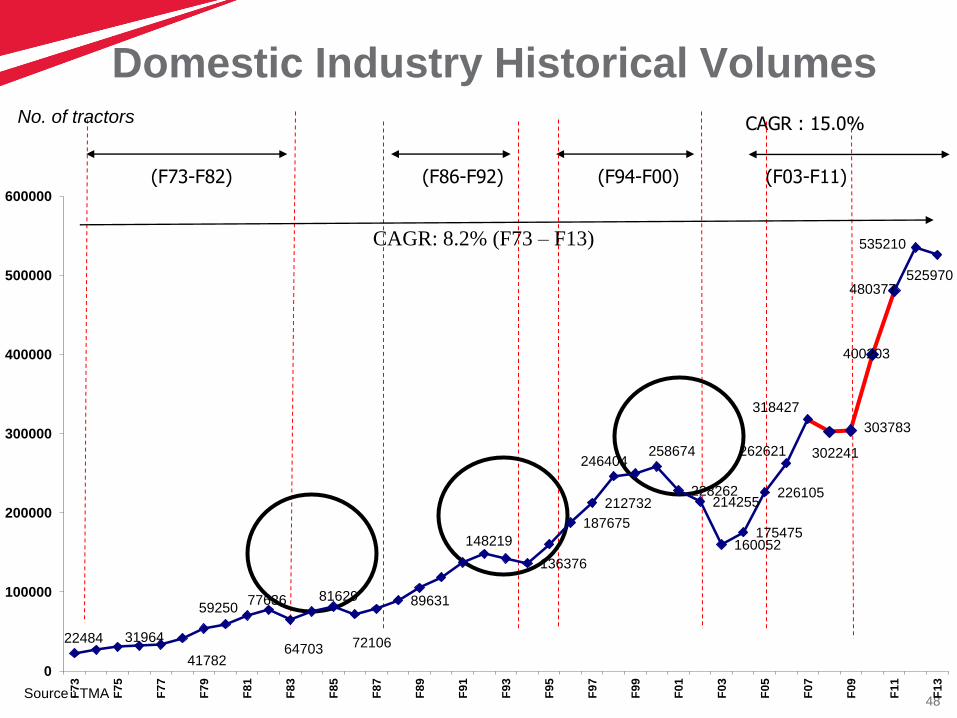
Domestic Industry Historical Volumes
CAGR : 15.0%
(F73-F82) (F86-F92) (F94-F00) (F03-F11)
No. of tractors
CAGR: 8.2% (F73 – F13)
Source : TMA
22484 31964
41782
59250 77636
64703
81629
72106
89631
148219
136376
187675
212732
246404 258674
228262 214255
160052 175475
226105
262621
318427
302241
303783
400203
480377
535210
525970
0
100000
200000
300000
400000
500000
600000
F7
3
F7
5
F7
7
F7
9
F8
1
F8
3
F8
5
F8
7
F8
9
F9
1
F9
3
F9
5
F9
7
F9
9
F0
1
F0
3
F0
5
F0
7
F0
9
F1
1
F1
3

49
M&M Ltd. is the largest tractor company in the world, by volume
*

50
M&M Domestic Market Performance
41,282 44,807 60,005
78,048
95,006 90,509
113,269
166,359
202,513
221,730 211,596
F03 F04 F05 F06 F07 F08 F09 F10 F11 F12 F13
18%
CAGR

51
Tractor Industry & M&M : Pick Up in Momentum…..
253055
313523
F13 F14
103358
128626
F13
Industry M&M
Continued Domination
FES MS : 41.0%
Period : April – September

52
Tractor Market Share Total no. of Tractors
52
40.8 41.4 42.0 41.4 40.2 41.0
22.3 22.0 20.4 23.4 25.0 25.1
13.5 13.3 13.2 11.4 11.7 10.8
8.9 8.7 8.6 8.3 9.7 10.1 3.1 2.8 2.6 2.8 2.5 2.5 5.3 4.8 5.1 5.2 5.2 4.9 6.0 7.0 8.0 7.5 5.7 5.6
0%
10%
20%
30%
40%
50%
60%
70%
80%
90%
100%
F09 F10 F11 F12 F13 H1F14
JD
FNH
Others
Sonalika
Escorts
Tafe+Eicher
Mahindra
400,203 303,921 480,377 525,970 535,210
Source : TMA
215,211

53
Exports
5,385
6,981 7,525
8,533
6,933
8,837
11,812
13,722
12,289
6063 5215
F05 F06 F07 F08 F09 F10 F11 F12 F13 H1F13 H1 F14
Degrowth in SAARC Countries

54
Customer Satisfaction Index
F08 F09 F10 F11 F12 F13
84
89
93 93 96
108
76 79
83
96
106
115
Mahindra & Swaraj : among Top 2 Brands

55
Beyond tractors…
…towards ‘Farm Tech Prosperity’

56
Agri Business
Growth in F&V (49%) and Agri
inputs (47%)
Retained No. 1 position in
Grapes
Expanding current portfolio and
exploring new segments of agri
value chain
33% Growth
156.2
208.5
H1 F13 H1 F14
Agri Business Revenue (Rs. crs)
33%
Agri Inputs 33%
F&V 26% MIS
41%
Agri Business Revenue Share
57
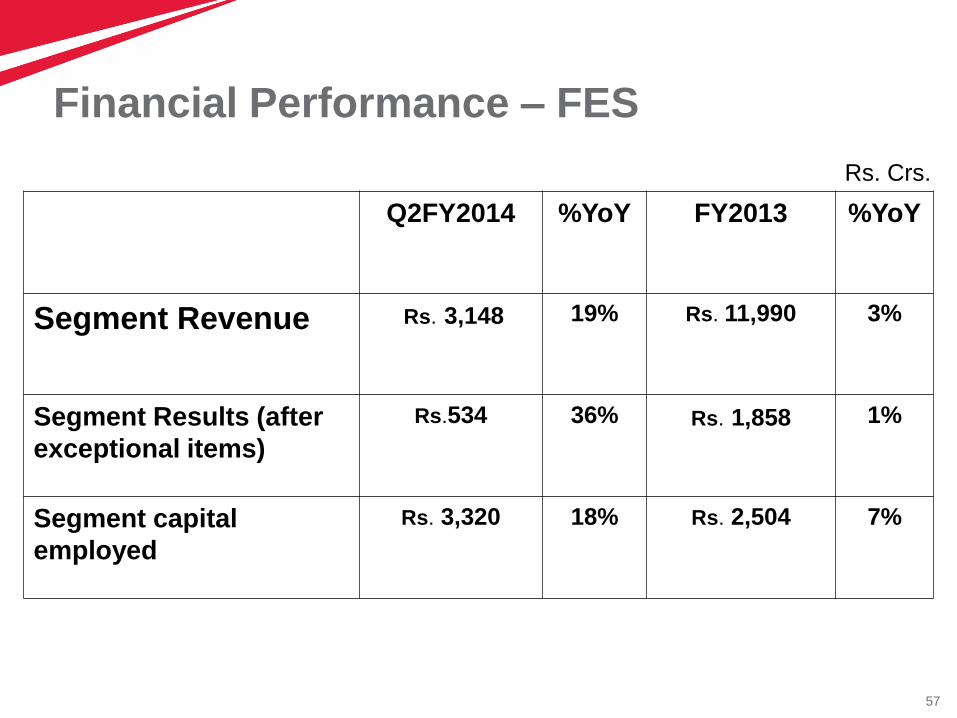
Financial Performance – FES
Q2FY2014 %YoY FY2013 %YoY
Segment Revenue Rs. 3,148 19% Rs. 11,990 3%
Segment Results (after
exceptional items)
Rs.534 36% Rs. 1,858 1%
Segment capital
employed
Rs. 3,320 18% Rs. 2,504 7%
Rs. Crs.

58
F14 : Industry Outlook
Industry expected to grow at 15 - 17%

59
Sustainability
Released annual sustainability reports since 2008 to map triple bottom line
performance
Sustainbility reports realeased since 2008 are externally assured & GRI
checked for Application level A+
Ranked 1st in S&P’s ESG India Index-2012
One of the top rankers in the Asian Sustainability Ratings (“ASR”)
Winner in the automobiles category, under the Energy Intensive industries
cluster, in the Green Business Leaders award 2011-12 instituted by
Emergent Ventures India & Financial Express.
CII Sustainability Plus Rating:-
– M & M rated no.1 in transport equipment sector in Gold category and
secured 9th place out of total 100 rated companies in the year 2012.
Carbon Disclosure Leadership Index:-
– M&M Limited was rated with a second highest score of 82 among the top
200 Indian companies in the CDLI ratings for 2012.

60
Commitment to Society
The Mahindra Group
has pledged to dedicate
1% of its Profit after Tax to CSR
initiatives

61
Disclaimer
Mahindra & Mahindra herein referred to as M&M, and its subsidiary companies provide a wide array of presentations and reports,
with the contributions of various professionals. These presentations and reports are for informational purposes and private circulation
only and do not constitute an offer to buy or sell any securities mentioned therein. They do not purport to be a complete description of
the markets conditions or developments referred to in the material. While utmost care has been taken in preparing the above, we
claim no responsibility for their accuracy. We shall not be liable for any direct or indirect losses arising from the use thereof and the
viewers are requested to use the information contained herein at their own risk. These presentations and reports should not be
reproduced, re-circulated, published in any media, website or otherwise, in any form or manner, in part or as a whole, without the
express consent in writing of M&M or its subsidiaries. Any unauthorized use, disclosure or public dissemination of information
contained herein is prohibited. Unless specifically noted, M&M or any of its subsidiary companies is not responsible for the content of
these presentations and/or the opinions of the presenters. Individual situations and local practices and standards may vary, so
viewers and others utilizing information contained within a presentation are free to adopt differing standards and approaches as they
see fit. You may not repackage or sell the presentation. Products and names mentioned in materials or presentations are the property
of their respective owners and the mention of them does not constitute an endorsement by M&M or its subsidiary companies.
Information contained in a presentation hosted or promoted by M&M is provided “as is” without warranty of any kind, either expressed
or implied, including any warranty of merchantability or fitness for a particular purpose. M&M or its subsidiary companies assume no
liability or responsibility for the contents of a presentation or the opinions expressed by the presenters. All expressions of opinion are
subject to change without notice.
Copyright © 2012 Mahindra & Mahindra Ltd. All rights reserved.
Thank you Visit us at www.mahindra.com


