

Module 6: Technologies
Outcomes A student: › develops and evaluates questions and hypotheses for scientific investigation INS11/12-1 › designs and evaluates investigations in order to obtain primary and secondary data and information
INS11/12-2 › selects and processes appropriate qualitative and quantitative data and information using a range of
appropriate media INS11/12-4 › describes and explains how science drives the development of technologies INS12-13
Related Life Skills outcomes: SCLS6-1, SCLS6-2, SCLS6-4, SCLS6-12
Content Focus The rapid development of new technologies has enhanced industrial and agricultural processes, medical applications and communications. Students explore the dynamic relationship between science and technology where the continuing advancement of science is dependent on the development of new tools and materials. They also examine how advances in science inform the development of new technologies and so reflect the interdependence of science and technology. Students consider experimental risks as they engage with the skills of Working Scientifically. They investigate the appropriateness of using a range of technologies in conducting practical investigations, including those that provide accurate measurement.
Working Scientifically In this module, students focus on developing hypotheses and questions and process appropriate qualitative and quantitative data. They demonstrate how science drives demand for the development of further technologies. Students should be provided with opportunities to engage with all Working Scientifically skills throughout the course.
Content
Scientific Investigation and Technology Inquiry question: How does technology enhance and/or limit scientific investigation? Students: ● design a practical investigation that uses available technologies to measure both the independent and
dependent variables that produce quantitative data to measure the effect of changes of, including but not limited to: – temperature on reaction rate – temperature on volume of gas – speed on distance travelled – pressure on volume of gas
● conduct the practical investigation to obtain relevant data and evaluate the limitations of the technologies used

● investigate the range of measuring devices used in the practical investigation and assess the likelihood of random and systematic errors and the devices' degree of accuracy
● using specific examples, compare the accuracy of analogue and digital technologies in making observations
● assess the safety of technologies selected for the practical investigation by using chemical safety data and Work Health and Safety guidelines as appropriate
Module 6 Technologies
Human desire to solve problems and answer questions about the world led us to create and develop
technologies to aid our lack of understanding about phenomena.
Science has helped developed technologies and influenced social developments in areas:
• Agriculture
• Medicine
• Industry
• Communication
e.g.:
Interdependence between science and technology helps us to develop tools to improve the
wellbeing of humans to create a more sustainable future
4.1 The scientific investigation and technology
Technology – practically applying knowledge to create a device for practical purposes in any area of
research e.g. a hammer, a spoon, a computer or a robot are all technologies – devices invented for
practical purposes to make life easier.
Advances in technology from the beginnings of civilisation to today increased at a steep curve after
the Industrial Revolution at the end of the 19th century:
• Steam engine, electricity
• Computers and information technologies changed the way research was carried out
Science uses technologies to advance research while the knowledge and understanding of how the
physical, chemical and biological world work has helped to create technologies to improve the
wellbeing of humanity. E.g.:
• Humans learned how our kidneys filter blood, we were able to invent the dialysis machine to
filter blood
• New research into materials such as cellulose-based and synthetic polymers have helped in
developing new filtration systems that reinforce the current systems and help the dialysis machine
avoid contamination
Technology can improve or limit a scientific investigation:
• Improvements:
o Technology helps collect accurate, precise and valid data
o Make repetitions more efficiently saving time
• Limits:
o Not calibrated or appropriately chosen technology for the collection of information and data
for that particular research
o Need the skills to operate the technology or it will not be used or be a hinderance to the
investigation if used poorly
• Human creativity and imagination play an important role creating new and more advanced
technologies
Using technologies to collect data
• Technology helps to create valid, accurate and reliable investigation by assisting to:
o Data collection: gathering of qualitative or quantitative measurements for the purpose of
statistical analysis
o Processing and analysis
o To help measure and control the variables
o To generate the statistical information
o Minimise and assess risk
• Helps us to answer questions and predict future patterns and trends from the research
• Technologies used for data collection refer to different types of equipment, such as
analogue or digital, to measure and analyse the variables in the experiment.
E.g. Thermometers, data loggers, stopwatches, computerised data analysers, spectrophotometers,
chromatographers, microscopes and gas analysers are used to measure and collect quantitative data
Uses of technologies to measure variables
• Selection of technology used to measure variables determines the accuracy of the data.
E.g. if the aim of the experiment is to test how the effect of temperature affects the rate of a
chemical reaction, a thermometer would be a sound choice, but a data logger to measure
temperature would be more effective way for collecting data.
• Technologies can limit data collection for independent and dependent variables if the
technology is not calibrated properly, it is not appropriate for that research, or the data collected is
within a range and not a specific number.
E.g. to measure pH of substances, different pH indicators can be used to collect data, but each
indicator gives a colour for a range of pH not a specific pH value. A pH probe is a more accurate
method for determining the actual pH number for the substances
Errors in technologies
• It is important to assess the errors in measuring devices as it determines the integrity
(accuracy and reliability) of data collected
• Errors in measurement can be random, systematic or gross.
Accuracy
• E.g. the ‘true’ amount (mass) of a salt may be 12.5343, but we can measure this accurately
as precision of the
Technologies and safety
• Risk Assessment must be done prior to using the technology
• Read the instruction manual on how to use the instrument safely and how to collect data
• Reading and keeping the safety procedures in mind when using technologies helps to reduce
errors and ensure the safety of users
• Follow work place health and safety guidelines
• Follow chemical safety data
• Operators receive training in managing technologies
• Be aware of the risks when collecting data
• In case of accidents, proper procedure is to be followed to support the operator
Chemical safety data
Chemicals used in investigations are listed in the chemical safety data manual in the laboratory. Each
material safety data sheet (MSDS) is written by the manufacturer and contains the following:
• The properties of the chemical
• The chemical safety information
• First aid information in case of accidents
• The storage and handling of the chemical
• Protective personal equipment to be used when handling the chemical
Before using any chemical, you must consult the MSDS to make sure the chemical is safe to use in
the classroom labs.
Work health and safety
• You have the right to work safely, while at the same time the responsibility to keep the
workplace safe for others.
• Have the proper training in sing technologies
• Wearing appropriate protective equipment
• Aware of emergency plan to responding in case of accidents
• E.g. using electrical devices to collect data for an investigation, read the risk assessment and
instructions on how to use the equipment and assess the environmental conditions around it, such
as water spillages or faults in cables and electrical plugs.
Analogue versus digital technologies
• Over time, technologies have moved from analogue to digital
• The difference between the analogue and digital measuring devices is in their limit of
reading
Analogue devices: Digital devices:
• Have continuous scales
• Include liquid in glass thermometers and swinging needle multimeters
• Limit of reading is half of smallest division on the scale • Have a scale that gives
numbers
• Include digital thermometers and multimeters
• Easier to read
• Limit of reading for uncertainty is a whole division
• Need skill to use
• Advantages and disadvantage of analogue and digital:

Technology Advantages Disadvantages
Analogue • Low cost
• More accurate
• Uses less bandwidth (frequency width) for communication
• No need of synchronised communication systems • Observational errors
• In communication, effects of random noise can cause signal loss and distortion
Digital • More precise
• Compatible with other digital systems
• Immediate (recorded) information
• Integrated networks (different functions joined together) • Can be expensive
• Sampling error (difference between the sample and the ***
• Requires greater bandwidth for communication
• Communication systems need to be synchronised for digital signals
• E.g. recording sound waves:
o How data from the wave carrying the information is recorded
o Analogue: recorded and used in its original form
o Digital: analogue data sampled at some point and turned into digital data (ADC converts
analogue data to digital) into combinations of 0 and 1 (binary numbers) and stored in a device
Practical investigations and technologies
Temperature on reaction rate
In a chemical reaction, substances react with each other, chemical bonds are broken, and new
substances are formed as products.
• Reaction rate: speed at which a chemical reaction occurs
• Temperature affects the reaction rate because it increases the collision between the
particles, this is according with the collision theory:
o In a chemical reaction, activation energy is needed which is the minimum level of energy for
a substances’ particles to start colliding and consequently produce the chemical products.
• The reaction rate depends on the rate (speed) of successful collisions between reactant
particles. The more successful collisions there are the faster the rate of reaction.
• Increasing the temperature of in the chemical reaction affects the activation energy
because:
o There is more energy in the chemical and consequently the particles have more energy
o There are more collisions between the particles
o The rate of reaction increases
• Catalysts are chemicals that increase the reaction rate by lowering the activation energy.
The catalyst itself remain unchanged at the end of the reaction.
o Catalysts are used widely in industry to catalyse chemical reaction to create commercial
products. E.g. iron is used as catalyst in the reaction between nitrogen and hydrogen to produce
ammonia
• Enzymes: catalysts that assist biochemical reactions in organisms
Effect of temperature on the rate of reaction #1 (15.2.19)

Background information: If the temperature of a system changes, so will the rate of reaction change in correspondence to the temperature. If temperature increases, so will the rate of reaction increase. If the temperature decreases, so will the rate of reaction decrease. Thus, temperature proportionally increases and decreases with the rate of reaction. Glowsticks have seals that separates the chemical species within it from each other, thus keeping the glowstick from glowing. By cracking the glowstick, the seals are broken such that the chemical species within it can react and form a product that is bright and fluorescent in solution. Thus, glowsticks become brighter when the reaction occurs and since it is a reaction, it can be affected by temperature through the investigation. Aim: To measure the effect of change of temperature on reaction rate. Hypothesis: If temperature is changed, the reaction rate will change in proportion to that of the temperature. Equipment:
· 3 × small green glowsticks
· 3 × 50mL beakers · Ice cubes
· Boiled water (approx. 50℃) · Water at room temperature
· 3 × thermometers · Stopwatch
· Tweezer Risk Assessment:
Method:
1. Prepare one 50mL beaker of water with ice cubes, one 50mL beaker of water at room temperature, and one 50mL beaker of boiled water.
Identify Rating Minimisation
Dropped glass off the edge of the table will most likely break and can cause a cut to a person.
Medium Keep glassware away from the edges of your table. Clear away broken glass immediately. Wear closed in leather shoes.
Spilling water can cause a slipping hazard to the person.
Low Handle containers of water with care by holding them steadily. Clean up the spill with a towel.
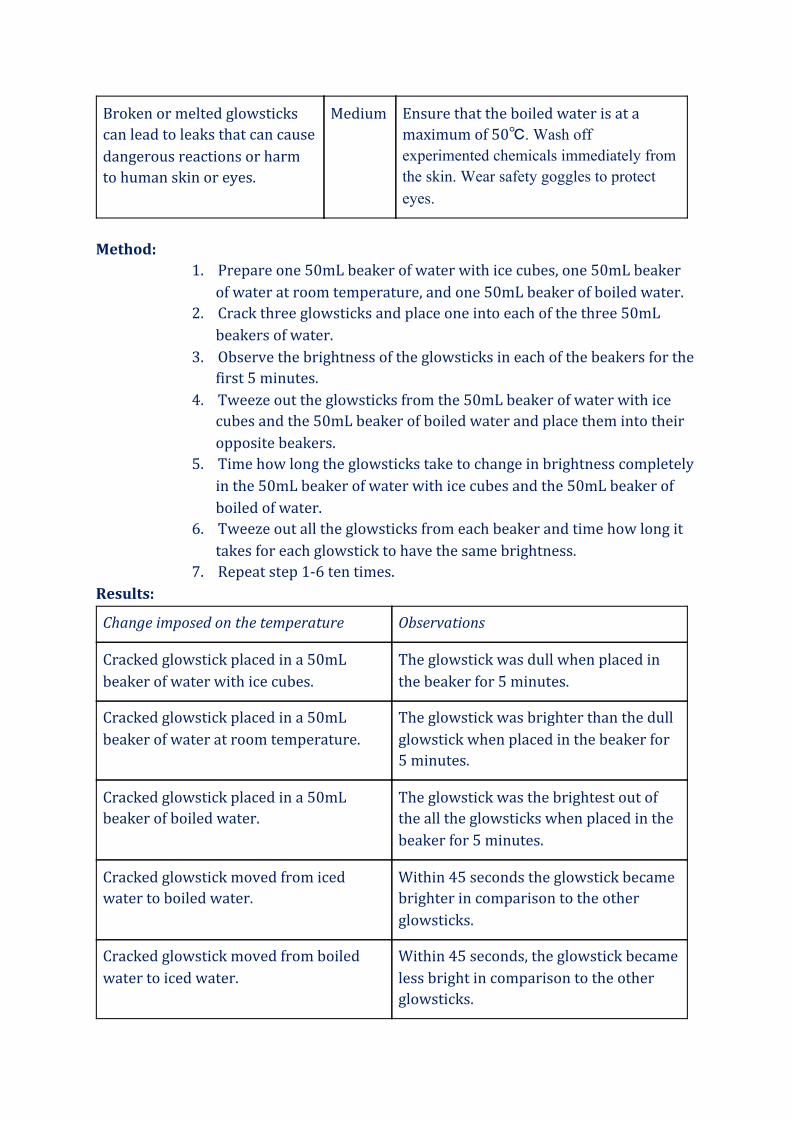
Broken or melted glowsticks can lead to leaks that can cause dangerous reactions or harm to human skin or eyes.
Medium Ensure that the boiled water is at a maximum of 50℃. Wash off experimented chemicals immediately from the skin. Wear safety goggles to protect eyes.

2. Crack three glowsticks and place one into each of the three 50mL beakers of water.
3. Observe the brightness of the glowsticks in each of the beakers for the first 5 minutes.
4. Tweeze out the glowsticks from the 50mL beaker of water with ice cubes and the 50mL beaker of boiled water and place them into their opposite beakers.
5. Time how long the glowsticks take to change in brightness completely in the 50mL beaker of water with ice cubes and the 50mL beaker of boiled of water.
6. Tweeze out all the glowsticks from each beaker and time how long it takes for each glowstick to have the same brightness.
7. Repeat step 1-6 ten times. Results:
Discussion: From the results, when the glowstick is placed in hot water, the glowstick glows brighter than that of a glowstick in water at room temperature. Also, when the glowstick is placed in cold water, the glowstick glows less than that of a glowstick in water at room temperature, which corresponds to the hypothesis that temperature is
Change imposed on the temperature Observations
Cracked glowstick placed in a 50mL beaker of water with ice cubes.
The glowstick was dull when placed in the beaker for 5 minutes.
Cracked glowstick placed in a 50mL beaker of water at room temperature.
The glowstick was brighter than the dull glowstick when placed in the beaker for 5 minutes.
Cracked glowstick placed in a 50mL beaker of boiled water.
The glowstick was the brightest out of the all the glowsticks when placed in the beaker for 5 minutes.
Cracked glowstick moved from iced water to boiled water.
Within 45 seconds the glowstick became brighter in comparison to the other glowsticks.
Cracked glowstick moved from boiled water to iced water.
Within 45 seconds, the glowstick became less bright in comparison to the other glowsticks.
Cracked glowsticks taken out of the beakers.
A time of 6 minutes and 33 seconds was taken for the glowsticks to reach the same brightness.
proportional in relation to the reaction rate, as the brightness indicates how fast the reaction occurs. Additionally, the glowsticks all reached the same brightness after they were all taken out of each beaker of different temperatures after 6 minutes and 33 seconds. This means that the glowsticks eventually have the same brightness at the same temperature. Hence, an increase in temperature has led to an increase in reaction rate, while a decrease in temperature has led to a decrease in the reaction rate. Thus, the change in temperature is proportional to the change in reaction rate. The experiment was not repeated to see if there were any inconsistencies in the results, making the results unreliable. This can be improved by repeating the experiment at least 3 times to record consistent results and to ensure a reliable experiment. The results were not able to be compared to other groups as the glowsticks were different in size amongst the class. Thus, making the experiment unreliable as results could be confirmed to be consistent. The experiment was not accurate as the observations were made by the human eye, meaning that there are chances for misjudgements and random errors. This can be improved on by changing the experiment from a qualitative analysis, to a quantitative analysis through measuring the luminosity of light with a lux meter to get more accurate results. The experiment was valid because the temperature of water from each beaker was kept in the same order of temperature. All the variables other than the temperature and the brightness of the glowstick were controlled as the size and colour of the glowsticks were kept the same.
· Evaluate the limitations of the technologies used The thermometer used in the experiment does not display accurate measurements of temperature such that the measured value is not close to the real value. The measured values can differ by half of the smallest unit marked on the scale of the thermometer.
· Investigate the range of measuring devices used in the practical investigation and assess the likelihood of random and systematic errors and the devices' degree of accuracy
Thermometers have a chance of experiencing sudden changes in temperature as a random error in the experiment. Stopwatches can have random errors by the tiredness of the people working. These random errors can be minimised by taking the average of a large number of readings. The thermometer can experience systematic errors: instrumental errors, environmental errors and observational errors. There can be errors with the thermometer throughout the experiment. This can be fixed by re-calibrating it. External conditions such as temperature will affect the measurement from the thermometer. This can be improved by testing the conditions before the experiment. Incorrect readings may occur due to errors such as parallax errors. Read the measurements at eye level and get more than one person to read the measurement to verify the values. Stopwatches can have observational errors such as reading the time incorrectly. To fix this, confirm with other people.
· Using specific examples, compare the accuracy of analogue and digital technologies in making observations

Digital thermometers provide measurements to at least three decimal places, making the measurements close to the actual value unlike an analogue thermometer that only displays the readings in units of ℃. Using a digital stopwatch is more accurate that that of an analogue version which would be a clock. The measurements are provided to the hundredth of a second, making it more accurate than that of the analogue stopwatch.
· Assess the safety of technologies selected for the practical investigation by using chemical safety data and Work Health and Safety guidelines as appropriate
Effect of temperature on the rate of reaction #2 (19.2.19) Background information: If the temperature of a system changes, so will the rate of reaction change in correspondence to the temperature. If temperature increases, the rate of collisions between molecules increases, and so will the rate of reaction increase. If the temperature decreases, the rate of collisions between molecules decreases, and so will the rate of reaction decrease. Thus, temperature proportionally increases and decreases with the rate of reaction. Potassium permanganate (KMnO4) is purple. Oxalic acid (C2H2O4) is colourless. When KMnO4 reacts with C2H2O4 the solutions macroscopically change from purples to colourless when the reaction has completed. Thus, the rate of this reaction can be determined through observations and time. Aim: To measure the effect of change of temperature on reaction rate. Hypothesis: If temperature is changed, the reaction rate will change in proportion to that of the temperature. Equipment:
· 3 × 200mL beakers
· 3 × thermometers · 3 × medium test tubes
· 3 × stopwatches · 2 × 25mL measuring cylinders
· 15mL of 0.001M potassium permanganate (KMnO4) · 15mL of 0.001M oxalic acid (C2H2O4)
· Bunsen burner · Retort stand
· Tripod · Gauze mat
· Clamp · Matchbox · Match
Risk Assessment:
Identify Rating Minimisation
Contact with combustible material may cause fire.
Medium Do not boil to dryness with combustible material.

Method:
1. Fill up a 200mL beaker with water that has been boiled at a certain temperature whilst recording the temperature with a thermometer. 2. Place a test tube with 5mL of 0.001M KMnO4 solution and a test tube with 5mL of 0.001M C2H2O4 solution into the beaker until the solutions share the same temperature as the water. 3. Mix the two solutions and place the test tube with the mixed solution back into the beaker and start timing using a stopwatch. 4. Observe the purple colour of the mixed solution turning colourless and stop the time when it becomes completely colourless. 5. Record the time it takes for the purple colour to disappear. 6. Repeat step 1-6 with a different temperature of water. Each temperature of water should be used to perform the experiment three times. 7. Heat a 200mL beaker of water placed on a gauze mat on a tripod and place the test tubes of the solutions inside, using a Bunsen burner. 8. Stop heating the beaker when the temperature reaches the desired amount and repeat step 3 using tongs. 9. Repeat step 4-5. 10. Repeat step 7-9 two times.
Results:
Harmful if potassium permanganate is swallowed. Contact with potassium permanganate may damage skin and eyes
Medium Do not place the substance in cups and do not drink. Avoid contact with skin and eyes.
Contact with flame and hot objects may cause burn to skin.
Medium Cool down the hot equipment with water unless it is glass. Allow glass to cool down without the use of water. Otherwise, indirectly hold the equipment e.g. using tongs.
Temperature of the beaker (℃) Time for completion of reaction (minutes: seconds)
27 N/A
40 18:27
45 13:50
70 1:04

Discussion: The change in temperature does affect the rate of reaction, as the solutions at 40℃, 45℃ and 70℃ had the times in descending order 18:27, 13:50 and 1:04 in minutes: seconds respectively. Thus, the rate of reaction is increasing respectively. Hence, temperature is proportional to the rate of reaction as shown through changes in temperature and reaction rate. From observing the process of each reaction at different temperatures, the colours changed at a rate in proportion to the affected reaction rate. The colour of the solution changed from purple to colourless faster when the temperature of the system was higher, meaning that temperature effected the rate of reaction. The results were not reliable as the experiment was not repeated at all to see if the results were consistent and not errors to the experiment. This could be improved by repeating the experiment at least three times to find precise results that make the experiment more reliable. There was a small sample size which did not help confirm if the results were consistent or not. By comparing results with other groups, the experiment could cover a greater range of temperatures and times to reassure the reliability of the experiment. The experiment was not accurate as the thermometers were limited to units of ℃, meaning that values may not be close to the actual values. By using digital thermometers, results can be displayed to 3d.p. to satisfy the accuracy of results obtained from the experiment. The experiment was valid as the same thermometers, 200mL beakers, volume and 0.001M solutions of KMnO4 and C2H2O4, test tubes, stopwatches, and 25mL measuring cylinders were used throughout the experiment. All these variables were controlled. The temperature of the solutions was the independent variable and the time for the reaction to complete was the dependent variable. Thus, the experiment was valid overall.
· Evaluate the limitations of the technologies used The thermometer used in the experiment does not display accurate measurements of temperature such that the measured value is not close to the real value. The measured values can differ by half of the smallest unit marked on the scale of the thermometer.
· Investigate the range of measuring devices used in the practical investigation and assess the likelihood of random and systematic errors and the devices' degree of accuracy
Thermometers have a chance of experiencing sudden changes in temperature as a random error in the experiment. Stopwatches can have random errors by the tiredness of the people working. These random errors can be minimised by taking the average of a large number of readings. The thermometer can experience systematic errors: instrumental errors, environmental errors and observational errors. There can be errors with the thermometer throughout the experiment. This can be fixed by re-calibrating it. External conditions such as temperature will affect the measurement from the thermometer. This can be improved by testing the conditions before the experiment. Incorrect readings may occur due to errors such as parallax errors. Read
the measurements at eye level and get more than one person to read the measurement to verify the values. Stopwatches can have observational errors such as reading the time incorrectly. To fix this, confirm with other people.
· Using specific examples, compare the accuracy of analogue and digital technologies in making observations
Digital thermometers provide measurements to at least three decimal places, making the measurements close to the actual value unlike an analogue thermometer that only displays the readings in units of ℃. Using a digital stopwatch is more accurate that of an analogue version which would be a clock. The measurements are provided to the hundredth of a second, making it more accurate than that of the analogue stopwatch.
· Assess the safety of technologies selected for the practical investigation by using chemical safety data and Work Health and Safety guidelines as appropriate
Contact (of solid) with combustible material may cause fire. Do not boil to dryness with combustible material. Harmful if swallowed. Avoid contact with skin and eyes.
· Assess the safety of technologies selected for the practical investigation by using chemical safety data and Work Health and Safety guidelines as appropriate
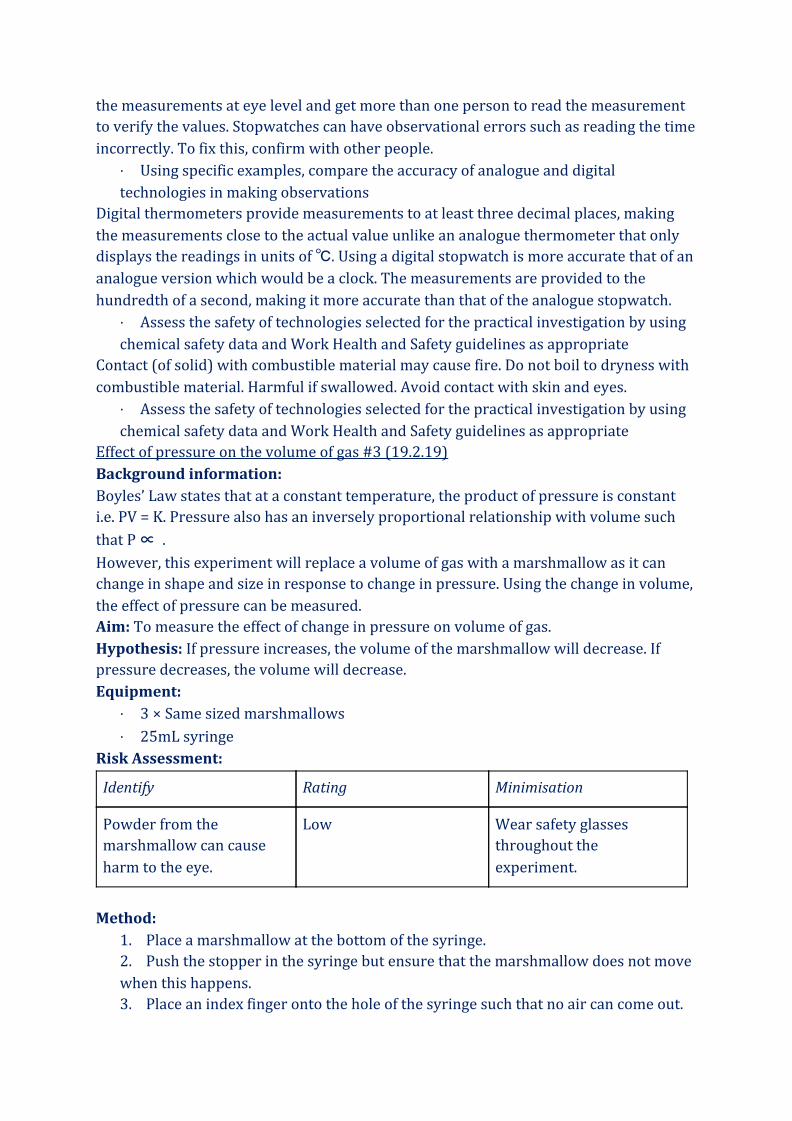
Effect of pressure on the volume of gas #3 (19.2.19) Background information: Boyles’ Law states that at a constant temperature, the product of pressure is constant i.e. PV = K. Pressure also has an inversely proportional relationship with volume such
that P ∝ . However, this experiment will replace a volume of gas with a marshmallow as it can change in shape and size in response to change in pressure. Using the change in volume, the effect of pressure can be measured. Aim: To measure the effect of change in pressure on volume of gas. Hypothesis: If pressure increases, the volume of the marshmallow will decrease. If pressure decreases, the volume will decrease. Equipment:
· 3 × Same sized marshmallows
· 25mL syringe Risk Assessment:
Method:
1. Place a marshmallow at the bottom of the syringe. 2. Push the stopper in the syringe but ensure that the marshmallow does not move when this happens. 3. Place an index finger onto the hole of the syringe such that no air can come out.
Identify Rating Minimisation
Powder from the marshmallow can cause harm to the eye.
Low Wear safety glasses throughout the experiment.

4. Push the stopper inwards to compress whilst measuring the change in volume of the marshmallow. 5. Repeat step 1-4 three times. 6. Repeat step 1. 7. Push the stopper in the syringe until it touches the marshmallow. 8. Repeat step 3. 9. Pull the stopper outwards to expand whilst measuring the change in volume of the marshmallow. 10. Repeat step 6-9 three times.
Results:
Discussion: The results reveal that when pressure is increased the volume had an average decrease of 1.67mL, which agrees with the hypothesis that when pressure increases volume decreases. When pressure decreased the volume had an average increase of 1.33mL, which agrees with the hypothesis that when pressure increases volume decreases. The results were reliable as the experiment was repeated three times and the measurements were consistent with no outliers. However, there was a small sample size and could be compared with other results to see a consistency in a larger scale of results. This could be improved by sharing results with the class and combining the results to ensure that the results were consistent throughout the entire class. The experiment was not accurate as the results were not measured to at least three decimal places, which is the minimum measurement to be considered accurate and close to the actual value. To make the recording of measurements more accurate, the use of digital technology to record the change in volume of the marshmallows would make the experiment more accurate, as it can record values to at least three decimal places. The experiment was reliable as the same marshmallows were used, the marshmallows were placed in the same position in the beaker, the same syringe was used. All these variables were kept controlled throughout the experiment. The change in pressure of the syringe was the only independent variable while the change in volume of the syringe was the only dependent variable. Thus, the experiment was valid overall.
· Evaluate the limitations of the technologies used
Change in volume as pressure increases (mL) (2d.p.)
Change in volume as pressure decreases (mL) (2.d.p.)
1 +2 -2
2 +2 -1
3 +1 -1
Average +1.67 -1.33

Using an analogue syringe for the experiment does not display accurate measurements of volume such that the measured value is not close to the real value. The measured values can differ by half of the smallest unit marked on the scale of the syringe.
· Investigate the range of measuring devices used in the practical investigation and assess the likelihood of random and systematic errors and the devices' degree of accuracy
Syringes have a chance of having random errors by the tiredness of the people working. This random error can be minimised by taking the average of a large number of readings. The syringe can experience systematic errors: instrumental errors, environmental errors and observational errors. This can be fixed by re-calibrating it. External conditions such as pressure will affect the measurement given by the syringe. This can be improved by testing the conditions before the experiment. Incorrect readings may occur due to errors such as parallax errors. Read the measurements at eye level and get more than one person to read the measurement to verify the values.
· Using specific examples, compare the accuracy of analogue and digital technologies in making observations
Digital syringes provide measurements to at least three decimal places, making the measurements close to the actual value unlike an analogue syringe that only displays the readings in units of mL.
· Assess the safety of technologies selected for the practical investigation by using chemical safety data and Work Health and Safety guidelines as appropriate
Effect of temperature on the rate of reaction #1 (15.2.19) Background information: If the temperature of a system changes, so will the rate of reaction change in correspondence to the temperature. If temperature increases, so will the rate of reaction increase. If the temperature decreases, so will the rate of reaction decrease. Thus, temperature proportionally increases and decreases with the rate of reaction. Glowsticks have seals that separates the chemical species within it from each other, thus keeping the glowstick from glowing. By cracking the glowstick, the seals are broken such that the chemical species within it can react and form a product that is bright and fluorescent in solution. Thus, glowsticks become brighter when the reaction occurs and since it is a reaction, it can be affected by temperature through the investigation. Aim: To measure the effect of change of temperature on reaction rate. Hypothesis: If temperature is changed, the reaction rate will change in proportion to that of the temperature. Equipment:
· 3 × small green glowsticks
· 3 × 50mL beakers · Ice cubes
· Boiled water (approx. 50℃) · Water at room temperature

· 3 × thermometers
· Stopwatch · Tweezer
Risk Assessment:
Method:
1. Prepare one 50mL beaker of water with ice cubes, one 50mL beaker of water at room temperature, and one 50mL beaker of boiled water.
2. Crack three glowsticks and place one into each of the three 50mL beakers of water.
3. Observe the brightness of the glowsticks in each of the beakers for the first 5 minutes.
4. Tweeze out the glowsticks from the 50mL beaker of water with ice cubes and the 50mL beaker of boiled water and place them into their opposite beakers.
5. Time how long the glowsticks take to change in brightness completely in the 50mL beaker of water with ice cubes and the 50mL beaker of boiled of water.
6. Tweeze out all the glowsticks from each beaker and time how long it takes for each glowstick to have the same brightness.
7. Repeat step 1-6 ten times. Results:
Identify Rating Minimisation
Dropped glass off the edge of the table will most likely break and can cause a cut to a person.
Medium Keep glassware away from the edges of your table. Clear away broken glass immediately. Wear closed in leather shoes.
Spilling water can cause a slipping hazard to the person.
Low Handle containers of water with care by holding them steadily. Clean up the spill with a towel.
Broken or melted glowsticks can lead to leaks that can cause dangerous reactions or harm to human skin or eyes.
Medium Ensure that the boiled water is at a maximum of 50℃. Wash off experimented chemicals immediately from the skin. Wear safety goggles to protect eyes.
Change imposed on the temperature Observations
Cracked glowstick placed in a 50mL beaker of water with ice cubes.
The glowstick was dull when placed in the beaker for 5 minutes.

Discussion: From the results, when the glowstick is placed in hot water, the glowstick glows brighter than that of a glowstick in water at room temperature. Also, when the glowstick is placed in cold water, the glowstick glows less than that of a glowstick in water at room temperature, which corresponds to the hypothesis that temperature is proportional in relation to the reaction rate, as the brightness indicates how fast the reaction occurs. Additionally, the glowsticks all reached the same brightness after they were all taken out of each beaker of different temperatures after 6 minutes and 33 seconds. This means that the glowsticks eventually have the same brightness at the same temperature. Hence, an increase in temperature has led to an increase in reaction rate, while a decrease in temperature has led to a decrease in the reaction rate. Thus, the change in temperature is proportional to the change in reaction rate. The experiment was not repeated to see if there were any inconsistencies in the results, making the results unreliable. This can be improved by repeating the experiment at least 3 times to record consistent results and to ensure a reliable experiment. The results were not able to be compared to other groups as the glowsticks were different in size amongst the class. Thus, making the experiment unreliable as results could be confirmed to be consistent. The experiment was not accurate as the observations were made by the human eye, meaning that there are chances for misjudgements and random errors. This can be improved on by changing the experiment from a qualitative analysis, to a quantitative analysis through measuring the luminosity of light with a lux meter to get more accurate results.
Cracked glowstick placed in a 50mL beaker of water at room temperature.
The glowstick was brighter than the dull glowstick when placed in the beaker for 5 minutes.
Cracked glowstick placed in a 50mL beaker of boiled water.
The glowstick was the brightest out of the all the glowsticks when placed in the beaker for 5 minutes.
Cracked glowstick moved from iced water to boiled water.
Within 45 seconds the glowstick became brighter in comparison to the other glowsticks.
Cracked glowstick moved from boiled water to iced water.
Within 45 seconds, the glowstick became less bright in comparison to the other glowsticks.
Cracked glowsticks taken out of the beakers.
A time of 6 minutes and 33 seconds was taken for the glowsticks to reach the same brightness.

The experiment was valid because the temperature of water from each beaker was kept in the same order of temperature. All the variables other than the temperature and the brightness of the glowstick were controlled as the size and colour of the glowsticks were kept the same.
· Evaluate the limitations of the technologies used The thermometer used in the experiment does not display accurate measurements of temperature such that the measured value is not close to the real value. The measured values can differ by half of the smallest unit marked on the scale of the thermometer.
· Investigate the range of measuring devices used in the practical investigation and assess the likelihood of random and systematic errors and the devices' degree of accuracy
Thermometers have a chance of experiencing sudden changes in temperature as a random error in the experiment. Stopwatches can have random errors by the tiredness of the people working. These random errors can be minimised by taking the average of a large number of readings. The thermometer can experience systematic errors: instrumental errors, environmental errors and observational errors. There can be errors with the thermometer throughout the experiment. This can be fixed by re-calibrating it. External conditions such as temperature will affect the measurement from the thermometer. This can be improved by testing the conditions before the experiment. Incorrect readings may occur due to errors such as parallax errors. Read the measurements at eye level and get more than one person to read the measurement to verify the values. Stopwatches can have observational errors such as reading the time incorrectly. To fix this, confirm with other people.
· Using specific examples, compare the accuracy of analogue and digital technologies in making observations
Digital thermometers provide measurements to at least three decimal places, making the measurements close to the actual value unlike an analogue thermometer that only displays the readings in units of ℃. Using a digital stopwatch is more accurate that that of an analogue version which would be a clock. The measurements are provided to the hundredth of a second, making it more accurate than that of the analogue stopwatch.
· Assess the safety of technologies selected for the practical investigation by using chemical safety data and Work Health and Safety guidelines as appropriate
Effect of temperature on the rate of reaction #2 (19.2.19) Background information: If the temperature of a system changes, so will the rate of reaction change in correspondence to the temperature. If temperature increases, the rate of collisions between molecules increases, and so will the rate of reaction increase. If the temperature decreases, the rate of collisions between molecules decreases, and so will the rate of reaction decrease. Thus, temperature proportionally increases and decreases with the rate of reaction. Potassium permanganate (KMnO4) is purple. Oxalic acid (C2H2O4) is colourless. When KMnO4 reacts with C2H2O4 the solutions macroscopically change from purples to

colourless when the reaction has completed. Thus, the rate of this reaction can be determined through observations and time. Aim: To measure the effect of change of temperature on reaction rate. Hypothesis: If temperature is changed, the reaction rate will change in proportion to that of the temperature. Equipment:
· 3 × 200mL beakers · 3 × thermometers
· 3 × medium test tubes · 3 × stopwatches
· 2 × 25mL measuring cylinders · 15mL of 0.001M potassium permanganate (KMnO4)
· 15mL of 0.001M oxalic acid (C2H2O4) · Bunsen burner
· Retort stand · Tripod · Gauze mat
· Clamp · Matchbox
· Match Risk Assessment:
Method:
1. Fill up a 200mL beaker with water that has been boiled at a certain temperature whilst recording the temperature with a thermometer.
Identify Rating Minimisation
Contact with combustible material may cause fire.
Medium Do not boil to dryness with combustible material.
Harmful if potassium permanganate is swallowed. Contact with potassium permanganate may damage skin and eyes
Medium Do not place the substance in cups and do not drink. Avoid contact with skin and eyes.
Contact with flame and hot objects may cause burn to skin.
Medium Cool down the hot equipment with water unless it is glass. Allow glass to cool down without the use of water. Otherwise, indirectly hold the equipment e.g. using tongs.

2. Place a test tube with 5mL of 0.001M KMnO4 solution and a test tube with 5mL of 0.001M C2H2O4 solution into the beaker until the solutions share the same temperature as the water. 3. Mix the two solutions and place the test tube with the mixed solution back into the beaker and start timing using a stopwatch. 4. Observe the purple colour of the mixed solution turning colourless and stop the time when it becomes completely colourless. 5. Record the time it takes for the purple colour to disappear. 6. Repeat step 1-6 with a different temperature of water. Each temperature of water should be used to perform the experiment three times. 7. Heat a 200mL beaker of water placed on a gauze mat on a tripod and place the test tubes of the solutions inside, using a Bunsen burner. 8. Stop heating the beaker when the temperature reaches the desired amount and repeat step 3 using tongs. 9. Repeat step 4-5. 10. Repeat step 7-9 two times.
Results:
Discussion: The change in temperature does affect the rate of reaction, as the solutions at 40℃, 45℃ and 70℃ had the times in descending order 18:27, 13:50 and 1:04 in minutes: seconds respectively. Thus, the rate of reaction is increasing respectively. Hence, temperature is proportional to the rate of reaction as shown through changes in temperature and reaction rate. From observing the process of each reaction at different temperatures, the colours changed at a rate in proportion to the affected reaction rate. The colour of the solution changed from purple to colourless faster when the temperature of the system was higher, meaning that temperature effected the rate of reaction. The results were not reliable as the experiment was not repeated at all to see if the results were consistent and not errors to the experiment. This could be improved by repeating the experiment at least three times to find precise results that make the experiment more reliable. There was a small sample size which did not help confirm if the results were consistent or not. By comparing results with other groups, the
Temperature of the beaker (℃) Time for completion of reaction (minutes: seconds)
27 N/A
40 18:27
45 13:50
70 1:04

experiment could cover a greater range of temperatures and times to reassure the reliability of the experiment. The experiment was not accurate as the thermometers were limited to units of ℃, meaning that values may not be close to the actual values. By using digital thermometers, results can be displayed to 3d.p. to satisfy the accuracy of results obtained from the experiment. The experiment was valid as the same thermometers, 200mL beakers, volume and 0.001M solutions of KMnO4 and C2H2O4, test tubes, stopwatches, and 25mL measuring cylinders were used throughout the experiment. All these variables were controlled. The temperature of the solutions was the independent variable and the time for the reaction to complete was the dependent variable. Thus, the experiment was valid overall.
· Evaluate the limitations of the technologies used The thermometer used in the experiment does not display accurate measurements of temperature such that the measured value is not close to the real value. The measured values can differ by half of the smallest unit marked on the scale of the thermometer.
· Investigate the range of measuring devices used in the practical investigation and assess the likelihood of random and systematic errors and the devices' degree of accuracy
Thermometers have a chance of experiencing sudden changes in temperature as a random error in the experiment. Stopwatches can have random errors by the tiredness of the people working. These random errors can be minimised by taking the average of a large number of readings. The thermometer can experience systematic errors: instrumental errors, environmental errors and observational errors. There can be errors with the thermometer throughout the experiment. This can be fixed by re-calibrating it. External conditions such as temperature will affect the measurement from the thermometer. This can be improved by testing the conditions before the experiment. Incorrect readings may occur due to errors such as parallax errors. Read the measurements at eye level and get more than one person to read the measurement to verify the values. Stopwatches can have observational errors such as reading the time incorrectly. To fix this, confirm with other people.
· Using specific examples, compare the accuracy of analogue and digital technologies in making observations
Digital thermometers provide measurements to at least three decimal places, making the measurements close to the actual value unlike an analogue thermometer that only displays the readings in units of ℃. Using a digital stopwatch is more accurate that of an analogue version which would be a clock. The measurements are provided to the hundredth of a second, making it more accurate than that of the analogue stopwatch.
· Assess the safety of technologies selected for the practical investigation by using chemical safety data and Work Health and Safety guidelines as appropriate
Contact (of solid) with combustible material may cause fire. Do not boil to dryness with combustible material. Harmful if swallowed. Avoid contact with skin and eyes.

· Assess the safety of technologies selected for the practical investigation by using chemical safety data and Work Health and Safety guidelines as appropriate
Effect of pressure on the volume of gas #3 (19.2.19) Background information: Boyles’ Law states that at a constant temperature, the product of pressure is constant i.e. PV = K. Pressure also has an inversely proportional relationship with volume such
that P ∝ . However, this experiment will replace a volume of gas with a marshmallow as it can change in shape and size in response to change in pressure. Using the change in volume, the effect of pressure can be measured. Aim: To measure the effect of change in pressure on volume of gas. Hypothesis: If pressure increases, the volume of the marshmallow will decrease. If pressure decreases, the volume will decrease. Equipment:
· 3 × Same sized marshmallows · 25mL syringe
Risk Assessment:
Method:
1. Place a marshmallow at the bottom of the syringe. 2. Push the stopper in the syringe but ensure that the marshmallow does not move when this happens. 3. Place an index finger onto the hole of the syringe such that no air can come out. 4. Push the stopper inwards to compress whilst measuring the change in volume of the marshmallow. 5. Repeat step 1-4 three times. 6. Repeat step 1. 7. Push the stopper in the syringe until it touches the marshmallow. 8. Repeat step 3. 9. Pull the stopper outwards to expand whilst measuring the change in volume of the marshmallow. 10. Repeat step 6-9 three times.
Results:
Identify Rating Minimisation
Powder from the marshmallow can cause harm to the eye.
Low Wear safety glasses throughout the experiment.
Change in volume as pressure increases (mL) (2d.p.)
Change in volume as pressure decreases (mL) (2.d.p.)
1 +2 -2

Discussion: The results reveal that when pressure is increased the volume had an average decrease of 1.67mL, which agrees with the hypothesis that when pressure increases volume decreases. When pressure decreased the volume had an average increase of 1.33mL, which agrees with the hypothesis that when pressure increases volume decreases. The results were reliable as the experiment was repeated three times and the measurements were consistent with no outliers. However, there was a small sample size and could be compared with other results to see a consistency in a larger scale of results. This could be improved by sharing results with the class and combining the results to ensure that the results were consistent throughout the entire class. The experiment was not accurate as the results were not measured to at least three decimal places, which is the minimum measurement to be considered accurate and close to the actual value. To make the recording of measurements more accurate, the use of digital technology to record the change in volume of the marshmallows would make the experiment more accurate, as it can record values to at least three decimal places. The experiment was reliable as the same marshmallows were used, the marshmallows were placed in the same position in the beaker, the same syringe was used. All these variables were kept controlled throughout the experiment. The change in pressure of the syringe was the only independent variable while the change in volume of the syringe was the only dependent variable. Thus, the experiment was valid overall.
· Evaluate the limitations of the technologies used Using an analogue syringe for the experiment does not display accurate measurements of volume such that the measured value is not close to the real value. The measured values can differ by half of the smallest unit marked on the scale of the syringe.
· Investigate the range of measuring devices used in the practical investigation and assess the likelihood of random and systematic errors and the devices' degree of accuracy
Syringes have a chance of having random errors by the tiredness of the people working. This random error can be minimised by taking the average of a large number of readings. The syringe can experience systematic errors: instrumental errors, environmental errors and observational errors. This can be fixed by re-calibrating it. External conditions such as pressure will affect the measurement given by the syringe. This can be improved by testing the conditions before the experiment. Incorrect readings may occur due to errors such as parallax errors. Read the measurements at eye level and get more than one person to read the measurement to verify the values.
2 +2 -1
3 +1 -1
Average +1.67 -1.33

· Using specific examples, compare the accuracy of analogue and digital technologies in making observations
Digital syringes provide measurements to at least three decimal places, making the measurements close to the actual value unlike an analogue syringe that only displays the readings in units of mL.
· Assess the safety of technologies selected for the practical investigation by using chemical safety data and Work Health and Safety guidelines as appropriate
Effect of temperature on the rate of reaction #1 (15.2.19)
Background information:
If the temperature of a system changes, so will the rate of reaction change in correspondence to the
temperature. If temperature increases, so will the rate of reaction increase. If the temperature
decreases, so will the rate of reaction decrease. Thus, temperature proportionally increases and
decreases with the rate of reaction.
Glowsticks have seals that separates the chemical species within it from each other, thus keeping the
glowstick from glowing. By cracking the glowstick, the seals are broken such that the chemical
species within it can react and form a product that is bright and fluorescent in solution. Thus,
glowsticks become brighter when the reaction occurs and since it is a reaction, it can be affected by
temperature through the investigation.
Aim: To measure the effect of change of temperature on reaction rate.
Hypothesis: If temperature is changed, the reaction rate will change in proportion to that of the
temperature.
Equipment:
3 × small green glowsticks
3 × 50mL beakers
Ice cubes
Boiled water (approx. 50℃)
Water at room temperature
3 × thermometers
Stopwatch
Tweezer
Risk Assessment:
Identify Rating Minimisation
Dropped glass off the edge of the table will most likely break and can cause a cut to a person.
Medium Keep glassware away from the edges of your table. Clear away broken glass
immediately. Wear closed in leather shoes.
Spilling water can cause a slipping hazard to the person. Low Handle containers of water with
care by holding them steadily. Clean up the spill with a towel.
Broken or melted glowsticks can lead to leaks that can cause dangerous reactions or harm to human
skin or eyes. Medium Ensure that the boiled water is at a maximum of 50℃. Wash off
experimented chemicals immediately from the skin. Wear safety goggles to protect eyes.
Method:

Prepare one 50mL beaker of water with ice cubes, one 50mL beaker of water at room
temperature, and one 50mL beaker of boiled water.
Crack three glowsticks and place one into each of the three 50mL beakers of water.
Observe the brightness of the glowsticks in each of the beakers for the first 5 minutes.
Tweeze out the glowsticks from the 50mL beaker of water with ice cubes and the 50mL
beaker of boiled water and place them into their opposite beakers.
Time how long the glowsticks take to change in brightness completely in the 50mL beaker of
water with ice cubes and the 50mL beaker of boiled of water.
Tweeze out all the glowsticks from each beaker and time how long it takes for each glowstick
to have the same brightness.
Repeat step 1-6 ten times.
Results:
Change imposed on the temperature Observations
Cracked glowstick placed in a 50mL beaker of water with ice cubes. The glowstick was dull when
placed in the beaker for 5 minutes.
Cracked glowstick placed in a 50mL beaker of water at room temperature. The glowstick was
brighter than the dull glowstick when placed in the beaker for 5 minutes.
Cracked glowstick placed in a 50mL beaker of boiled water. The glowstick was the brightest out
of the all the glowsticks when placed in the beaker for 5 minutes.
Cracked glowstick moved from iced water to boiled water. Within 45 seconds the glowstick
became brighter in comparison to the other glowsticks.
Cracked glowstick moved from boiled water to iced water. Within 45 seconds, the glowstick
became less bright in comparison to the other glowsticks.
Cracked glowsticks taken out of the beakers. A time of 6 minutes and 33 seconds was taken for
the glowsticks to reach the same brightness.
Discussion:
From the results, when the glowstick is placed in hot water, the glowstick glows brighter than that of
a glowstick in water at room temperature. Also, when the glowstick is placed in cold water, the
glowstick glows less than that of a glowstick in water at room temperature, which corresponds to
the hypothesis that temperature is proportional in relation to the reaction rate, as the brightness
indicates how fast the reaction occurs. Additionally, the glowsticks all reached the same brightness
after they were all taken out of each beaker of different temperatures after 6 minutes and 33
seconds. This means that the glowsticks eventually have the same brightness at the same
temperature. Hence, an increase in temperature has led to an increase in reaction rate, while a
decrease in temperature has led to a decrease in the reaction rate. Thus, the change in temperature
is proportional to the change in reaction rate.
The experiment was not repeated to see if there were any inconsistencies in the results, making the
results unreliable. This can be improved by repeating the experiment at least 3 times to record
consistent results and to ensure a reliable experiment. The results were not able to be compared to
other groups as the glowsticks were different in size amongst the class. Thus, making the experiment
unreliable as results could be confirmed to be consistent.
The experiment was not accurate as the observations were made by the human eye, meaning that
there are chances for misjudgements and random errors. This can be improved on by changing the

experiment from a qualitative analysis, to a quantitative analysis through measuring the luminosity
of light with a lux meter to get more accurate results.
The experiment was valid because the temperature of water from each beaker was kept in the same
order of temperature. All the variables other than the temperature and the brightness of the
glowstick were controlled as the size and colour of the glowsticks were kept the same.
Evaluate the limitations of the technologies used
The thermometer used in the experiment does not display accurate measurements of temperature
such that the measured value is not close to the real value. The measured values can differ by half of
the smallest unit marked on the scale of the thermometer.
Investigate the range of measuring devices used in the practical investigation and assess the
likelihood of random and systematic errors and the devices' degree of accuracy
Thermometers have a chance of experiencing sudden changes in temperature as a random error in
the experiment. Stopwatches can have random errors by the tiredness of the people working. These
random errors can be minimised by taking the average of a large number of readings. The
thermometer can experience systematic errors: instrumental errors, environmental errors and
observational errors. There can be errors with the thermometer throughout the experiment. This
can be fixed by re-calibrating it. External conditions such as temperature will affect the
measurement from the thermometer. This can be improved by testing the conditions before the
experiment. Incorrect readings may occur due to errors such as parallax errors. Read the
measurements at eye level and get more than one person to read the measurement to verify the
values. Stopwatches can have observational errors such as reading the time incorrectly. To fix this,
confirm with other people.
Using specific examples, compare the accuracy of analogue and digital technologies in
making observations
Digital thermometers provide measurements to at least three decimal places, making the
measurements close to the actual value unlike an analogue thermometer that only displays the
readings in units of ℃. Using a digital stopwatch is more accurate that that of an analogue version
which would be a clock. The measurements are provided to the hundredth of a second, making it
more accurate than that of the analogue stopwatch.
Assess the safety of technologies selected for the practical investigation by using chemical
safety data and Work Health and Safety guidelines as appropriate
Effect of temperature on the rate of reaction #2 (19.2.19)
Background information:
If the temperature of a system changes, so will the rate of reaction change in correspondence to the
temperature. If temperature increases, the rate of collisions between molecules increases, and so
will the rate of reaction increase. If the temperature decreases, the rate of collisions between
molecules decreases, and so will the rate of reaction decrease. Thus, temperature proportionally
increases and decreases with the rate of reaction.
Potassium permanganate (KMnO4) is purple. Oxalic acid (C2H2O4) is colourless. When KMnO4
reacts with C2H2O4 the solutions macroscopically change from purples to colourless when the
reaction has completed. Thus, the rate of this reaction can be determined through observations and
time.
Aim: To measure the effect of change of temperature on reaction rate.
Hypothesis: If temperature is changed, the reaction rate will change in proportion to that of the
temperature.

Equipment:
3 × 200mL beakers
3 × thermometers
3 × medium test tubes
3 × stopwatches
2 × 25mL measuring cylinders
15mL of 0.001M potassium permanganate (KMnO4)
15mL of 0.001M oxalic acid (C2H2O4)
Bunsen burner
Retort stand
Tripod
Gauze mat
Clamp
Matchbox
Match
Risk Assessment:
Identify Rating Minimisation
Contact with combustible material may cause fire. Medium Do not boil to dryness with
combustible material.
Harmful if potassium permanganate is swallowed. Contact with potassium permanganate may
damage skin and eyes Medium Do not place the substance in cups and do not drink. Avoid
contact with skin and eyes.
Contact with flame and hot objects may cause burn to skin. Medium Cool down the hot
equipment with water unless it is glass. Allow glass to cool down without the use of water.
Otherwise, indirectly hold the equipment e.g. using tongs.
Method:
Fill up a 200mL beaker with water that has been boiled at a certain temperature whilst
recording the temperature with a thermometer.
Place a test tube with 5mL of 0.001M KMnO4 solution and a test tube with 5mL of 0.001M
C2H2O4 solution into the beaker until the solutions share the same temperature as the water.
Mix the two solutions and place the test tube with the mixed solution back into the beaker
and start timing using a stopwatch.
Observe the purple colour of the mixed solution turning colourless and stop the time when it
becomes completely colourless.
Record the time it takes for the purple colour to disappear.
Repeat step 1-6 with a different temperature of water. Each temperature of water should be
used to perform the experiment three times.
Heat a 200mL beaker of water placed on a gauze mat on a tripod and place the test tubes of
the solutions inside, using a Bunsen burner.
Stop heating the beaker when the temperature reaches the desired amount and repeat step
3 using tongs.
Repeat step 4-5.
Repeat step 7-9 two times.
Results:

Temperature of the beaker (℃) Time for completion of reaction (minutes: seconds)
27 N/A
40 18:27
45 13:50
70 1:04
Discussion:
The change in temperature does affect the rate of reaction, as the solutions at 40℃, 45℃ and 70℃
had the times in descending order 18:27, 13:50 and 1:04 in minutes: seconds respectively. Thus, the
rate of reaction is increasing respectively. Hence, temperature is proportional to the rate of reaction
as shown through changes in temperature and reaction rate.
From observing the process of each reaction at different temperatures, the colours changed at a rate
in proportion to the affected reaction rate. The colour of the solution changed from purple to
colourless faster when the temperature of the system was higher, meaning that temperature
effected the rate of reaction.
The results were not reliable as the experiment was not repeated at all to see if the results were
consistent and not errors to the experiment. This could be improved by repeating the experiment at
least three times to find precise results that make the experiment more reliable. There was a small
sample size which did not help confirm if the results were consistent or not. By comparing results
with other groups, the experiment could cover a greater range of temperatures and times to
reassure the reliability of the experiment.
The experiment was not accurate as the thermometers were limited to units of ℃, meaning that
values may not be close to the actual values. By using digital thermometers, results can be displayed
to 3d.p. to satisfy the accuracy of results obtained from the experiment.
The experiment was valid as the same thermometers, 200mL beakers, volume and 0.001M solutions
of KMnO4 and C2H2O4, test tubes, stopwatches, and 25mL measuring cylinders were used
throughout the experiment. All these variables were controlled. The temperature of the solutions
was the independent variable and the time for the reaction to complete was the dependent variable.
Thus, the experiment was valid overall.
Evaluate the limitations of the technologies used
The thermometer used in the experiment does not display accurate measurements of temperature
such that the measured value is not close to the real value. The measured values can differ by half of
the smallest unit marked on the scale of the thermometer.
Investigate the range of measuring devices used in the practical investigation and assess the
likelihood of random and systematic errors and the devices' degree of accuracy
Thermometers have a chance of experiencing sudden changes in temperature as a random error in
the experiment. Stopwatches can have random errors by the tiredness of the people working. These
random errors can be minimised by taking the average of a large number of readings. The
thermometer can experience systematic errors: instrumental errors, environmental errors and
observational errors. There can be errors with the thermometer throughout the experiment. This
can be fixed by re-calibrating it. External conditions such as temperature will affect the
measurement from the thermometer. This can be improved by testing the conditions before the
experiment. Incorrect readings may occur due to errors such as parallax errors. Read the
measurements at eye level and get more than one person to read the measurement to verify the

values. Stopwatches can have observational errors such as reading the time incorrectly. To fix this,
confirm with other people.
Using specific examples, compare the accuracy of analogue and digital technologies in
making observations
Digital thermometers provide measurements to at least three decimal places, making the
measurements close to the actual value unlike an analogue thermometer that only displays the
readings in units of ℃. Using a digital stopwatch is more accurate that of an analogue version which
would be a clock. The measurements are provided to the hundredth of a second, making it more
accurate than that of the analogue stopwatch.
Assess the safety of technologies selected for the practical investigation by using chemical
safety data and Work Health and Safety guidelines as appropriate
Contact (of solid) with combustible material may cause fire. Do not boil to dryness with combustible
material. Harmful if swallowed. Avoid contact with skin and eyes.
Assess the safety of technologies selected for the practical investigation by using chemical
safety data and Work Health and Safety guidelines as appropriate
Effect of pressure on the volume of gas #3 (19.2.19)
Background information:
Boyles’ Law states that at a constant temperature, the product of pressure is constant i.e. PV = K.
Pressure also has an inversely proportional relationship with volume such that P ∝ 1/V .
However, this experiment will replace a volume of gas with a marshmallow as it can change in shape
and size in response to change in pressure. Using the change in volume, the effect of pressure can be
measured.
Aim: To measure the effect of change in pressure on volume of gas.
Hypothesis: If pressure increases, the volume of the marshmallow will decrease. If pressure
decreases, the volume will decrease.
Equipment:
3 × Same sized marshmallows
25mL syringe
Risk Assessment:
Identify Rating Minimisation
Powder from the marshmallow can cause harm to the eye. Low Wear safety glasses
throughout the experiment.
Method:
Place a marshmallow at the bottom of the syringe.
Push the stopper in the syringe but ensure that the marshmallow does not move when this
happens.
Place an index finger onto the hole of the syringe such that no air can come out.
Push the stopper inwards to compress whilst measuring the change in volume of the
marshmallow.
Repeat step 1-4 three times.
Repeat step 1.
Push the stopper in the syringe until it touches the marshmallow.
Repeat step 3.

Pull the stopper outwards to expand whilst measuring the change in volume of the
marshmallow.
Repeat step 6-9 three times.
Results:
Change in volume as pressure increases (mL) (2d.p.) Change in volume as pressure
decreases (mL) (2.d.p.)
1 +2 -2
2 +2 -1
3 +1 -1
Average +1.67 -1.33
Discussion:
The results reveal that when pressure is increased the volume had an average decrease of 1.67mL,
which agrees with the hypothesis that when pressure increases volume decreases. When pressure
decreased the volume had an average increase of 1.33mL, which agrees with the hypothesis that
when pressure increases volume decreases.
The results were reliable as the experiment was repeated three times and the measurements were
consistent with no outliers. However, there was a small sample size and could be compared with
other results to see a consistency in a larger scale of results. This could be improved by sharing
results with the class and combining the results to ensure that the results were consistent
throughout the entire class.
The experiment was not accurate as the results were not measured to at least three decimal places,
which is the minimum measurement to be considered accurate and close to the actual value. To
make the recording of measurements more accurate, the use of digital technology to record the
change in volume of the marshmallows would make the experiment more accurate, as it can record
values to at least three decimal places.
The experiment was reliable as the same marshmallows were used, the marshmallows were placed
in the same position in the beaker, the same syringe was used. All these variables were kept
controlled throughout the experiment. The change in pressure of the syringe was the only
independent variable while the change in volume of the syringe was the only dependent variable.
Thus, the experiment was valid overall.
Evaluate the limitations of the technologies used
Using an analogue syringe for the experiment does not display accurate measurements of volume
such that the measured value is not close to the real value. The measured values can differ by half of
the smallest unit marked on the scale of the syringe.
Investigate the range of measuring devices used in the practical investigation and assess the
likelihood of random and systematic errors and the devices' degree of accuracy
Syringes have a chance of having random errors by the tiredness of the people working. This random
error can be minimised by taking the average of a large number of readings. The syringe can
experience systematic errors: instrumental errors, environmental errors and observational errors.
This can be fixed by re-calibrating it. External conditions such as pressure will affect the
measurement given by the syringe. This can be improved by testing the conditions before the
experiment. Incorrect readings may occur due to errors such as parallax errors. Read the
measurements at eye level and get more than one person to read the measurement to verify the
values.

Using specific examples, compare the accuracy of analogue and digital technologies in
making observations
Digital syringes provide measurements to at least three decimal places, making the measurements
close to the actual value unlike an analogue syringe that only displays the readings in units of mL.
Assess the safety of technologies selected for the practical investigation by using chemical
safety data and Work Health and Safety guidelines as appropriate
Effect of temperature on the rate of reaction #1 (15.2.19) Background information: If the temperature of a system changes, so will the rate of reaction change in correspondence to the temperature. If temperature increases, so will the rate of reaction increase. If the temperature decreases, so will the rate of reaction decrease. Thus, temperature proportionally increases and decreases with the rate of reaction. Glowsticks have seals that separates the chemical species within it from each other, thus keeping the glowstick from glowing. By cracking the glowstick, the seals are broken such that the chemical species within it can react and form a product that is bright and fluorescent in solution. Thus, glowsticks become brighter when the reaction occurs and since it is a reaction, it can be affected by temperature through the investigation. Aim: To measure the effect of change of temperature on reaction rate. Hypothesis: If temperature is changed, the reaction rate will change in proportion to that of the temperature. Equipment:
· 3 × small green glowsticks
· 3 × 50mL beakers · Ice cubes
· Boiled water (approx. 50℃) · Water at room temperature · 3 × thermometers
· Stopwatch · Tweezer
Risk Assessment:
Identify Rating Minimisation
Dropped glass off the edge of the table will most likely break and can cause a cut to a person.
Medium Keep glassware away from the edges of your table. Clear away broken glass immediately. Wear closed in leather shoes.
Spilling water can cause a slipping hazard to the person.
Low Handle containers of water with care by holding them steadily. Clean up the spill with a towel.
Method:
1. Prepare one 50mL beaker of water with ice cubes, one 50mL beaker of water at room temperature, and one 50mL beaker of boiled water.
2. Crack three glowsticks and place one into each of the three 50mL beakers of water.
3. Observe the brightness of the glowsticks in each of the beakers for the first 5 minutes.
4. Tweeze out the glowsticks from the 50mL beaker of water with ice cubes and the 50mL beaker of boiled water and place them into their opposite beakers.
5. Time how long the glowsticks take to change in brightness completely in the 50mL beaker of water with ice cubes and the 50mL beaker of boiled of water.
6. Tweeze out all the glowsticks from each beaker and time how long it takes for each glowstick to have the same brightness.
7. Repeat step 1-6 ten times. Results:
Broken or melted glowsticks can lead to leaks that can cause dangerous reactions or harm to human skin or eyes.
Medium Ensure that the boiled water is at a maximum of 50℃. Wash off experimented chemicals immediately from the skin. Wear safety goggles to protect eyes.
Change imposed on the temperature Observations
Cracked glowstick placed in a 50mL beaker of water with ice cubes.
The glowstick was dull when placed in the beaker for 5 minutes.
Cracked glowstick placed in a 50mL beaker of water at room temperature.
The glowstick was brighter than the dull glowstick when placed in the beaker for 5 minutes.
Cracked glowstick placed in a 50mL beaker of boiled water.
The glowstick was the brightest out of the all the glowsticks when placed in the beaker for 5 minutes.
Cracked glowstick moved from iced water to boiled water.
Within 45 seconds the glowstick became brighter in comparison to the other glowsticks.
Cracked glowstick moved from boiled water to iced water.
Within 45 seconds, the glowstick became less bright in comparison to the other glowsticks.

Discussion: From the results, when the glowstick is placed in hot water, the glowstick glows brighter than that of a glowstick in water at room temperature. Also, when the glowstick is placed in cold water, the glowstick glows less than that of a glowstick in water at room temperature, which corresponds to the hypothesis that temperature is proportional in relation to the reaction rate, as the brightness indicates how fast the reaction occurs. Additionally, the glowsticks all reached the same brightness after they were all taken out of each beaker of different temperatures after 6 minutes and 33 seconds. This means that the glowsticks eventually have the same brightness at the same temperature. Hence, an increase in temperature has led to an increase in reaction rate, while a decrease in temperature has led to a decrease in the reaction rate. Thus, the change in temperature is proportional to the change in reaction rate. The experiment was not repeated to see if there were any inconsistencies in the results, making the results unreliable. This can be improved by repeating the experiment at least 3 times to record consistent results and to ensure a reliable experiment. The results were not able to be compared to other groups as the glowsticks were different in size amongst the class. Thus, making the experiment unreliable as results could be confirmed to be consistent. The experiment was not accurate as the observations were made by the human eye, meaning that there are chances for misjudgements and random errors. This can be improved on by changing the experiment from a qualitative analysis, to a quantitative analysis through measuring the luminosity of light with a lux meter to get more accurate results. The experiment was valid because the temperature of water from each beaker was kept in the same order of temperature. All the variables other than the temperature and the brightness of the glowstick were controlled as the size and colour of the glowsticks were kept the same.
· Evaluate the limitations of the technologies used The thermometer used in the experiment does not display accurate measurements of temperature such that the measured value is not close to the real value. The measured values can differ by half of the smallest unit marked on the scale of the thermometer.
· Investigate the range of measuring devices used in the practical investigation and assess the likelihood of random and systematic errors and the devices' degree of accuracy
Thermometers have a chance of experiencing sudden changes in temperature as a random error in the experiment. Stopwatches can have random errors by the tiredness of the people working. These random errors can be minimised by taking the average of a large number of readings. The thermometer can experience systematic errors:
Cracked glowsticks taken out of the beakers.
A time of 6 minutes and 33 seconds was taken for the glowsticks to reach the same brightness.

instrumental errors, environmental errors and observational errors. There can be errors with the thermometer throughout the experiment. This can be fixed by re-calibrating it. External conditions such as temperature will affect the measurement from the thermometer. This can be improved by testing the conditions before the experiment. Incorrect readings may occur due to errors such as parallax errors. Read the measurements at eye level and get more than one person to read the measurement to verify the values. Stopwatches can have observational errors such as reading the time incorrectly. To fix this, confirm with other people.
· Using specific examples, compare the accuracy of analogue and digital technologies in making observations
Digital thermometers provide measurements to at least three decimal places, making the measurements close to the actual value unlike an analogue thermometer that only displays the readings in units of ℃. Using a digital stopwatch is more accurate that that of an analogue version which would be a clock. The measurements are provided to the hundredth of a second, making it more accurate than that of the analogue stopwatch.
· Assess the safety of technologies selected for the practical investigation by using chemical safety data and Work Health and Safety guidelines as appropriate
Effect of temperature on the rate of reaction #2 (19.2.19) Background information: If the temperature of a system changes, so will the rate of reaction change in correspondence to the temperature. If temperature increases, the rate of collisions between molecules increases, and so will the rate of reaction increase. If the temperature decreases, the rate of collisions between molecules decreases, and so will the rate of reaction decrease. Thus, temperature proportionally increases and decreases with the rate of reaction. Potassium permanganate (KMnO4) is purple. Oxalic acid (C2H2O4) is colourless. When KMnO4 reacts with C2H2O4 the solutions macroscopically change from purples to colourless when the reaction has completed. Thus, the rate of this reaction can be determined through observations and time. Aim: To measure the effect of change of temperature on reaction rate. Hypothesis: If temperature is changed, the reaction rate will change in proportion to that of the temperature. Equipment:
· 3 × 200mL beakers
· 3 × thermometers · 3 × medium test tubes · 3 × stopwatches
· 2 × 25mL measuring cylinders · 15mL of 0.001M potassium permanganate (KMnO4)
· 15mL of 0.001M oxalic acid (C2H2O4) · Bunsen burner
· Retort stand

· Tripod
· Gauze mat · Clamp
· Matchbox · Match
Risk Assessment:
Method:
1. Fill up a 200mL beaker with water that has been boiled at a certain temperature whilst recording the temperature with a thermometer. 2. Place a test tube with 5mL of 0.001M KMnO4 solution and a test tube with 5mL of 0.001M C2H2O4 solution into the beaker until the solutions share the same temperature as the water. 3. Mix the two solutions and place the test tube with the mixed solution back into the beaker and start timing using a stopwatch. 4. Observe the purple colour of the mixed solution turning colourless and stop the time when it becomes completely colourless. 5. Record the time it takes for the purple colour to disappear. 6. Repeat step 1-6 with a different temperature of water. Each temperature of water should be used to perform the experiment three times. 7. Heat a 200mL beaker of water placed on a gauze mat on a tripod and place the test tubes of the solutions inside, using a Bunsen burner. 8. Stop heating the beaker when the temperature reaches the desired amount and repeat step 3 using tongs. 9. Repeat step 4-5. 10. Repeat step 7-9 two times.
Results:
Identify Rating Minimisation
Contact with combustible material may cause fire.
Medium Do not boil to dryness with combustible material.
Harmful if potassium permanganate is swallowed. Contact with potassium permanganate may damage skin and eyes
Medium Do not place the substance in cups and do not drink. Avoid contact with skin and eyes.
Contact with flame and hot objects may cause burn to skin.
Medium Cool down the hot equipment with water unless it is glass. Allow glass to cool down without the use of water. Otherwise, indirectly hold the equipment e.g. using tongs.

Discussion: The change in temperature does affect the rate of reaction, as the solutions at 40℃, 45℃ and 70℃ had the times in descending order 18:27, 13:50 and 1:04 in minutes: seconds respectively. Thus, the rate of reaction is increasing respectively. Hence, temperature is proportional to the rate of reaction as shown through changes in temperature and reaction rate. From observing the process of each reaction at different temperatures, the colours changed at a rate in proportion to the affected reaction rate. The colour of the solution changed from purple to colourless faster when the temperature of the system was higher, meaning that temperature effected the rate of reaction. The results were not reliable as the experiment was not repeated at all to see if the results were consistent and not errors to the experiment. This could be improved by repeating the experiment at least three times to find precise results that make the experiment more reliable. There was a small sample size which did not help confirm if the results were consistent or not. By comparing results with other groups, the experiment could cover a greater range of temperatures and times to reassure the reliability of the experiment. The experiment was not accurate as the thermometers were limited to units of ℃, meaning that values may not be close to the actual values. By using digital thermometers, results can be displayed to 3d.p. to satisfy the accuracy of results obtained from the experiment. The experiment was valid as the same thermometers, 200mL beakers, volume and 0.001M solutions of KMnO4 and C2H2O4, test tubes, stopwatches, and 25mL measuring cylinders were used throughout the experiment. All these variables were controlled. The temperature of the solutions was the independent variable and the time for the reaction to complete was the dependent variable. Thus, the experiment was valid overall.
· Evaluate the limitations of the technologies used The thermometer used in the experiment does not display accurate measurements of temperature such that the measured value is not close to the real value. The measured values can differ by half of the smallest unit marked on the scale of the thermometer.
Temperature of the beaker (℃) Time for completion of reaction (minutes: seconds)
27 N/A
40 18:27
45 13:50
70 1:04

· Investigate the range of measuring devices used in the practical investigation and assess the likelihood of random and systematic errors and the devices' degree of accuracy
Thermometers have a chance of experiencing sudden changes in temperature as a random error in the experiment. Stopwatches can have random errors by the tiredness of the people working. These random errors can be minimised by taking the average of a large number of readings. The thermometer can experience systematic errors: instrumental errors, environmental errors and observational errors. There can be errors with the thermometer throughout the experiment. This can be fixed by re-calibrating it. External conditions such as temperature will affect the measurement from the thermometer. This can be improved by testing the conditions before the experiment. Incorrect readings may occur due to errors such as parallax errors. Read the measurements at eye level and get more than one person to read the measurement to verify the values. Stopwatches can have observational errors such as reading the time incorrectly. To fix this, confirm with other people.
· Using specific examples, compare the accuracy of analogue and digital technologies in making observations
Digital thermometers provide measurements to at least three decimal places, making the measurements close to the actual value unlike an analogue thermometer that only displays the readings in units of ℃. Using a digital stopwatch is more accurate that of an analogue version which would be a clock. The measurements are provided to the hundredth of a second, making it more accurate than that of the analogue stopwatch.
· Assess the safety of technologies selected for the practical investigation by using chemical safety data and Work Health and Safety guidelines as appropriate
Contact (of solid) with combustible material may cause fire. Do not boil to dryness with combustible material. Harmful if swallowed. Avoid contact with skin and eyes.
· Assess the safety of technologies selected for the practical investigation by using chemical safety data and Work Health and Safety guidelines as appropriate
Effect of pressure on the volume of gas #3 (19.2.19) Background information: Boyles’ Law states that at a constant temperature, the product of pressure is constant i.e. PV = K. Pressure also has an inversely proportional relationship with volume such
that P ∝ . However, this experiment will replace a volume of gas with a marshmallow as it can change in shape and size in response to change in pressure. Using the change in volume, the effect of pressure can be measured. Aim: To measure the effect of change in pressure on volume of gas. Hypothesis: If pressure increases, the volume of the marshmallow will decrease. If pressure decreases, the volume will decrease. Equipment:
· 3 × Same sized marshmallows
· 25mL syringe

Risk Assessment:
Method:
1. Place a marshmallow at the bottom of the syringe. 2. Push the stopper in the syringe but ensure that the marshmallow does not move when this happens. 3. Place an index finger onto the hole of the syringe such that no air can come out. 4. Push the stopper inwards to compress whilst measuring the change in volume of the marshmallow. 5. Repeat step 1-4 three times. 6. Repeat step 1. 7. Push the stopper in the syringe until it touches the marshmallow. 8. Repeat step 3. 9. Pull the stopper outwards to expand whilst measuring the change in volume of the marshmallow. 10. Repeat step 6-9 three times.
Results:
Discussion: The results reveal that when pressure is increased the volume had an average decrease of 1.67mL, which agrees with the hypothesis that when pressure increases volume decreases. When pressure decreased the volume had an average increase of 1.33mL, which agrees with the hypothesis that when pressure increases volume decreases. The results were reliable as the experiment was repeated three times and the measurements were consistent with no outliers. However, there was a small sample size and could be compared with other results to see a consistency in a larger scale of results. This could be improved by sharing results with the class and combining the results to ensure that the results were consistent throughout the entire class.
Identify Rating Minimisation
Powder from the marshmallow can cause harm to the eye.
Low Wear safety glasses throughout the experiment.
Change in volume as pressure increases (mL) (2d.p.)
Change in volume as pressure decreases (mL) (2.d.p.)
1 +2 -2
2 +2 -1
3 +1 -1
Average +1.67 -1.33

The experiment was not accurate as the results were not measured to at least three decimal places, which is the minimum measurement to be considered accurate and close to the actual value. To make the recording of measurements more accurate, the use of digital technology to record the change in volume of the marshmallows would make the experiment more accurate, as it can record values to at least three decimal places. The experiment was reliable as the same marshmallows were used, the marshmallows were placed in the same position in the beaker, the same syringe was used. All these variables were kept controlled throughout the experiment. The change in pressure of the syringe was the only independent variable while the change in volume of the syringe was the only dependent variable. Thus, the experiment was valid overall.
· Evaluate the limitations of the technologies used Using an analogue syringe for the experiment does not display accurate measurements of volume such that the measured value is not close to the real value. The measured values can differ by half of the smallest unit marked on the scale of the syringe.
· Investigate the range of measuring devices used in the practical investigation and assess the likelihood of random and systematic errors and the devices' degree of accuracy
Syringes have a chance of having random errors by the tiredness of the people working. This random error can be minimised by taking the average of a large number of readings. The syringe can experience systematic errors: instrumental errors, environmental errors and observational errors. This can be fixed by re-calibrating it. External conditions such as pressure will affect the measurement given by the syringe. This can be improved by testing the conditions before the experiment. Incorrect readings may occur due to errors such as parallax errors. Read the measurements at eye level and get more than one person to read the measurement to verify the values.
· Using specific examples, compare the accuracy of analogue and digital technologies in making observations
Digital syringes provide measurements to at least three decimal places, making the measurements close to the actual value unlike an analogue syringe that only displays the readings in units of mL.
· Assess the safety of technologies selected for the practical investigation by using chemical safety data and Work Health and Safety guidelines as appropriate
4.2 Technological and scientific development: a continuous cycle
Technological developments lead to advances in science, its theories and laws, and consequently
drives new developments and creates new needs in society.
e.g.: communications technology has advanced from simple verbal transmission of information to
necessity mobile phones.
Mobile phone applications then help us understand how the orbit of the planets may behave around
a blackhole.

Scientific knowledge helps to create mobile phones while content accessed on mobile phones helps
us to understand scientific phenomena.
Impact of technologies on scientific understanding
• In the last few centuries, technology and science have been more interrelated, it has
become difficult to separate the impact that they exert on each other
• Development of technology drives the discovery of more evidence that consolidate scientific
progress
• E.g. X-ray crystallography techniques by Rosalind Franklin the structure of the
deoxyribonucleic acid (DNA) was finalised by James Watson and Francis Crick
• The creation of the Large Hadron Collider, the existence of Higgs boson sub-particles, which
was predicted by the Standard Model was consolidated
Scientific understanding and its impact on developing technologies
• Scientific understanding begins from observations of the environment around us.
• In today’s scientific models, theories and laws, those initial observations are measured and
tested until a clear answer about the phenomenon arises.
• Historically, scientific understanding was based on arguments and discussion.
• Now it drives the development of technologies to test and measure hypotheses or collect
new evidence to prove scientific principles.
• E.g.: Scientific knowledge in Newton’s laws about forces, acceleration, mass and inertia has
driven the creation of many technologies for buildings, aeronautics and the automotive and
engineering industries, e.g. for cars the seatbelt and the crumple zone.
A Continuous Cycle Inquiry question: How have developments in technology led to advances in scientific theories and laws that, in turn, drive the need for further developments in technology? 2.1 Using examples, assess [IC1] the impact that developments in technologies have had on the accumulation of evidence for scientific theories, laws and models, including but not limited to: - computerised simulations and models of the Earth’s geological history (1) - X-ray diffraction and the discovery of the structure of deoxyribonucleic acid (DNA) (2) - technology to detect radioactivity and the development of atomic theory (3) - the Hadron collider and discovery of the Higgs boson (4) Impacts of development and applications in technology · advances in science

· advances in principles, theories and laws · helps us understand the science behind world phenomena · drives the discovery of more evidence that consolidate scientific progress (1) Computerised simulations and models of the Earth’s geological history Prior scientific knowledge · Scientists were limited by their initial understanding that the majority of energy associated with plate tectonics is released when plates bend · They did not know that energy is released within the earth’s deep interior · They understood that Earth has plate tectonics because the conditions of the planet were just right, such as its size, temperature and moisture · Plates cover the entire Earth and cause the constant recycling of the Earth’s crust
o This provides a stable climate, mineral and oil deposits and oceans
with a life-sustaining balance of chemicals, making earth habitable · Plate tectonics is the movement of the plates atop a thick fluid mantle A detailed description of computerised simulations and a detailed description of how the computerised simulations is used · A computerised simulation is the use of a computer to represent the dynamic responses of one system by its model
o Computerised simulations use mathematical models of real systems
in the form of a computer program o The model is composed of equations that duplicate the functional
relationships within the real system o When running the program, the resulting mathematical dynamics
form a mechanism of the behaviour of the real system, with the results presented in the form of data
An in-depth description of the role of this technology in the development of a theory or law + A detailed description of how a theory or law was discovered + Explains how the evidence gathered by the use of a named technology led to the development of a theory or law · Computational scientists at Texas's Institute for Computational Engineering and Sciences used computer program to develop new computer algorithms that allow simultaneous modelling of Earth’s mantle flow, large-scale tectonic plate motions, and the behaviour of individual fault zones, to produce an unprecedented view of plate tectonics and the forces that drive it · Computational scientists developed a computational technique known as Adaptive Mesh Refinement (AMR) to create a new model · Partial differential equations (e.g. those describing mantle flow) are solved by subdividing the region of interest into a computational grid. AMR methods adaptively create finer resolution only where it's needed which leads to huge reductions in the number of grid points, making possible simulations that were previously out of reach.

· With the new algorithms, the scientists were able to simulate global mantle flow and how it manifests as plate tectonics and the motion of individual faults. The AMR algorithms reduced the size of the simulations by a factor of 5,000, permitting them to fit on fewer than 10,000 processors and run overnight on supercomputers. · Many natural processes display a multitude of phenomena on a wide range of scales e.g. on worldwide scale the movement of the surface tectonic plates is a manifestation of a giant heat engine, driven by the convection of the mantle below. The boundaries between the plates, however, are composed of many hundreds to thousands of individual faults, which together constitute active fault zones. The individual fault zones play a critical role in how the whole planet works and since the fault zones were simulated, so was plate movement. Thus, the dynamics of the whole planet was simulated · researchers were able to resolve the largest fault zones, creating a mesh with a resolution of about 1km near the plate boundaries. Included in the simulation were seismological data as well as data pertaining to the temperature of the rocks, their density, and their viscosity, which affects how easily they deform. That deformation is nonlinear -- with simple changes producing unexpected and complex effects. · If the system is too nonlinear, the earth becomes too mushy; if it's not nonlinear enough, plates won't move. · the model eventually returned an estimate of the motion of both large tectonic plates and smaller microplates -- including their speed and direction. The results were remarkably close to observed plate movements. · Investigators discovered that anomalous rapid motion of microplates emerged from the global simulations. In the western Pacific, there are rapid tectonic motions on Earth, in a process called 'trench rollback.' It was discovered that these small-scale tectonic motions emerged from the global models, opening a new frontier in geophysics. · Scientists thought that the majority of energy associated with plate tectonics in earthquake zones is released when plates bend, but the model reveals that much of the energy dissipation occurs in the earth's deep interior, which could not be seen on smaller scales. · Thus, computerised simulations led to modelling Earth’s geological history through plate tectonics Assess the impact the technology had on discovery · The computerised simulations and models of the earth’s geological history has made significant contribution to our understanding that in earthquake zones, energy loss occurs in the earth’s deep interior instead of when plate tectonics bend and how its geology has changed over time. Such knowledge is important to understand where the energy changes occur and to see the patterns and trends in Earth’s geology and identify relationships. + building in areas vulnerable to earthquakes
https://www.sciencedaily.com/releases/2010/08/100827092828.htm
https://www.businessinsider.com.au/plate-tectonics-key-to-life-on-earth-2014-4 https://ucalgary.ca/utoday/issue/2013-09-16/computer-simulation-sheds-light-how-earths-continents-were-born https://www.britannica.com/technology/computer-simulation https://www.nationalgeographic.org/encyclopedia/mantle/ https://www.newscientist.com/article/mg19926751-700-unknown-earth-why-does-earth-have-plate-tectonics/ (2) X-ray diffraction and the discovery of the structure of deoxyribonucleic acid (DNA) Prior scientific knowledge · Now called DNA, it is a molecule that was discovered within white blood cells in the 1860s by Johann Friedrich Miescher
o DNA is the molecular basis of all life
· 1944 Oswald Avery DNA was identified as the ‘transforming principle', as it transforms the properties of cells and is the carrier of hereditary information · It was discovered that DNA composition is species specific · However, many scientists continued to believe that DNA had a structure too uniform and simple to store genetic information for making complex living organisms 1950 Erwin Chargaff discovers that DNA composition is species specific A description of x-ray diffraction · X-ray diffraction is a technique used for determining the atomic and molecular structure of a crystal
o E.g. minerals, inorganic compounds
o A great technology for the research of the structure of DNA
· X-ray diffraction is a scattering of X-rays by the atoms of a crystal that produces an interference effect so that the diffraction pattern gives information on the structure of the crystal or the identity of a crystalline substance A description of how x-ray diffraction is used · The technique of single-crystal X-ray crystallography has three steps · The first step is to obtain an adequate crystal of the material under study
o The crystal should be sufficiently large, pure in composition and
regular in structure, with no significant internal imperfections such as cracks or twinning.
· In the second step, the crystal is placed in an intense beam of monochromatic X-rays usually (of a single wavelength), producing the regular pattern of reflections
o The angles and intensities of diffracted X-rays are measured, with
each compound having a unique diffraction pattern o As the crystal is gradually rotated, previous reflections disappear and
new ones appear; the intensity of every spot is recorded at every orientation of the crystal
o Multiple data sets may have to be collected, with each set covering
slightly more than half a full rotation of the crystal and typically containing tens of thousands of reflections
· Thirdly, these data are combined computationally with complementary chemical information to produce and refine a model of the arrangement of atoms within the crystal
o The final, refined model of the atomic arrangement—now called a
crystal structure—is usually stored in a public database An in-depth description of the role of this technology in the development of a theory or law + A detailed description of how theory or law was discovered + Explains how the evidence gathered by the use of a named technology led to the development of a theory or law · Rosalind Franklin photographed crystallised DNA fibres and made use of X-ray crystallography techniques
o Franklin conducted a large portion of the research which eventually
led to the understanding of the structure of DNA · Rosalind Franklin and Maurice Wilkins obtained high-resolution X-ray images of DNA fibres that suggested a helical, corkscrew-like shape
o Wilkins had pioneered the method of model building in chemistry by
which Watson and Crick were to uncover the structure of DNA · Crick and Watson recognised at an early stage of their careers that gaining detailed knowledge of the three-dimensional model of the configuration of the gene was the central problem in molecular biology
o Drew on the experimental results of other scientists
o Took advantage of their complementary Crick’s scientific
backgrounds in physics and X-ray crystallography and Watson’s knowledge of viral and bacterial genetics
o Incorporated all the evidence they could gather together
§ E.g. Franklin’s X-ray photographs · The double helix structure of deoxyribonucleic acid was discovered and finalised in 1953 by James Watson and Francis Crick DNA is a molecule composed of 2 chains of polynucleotides (composed of monomeric necleotides) that coil around each other to form a double helix carrying the genetic instructions used in the growth, development, functioning, and reproduction of all known organisms and many viruses. Assess the impact the technology had on discovery · The X-ray diffraction technology has made significant contribution to our understanding and discovery of the structure of DNA. Knowing the structure is important because it led us to applying the knowledge in areas such as genetic diseases, cancer, immune systems and crime
o It has allowed scientists to make accurate predictions about diseases
and how they will affect individuals based on their genetic profiles

o This leads to DNA fingerprinting in the area of forensic science to
verify the identity of people and assist in crime cases o Mortality rates were increased
· Cloning · 3d printing body parts · Creating agricultural products resistant to drought, pests · Creating better tasting meat · genetic engineering to bioinformatics, which has greatly improved society. https://profiles.nlm.nih.gov/SC/Views/Exhibit/narrative/doublehelix.html https://www.yourgenome.org/stories/the-discovery-of-dna https://www.dna-worldwide.com/resource/160/history-dna-timeline#3 https://www.rigaku.com/en/techniques/xrd https://www.sciencehistory.org/historical-profile/james-watson-francis-crick-maurice-wilkins-and-rosalind-franklin https://profiles.nlm.nih.gov/SC/Views/Exhibit/narrative/doublehelix.html http://www.exploredna.co.uk/learn-about-dna-structure.html https://www.ruppweb.org/Xray/xrayequipment.htm (3) Technology to detect radioactivity and the development of atomic theory Prior scientific knowledge · The idea of the atom was first suggested by Democritus in the fourth century BC
o However, his suppositions were not useful in explaining chemical
phenomena, because there was no experimental evidence to support them
· In the late 1700’s early chemists began to explain chemical behaviour in terms of the atom · Joseph Priestly (experiments with air), Antoine Lavoisier (role of oxygen in combustion, identifying oxygen and hydrogen) , and others allowed the foundation of chemistry to be established
o They demonstrated that substances could combine to form new
materials · Radioactivity is the act of emitting radiation spontaneously
o An atomic nucleus that is unstable gives up some energy in order to
shift to a more stable configuration · Radioactive decay is a spontaneous process in which the unstable nucleus emits its excess energy in the form of radiation. You can say that the unstable nucleus of an atom 'disintegrates' in a controlled fashion. Radioactivity is measured in the number of disintegrations per second Radioactivity (nuclear radiation) refers to processes whereby unstable atomic nuclei becomes more stable by emitting energetic particles or electromagnetic radiation.

o This can be done with instruments designed to detect the particular
type of radiation emitted with each decay or disintegration o The SI unit for measuring the rate of 1 disintegration per second is
becquerel (Bq) o Alpha decay or α-decay is a type of radioactive decay in which an
atomic nucleus emits an alpha particle and thereby transforms or 'decays' into a different atomic nucleus, with a mass number that is reduced by four and an atomic number that is reduced by two.
helium nuclei, +2e charge, low penetration, high ionising o Beta decay is a type of radioactive decay in which a beta particle is
emitted from an atomic nucleus. electron/positron, -1, medium ionising and penetrating power
o Gamma decay, type of radioactivity in which some unstable atomic
nuclei dissipate excess energy by a spontaneous electromagnetic process.
no charge, highly energetic, low ionising, high penetrating A detailed description of x-rays and pitchblende used to detect radioactivity + A detailed description of how x-rays were used to detect radioactivity · In the late 17th century, a method was used such that black paper and florescent salts surrounded several photographic plates to study the properties of x-rays
o The fluorescence that some materials produce was used
o The concealed photographic paper was placed in the sunlight and was
observed to see what transpired § The salt was expected to absorb the sun’s energy and then emit
it as x-rays o The photographic paper was developed, expecting only a light imprint
from the salts o Instead, the salts left very distinct outlines in the photographic paper
suggesting that the salts, regardless of lacking an energy source, continually fluoresced
§ The images were strong and clear, proving that elements such as uranium emitted radiation without an external source of energy such as the sun
o This led to the discovery of elements such as polonium and radium
which are radioactive · After that, a gold foil experiment was performed by Ernest Rutherford bombarding a piece of gold foil with alpha particles
o It was noted that although most of the particles went straight through
the foil, one in every eight thousand was some deflected back o Thus, it was concluded that though an atom consists of mostly empty
space, most of its mass is concentrated in a very small positively

charged region known as the nucleus, while electrons move around on the outside
o It was also able to be observed that radioactive elements underwent a
process of decay over time which varied from element to element o Alpha particles were used to change/transmutate oxygen into
another element § At the time this was called splitting the atom
· The properties of x-rays led to the discovery of radioactivity which led to the discovery of radioactive elements and led to the understanding of the transmutation and the splitting of the atom An in-depth description of the role of the technology in the development of atomic theory + A description of how atomic theory was discovered Explains how the evidence gathered by the use of a named technology led to the development of atomic theory · In 1903, English chemist, John Dalton used the evidence and prior knowledge as a foundation to develop an atomic theory · Dalton’s atomic theory contains five basic assumptions:
o All matter consists of tiny particles called atoms
o Atoms are indestructible and unchangeable i.e. cannot be created,
destroyed, divided into smaller pieces, or transformed into atoms of another element. Dalton based his hypothesis on the law of conservation of mass as stated by Antoine Lavoisier and others around 1785.
o Elements are characterised by the weight of their atoms
o In chemical reactions, atoms combine in small, whole-number ratios.
Experiments that Dalton and others performed indicated that chemical reactions proceed according to atom to atom ratios which were precise and well-defined
o When elements react, their atoms may combine in more than one
whole-number ratio. Dalton used this assumption to explain why the ratios of two elements in various compounds, such as oxygen and nitrogen in nitrogen oxides, differed by multiples of each other
· John Dalton’s atomic theory was generally accepted because it explained the laws of conservation of mass, definite proportions, multiple proportions, and other observations · Although exceptions to Dalton’s theory are now known, his theory has endured reasonably well, with modifications, throughout the years Assess the impact the technology had on discovery · The technology to detect radioactivity has made significant contribution to our understanding of the atomic theory that has developed from the discovery. This understanding was important because it has been applied to the creation nuclear
power plants that supply nuclear energy for the world. Thus, the energy is more cost-efficient with the rise of gas prices across the world. · Pros
o Societal
§ Radioactivity is used in smoke detectors, containing Americium-241 in oxide form
- The element emits alpha particles and very low energy gamma rays
- The alpha rays are absorbed in the detector, while non-harmful gamma rays are able to escape
- When smoke enters the chamber of the smoke detector the absorption disrupts the state of ionisation in the chamber
- Thus, the electrical current is turned off, which sets off the alarm
o Industrial
§ Nuclear power plants have been produced to supply nuclear energy for the world’s power
- This is more cost efficient with the rise in gas prices across the world
§ Large scale gamma radiation exposure is used to sterilise disposable medical supplies such as syringes, gloves and other instruments that would be damaged by heat sterilisation
- It also used for killing parasites found in widely distributed products such as wool and wood
- It is now a commonly used food sterilisation method for food such as meat
§ Small scale gamma radiation is also used for blood transfusions and other medical sterilisation procedures
o Research/Medicine
§ Radioisotopes are used as tracers in medical research - People ingest these isotopes which allow researchers
to study processes like digestion and locate medical problems like cancers and obstructions within an individual’s digestive tract
· Cons o The continued use of radiation caused the damaging effects of
radiation exposure o Nuclear energy must be kept constantly regulated and is extremely
hard to dispose of as the waste can cause contaminations which lasts for many years and destroys natural resources

o War
§ Nuclear weapons and warfare § Incredible destruction could be harnessed from the radioactive
elements such as in nuclear warfare e.g. the Hiroshima bombing
§ Those within blast zones were instantly killed § Radiation poisoning, which also leads to birth defects because
of the effects of radioactive bombardment upon DNA https://ehss.energy.gov/ohre/roadmap/achre/intro_9_2.html http://www.geol-amu.org/notes/b8-3-5.htm http://www.abcte.org/files/previews/chemistry/s1_p2.html https://books.google.com.au/books?hl=en&lr=&id=S5vsCAAAQBAJ&oi=fnd&pg=PA1&dq=technology+to+detect+radioactivity+and+the+development+of+atomic+theory&ots=pCEfTWJMCk&sig=5v-RYQN14WF_cYXuXu5crJ0OjrE#v=onepage&q=detect%20radioactivity&f=true https://books.google.com.au/books?hl=en&lr=&id=bxPgBAAAQBAJ&oi=fnd&pg=PP1&dq=technology+to+detect+radioactivity+and+the+development+of+atomic+theory&ots=6ugJSQhFGY&sig=xwv3c51701DRn1VcynPlinUPu5I#v=snippet&q=detect%20radioactivity&f=true http://large.stanford.edu/courses/2016/ph241/caballero2/ https://chem.libretexts.org/Bookshelves/Physical_and_Theoretical_Chemistry_Textbook_Maps/Supplemental_Modules_(Physical_and_Theoretical_Chemistry)/Nuclear_Chemistry/Radioactivity/Discovery_of_Radioactivity (4) The Hadron collider and discovery of the Higgs boson Prior knowledge · Elementary particles gain their mass from a fundamental field associated with the Higgs boson · In the 1970s, physicists realised that there are very close ties between two of the four fundamental forces – the weak force and the electromagnetic force
o The two forces can be described within the same theory, which forms
the basis of the Standard Model o This “unification” implies that electricity, magnetism, light and some
types of radioactivity are all manifestations of a single underlying
force known as the electroweak force
· The basic equations of the unified theory correctly describe the electroweak
force and its associated force-carrying particles, namely the photon, and the W and
Z bosons, except for a major glitch
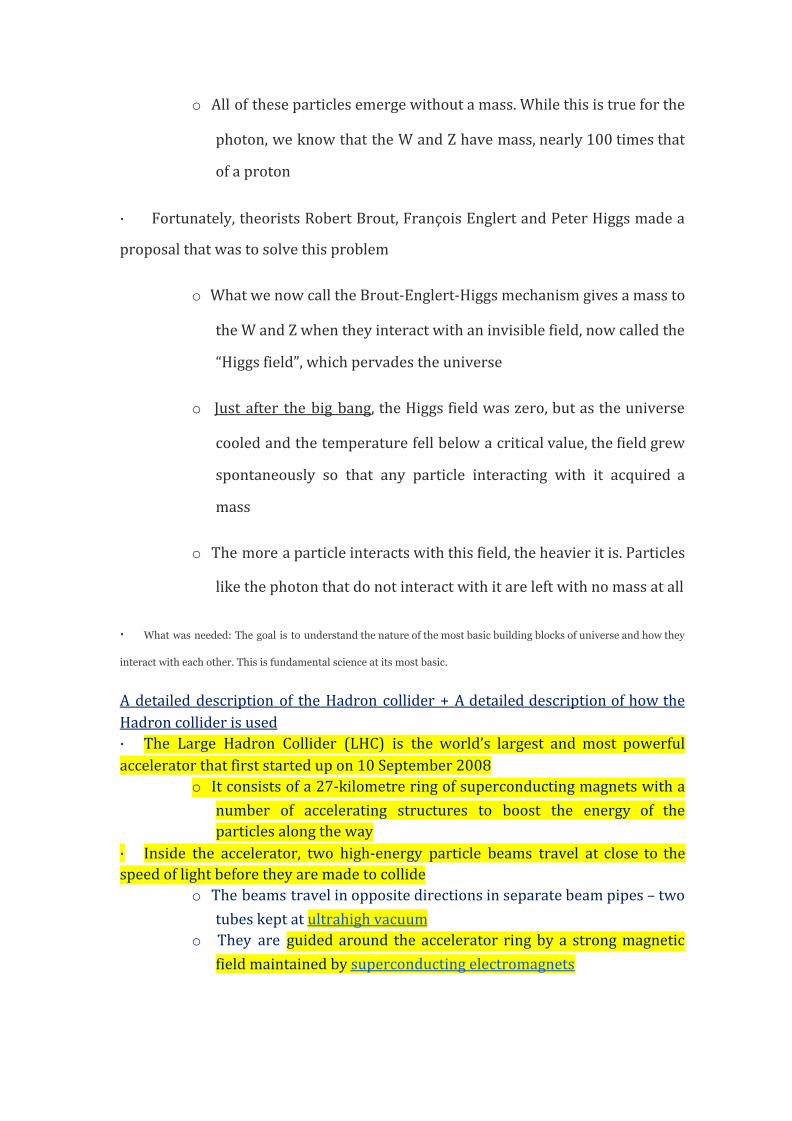
o All of these particles emerge without a mass. While this is true for the
photon, we know that the W and Z have mass, nearly 100 times that
of a proton
· Fortunately, theorists Robert Brout, François Englert and Peter Higgs made a
proposal that was to solve this problem
o What we now call the Brout-Englert-Higgs mechanism gives a mass to
the W and Z when they interact with an invisible field, now called the
“Higgs field”, which pervades the universe
o Just after the big bang, the Higgs field was zero, but as the universe
cooled and the temperature fell below a critical value, the field grew
spontaneously so that any particle interacting with it acquired a
mass
o The more a particle interacts with this field, the heavier it is. Particles
like the photon that do not interact with it are left with no mass at all
· What was needed: The goal is to understand the nature of the most basic building blocks of universe and how they
interact with each other. This is fundamental science at its most basic.
A detailed description of the Hadron collider + A detailed description of how the Hadron collider is used · The Large Hadron Collider (LHC) is the world’s largest and most powerful accelerator that first started up on 10 September 2008
o It consists of a 27-kilometre ring of superconducting magnets with a
number of accelerating structures to boost the energy of the particles along the way
· Inside the accelerator, two high-energy particle beams travel at close to the speed of light before they are made to collide
o The beams travel in opposite directions in separate beam pipes – two
tubes kept at ultrahigh vacuum o They are guided around the accelerator ring by a strong magnetic
field maintained by superconducting electromagnets

o The electromagnets are built from coils of special electric cable that
operates in a superconducting state, efficiently conducting electricity without resistance or loss of energy
o This requires chilling the magnets to ‑271.3°C – a temperature colder
than outer space o For this reason, much of the accelerator is connected to a distribution
system of liquid helium, which cools the magnets, as well as to other supply services.
· Thousands of magnets of different varieties and sizes are used to direct the beams around the accelerator
o These include 1232 dipole magnets 15 metres in length which bend
the beams, and 392 quadrupole magnets, each 5–7 metres long, which focus the beams
o Just prior to collision, another type of magnet is used to "squeeze" the
particles closer together to increase the chances of collisions o The particles are so tiny that the task of making them collide is akin to
firing two needles 10 kilometres apart with such precision that they meet halfway
· All the controls for the accelerator, its services and technical infrastructure are housed under one roof at the CERN Control Centre · From here, the beams inside the LHC are made to collide at four locations around the accelerator ring, corresponding to the positions of four particle detectors An in-depth description of the role of this technology in the development of a theory or law + A detailed description of how theory or law was discovered + Explains how the evidence gathered by the use of a named technology led to the development of a theory or law · Like all fundamental fields, the Higgs field has an associated particle – the Higgs
boson
o The Higgs boson is the visible manifestation of the Higgs field, rather
like a wave at the surface of the sea
o A problem for many years has been that no experiment has observed
the Higgs boson to confirm the theory

· On 4 July 2012, the ATLAS and CMS experiments at CERN's Large Hadron
Collider announced they had each observed a new particle in the mass region
around 125 GeV
o This particle is consistent with the Higgs boson but it will take further
work to determine whether or not it is the Higgs boson predicted by
the Standard Model
o The Higgs boson, as proposed within the Standard Model, is the
simplest manifestation of the Brout-Englert-Higgs mechanism
· Other types of Higgs bosons are predicted by other theories that go beyond the
Standard Model
o On 8 October 2013 the Nobel prize in physics was awarded jointly to
François Englert and Peter Higgs “for the theoretical discovery of a
mechanism that contributes to our understanding of the origin of
mass of subatomic particles, and which recently was confirmed
through the discovery of the predicted fundamental particle, by the
ATLAS and CMS experiments at CERN's Large Hadron Collider”.
Assesses the impact the Hadron Collider had on discovery
· The Higgs boson plays a special role in the standard model, which describes
how a dozen types of particles interact through three forces: electromagnetism
and the weak and strong nuclear forces
o The forces in the model arise from certain mathematical symmetries,
but that math works only so long as the particles do not start out
with mass
o So mass must somehow emerge through interactions among the
otherwise massless particles themselves.

· Higgs particle is the particle that gives all matter its mass
· This leads to further scientific understanding of matter that is used for
educational purposes and further research
· What was needed: The goal is to understand the nature of the most basic building blocks of universe and how they
interact with each other. This is fundamental science at its most basic.
· One of the discoveries made with the LHC includes the long sought-after Higgs boson, predicted in 1964 by
scientists working to combine theories of two of the fundamental forces of nature.
· The Higgs boson was the last remaining piece of the standard model of particle physics. This theory covers all of the
known fundamental particles – 17 of them – and three of the four forces through which they interact, although gravity is
not yet included. The standard model is an incredibly well-tested theory.
· we may require new theories of physics to explain such phenomena
· For example, studies of galaxies and other large-scale structures in the universe indicate that there is a lot more
matter out there than we observe. We call this dark matter since we can’t see it. The most common explanation to date is
that dark matter is made of an unknown particle. Physicists hope that the LHC may be able to produce the unknown
particle that makes dark matter and study it this mystery particle and study it. That would be an amazing discovery.
· The LHC continues to test the standard model of particle physics.
· the future goal of the LHC: to discover evidence of something we don’t understand. There are thousands of theories
that predict new physics that we have not observed. Which are right? We need a discovery to learn if any are correct.
·Top of Form
https://home.cern/science/physics/higgs-boson
https://home.cern/science/accelerators/large-hadron-collider
2.2 Using examples, assess the impact that developments in scientific theories, laws and models have had on the development of new technologies, including but not limited to: - the laws of refraction and reflection on the development of microscopes and telescopes - radioactivity and radioactive decay on the development of radiotherapy and nuclear bombs

- the discovery of the structure of DNA and the development of biotechnologies to genetically modify organisms - Newton’s laws and the technology required to build buildings capable of withstanding earthquakes The laws of refraction and reflection on the development of microscopes and telescopes State the scientific principle, model, theory or law · Law of reflection consists of three components: that the incident ray, the normal perpendicular to the surface and the reflected ray all lie in the same flat plane; the angle of incidence equals the angle of reflection equals the angle of reflection; and the law of reflection applies at each point on a surface · Law of refraction states that when a ray of light travels from one transparent medium into another, it changes direction. The amount of refraction is mainly related to differences in the electrical properties of each medium. The electromagnetic wave changes speed depending on how well the electromagnetic wave is permitted to move through the medium. Refraction is responsible for many optical effects. Explain the application of that knowledge in the development of technology
· The transparency of glass combined with the way in which light changes direction as it passes through one transparent medium to another, a phenomenon known as refraction, allows glass to be used for the purposes of
magnification o When two (or with poorer results, one) lenses are used an object seen through those lenses is magnified,
because the shape of the lenses causes light going through the lenses to converge at a particular focus or focal point in accordance with the laws of refraction
o This focal point is different from the normal human focal point and allows the object to be magnified
without blurring o The apparent size of an object increases as it is brought closer to the eye but if it is brought to close,
blurring occurs
o The blurring occurs because the lens in our eye cannot bend (or refract) light from an object enough to
bring it into proper focus on the retina if it is to close o The lenses magnify by starting the refraction or bending process before the light enters the eye
o This enables objects closer than the usual human focal point to be examined without losing focus
o This was to result in the invention of glasses to correct bad vision and in the invention of the telescope
and the microscope
· The particular shape of the lenses used in microscopes and telescopes can be worked out by using the law of refraction (known as Snel’s law after Willebrod Snel (1580-1626)) and trigonometry which was developed by the
mathematician Rheticus (1514-76) o An index of refraction establishes the angle at which light bends when going from one medium to another
o When light passes from air through glass the refractive index is approximately 1.52
o Armed with this knowledge it is possible to manufacture both microscopes and telescopes
o Alternatively, the earliest microscopes and telescopes may have been developed simply by experiment
and observation
Assess the impact scientific understanding has on technology · The earliest lenses produced were eye glasses to correct defective vision and these were first developed in 13th
century Italy o They were clearly developed from experimentation and observation without the benefit of Snel’s law or
trigonometry
o The earliest microscopes were invented by the Dutch spectacle makers Hans and Zacharus Janssen about
1590.
· The social and cultural consequences of the invention of the microscope was the discovery of whole new worlds · An immense variety of micro-organisms were discovered, the leading microscopist being Antoni van Leeuwenhoek
(1632-1723) + Robert Hooke

o Van Leeuwenhoek discovered protozoa in water, bacteria, blood corpuscles, capillaries, striations in
skeletal muscle, the structure of nerves and spermatozoa o The microscope was soon to destroy the idea of spontaneous generation which held that many animals
arose from spontaneous generation from particular environments
o Mosquitoes came from stagnant water, bees from the carcasses of oxen and cattle, shellfish from mud and
slime and snails from the putreification of fallen leaves
o The work of van Leeuwenhoek and others showing the life style and sexual apparatus of such animals
showed the idea of spontaneous generation was wrong, although it was not until the 19th century with the work of Louis Pasteur that the idea was finally put to an end
mid1600s Hooke looking at a piece of cork through scope, discovered many tiny rectangular
rooms and named them cells “small rooms” · Leeuwenhoek first person to see living cells. -> unicellular organisms through microscope from
plaque on teeth. These early discoveries paved the way for further investigation, eventually leading to the development of cell theory in the mid-1800s.
· The 17th and 18th century microscope had its thresholds so that while it could reveal certain things previously unknown, there was much it could not reveal
o This led to some theories that would not last due to more powerful microscopes proving them wrong that
o One such theory was that spermatozoa was the essential instrument of reproduction which fitted in with
the belief in the pre-existence of organisms o Each new organism was considered to contain all the characteristics of all its predecessors
o The spermatozoon was considered to be the means of transmission of all those characteristics to the new
organism o This idea however failed to understand the role of the spermatozoon in fertilizing the egg and the
contribution of the egg to the characteristics of the new organism o The idea however based on the information available to 17th and 18th century scientists was reasonable
enough for the times
o It was not until the 19th century when improved microscopes showed the spermatozoon and the egg
contributed equally to the characteristics of the new organism
· Microscopes of a certain power lead to certain information being available which lead to certain theories · Microscopes of a greater power would lead to additional information being provided which lead to different
theories
o The telescope appears to have been invented by Hans Lipperhey, a spectacle maker in the Dutch town of
Middelburg, who applied for a patent for it in 1608 o Two other Dutchmen, Jacob Adriaenzoon and Sacharias Janssen also claimed to have invented the
telescope, so a patent was refused o The Italian scientist Galileo heard about the Dutch invention and constructed his own telescope achieving
a magnification of 20x, a better magnification than was to be achieved until 1630 o Galileo’s telescope had two lenses, an objective lens at one end of the telescope and an ocular lens at the
other end to which the eye was applied
o The objective lens was a convergent or biconvex lens while the ocular lens was a divergent or biconcave
lens o The effect of light passing through the lenses was to change the focal point of the light providing for a
wider visual angle in which to view the object under observation o The telescope while operating a bit differently from a microscope, like the microscope, magnifies images
through manipulating the focal point of light to create a wider visual angle in accordance with the laws
of refraction o Galileo, having created his telescope used it to look at the sky
o He discovered a large number of previously unseen stars (the milky way), that the moon had an irregular
surface, the sun was spotty and impure (sunspots), that Jupiter had four moons, there were rings around Saturn and the moon like phases of Venus
o The observations were contrary to the astronometical theories of Ptolemy which had largely been
accepted from classical times o Galileo’s observations, plus those of other scientists using even better telescopes, were to result in the
ending of the Ptolemaic astronomy and its eventual replacement with the Newtonian system (geocentric to heliocentric model)
· Prior to the invention of the telescope six planets (the Earth itself, Mercury, Venus, Mars, Jupiter and Saturn) were
known to human beings and less than 5,000 stars were visible to the naked eye o The telescope lead to the discovery of Uranus in the 18th century, Neptune in the 19th century and Pluto
in the 20th century o The invention of photography assisted the telescope in revealing the universe as it allowed objects to dim
to be seen through a telescope to be photographed on a photographic plate over a long exposure time

o The long exposure time allowed the photographic plate to record the existence of very faint objects as the
plate will accumulate the effect of each photon hitting the plate over a period of time · By the start of the 20th century it had become clear that our solar system was part of the Milky Way but it was not
clear whether the Milky Way was the whole universe
o It was not until the 1920’s when Edwin Hubble conclusively showed there were other galaxies and these
galaxies were moving away from us with the furthest galaxies moving the fastest
o New forms of telescopes which detected different forms of electro-magnetic energy were developed
o However most electro-magnetic energy other than visible light and radio waves is blocked by the earth’s
atmosphere
o The development of space rockets led to telescopes being placed in space, particularly the Hubble space
telescope, to allow detection of electro-magnetic radiation in frequencies other than those of visible light and radio waves
o Telescopes, using frequencies other than those of visible light, have detected radio wave evidence of
planets in other solar systems, x-ray evidence of black holes, radio wave evidence of super nova explosions, and gamma ray and x–ray evidence of gamma rays originating from deepest space
· Dark matter that could not be detected by any telescope operating on any electro-magnetic wave length was detected due to its gravitational effect on matter that was visible to telescopes
o If the telescope could not have been invented, for example if light did not refract when passing from one
medium to another, then our view of the universe would have been quite different o It is possible we would have continued to believe, at least until the 20th century, that the sun and planets
orbited the Earth and the universe consisted only of those objects that could be seen with the naked eye o Ever since the invention of the telescope at the start of the 17th century, telescopes had increased in
power and the increasing power revealed different universes
o Telescopes in the 17th century confirmed the Newtonian universe with the planets orbiting the sun in
elliptical orbits while in the 20th century they showed the universe of General Relativity with planets orbiting the sun in circular orbits in curved space
· As with the microscope instruments of a certain power revealed certain information that lead to certain theories o Instruments of greater power lead to additional information being provided which lead to different
theories o The increasing power of microscopes and telescopes provided people with new information about for
example micro-organisms and the orbits of planets, in an inevitable order leading to certain rational
interpretations of the new information which produced theories using the new information o Given that humans are more or less rational beings, those theories followed inevitably from the
information nature has made available through increasingly powerful microscopes and telescopes
· The scientific understanding of the laws of refraction and reflection has enhanced the development of microscopes and telescopes which has improved the evidence of space including planets, stars and moons.
https://www.rochelleforrester.ac.nz/microscopes-and-telescopes.html Radioactivity and radioactivity decay on the development of radiotherapy and nuclear bombs State the scientific principle, model, theory or law
mentioned above · A radioactive atom is unstable because it contains extra energy, or an unbalanced number of particles, in its nucleus. When this atom ‘decays’ to a more stable atom, it releases the extra energy and/or particles as ionising radiation.
· Radioactive decay is a spontaneous process in which the unstable nucleus emits its excess energy in the form of radiation. You can say that the unstable nucleus of an atom 'disintegrates' in a controlled fashion. Radioactivity is measured in the number of disintegrations per second (Becquerel).
· Alpha decay or α-decay is a type of radioactive decay in which an atomic nucleus emits an alpha particle and thereby transforms or 'decays' into a different atomic nucleus, with a mass number that is reduced by four and an atomic number that is reduced by two.
· beta decay is a type of radioactive decay in which a beta particle is emitted from an atomic nucleus.
· Gamma decay, type of radioactivity in which some unstable atomic nuclei dissipate excess energy by a spontaneous electromagnetic process. In the most common form of gamma decay, known as gamma emission, gamma rays (photons, or packets of electromagnetic energy, of extremely short wavelength) are radiated.
· Radioactivity is the act of emitting radiation spontaneously o An atomic nucleus that is unstable gives up some energy in order to
shift to a more stable configuration

· Nuclear decay was fairly well understood by 1960 o Too many neutrons in a nucleus lead it to emit a beta particle, which
changes one of the neutrons into a proton o Too many protons in a nucleus lead it to emit a positron (positively
charged electron), changing a proton into a neutron o Too much energy leads a nucleus to emit an alpha particle, discarding
four heavy particles (two protons and two neutrons) · Radioactivity a physical, not biological, phenomenon · The radioactivity of a sample can be measured by counting how many atoms are spontaneously decaying each second
o This can be done with instruments designed to detect the particular
type of radiation emitted with each decay or disintegration o The actual number of disintegrations per second may be quite large
o The SI unit for measuring the rate of 1 disintegration per second is
becquerel (Bq) · Radioactive half-life is the time it takes for half of the atoms in a given mass to disintegrate Explain the application of that knowledge in the development of technology
· Most people will tell you Marie Curie discovered radiation, along with her husband and research partner Pierre. And that's right -- sort of. Curie actually discovered the element radium in 1898, an accomplishment that would make her the first female recipient of the Nobel Prize. However, three years earlier in 1895, a scientist named Wilhelm Röntgen first discovered X-rays (a form of electromagnetic radiation) and the phenomenon of radioactivity (a term later coined by Curie, based on the Latin word for "ray"). Soon after Röntgen's discovery, a French scientist named Henri Becquerel attempted to figure out where X-rays came from, and in the process found that uranium emitted a powerful "ray." Marie Curie based her doctoral research on Becquerel's findings, which led to her discovery of radium
· During early practical work and scientific investigation, experimenters noticed that prolonged exposure to x-rays created inflammation and, more rarely, tissue damage on the skin. The biological effect attracted the interest of Léopold Freund and Eduard Schiff, who, only a month or two after Röntgen's announcement,
suggested they be used in the treatment of disease.[7] At approximately the same time, Emil Grubbe, of Chicago was possibly the first American physician to use x-rays to treat cancer, beginning in 1896, began experimenting in Chicago with
medical uses of x-rays.[8] Escharotics by this time had already been used to treat skin malignancies through caustic burns, and electrotherapy had also been
experimented with, in the aim to stimulate the skin tissue.[citation needed]
· The first attempted x-ray treatment was by Victor Despeignes, a French physician who used them on a patient with stomach cancer. In 1896, he published a paper

with the results: a week-long treatment was followed by a diminution of pain and reduction in the size of the tumor, though the case was ultimately fatal. The results were inconclusive, because the patient was concurrently being given other treatments.[9]
Freund's first experiment was a tragic failure; he applied x-rays to a naevus in order to induce epilation and a deep ulcer resulted, which resisted further treatment by radiation. The first successful treatment was by Schiff, working with Freund, in a case of lupus vulgaris. A year later, in 1897, the two published a report of their
success and this provoked further experimentation in x-ray therapies.[10] Thereafter they did a successful treatment of lupus erythematosus in 1898. The lesion took a common form of a 'butterfly-patch' which appeared on both sides of the face, and
Schiff applied the irradiation to one side only, in order to compare the effects.[11]
· Within a few months, scientific journals were swamped with accounts of the successful treatment of different types of skin tissue malignancies with x-rays. In Sweden, Thor Stenbeck published results of the first successful treatments of rodent ulcer and epithelioma in 1899, later that year confirmed by Tage Sjögren.[12]
Soon afterwards, their findings were confirmed by a number of other physicians.[13]
· The nature of the active agent in therapeutic treatment was still unknown, and subject to wide dispute. Freund and Schiff believed it to because of electrical discharge, Nikola Tesla argued they were because of the ozone generated by the x-rays, while others argued that it was the x-rays themselves. Tesla's position was soon refuted, and only the other two theories remained. In 1900, Robert Kienböck produced a study based on a series of experiments that demonstrated that it was the x-rays themselves. Studies published in 1899 and 1900 suggested that the rays varied in penetration according to the degree of vacuum in the tube.
· When an atom of radioactive material splits into lighter atoms, there’s a sudden, powerful release of energy. The discovery of nuclear fission opened up the possibility of nuclear technologies, including weapons.
· Atomic bombs are weapons that get their explosive energy from fission reactions. Thermonuclear weapons, or hydrogen bombs, rely on a combination of nuclear fission and nuclear fusion. Nuclear fusion is another type of reaction in which two lighter atoms combine to release energy. Radio therapy is a process that uses the decay of an unstable isotope to irradiate and destroy the DNA of cancer cells. This process uses an isotope like cobalt-60 to produce Beta radiation which penetrates the body into the tumour. The ionising radiation breaks bonds in the DNA, killing the cancer Nuclear Bombs use either fission or a combination of fission and fusion reactions. Fission bombs place the radioactive element which is often uranium or plutonium at a critical state, creating a fission chain reaction that produces a huge amount of energy. Bombs that use fusion are first triggered by a fission reaction. This provides enough energy to fuse deuterium and tritium, releasing a huge amount of energy in a much smaller bomb. Developments in atomic theory and the discovery of radiation led to the development of the nuclear bomb and radiotherapy.

Assess the impact scientific understanding has on technology · The scientific knowlededge of radioactivity and radioactive decay has enhanced the development of radiotherapy and nuclear bombs which has improved the medical treatments and exacerbated the damage in warfare. https://ehss.energy.gov/ohre/roadmap/achre/intro_9_2.html http://www.geol-amu.org/notes/b8-3-5.htm http://www.abcte.org/files/previews/chemistry/s1_p2.html https://books.google.com.au/books?hl=en&lr=&id=S5vsCAAAQBAJ&oi=fnd&pg=PA1&dq=technology+to+detect+radioactivity+and+the+development+of+atomic+theory&ots=pCEfTWJMCk&sig=5v-RYQN14WF_cYXuXu5crJ0OjrE#v=onepage&q=detect%20radioactivity&f=true https://books.google.com.au/books?hl=en&lr=&id=bxPgBAAAQBAJ&oi=fnd&pg=PP1&dq=technology+to+detect+radioactivity+and+the+development+of+atomic+theory&ots=6ugJSQhFGY&sig=xwv3c51701DRn1VcynPlinUPu5I#v=snippet&q=detect%20radioactivity&f=true The discovery of the structure of DNA and the development of biotechnologies to genetically modify organisms State the scientific principle, model, theory or law · DNA was a molecule that was discovered in the 1860s by a Swiss physiological chemist, physician and biologist called Johann Friedrich Miescher
o DNA is the molecular basis of all life
o DNA was found within white blood cells
o Johann originally called DNA ‘nuclein’
· In 1944, Oswald Avery identifies DNA as the ‘transforming principle', as it transforms the properties of cells
o The substance is the carrier of hereditary information, in
pneumococcal bacteria · In 1950, Erwin Chargaff discovers that DNA composition is species specific · The double helix structure of the deoxyribonucleic acid (DNA) was finalised by James Watson and Francis Crick in 1953 Explain the application of that knowledge in the development of technology
· · X-ray diffraction is a scattering of X-rays by the atoms of a crystal that produces an interference effect so that the diffraction pattern gives information on the structure of the crystal or the identity of a crystalline substance (atomic, molecular) · Rosalind Franklin photographs crystallised DNA fibres o technique of X-ray crystallography o 1951 King’s College London she upgraded the X-ray crystallographic laboratory there for work with DNA · 1954, Maurice Wilkins studied DNA by X-ray crystallography techniques · Both obtained high-resolution X-ray images of DNA fibres that suggested a helical, corkscrew-like shape o Pioneered model building -> Watson and Crick uncover the structure of DNA ·1953 double helix structure of dna discovered by James Watson Francis Crick o complementary scientific backgrounds in physics and X-ray crystallography (Crick) and viral and bacterial genetics (Watson)
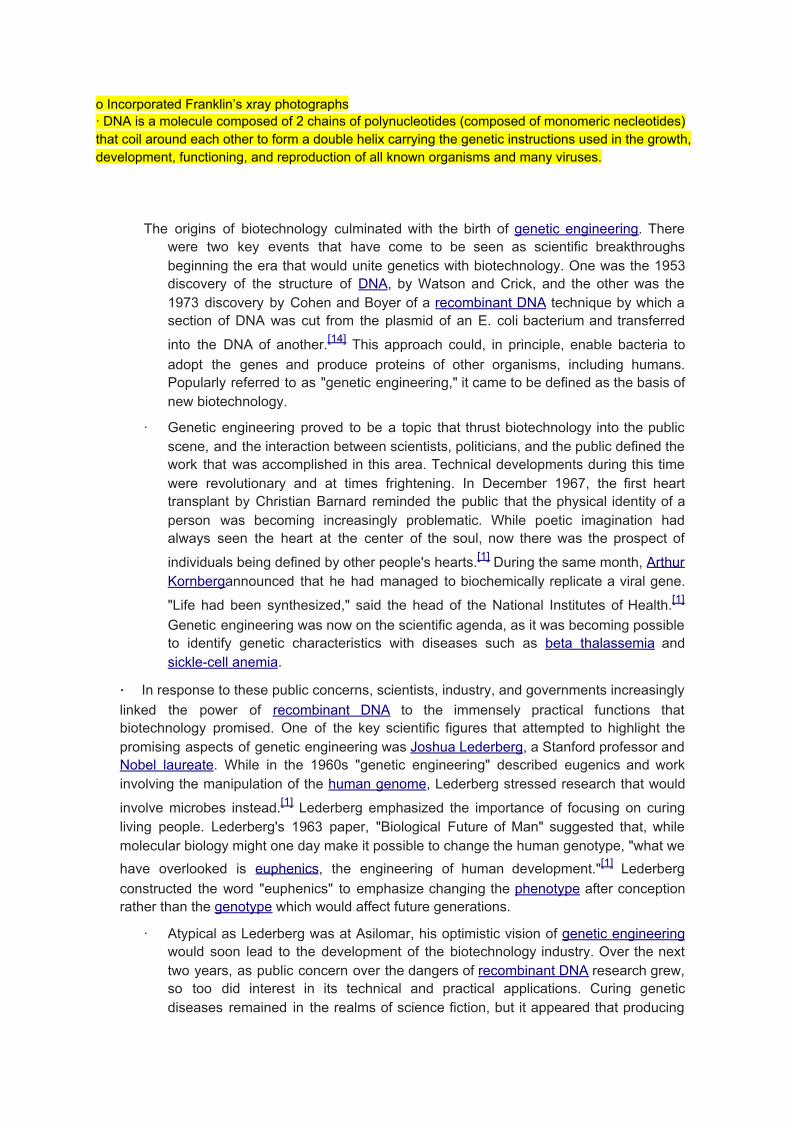
o Incorporated Franklin’s xray photographs · DNA is a molecule composed of 2 chains of polynucleotides (composed of monomeric necleotides) that coil around each other to form a double helix carrying the genetic instructions used in the growth, development, functioning, and reproduction of all known organisms and many viruses.
The origins of biotechnology culminated with the birth of genetic engineering. There were two key events that have come to be seen as scientific breakthroughs beginning the era that would unite genetics with biotechnology. One was the 1953 discovery of the structure of DNA, by Watson and Crick, and the other was the 1973 discovery by Cohen and Boyer of a recombinant DNA technique by which a section of DNA was cut from the plasmid of an E. coli bacterium and transferred
into the DNA of another.[14] This approach could, in principle, enable bacteria to adopt the genes and produce proteins of other organisms, including humans. Popularly referred to as "genetic engineering," it came to be defined as the basis of new biotechnology.
· Genetic engineering proved to be a topic that thrust biotechnology into the public scene, and the interaction between scientists, politicians, and the public defined the work that was accomplished in this area. Technical developments during this time were revolutionary and at times frightening. In December 1967, the first heart transplant by Christian Barnard reminded the public that the physical identity of a person was becoming increasingly problematic. While poetic imagination had always seen the heart at the center of the soul, now there was the prospect of
individuals being defined by other people's hearts.[1] During the same month, Arthur Kornbergannounced that he had managed to biochemically replicate a viral gene.
"Life had been synthesized," said the head of the National Institutes of Health.[1] Genetic engineering was now on the scientific agenda, as it was becoming possible to identify genetic characteristics with diseases such as beta thalassemia and sickle-cell anemia.
· In response to these public concerns, scientists, industry, and governments increasingly linked the power of recombinant DNA to the immensely practical functions that biotechnology promised. One of the key scientific figures that attempted to highlight the promising aspects of genetic engineering was Joshua Lederberg, a Stanford professor and Nobel laureate. While in the 1960s "genetic engineering" described eugenics and work involving the manipulation of the human genome, Lederberg stressed research that would
involve microbes instead.[1] Lederberg emphasized the importance of focusing on curing living people. Lederberg's 1963 paper, "Biological Future of Man" suggested that, while molecular biology might one day make it possible to change the human genotype, "what we have overlooked is euphenics, the engineering of human development."[1] Lederberg constructed the word "euphenics" to emphasize changing the phenotype after conception rather than the genotype which would affect future generations.
· Atypical as Lederberg was at Asilomar, his optimistic vision of genetic engineering would soon lead to the development of the biotechnology industry. Over the next two years, as public concern over the dangers of recombinant DNA research grew, so too did interest in its technical and practical applications. Curing genetic diseases remained in the realms of science fiction, but it appeared that producing

human simple proteins could be good business. Insulin, one of the smaller, best characterized and understood proteins, had been used in treating type 1 diabetes for a half century. It had been extracted from animals in a chemically slightly different form from the human product. Yet, if one could produce synthetic human insulin, one could meet an existing demand with a product whose approval would be relatively easy to obtain from regulators. In the period 1975 to 1977, synthetic "human" insulin represented the aspirations for new products that could be made with the new biotechnology. Microbial production of synthetic human insulin was finally announced in September 1978 and was produced by a startup company, Genentech.[15] Although that company did not commercialize the product themselves, instead, it licensed the production method to Eli Lilly and Company. 1978 also saw the first application for a patent on a gene, the gene which produces human growth hormone, by the University of California, thus introducing the legal principle that genes could be patented. Since that filing, almost 20% of the more
than 20,000 genes in the human DNA have been patented.[citation needed]
· The radical shift in the connotation of "genetic engineering" from an emphasis on the inherited characteristics of people to the commercial production of proteins and therapeutic drugs was nurtured by Joshua Lederberg. His broad concerns since the 1960s had been stimulated by enthusiasm for science and its potential medical benefits. Countering calls for strict regulation, he expressed a vision of potential utility. Against a belief that new techniques would entail unmentionable and uncontrollable consequences for humanity and the environment, a growing consensus on the economic value of recombinant DNA emerged.
Assess the impact scientific understanding has on technology · The scientific discovery of the structure of DNA has enhanced the development of biotechnologies to genetically modify organisms which has improved the medical treatments for people in society.
understanding the structure allowed scientists to apply this knowledge in areas: genetic diseases, cancer, immune systems and crime o allowed scientists accurate predictions about diseases and how they will affect individuals based on their genetic profiles o This leads to DNA fingerprinting in the area of forensic science to verify the identity of people and assist in crime cases o Mortality rates were increased · Cloning · 3d printing body parts · Creating agricultural products resistant to drought, pests · Creating better tasting meat genetic engineering to bioinformatics, which has greatly improved society.
https://profiles.nlm.nih.gov/SC/Views/Exhibit/narrative/doublehelix.html https://www.yourgenome.org/stories/the-discovery-of-dna https://www.dna-worldwide.com/resource/160/history-dna-timeline#3 https://www.rigaku.com/en/techniques/xrd https://www.sciencehistory.org/historical-profile/james-watson-francis-crick-maurice-wilkins-and-rosalind-franklin https://profiles.nlm.nih.gov/SC/Views/Exhibit/narrative/doublehelix.html
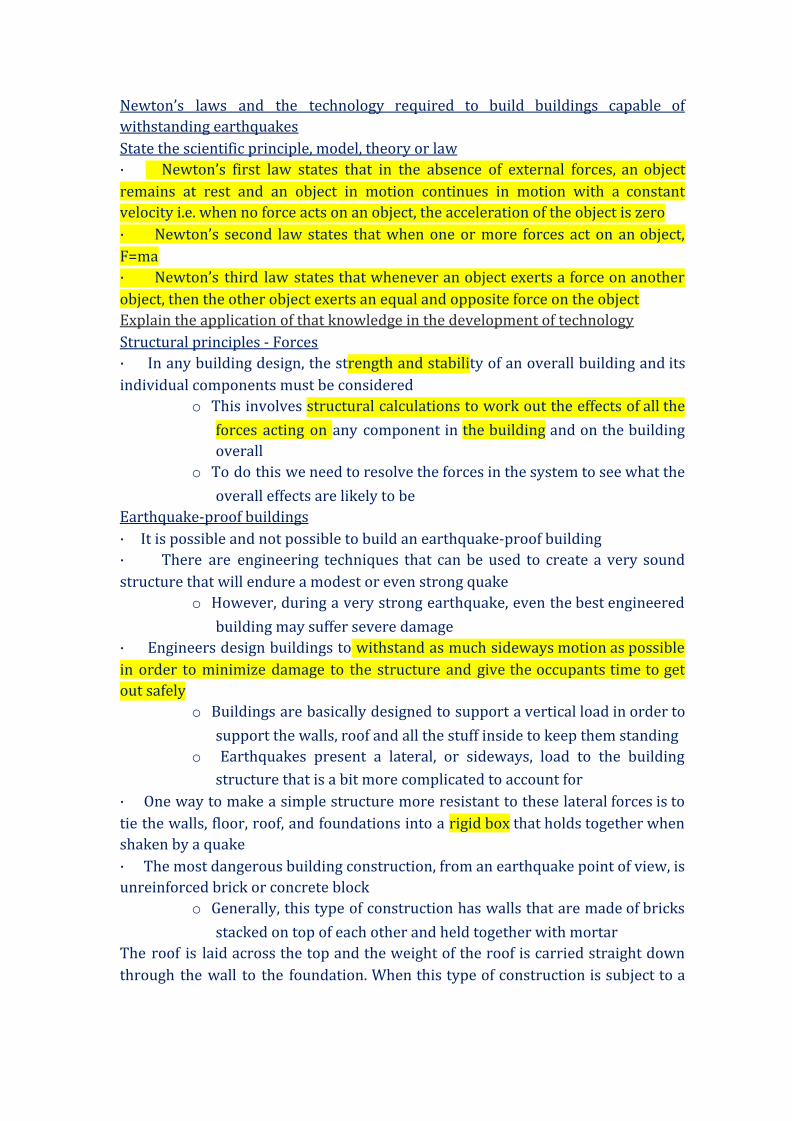
Newton’s laws and the technology required to build buildings capable of withstanding earthquakes State the scientific principle, model, theory or law · Newton’s first law states that in the absence of external forces, an object remains at rest and an object in motion continues in motion with a constant velocity i.e. when no force acts on an object, the acceleration of the object is zero · Newton’s second law states that when one or more forces act on an object, F=ma · Newton’s third law states that whenever an object exerts a force on another object, then the other object exerts an equal and opposite force on the object Explain the application of that knowledge in the development of technology Structural principles - Forces · In any building design, the strength and stability of an overall building and its individual components must be considered
o This involves structural calculations to work out the effects of all the
forces acting on any component in the building and on the building overall
o To do this we need to resolve the forces in the system to see what the
overall effects are likely to be Earthquake-proof buildings · It is possible and not possible to build an earthquake-proof building · There are engineering techniques that can be used to create a very sound structure that will endure a modest or even strong quake
o However, during a very strong earthquake, even the best engineered
building may suffer severe damage · Engineers design buildings to withstand as much sideways motion as possible in order to minimize damage to the structure and give the occupants time to get out safely
o Buildings are basically designed to support a vertical load in order to
support the walls, roof and all the stuff inside to keep them standing o Earthquakes present a lateral, or sideways, load to the building
structure that is a bit more complicated to account for · One way to make a simple structure more resistant to these lateral forces is to tie the walls, floor, roof, and foundations into a rigid box that holds together when shaken by a quake · The most dangerous building construction, from an earthquake point of view, is unreinforced brick or concrete block
o Generally, this type of construction has walls that are made of bricks
stacked on top of each other and held together with mortar The roof is laid across the top and the weight of the roof is carried straight down through the wall to the foundation. When this type of construction is subject to a

lateral force from an earthquake the walls tip over or crumble and the roof falls in like a house of cards. · Construction techniques can have a huge impact on the death toll from earthquakes
o An 8.8-magnitude earthquake in Chile in 2010 killed more than 700
people. On January 12, 2010, a less powerful earthquake, measuring 7.0, killed more than 200,000 in Haiti
o The difference in those death tolls comes from building construction
and technology o In Haiti, the buildings were constructed quickly and cheaply
o Chile, a richer and more industrialized nation, adheres to more
stringent building codes Skyscrapers · As the buildings get bigger and taller other techniques are employed such as “base isolation” · During the past 30 years, engineers have constructed skyscrapers that float on systems of ball bearings, springs and padded cylinders
o Acting like shock absorbers in a car, these systems allow the building
to be decoupled from the shaking of the ground · Buildings don’t sit directly on the ground, so they’re protected from some earthquake shocks
o In the event of a major earthquake, they can sway up to a few feet.
The buildings are surrounded by “moats,” or buffer zones, so they don’t swing into other structures
· Another technique to dampen the swaying of a tall building is to build in a large (several tons) mass that can sway at the top of the building in opposition to the building sway
o Known as “tuned mass dampers”, these devices can reduce the sway
of a building up to 30 to 40 percent o The Taipei 101, formerly known as the Taipei World Financial Center,
has just such a giant pendulum mounted between the 88th and 92nd floors
o Weighing in at 730 tons and capable of moving 5ft in any direction, it
takes the prize as the world’s largest and heaviest building damper o In fact, it is so heavy that it had to be constructed on site since it is too
heavy to be lifted by a crane Assess the impact scientific understanding has on technology · The scientific knowledge of Newton’s laws has enhanced the development of technology required to build buildings capable of withstanding earthquakes which has improved the safety for people, which saves many lives. https://www.dlsweb.rmit.edu.au/Toolbox/buildright/content/bcgbc4010a/02_force_systems/topic_index.htm

https://www.imaginationstationtoledo.org/educator/activities/can-you-build-an-earthquake-proof-building
Uses of native plants by Aboriginal and Torres Strait Islander people
• The use of plants for materials and medicinal purposes us as old as humankind as many
cultures used plants collected locally and through many years of trial and error, they have learned to
use these plants for medicines and materials.
• Aboriginal and Torres Strait Islander people have a broad knowledge of how to use native
plants for medicinal purposes.
• Modern Science has an increased awareness of the value of Aboriginal and Torres Strait
Islanders’ knowledge and this is helping pharmacists and physicians to respond to the challenges in
modern medicine, such as antibiotic resistance and allergies due to synthetic drugs
• However, a lot of this information has been lost over the years since Indigenous culture were
passed through verbal communication, songs, dancing and ritual ceremonies.
Native plants and materials
• Native plants were used to construct shelters, make clothing, ropes, baskets, netting and
trapping equipment, digging sticks, cutting and chopping tools, hunting and fighting equipment,
equipment to prepare food and in paints
• Plants were resistant to wear and many of the constructions, tools, utensils and pieces of art
made thousands of years ago are still intact
• Aboriginal people were innovative in using waving technique to make utensils and bags.
• Some were knitted tightly to carry honey and others could collapse and expand making them
easier to transport
• Parts of many plnts provide fibre to
Native plants and medicine
• When someone becomes ill, they drink traditionally made infusions to treat upset stomachs
or body aches, and ointments and saps are placed on infected cuts and abrasions
• Bush medicines are collected and prepared from well-known local plants to cure the
ailments
• Some are commercially available e.g. tree tea oil (Melaleuca alternifolia) and eucalyptus oil
(Eucalyptus sp.)
• Some are not as common to western medicine such as Kakadu plum (Terminalia
ferdinandiana) and emu bush (Eremophila sp).
• There is a lot of crossover in the type of plants used by different Aboriginal communities
• The same plants could be used for different illnesses in different regions of Australia
• Due to the wide spread of the communities and nomad lifestyle across regions and the
availability of the plants depending on seasonal fluctuations and environmental conditions

• Wide range creates a challenge for modern medicine and pharmacologists in narrowing
down the research for a particular medicinal plant used to treat or cure a specific illness.
• E.g. lolly brush (Clerdendrum floribundum) leaves are crushed and boiled and the infusion
obtained is used as an antiseptic lotion to cure sore, itchy and scaly skin, while other aboriginal
groups drank the infusion as a tea to relieve headaches and server cases of diarrhoea
Bio harvesting native plants from Country and Place
• Plants must have a substance that is biologically active to be considered for medicinal
purposes.
• Pharmaceutical industry calls this the active ingredient - the substance/s present in a plant
that is biologically active, and it can be extracted for medicinal properties
• It can be difficult and sometimes expensive to extract active plant ingredients from
Australian plants that live in dry and extreme heat conditions and therefore cannot be used in the
modern pharmaceutical industry
• Modern medicine has researched many native Australian plants that contain active
ingredients e.g. the northern black wattle
o This plant has alkaloids that inhibit the growth of infectious bacteria such as Staphylococcus
aureus, Streptococcus pyogenes and Escherichia coli.
o Research was based on the traditional use of the plant leaves as antiseptic
• Bioharvesting – the activities involved in collecting living organisms from the natural
environment to be used as food or for medicinal purposes. Aboriginal people have done this for
hundreds of years
• Modern medicine is aware of benefits of bioharvesting native plants but if this occurs from
Country and Place there are ethical implications
• Many Country and Place areas are sacred (have significant meaning) to local Aboriginal
community
• Knowledge about the use of native plants as traditional medicines is considered as
Indigenous cultural and intellectual property.
• Nature of Australian climate and soil composition, many plants are slow to grow and difficult
to pollinate or find. Unsustainable bioharvesting of native plants affects the biodiversity and
ecological balance of natural native Australian environments.
• Pharmaceutical companies need to consult the local council, elders and Indigenous
communities to understand the spiritual and biological value of the area before bioharvesting from
Country and Place in an ethical way.


