

1
OSPAR CONVENTION FOR THE PROTECTION OF THE
MARINE ENVIRONMENT OF THE NORTH EAST ATLANTIC
COMPREHENSIVE PROCEDURE
MONDEGO ESTUARY - PORTUGAL
MARETEC
Instituto Superior Técnico – Pav. De Mecânica Avenida Rovisco Pais 1096 Lisboa
Tel: 218 417 397 – Fax: 218 417 398 – www.mohid.com
November 2007

Mondego Estuary (Portugal)
2
1 Summary
The Mondego River draining a 6700 km2 watershed is the main fresh water source of the estuary. The low
estuary downstream of the bifurcation of the two channels has a surface of 6.4 km2 and is about 7 km long.
In this area the estuary is divided into two channels by the Murraceira island. The northern channel is
hydrodynamically the most active, receiving most of the marine tidal water and most of the fresh water from
Mondego River. As a consequence high daily salinity fluctuations are registered and the residence time is
low (typically 2 days). The southern channel is saltier and has a longer residence time (9 days). It receives
some fresh water from the Mondego and the water from the Pranto River which discharge is controlled by a
sluice located 3 km upstream of the mouth. The anthropogenic pressure in the southern channel is lower than
in the northern channel but the first one is more vulnerable to environmental problems, due to its low depth,
restricted circulation and higher residence time.
The overall classification of the Mondego Estuary as a “potential problem area” regarding to eutrophication
resulted by a shift of species recorded in the 90’s when opportunistic macroalgae replaced the seagrass
Zostera noltii in a large area of the southern channel. The background concentrations required for the
implementation of the comprehensive procedure were obtained using the older consistent values measured in
the study area, since no alternative definition was found. The characterization of the actual situation refers to
the environmental conditions observed from 2003 to 2006, as result of a monitoring programme including 25
field stations, uniformly distributed along the estuary. The assessment also includes the evaluation of total
nitrogen and phosphorus riverine concentrations, winter DIN and DIP concentrations and summer DO and
chlorophyll a concentrations in the estuary. Macrophytes, including macroalgae, were considered region
specific and changes or kills in zoobenthos and algal toxins were also monitored.
The study is complemented with results obtained through a three-dimensional water modelling system
(www.mohid.com), simulating the actual environmental conditions in the estuary, considering ocean tide and
fresh water discharge forcing. Model results were annually averaged in each computing cell for comparing
with field data (e.g. salinity, chlorophyll a, DIN) which is too scarce for comparing on a time basis. Model
results are in good agreement with field data and were used for assessing the processes in the estuary on an
instantaneous basis, putting into evidence the most relevant trends. Classes were defined for assessing the
results and maps were produced showing the areas where concentrations of chlorophyll-a and DIN fall into
those classes. The model has shown that phytoplankton production in northern channel is directly influenced
by the Mondego River discharge which has a low residence time (2 days), too short to allow bloom’s
development inside the channel. In terms of nutrients, the concentration is higher in the northern channel but
eutrophication symptoms - green seaweeds Ulva spp. and Enteromorpha spp. growth - were detected in the
southern channel. The observed shifts of long-lived macrophytes species like seagrass Zostera noltii into
those nuisance opportunistic short-lived species were explained by the model as being mainly attributed to

Mondego Estuary (Portugal)
3
morphological modification of southern channel and not a consequence of anthropogenic nutrient
enrichment. The morphological modification of the southern channel – closure of the upstream
communication with the main channel - modified the hydrodynamics and the salinity distribution of this
channel creating better conditions for the development of macroalgae (INAG/MARETEC, 2002). Reopening
the communication between the channels in May 2006 recreated the previous conditions and should result
into a decrease of eutrophication symptoms (Lillebø et al., 2005). The monitoring program started in 2003 is
going on and data collected so far is supporting that forecast. The classification status of Mondego estuary as
a “Potential Problem Area” will remain unchanged up to the confirmation of the modelling results.
Areas for improvement of the assessment are:
a) improvement of background levels for DIN, by using a catchment river model (SWAT) to simulate
“pristine” conditions;
b) updating and improvement of the estuary background concentrations of nutrients during winter, mean and
maximum chlorophyll a values during the growing season, using the MOHID Modelling System.
c) maintain the monitoring programme to get more data after southern channel reopening.
Mondego Estuary (Portugal)
4
2 Introduction
As Contracting Party of the OSPAR Convention for the Protection of the Marine Environment of the North-
East Atlantic, Portuguese authorities adopted the OSPAR Strategy to Combat Eutrophication. OSPAR’s
objective with regard to eutrophication is “to combat eutrophication in the OSPAR maritime area, in order to
achieve and maintain a healthy marine environment where eutrophication does not occur” according to the
OSPAR Convention (1992) where the Contracting Parties agree to “take all possible steps to prevent and
eliminate pollution and to take the necessary measures to protect the maritime area against adverse effects of
human activities so as to safeguard human health and to conserve marine ecosystems and, when practicable,
restore marine areas which have been adversely affected”.
The defined strategy, in order to reach these ambitious objectives, consists, in a first stage, to classify the
maritime areas as a problem area, potential problem area or non-problem area following the Common
Procedure for the Identification of the Eutrophication Status of the Maritime Area. The Common Procedure
comprises two steps: Screening and Comprehensive Procedure. The screening procedure consists to identify
obvious non-problem areas with regard to eutrophication. In the second stage, the areas not identified as non-
problem areas, in the first, shall be subject to the Comprehensive Procedure.
Based on the Screening Procedure, the overall classification for the Portuguese coast is “non problem area”
regarding to eutrophication. Concerning the estuaries, in 2002 after the first application of the
Comprehensive Procedure, Tagus and Sado estuaries were classified as “non-problem areas”, while
Mondego estuary got the classification of “potential problem area”. The second application of the
Comprehensive Procedure concerns thus only the Mondego Estuary.
The first application of the Comprehensive Procedure in the Mondego Estuary revealed an important lack of
information concerning the environmental properties in the system. The assessment was based on measures
obtained between 1993 and 1997 in a particular area of the estuary – the south channel, which was
considered not enough to characterize the whole system. A numeric model was then used to complement the
assessment which results enable to conclude that eutrophication symptoms found in the southern channel
might be a consequence of its particulate hydrodynamic characteristics suggesting re-opening
communication as a mitigation action. The assessment conclusions included also the need of further studies
and investments in field data measurements. In 2003 a monitoring programme, covering the entire estuary
area with monthly samples in 25 field stations, was implemented and the amount of data obtained is now
considered consistent and long enough to update and improve the application of the Comprehensive
Procedure. The assessment present in this report refers to the environmental conditions observed from 2003
to 2006, when the communication between the two channels was very limited – through a section of only 1
Mondego Estuary (Portugal)
5
m2. This was considered as an intermediate mitigation action implemented in 1998, before the full re-
establishment of the communication between the two channels in May 2006.

Mondego Estuary (Portugal)
6
3 Description of the assessed area
The Mondego River draining a 6700 km2 watershed is the main fresh water source of Mondego estuary
located on west coast of Portugal at Figueira da Foz (Figure 1).
Latitude Longitude 40o 08’ 40’’ N 8o 52’ 20’’ W 40o 07’ 10’’ N 8o 47’ 40’’ W
Figure 1. Mondego Estuary.
The low estuary downstream of the bifurcation of the two channels has a surface of 6.4 km2 and is about 7
km long. In this area the estuary is divided into two channels by the Murraceira island. The northern channel
is deeper (5-10 m), while the southern is 2-4 m deep, making them hydrologically very different. The
northern channel is hydrodynamically the most active, receiving most of the marine tidal water and most of
the fresh water from Mondego River. As a consequence high daily salinity fluctuations are registered and
residence time is low (typically 2 days). The southern channel receives irregular water from the Pranto River,
regulated by a sluice located 3 km upstream of the mouth and it has longer residence time (9 days).
The anthropogenic pressure in the southern channel is lower than in the northern channel but the channel is
considered to be more vulnerable to environmental stress, due to its low depth, restricted circulation and
higher residence time. Table 1 shows some of the main physical properties of Mondego estuary.

Mondego Estuary (Portugal)
7
Table 1. Main physical properties of the Mondego Estuary. Parameter Value
Volume (average) 22x106 m3
Total Area (of the low estuary downstream of the bifurcation of the two cannels)
6.4 km2
Mondego River = 60 m3/s River Discharge (Average Value) Pranto River = 2.3 m3/s
Tidal Range (average spring tide) 0.35-3.3 m
Neighbouring 66 000 Inhabitants
North channel: 2 days Typical residence time South channel: 9 days

Mondego Estuary (Portugal)
8
4 Methods and data
The classification of the areas with regard to eutrophication was obtained appealing to actual and historical
observations, resulting from comparison between the actual conditions and background conditions. The
characterization of the actual situation in the estuary was based on the measurements from the monitoring
program implemented since 2003, sampling 25 monitoring stations, uniformly distributed along the estuary,
Figure 2. The samples are taken monthly, at high-tide, from surface and bottom waters. Physico-chemical
factors (temperature, salinity and dissolved oxygen) were measured in situ and water samples were collected
for subsequent quantification of dissolved nutrients concentrations – ammonia, nitrate, nitrite and
phosphorus – in laboratory (APHA, 1980; Strickland & Parsons, 1972), as described in Marques et al.
(2007). The concentration of chlorophyll a, following the method described by Strickland & Parsons (1972),
is used as a phytoplankton proxy (Marques et al., 2007).
Figure 2. Field Stations included in the Mondego Estuary Monitoring Programme, since 2003.
The assessment was based on the four categories of properties proposed by OSPAR, 2005 (N.º 2005-3):
Category I – Degree of Nutrient Enrichment
Category II – Direct Effects of Nutrients Enrichment;
Category III – Indirect Effects of Nutrient Enrichment;
Category V – Other possible effects of Nutrient Enrichment.
In each category the set of parameters proposed were analyzed and in most cases compared with the
background conditions in order to identify possible symptoms of eutrophic conditions. The concept of
background conditions, or reference conditions, aims to represent the conditions existing before remarkable
anthropogenic inputs. In this study, the background concentrations are considered to be the oldest consistent

Mondego Estuary (Portugal)
9
values measured in the study area, since no alternative definitions have been found. It’s important to notice
that there is a relevant lack of historic field data, thus becoming difficult the process of establishing a trend
of the system trophic evolution.
As a complement, the assessment includes some results obtained with MOHID, a three-dimensional water
modelling system, simulating the actual environmental conditions in the estuary, considering ocean tide and
fresh water discharge forcing (www.mohid.com). The model results are in good agreement with field data,
being able to show the most relevant trends (INAG/IMAR, 2004) of the environmental conditions in the
system. The model allows filling the information gapes and, above all, gives an insight of the system itself
enabling a process oriented study of the system evolution. The model produces a large amount of
information regarding both temporal and spatial distributions and thus it was essential to find a way to
compile this information and deliver it in a summarized form. Having this in mind, model results were time
(annual) averaged providing average values for computed water properties (e.g. salinity, phytoplankton,
DIN) in each domain cell. These results were then represented in spatial maps using the classes established
after the definition of the background concentrations. The purpose of these maps is to show that there are
significant concentration gradients that should be considered. More information about the implementation of
the model and assumptions can be found in the national reports INAG/MARETEC (2002) and INAG/IMAR
(2004 and 2005).
5 Eutrophication Assessment
The next tables present for each category and for each property, the results of the assessment proposed by
OSPAR, implemented in the Mondego Estuary.
Key to the Score
+ = Increased trends, elevated levels, shifts or changes in the respective assessment parameters
- = Neither increased trends nor elevated levels nor shifts nor changes in the respective assessment parameters
? = Not enough data to perform an assessment or the data available is not fit for the purpose

Mondego Estuary (Portugal)
10 OSPAR Commission EUC 08/2/5-E(L)
Category I – Degree of Nutrient Enrichment Assessment
Criteria Actual Situation1 Criteria of Classification Partial Classification Notes
1. Riverine Total N and/or Total P inputs and direct discharges (RID)
Nitrogen 4211
(ton N/year)
Phosphorus 227
(ton P/year)
Description: Based on monthly registers in stations near the rivers discharge, between 2003 and 2006 (43 field data points).
Mondego and Pranto River 3900 ton N/year 223 ton P/year
Domestic Load 311 ton N/year
4 ton P/year
+ + + + + After 1998 the values obtained for the Riverine Total Nitrogen input are higher than the years before. Differences in the location of stations and the sampling methodology can have some influence in the results. Since 1998 until 2006 the total nitrogen input had some oscillations with a small tendency for increase. In terms of phosphorus there is a significant oscillation of the values, although between 2003 and 2006 the values tend to be in the same order of magnitude.
Background Value2 Elevated Value3
2. Winter/Autumm DIN and/or DIP Concentration
50 µmol/l (average)
100 µmol/l
(Percentile90)
Description: Based on monthly registers in 23 stations located almost uniformly in the estuary, between 2003 and 2006 (479 data points in Winter/Autumm). 44 µmol/l 66 µmol/l
- - - - - Complementary information including annual average values and model results for the actual situation are reported in Section 7 (Additional Information).
3. Increased Winter /Autumm N/P ratio
60 (average)
151
(Percentile90)
Description: Based on monthly registers in 23 stations located almost uniformly in the entire estuary, between 2003 and 2006 (475 data points in Winter/Autumn).
? The actual N/P ratio values can not be compared with previous years because the data is not available. So even having values for the actual situation (2003, 2004, 2005 and 2006) this topic will not have a classification. It is however important to notice that the most part of the values are located above the Redfield ratio (black line), which may indicate phosphorus as the most important limiting nutrient in the estuary.
1 Actual Situation is obtained using values registered in 2003,2004, 2005 and 2006. 2 Assumed as the average value corresponding to 1993, the oldest registered data available. 3 Assumed as 50% above the background concentration.

Mondego Estuary (Portugal)
11 OSPAR Commission EUC 08/2/5-E(L)
Category II – Direct Effects Assessment Criteria Actual Situation4 Criteria of Classification Partial Classification Notes
Background Value5 Elevated Value6
1. Maximum and Mean Chlorophyll-a Concentration
7.4 µg/l
(average)
15.1 µg/l
(Percentile90)
Description:
Based on monthly registers in 23 stations located almost uniformly in the estuary, between 2003 and 2006 (486 data points in Spring/Summer).
6 µg/l 9 µg/l - - - - -
Complementary information including annual average values and model results for the actual situation are reported in Section 7 (Additional Information).
2. Region/Area Specific phytoplankton indicator species
Data Not Available ?
3. Macrophytes including macroalgae (region specific)
Description:
In Mondego estuary hard substrates extend along 60% of the total estuarine perimeter dominating the South channel and are primarily covered by the genera Enteromorpha, Fucus and Ulva. Soft substrates, which in the past were predominantly covered by the seagrass Zostera noltii and the saltmarsh species Spartina maritima, have being gradually replaced by the opportunistic green algae Enteromorpha, Ulva and the red seaweed Gracillaria verrucosa – these are classified as the main ephiphytes in the system. Regular Enteromorpha blooms have been observed, especially in the inner areas of the south channel (Ferreira et al., 2002). This trend apparently reversed from 1998, after the decrease in the freshwater discharge from the Pranto River sluice and the limited re-establishment of the communication between the two channels.
+
Changes in hydrodynamic regime of the southern channel have been implemented and some improvements have been observed, particularly in terms of fewer occurrences of macroalgal blooms. However, the evaluation of these actions impact in the system dynamics requires longer time series analysis. For this reason this topic should be maintain positive in this assessment. Look for complementary information in Section 7 (Additional Information).
4 Actual Situation is obtained using values registered in 2003,2004, 2005 and 2006. 5 Assumed as the average value corresponding to 1993, the oldest registered data available. 6 Assumed as 50% above the background concentration.

Mondego Estuary (Portugal)
12 OSPAR Commission EUC 08/2/5-E(L)
Category III and IV – Indirect Effects Assessment
Criteria Actual Situation7 Criteria of Classification Partial Classification Notes
1. Degree of oxygen deficiency
8.4 mgO2/l
(average)
6 mgO2/l
(Percentile90)
Description:
Based on monthly registers in 23 stations located almost uniformly in all the estuary, between 2003 and 2006 (541 data points in Spring/Summer).
2
2
2 mgO / l Acute toxicity2 6 mgO / l Deficiency< →⎧⎨ − →⎩
- - - - -
Complementary information including annual average values and model results for the actual situation are reported in Section 7 (Additional Information).
2. Changes/kills in Zoobenthos and fish mortality
Description:
No changes/kills in Zoobenthos and fish mortality have been reported in the literature. - - - - -
3. Organic Carbon/Organic Matter
3.4 mgPOC/l
(average)
4.9 mgPOC/l
(Percentile90)
Description:
Based on monthly registers in 23 stations located almost uniformly in the estuary, between 2003 and 2006 (673 data points).
? Measurements have been done in the recent years. The lack of historical data unable the classification of this topic, although the recent values obtained suggest some decrease.
4. Other Possible effects: algal toxins (DSP/PSP mussel infection events)
Description:
No nuisiance or toxic blooms have been reported in the literature. -
7 Actual Situation is obtained by the values registered in 2003,2004, 2005 and 2006.

Mondego Estuary (Portugal)
13 OSPAR Commission EUC 08/2/5-E(L)
6 Overall Classification
Key to the table NI Riverine inputs and direct discharges of total N and total P DI Winter DIN and/or DIP concentrations NP Increased winter N/P ratio Ca Maximum and mean chlorophyll a concentration Ps Area-specific phytoplankton indicator species
Mp Macrophytes including macroalgae O2 Oxygen deficiency Ck Changes/kills in zoobenthos and fish kills Oc Organic carbon/organic matter At Algal toxins (DSP/PSP mussel infection events)
+ = Increased trends, elevated levels, shifts or changes in the respective assessment parameters - = Neither increased trends nor elevated levels nor shifts nor changes in the respective assessment parameters ? = Not enough data to perform an assessment or the data available is not fit for the purpose Note: Categories I, II and/or III/IV are scored ‘+’ in cases where one or more of its respective assessment parameters is showing an increased trend, elevated levels, shifts or changes.
Area Category I
Degree of nutrient enrichment
Category II Direct effects
Category III and IV Indirect effects/
other possible effects
Initial classification
Appraisal of all relevant information (concerning the harmonised assessment parameters, their
respective assessment levels and the supporting environmental factors)
Final classification
Assessment period
NI + Ca - O2 - At -
DI - Ps ? Ck -
NP ? Mp + Oc ?
MONDEGO ESTUARY
Global + Global + Global -
Problem Area
Data and modelling confirms that the north channel is a non-problem area, mostly because of its short residence time. Local characteristics of the south channel are consequence of hydrodynamic conditions instead of nutrients overenrichment. Mitigation actions have been implemented and improvements in the environmental quality of the southern channel are expected.
Potential Problem
Area
2003-2006 (Actual
Situation)

Mondego Estuary (Portugal)
14 OSPAR Commission EUC 08/2/5-E(L)
7 Additional Information
7.1 DIN and Salinity Distribution
The next figures represent a time series evolution of dissolved inorganic nitrogen (DIN) and phosphate
concentrations measured in the Mondego estuary between 1993 and 1997 and also from 2003 to 2006. Each
year is represented by the average of all field data in the Winter/Autumn season (January, February,
September, October, November and December) and the values can be consulted in Table 2. The black line
represents the moving average of two years. The moving average enable to find a trend of evolution and even
with an obvious lack of measurements it is possible to assume no significant variation on the winter DIN and
Phosphate Concentration. The values of the last four years (2003, 2004, 2005 and 2006) were used to obtain
the average values of the actual situation. The oscillations between the different years could be explained by
different hydrological regimes, leading to differences in rivers flow.
Figure 3. Winter DIN Concentrations in Mondego Estuary.
Figure 4. Winter Phosphate Concentration in Mondego Estuary.
Table 2. Annual Average DIN Concentration [µmol/l] (Winter/Autumn) assessment.
Year 2003 2004 2005 2006

Mondego Estuary (Portugal)
15 OSPAR Commission EUC 08/2/5-E(L)
Average DIN Concentration (Winter/Autumn) 42 50 47 64
Elevated Value 66
Classification - - - -
Figure 5 and Figure 6 represent average spatial distribution of the DIN and Salinity computed by MOHID
Modelling System for 2003 in the Mondego estuary. Figure 5 establishes the areas in which DIN
concentrations are below the background value, between the background and the elevated level and the areas
where the concentration is above the elevated and Figure 6 shows the salinity distribution in each area. The
figures show clearly the existence of three different zones in the Mondego Estuary: seawater zone, mixing
zone and tidal fresh zone. The limits of these areas for DIN and salinity distributions are identical. Thus, it is
possible to say that, according to MOHID results, higher values of salinity correspond to areas of lower DIN
concentrations and the range of DIN concentration between the background value and the elevated value
correspond to the mixing area with salinity values that can range between 20 and 30. Thus, despite the
average value considered to apply the assessment criteria, it is important to note that the model results
evidence an important gradient of DIN concentrations in the estuary, characterize the actual situation with a
large range of values, between 0 and 90 µmol/l.
Figure 5. Spatial Average Distribution of DIN concentration [µmol/l] computed by the model for the actual situation in Mondego Estuary.

Mondego Estuary (Portugal)
16 OSPAR Commission EUC 08/2/5-E(L)
Figure 6. Spatial Average Distribution of Salinity computed by the model for the actual situation in Mondego Estuary.
Figure 7 represents the DIN vs. Salinity curve, based on field data registers. From the figure it is possible to
observe a higher cloud of points corresponding to high values of salinity and lower DIN concentration.
Looking at the high values of salinity it is possible to identify an irregular distribution of DIN concentrations
in the historical values, which can be related with the Pranto river discharge. The characteristics of the south
channel can change in a very significant way, if the sluice controlling the Pranto river is closed the salinity
increases, as a consequence of hydrodynamic conditions changes. The figure shows all the existing samples,
since it was not possible to distinguish the sluice state in the registers, which means that includes both
conditions.
Figure 7. DIN vs. Salinity in the Mondego Estuary: Historical and actual data.
7.2 Chlorophyll a Distribution
Table 3 show the assessment for Chlorophyll_a obtained for the years between 2003 and 2006.

Mondego Estuary (Portugal)
17 OSPAR Commission EUC 08/2/5-E(L)
Table 3. Annual Average Chlorophyll_a Concentration [µg/l] (Spring/Summer) assessment.
Year 2003 2004 2005 2006
Average Chlorophyll a Concentration (Spring/Summer) 6.9 5.7 8.7 7.4
Elevated Value 9
Classification - - - -
Figure 8 represent the average chlorophyll spatial distribution computed by the model for 2003, where it is
possible to conclude that the North Channel has concentrations below the elevated level while in the South
channel, the values can reach to 14 µg/L.
Figure 8. Spatial Average Distribution of Chlorophyll_a concentration [µg/l] computed by the model for the actual situation in Mondego
Estuary.
7.3 Oxygen Distribution
Figure 8 represents the annual average of oxygen spatial distribution in the estuary resulting form the model
simulation and Table 4 show the annual assessment obtained in this topic. Oxygen concentration between 8
and 9 mg/L are found in most estuary and higher values are found in the south channel, in concordance with
higher values of Chlorophyll-a.
Table 4. Annual Average Oxygen Concentration [mg/l] (Spring/Summer) assessment.
Year 2003 2004 2005 2006
Average Oxygen Concentration (Spring/Summer) 7.7 9.2 9.1 8.4
Deficiency Range 2-6

Mondego Estuary (Portugal)
18 OSPAR Commission EUC 08/2/5-E(L)
Classification - - - -
Figure 9. Spatial Average Distribution of Oxygen concentration [mg/l] computed by the model for the actual situation in Mondego Estuary.

Mondego Estuary (Portugal)
19 OSPAR Commission EUC 08/2/5-E(L)
8 Perspectives
8.1 Implemented and further planned measures
Since 2003 an extensive monitoring programme is monthly running in the Mondego Estuary, including 23
stations uniformly distributed inside the estuary and 2 stations located next to the main fresh water
discharges (Mondego and Pranto Rivers). The results from the monitoring programme have been an
important achieve during the last years, enabling the establishment of some conclusions about the system
behaviour.
The assessment presented in this report refers to the environmental conditions observed from 2003 to 2006,
when the communication between the two channels of the estuary was very limited, through a section of only
1 m2 (Lillebø et al., 2005). This situation can be considered as an intermediate mitigation action implemented
in 1998, including also the control of the Pranto River discharge by a sluice. The full re-establishment of the
communication between both channels was implemented in May 2006 and the evaluation of the system
response to this change can not be shown in this assessment, requiring at least two years of measurements in
the new conditions to allow a first conclusion about the impact of the action.
8.2 Outlook
(i) Expected trends
In the Mondego estuary, the limiting factor of phytoplankton production is the residence time (two days),
which is not long enough to allow the growing of a bloom. In this estuary the concentration of nutrients is
higher in the northern channel; however eutrophication symptoms are detected in the southern channel
(growth of macroalgae). This seems to be a consequence of the hydrodynamical properties of this channel.
Recent studies suggested the fully re-establishment of the communication between the two channels as an
important action to improve the environmental quality of the southern channel of the estuary. Recovering the
hydrodynamic conditions will (i) decrease the residence time of the water and (ii) increase the salinity range
in the southern channel. As a consequence, the occurrence of macroalgal blooms will be reduced and the
recovery of the area occupied by the seagrass meadows should be observed. Based on modelling results, data
analysis and the knowledge of the insight of the system itself, it is possible to say that an improvement in the
environmental quality in the southern channel of Mondego Estuary should be expected and some recent
studies have already identified some signal: (i) Zostera noltii is gradually recovering, both in biomass and
coverage (Leston et al., in press) and (ii) no further green macroalgal blooms were reported (Cardoso et al.,
2005; Lillebø et al., 2005).

Mondego Estuary (Portugal)
20 OSPAR Commission EUC 08/2/5-E(L)
(ii) Improvement of assessments
The concept of background conditions, or reference conditions, is the basis of the assessment and it aims to
represent the conditions existing before remarkable anthropogenic inputs. Due to the obvious lack of data
and knowledge to consistently support the determination of those conditions, in this study, the background
concentrations are considered to be the oldest consistent values measured in the study area, since no
alternative definitions have been found. The improvements of the assessment will necessary include the
development of new methodologies to determine the background concentrations in the estuary. The lack of
old field data, previous to the most important anthropogenic changes in the system, lead to the
implementation of alternative tools – numeric models – considered able to simulate properties evolution
under different environmental conditions. In the Mondego estuary effort will be made to improve the
estimation of Nitrogen and Phosphorus input from the basin to the estuary, using a catchment river model
(SWAT) to simulate “pristine” conditions. The results will than be used by a new simulation of the estuary
conditions using the MOHID Modelling System, which will compute the properties concentration expected
for the estuary in the “pristine” conditions.
The amount of field data measurements obtained by the monitoring programme implemented since 2003 was
an important achieve in the second application of the comprehensive procedure and the programme will be
maintained in order to evaluate the expected changes from the re-opening of the channels communication.
9 Conclusions
In the early 90’s the Mondego Estuary was object of important geomorphological modifications in order to
improve navigability and the upper communication between the two channels was closed. Artificial closing
of the upper connection between channels has stimulated the settling characteristics of the southern channel
and in late 90’s symptoms of eutrophication have been identified with a reduction of the area occupied by
Zostera noltii and an increase of the areas occupied by macroalgae, mainly Ulva spp. The causes of the
macroalgal blooms were apparently linked to the management of the Pranto sluice. When the sluice is
opened, high concentrations of nutrients are discharged to the southern channel, leading to organic
enrichment in the sediment. When the sluice is subsequently closed, the salinity increase and associated to
nutrient availability, is a trigger for seaweed blooms (INAG/MARETEC, 2002).
In 1998, a restoration programme was implemented to reverse this process and the communication between
both channels was re-established although still very limited, through a section of only 1 m2 (Lillebø et al.,
2005). This situation can be considered as an intermediate mitigation action which also included the control
of Pranto River discharge. After the first implementation of the comprehensive procedure, in 2002, when
Mondego Estuary was classified as “potential problem area”, a monitoring programme was implemented,
including 25 stations covering the whole estuary area. Results from the monitoring programme
complemented by modelling studies (INAG/IMAR, 2005; INAG/MARETEC, 2002) suggested that the fully

Mondego Estuary (Portugal)
21 OSPAR Commission EUC 08/2/5-E(L)
re-establishment of the communication between channels could reduce the occurrence of macroalgal blooms
in the southern channel by: (i) decreasing the residence time of the water and (ii) increasing the salinity
range. In May 2006 the communication between north and south channels was re-established, recreating the
previous conditions, and improvements in the trophic conditions of the southern channel have been already
detected: (i) Zostera noltii meadows are revealing an increasing tendency both in biomass and coverage and
(ii) green macroalgal blooms are showing a significant decrease in biomass (Leston et al., in press), which
confirms the effectiveness of the mitigation action. Although, a complete evaluation of the system response
to this change requires at least two years of measurements in the new conditions to allow a first conclusion
about the impact of the action. Thus, the classification status of Mondego estuary as a “Potential Problem
Area” will remain unchanged up to the confirmation of field data and modelling results.

Mondego Estuary (Portugal)
22 OSPAR Commission EUC 08/2/5-E(L)
References
APHA (American Public Health Association). 1980. Standart Methds for the Examination of Water and Wastwater. American Public
Health Association, American Water Works Association & Water Environment Federation (eds), 15th edition. Washington DC, 1134
p.
Cabeçadas, G., M. J. Brogueira, L. Cabeçadas, 2000 – Southern Portugal: The Tagus and Sado Estuaries, Seas at the Millennium: An
Environmental Evaluation. Elsevier Science Ltd.
Costa, M.J., J. Lino, L. Chaves, P. Oliveira, A. Rego, B. Quintela, S. Rodrigues, 2001 – Bases Metodológicas para a Análise da
Qualidade Ecológica em Rios e Estuários Portugueses (Quere).
Ferreira, J. G. ,T. Simas, K. Schifferegger, J. Lencart-Silva, 2002. Identification of Sensitive Areas and Vulnerable Zones in Four
Portuguese Estuaries, INAG/IMAR.
INAG/IMAR, 2004. Caracterização do Estuário do Mondego e Cenários de Gestão, Coimbra.
INAG/IMAR, 2005. Factores que determinam o desenvolvimento de macroalagas no braço Sul do Estuário do Mondego. Estudo de
sensibilidade à comunicação entre os dois braços na zona de montante.
INAG/IST, 2001. Limites de Jusante dos Estuários Portugueses.
INAG/MARETEC, 2002. Water Quality in Portuguese Estuaries: Mondego, Tejo and Sado.
Leston, S., Lillebø, A.I., Pardal, M.A. in press. The response of primary producer assemblages to mitigation measures to reduce
eutrophication in a temperate estuary, Estuarine, Coastal and Shelf Science (2007), doi: 10.1016/j.ecss.207.11.002.
Lillebø, A.I., Neto, J.M., Martins, I, Verdelhos, T., Leston, S., Cardoso, P.G., Ferreira, S.M., Marques, J.C., Pardal, M.A. 2005.
Management of a shallow temperate estuary to control eutrophication: the effect of hydrodynamics on the system nutrient loading.
Estuar Coast. Shelf Sci., 65: 697-707.
Marques, J.C., Neto, J.M. & Patrício, J. 2007. Preliminary assessment results regarding the effects of the re-opening of the
communication between the two arms of the Mondego estuary: Physico-Chemical Parameters. Progress Report, May 2007.
IMAR/INAG, 20 pp.
Oliveira, R.M., M.T.P. Coutinho, 1992 – Estado Trófico e Dinâmico das Zonas Superior, Média e Inferior do Estuário do Sado.
Relatórios Técnicos e Científicos, Nº59, INIP, 33pp.
OSPAR, 2005. OSPAR Common Procedure for the Identification of the Eutrophication Status of the OSPAR Maritime Area,
OSPAR Agreement 2005-3, Annex 5.
Strickland, J.D.H. & Parsons, T.R. 1972. A Practical Handbook of Seawater Analysis (2nd ed). Bulletin of Fisheries Research Board
of Canada, 167, 311 p.
OSPAR CONVENTION FOR THE PROTECTION OF THE
MARINE ENVIRONMENT OF THE NORTH EAST ATLANTIC
COMPREHENSIVE PROCEDURE
DATA AND INFORMATION USED IN THE NATIONAL ASSESSMENT
MONDEGO ESTUARY - PORTUGAL
MARETEC
Instituto Superior Técnico – Pav. De Mecânica Avenida Rovisco Pais 1096 Lisboa
Tel: 218 417 397 – Fax: 218 417 398 – www.mohid.com
May 2008
Mondego Estuary (Portugal)
2
OSPAR Comprehensive Procedure 2007
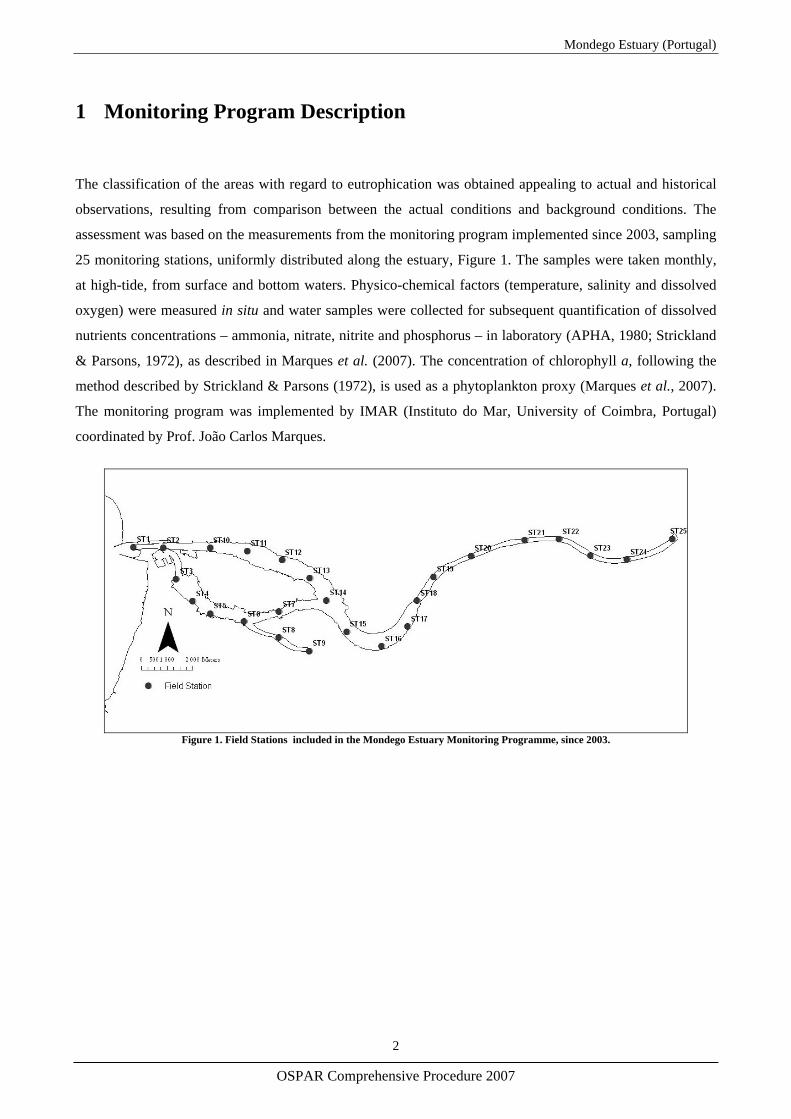
1 Monitoring Program Description
The classification of the areas with regard to eutrophication was obtained appealing to actual and historical
observations, resulting from comparison between the actual conditions and background conditions. The
assessment was based on the measurements from the monitoring program implemented since 2003, sampling
25 monitoring stations, uniformly distributed along the estuary, Figure 1. The samples were taken monthly,
at high-tide, from surface and bottom waters. Physico-chemical factors (temperature, salinity and dissolved
oxygen) were measured in situ and water samples were collected for subsequent quantification of dissolved
nutrients concentrations – ammonia, nitrate, nitrite and phosphorus – in laboratory (APHA, 1980; Strickland
& Parsons, 1972), as described in Marques et al. (2007). The concentration of chlorophyll a, following the
method described by Strickland & Parsons (1972), is used as a phytoplankton proxy (Marques et al., 2007).
The monitoring program was implemented by IMAR (Instituto do Mar, University of Coimbra, Portugal)
coordinated by Prof. João Carlos Marques.
Figure 1. Field Stations included in the Mondego Estuary Monitoring Programme, since 2003.
Mondego Estuary (Portugal)
3
OSPAR Comprehensive Procedure 2007
2 Fresh Water Discharge
The actual input from the fresh water discharges were obtained as the average of the field values obtained in
2003, 2004, 2004 and 2006 in Station ST9 (representing Pranto river discharge) and Station ST25 (Mondego
river discharge). Because no data on the discharges flow is available, average values for Mondego and
Pranto rivers were considered (60 m3/s and 2.3 m3/s, respectively). The average flow for Mondego river was
calculated from the monitoring stations Ponte de Stª Clara (Ref. 12G/04) and Açude de Coimbra (Ref.
PVR25), managed by the Portuguese Water Institute (INAG), which values can be found in
http://www.inag.pt/ .
3 Actual Conditions
The actual conditions in the estuary were obtained as an average of the values obtained in the monitoring
program between 2003 and 2006. All the stations were considered with exception of Station ST9 and ST25,
previously considered as representing the fresh water discharge to the estuary.
4 Background Conditions
The concept of background conditions, or reference conditions, aims to represent the conditions existing
before remarkable anthropogenic inputs. In the Mondego estuary there is a relevant lack of historic field
data, thus becoming difficult the process of establishing a trend of the system trophic evolution. The
historical data used in the assessment was obtained from BarcaWin2000 data base
(http://www.barcaweb.com/ ), where some field observations located in particular areas of the estuary
(mainly the south channel) can be found from 1993 to 2000. Although the data obtained was considered not
enough to characterize the whole system, since no alternative was found, the values obtained in 1993, the
oldest register available, were considered as background conditions.
5 Model data
The study is complemented with results obtained through a three-dimensional water modelling system
(www.mohid.com), simulating the actual environmental conditions in the estuary, considering ocean tide and
fresh water discharge forcing. Model results were annually averaged in each computing cell for comparing

Mondego Estuary (Portugal)
4
OSPAR Comprehensive Procedure 2007
with field data (e.g. salinity, chlorophyll a, DIN) which is too scarce for comparing on a time basis. The
model results are in good agreement with field data, being able to show the most relevant trends
(INAG/IMAR, 2004) of the environmental conditions in the system. The model allows filling the
information gapes and, above all, gives an insight of the system itself enabling a process oriented study of
the system evolution. More information about the implementation of the model and assumptions can be
found in the national reports INAG/MARETEC (2002) and INAG/IMAR (2004 and 2005).
References
APHA (American Public Health Association). 1980. Standard Methods for the Examination of Water and Wastewater. American
Public Health Association, American Water Works Association & Water Environment Federation (eds), 15th edition. Washington
DC, 1134 p.
INAG/IMAR, 2004. Caracterização do Estuário do Mondego e Cenários de Gestão, Coimbra.
INAG/IMAR, 2005. Factores que determinam o desenvolvimento de macroalagas no braço Sul do Estuário do Mondego. Estudo de
sensibilidade à comunicação entre os dois braços na zona de montante.
INAG/MARETEC, 2002. Water Quality in Portuguese Estuaries: Mondego, Tejo and Sado.
Marques, J.C., Neto, J.M. & Patrício, J. 2007. Preliminary assessment results regarding the effects of the re-opening of the
communication between the two arms of the Mondego estuary: Physico-Chemical Parameters. Progress Report, May 2007.
IMAR/INAG, 20 pp.
Strickland, J.D.H. & Parsons, T.R. 1972. A Practical Handbook of Seawater Analysis (2nd ed). Bulletin of Fisheries Research Board
of Canada, 167, 311 p.
http://www.inag.pt/
http://www.barcaweb.com/


