

1
Monitoring and Supervision of ICDS
A Concurrent Evaluation
Central Monitoring Unit
National Institute of Public Cooperation and Child Development
5, Siri Institutional Area, Hauz Khas, New Delhi – 110016

2
CONTENTS
S.No. Page No.
1 CHAPTER I 3-7
Introduction
2 CHAPTER II
Supervision and Monitoring of ICDS 8-15
3 CHAPTER III 16-67
Date Analysis and Results
4 CHAPTER IV 68-74
Conclusions & Suggestions

3
CHAPTER - I
INTRODUCTION
The most valuable asset of a nation is its children, therefore, the responsibility to invest in children
and their overall well being lies with the nation only.
The constitution of India itself provides a framework for care and protection of women and
children. Article 47 of the Directive Principles of State Policy States that “The state shall regard the raising
of the level of nutrition and the standard of living of its people and the improvement of public health as
among its primary duties and, in particular, the state shall endeavor to bring about prohibition of the
consumption except for medicinal purposes of intoxicating drinks and of drugs which are injurious to
health.”
Recognizing the need for early intervention to ensure the development of young child’s body, mind
and intellect to its maximum potential, the Government of India started Integrated Child Development
Services (ICDS), a centrally sponsored scheme which is a step towards responding to the child’s needs in a
comprehensive and holistic perspective.
1. Integrated Child Development Services (ICDS)
The Integrated Child Development Services scheme (ICDS) launched on 2nd
October 1975, on an
experimental basis in 33 ICDS blocks, has been gradually expanded to 6284 till 2008. ICDS is India’s
response to challenge of breaking a vicious cycle of malnutrition, impaired development, morbidity and
mortality in young children. It responds to the inter-related needs of children below 6 years of age, pregnant
women, lactating mother and adolescent girls in a comprehensive manner.
1.1 Objectives
i) To improve the nutritional and health status of children below the age of six years;
ii) To lay the foundation for proper psychological, physical and social development of the child;
iii) To reduce the incidence of mortality, morbidity and malnutrition and school drop out;
iv) To achieve effective coordination of the policy and implementation among various Departments
to promote child development; and

4
v) To enhance the capability of the mother to look after normal health and nutritional needs of the
child through proper nutrition and health education.
1.2 Beneficiaries
i) Children below 6 years,
ii) Pregnant and Lactating women,
iii) Adolescent Girls
iv) Other Women in the age group 15-45 years
1.3 Services
Towards achieving the above objectives, a package of integrated services comprising
Supplementary Nutrition, Immunization, Health Check-up, Referral Services, Nutrition and Health
Education and Non-formal Pre- school Education is provided in a comprehensive and cost effective manner
to meet the multi-dimensional and interrelated needs of children. Anganwadi Centre is the focal point for
delivery of services. Immunization and health-check up are provided at the Anganwadi through the net
work of health services in the project area. The beneficiaries and services under the ICDS Scheme are
given below.
Services and Beneficiaries Under ICDS
Services Beneficiaries Services Rendered by
i) Supplementary Nutrition *
Children (6 months to 72 months); Anganwadi Worker and
Helper
Pregnant women and Lactating
mothers.
-do-
ii)Growth Monitoring Children Birth to 6 months AWW/Helper
iii) Immunization ** Children below 6 years; ANM/MO
Pregnant Women ANM/MO
iv) Health Check-up** and
Referral Services
Children below 6 years;
Pregnant women and Lactating
mothers.
Health Functionaries
v) Pre-School Education Children in the age group of 3-6
years
AWW/Helper
vi) Nutrition & Health
Education
Women in age group of 15-45
Years
AWW/ANM/MO
*Adolescent Girls under Kishori Shakti Yojana (KSY) are also eligible.
**AWW assists ANM in identifying the beneficiaries
1.4 Pattern

5
ICDS is a Centrally-sponsored Scheme implemented through the State Govt/UT Administration
with 100% financial assistance for all inputs other than supplementary nutrition which the States were to
provide out of their own resources. However, many States were not providing adequate funds for
supplementary nutrition in view of the resource constraints. It has, therefore, been decided, from 2005-06,
to support States upto 50% of the financial norms or 50% of the expenditure incurred by them on
supplementary nutrition, whichever is less. Supplementary nutrition is to be provided to the beneficiaries
for 300 days in a year as per norms laid down.
1.5 Supplementary Nutrition Norms
On an average, the effort should be to provide daily nutritional supplements to the extent indicated
below:
Beneficiaries
Calories
(Cal)
Calories
(Cal)
Revised*
Protein
(g)
Protein
(g)
Revised
Children 6 months – 72 months 300 500 8-10 12-15
Severely malnourished children on medical
advice after health check-up (double than
above)
600 800 16-20 20-25
Pregnant & Lactating (P & L) Mothers
/ Adolescent Girls (under KSY) 500 600 20-25 18-20
*Revised in 2008-09
1.6 Financial Norms for Supplementary Nutrition
In order to improve the quality of Supplementary Nutrition, the financial norms as revised are as
under:
S.No. Beneficiaries Existing (per beneficiary
per day; w.e.f. 19.10.04)
Revised (per
beneficiary per day)
(i) Children(6 months to 72 months) Rs. 2.00 Rs. 4.00

6
(ii) Severely malnourished children
(6 months-72 months)
Rs. 2.70 Rs. 6.00
(iii) Pregnant women & nursing
Mothers/Adolescent girls (under
KSY)
Rs. 2.30 Rs. 5.00
1.7 Coverage
The ICDS scheme has been expanded to 6284 Projects upto September 2008, out of which 6120
have become operational. Total number of operational AWC is 10,23,307. The State-wise number of
sanctioned and operational ICDS Projects/AWCs is given in Annexure I.
1.8 Beneficiaries
Currently, services under the scheme are being provided to about 830.90 lakh beneficiaries,
comprising of about 89.84 million children and about 14.75 million pregnant and lactating mothers. State-
wise details of ICDS beneficiaries, as on are given in Annexure II.
1.9 Administrative & Organizational Set Up
The Ministry of Women and Child Development is responsible for budgetary control and
administration of the Scheme at the Centre. At the State level, Department of Social Welfare, Women &
Child Development or the Nodal Department, as may be decided by the State Government, is responsible
for the overall direction and implementation of the programme.
The Administrative Unit for the location of an ICDS Project is a Community Development Block in
the rural areas, a Tribal Development Block in pre-dominantly tribal areas and ward(s) or slums in urban
areas.
1.10 ICDS Team
The ICDS team comprises of the Anganwadi Worker (AWW), Anganwadi Helper, Supervisors and
Child Development Project Officers (CDPOs). In larger rural and tribal projects, Additional Child
Development Project Officers (ACDPOs) are also part of the ICDS Team. The Anganwadi Worker and
Helper are the grassroots level functionaries responsible for delivery of services at the Anganwadi level.
They are honorary workers from the local community and are paid monthly honoraria. The CDPOs/ACDPOs
is responsible for implementation of the Scheme at the project level.

7
1.11 Training of Personnel
The training of ICDS functionaries is the most crucial component in ICDS Programme. The
success of this programme depends on the effectiveness of frontline workers in empowering community for
improved child care practices as well as effective inter-sectoral service delivery. Training of functionaries
at all levels has been built into the programme. The National Institute of Public Cooperation and Child
Development (NIPCCD) has been designated as an apex institute for training of ICDS functionaries.
Training of Child Development Project Officers is conducted by NIPCCD and its Regional
Centers. Training of Supervisors and Anganwadi Workers is organized by selected organizations/State
Training Institutes called the Middle Level Training Centres and the Anganwadi Workers Training Centres
established in the States.
1.12 Linkages with Other Programmes
Since the ICDS programme is based on the strategy of an intersectoral approach to the development
of children, coordination of the efforts of different programmes and Departments at all levels is necessary.
For ICDS to achieve its objectives, an effective synergy at the central level is required between the
Ministry of Women and Child Development, Ministry of Health & Family Welfare, Rural Development,
Agriculture and Department of Drinking Water Supply, to meet the requirements of health, sanitation,
drinking water etc. Similarly, synergy is necessary between different Departments in the States also.
At National Level, a Coordination and Advisory Committee has been set upto ensure coordination
amongst all the concerned Departments/ Ministries and to give advice from time to time on better delivery
of services.
Instructions have also been reiterated to all State/UTs to activate the Coordination Committees at all
levels (State, District, Block and Village Level) and hold meetings at regular intervals.
1.13 Impact of ICDS
A number of evaluation studies conducted on implementation of ICDS revealed that there has been
a significant impact of the scheme which can be viewed by reduction in the incidence of morbidity and
mortality malnutrition levels and school dropouts.

8
CHAPTER - II
Monitoring and Supervision of ICDS Scheme
Monitoring and supervision play an important role in achieving the desired objectives through a
systematic process of keeping track of the performance and progress of a programme by continuously
reviewing the flow of inputs and outcome indicators. The process also helps in introducing mid-course
corrections and modifications whenever necessary. The term ‘monitoring’ has come into greater circulation
in planning and management terminology in recent years by shifting the focus from inputs to results and
outlays to outcomes. Monitoring is a valuable tool and a continuous process, with both the project
implementation and outcome indicators to be monitored on a regular basis, and includes availability of a plan
of action, continuous or periodical feedback/information on actual performance vis-à-vis the desired
objectives with planned course of action, identification of deviations and giving information and signal on
deviations.
2.1 Existing Monitoring System
The ICDS Scheme envisages an inbuilt system of monitoring through regular reports and returns
flowing upwards from Anganwadi Centre to Project Headquarters, District Headquarters, State Headquarters
and finally to the Government of India, Ministry of Women & Child Development. Till 1992, the social
components of the Scheme were being monitored by NIPCCD and the health components were being
monitored through a Central Technical Committee in AIIMS which was wound up in 1999 for certain
administrative reasons. At present, the Monitoring and Evaluation Unit in the Ministry of Women & Child
Development receives monthly and annual reports from the States.
2.2 New Monitoring set up for ICDS Scheme
The existing monitoring mechanism is not adequate and does not capture all the aspects of
implementation of the Scheme especially the qualitative assessment of ICDS. However, it has not yet
succeeded in making significant dent in prevalence of underweight among children. The Govt. of India has,
therefore, decided to set up a regular monitoring and supervision mechanism of ICDS Scheme through
9
NIPCCD and technical Institutions in states, in addition to the existing M&E Unit in the Ministry of Women
& Child Development, with the following broad objectives:
Objectives
i) to identify the strengths and weaknesses of the already existing monitoring system
ii) to determine the strategy to be adopted to develop effective monitoring mechanism at all
levels;
iii) to study convergence of services provided under other schemes of the department;
iv) to analyze the services delivered under the ICDS at all levels
v) to identify the bottlenecks/problems of the scheme and initiate action for corrective measures;
vi) to test the accuracy of the data received at the national level;
vii) to prepare detailed recommendations for improving the efficiency and effectiveness of the
scheme; and
viii) to document some of the Best Practices at the state level.
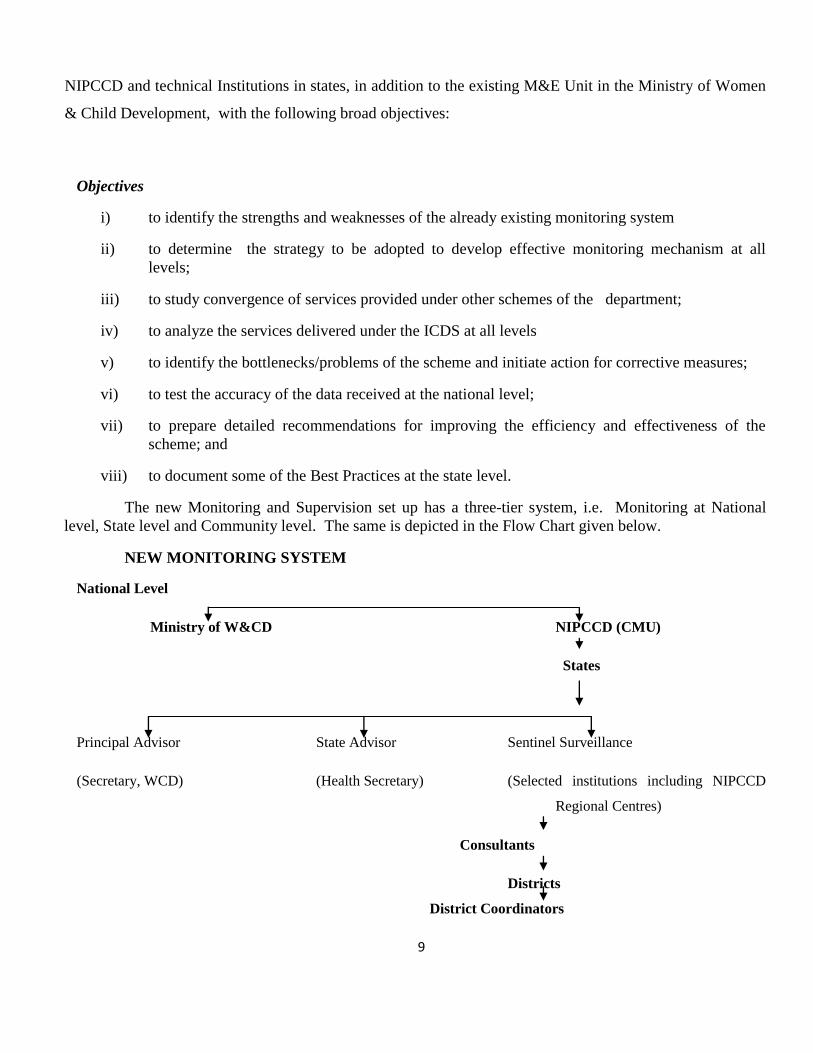
The new Monitoring and Supervision set up has a three-tier system, i.e. Monitoring at National
level, State level and Community level. The same is depicted in the Flow Chart given below.
NEW MONITORING SYSTEM
National Level
Ministry of W&CD NIPCCD (CMU)
States
Principal Advisor State Advisor Sentinel Surveillance
(Secretary, WCD) (Health Secretary) (Selected institutions including NIPCCD
Regional Centres)
Consultants
Districts
District Coordinators

10
(ICDS Officials)
Block Level
2 Supervisors
2.2.1 National Level Monitoring
National level monitoring of the ICDS scheme is being done by the Central Monitoring Unit (CMU) set
up at NIPCCD Headquarters. The tasks completed so far include
i) Reporting & Monitoring: A strong strategy has been evolved by the CMU to have constant and
effective reporting and monitoring of the services. Reliability of data is verified through test
checks/visits. Quarterly Progress Report (QPR) & Annual Progress Report (APR) Performa’s have
been developed to get a regular flow of information from selected Institutions. Performa for QPR
is at Annexure III & Performa for APR is at Annexure IV.
ii) Organization of Theme Based Workshops: Theme based workshops on specific aspects of the
programme based on the qualitative feedback received from the consultants and proactive State
Directors and functionaries of ICDS were planned to be conducted by the CMU, in order to
strengthen certain components of the scheme. During 2007-09 Four Workshops on Introduction of
New WHO Child Growth standards in ICDS’ have been organized by CMU. These workshops was
participated by the representatives of NIPCCD regional offices, Directors of ICDS, Collectors and
CDPOs.
iii) Research: CMU has carried out/ coordinated two research studies and may outsource research
studies pertaining to the problems of the areas in the states through different studies is required.
Tasks Ahead
i) Cross State Sharing Workshops: As qualitative data has been received by CMU regular workshops
are now planned to be conducted by the CMU with a view to share best practices in the
implementation of ICDS, which have done good work on some aspects of the programme. ICDS

11
Consultants approved by CMU would visit other States to participate in these workshops so that
during their assessment reports they would suggest changes required in their respective States.
ii) Review Meetings: Review meetings would be organized with the States in April, 2009 to June 2009
to review & monitor state-wise qualitative reports received from Lead Institutes.
iii) Visits of the Officials: The senior officials from the Ministry of Women & Child Development,
GOI and NIPCCD would visit the States and Projects to have meeting with the senior officials of
the States (e.g. Chief Secretaries and Ministers In-charge of SW) in the States where performance
is not up to the mark.
iv) Supervision Mission: While continuous monitoring would be an ongoing process, this would be
supplemented by two Central Supervision Missions to the States. A core team of two officials from
the Department, two faculty members of NIPCCD and outside experts will have supervision
Mission in the select States once in a year to analyze the impact of the scheme at the field level.
The approach would be holistic with emphasis on assessing both the quantitative and qualitative
aspects of the implementation of the scheme. The team is expected to pin-point the areas of
concern, both in the programme implementation and also in the social scenario in the States. These
areas of concern would be focus of monitoring till these are assessed to be suitably rectified by a
future supervision mission. It will also prepare a report along with the recommendations to
strengthen the monitoring mechanism at the centre.
v) Induction of Personnel: The CMU would be responsible for hiring a team of personnel/staff with
requisite educational/technical/professional qualifications and experts on contractual basis for
accomplishment of the desired task such as development of MIS at the Central level as well as at
the State/District levels.
vi) Consolidation of Data: The CMU would be responsible for identifying the major problem areas in
implementing the scheme to bring out a consolidated data.
vii) Preparation of Guidelines/Instructions: The CMU would also be responsible for preparing the
guidelines/instructions on the implementation of ICDS scheme, from time to time.
viii) Capacity Building: Provision of imparting training/specialized training would be one of the roles of
CMU. It will analyze the requirement of training to the ICDS functionaries as well as of other core
team at all levels. If need be, specialized training institutions will be contracted. The core teams
carrying out monitoring of the scheme will also be trained in MIS.
12
ix) Concurrent Monitoring & Evaluation: On the basis of factual feedback from the State Monitoring
Units (SMUs) small booklet containing update information on the performance of the scheme at a
glance will be brought out six monthly or yearly. A system of concurrent evaluation of ICDS (of
outcomes and nutritional status of children) at the national level through external
agencies/professional bodies and also in each State/UT at the end of every three to five years would
be established. Evaluation of NGO run ICDS Projects vis-à-vis those run by State Governments
would also be taken up. Issue/area specific operational research studies and periodic social
assessment would be introduced to make mid-course corrective actions.
2.2.2 Secondary and Primary Level Monitoring
The monitoring and supervision of the ICDS Scheme at secondary and primary level involved (i)
state level monitoring; (ii) district level monitoring; (iii) project level monitoring; and (iv) community level
monitoring. At the State level, various tasks relating to supervision and monitoring of the scheme are being
undertaken with help of selected academic Institutions viz. Community Medicine Department of Medical
Colleges, Home Science College and School of Social Work.
2.3 Selection of Institutions
States with 25 Districts or less, had a single Institution attached to them; States having more than
25 and up to 50 Districts had two Institutions and States having more than 50 Districts had three
Institutions attached to them. States having peculiar problems related to ICDS or if the State situation
warranted would had one additional Institution attached. For the States having more than two Institutions,
one of the Institutions acted as lead Institution which was responsible for collecting, compiling and
analyzing the data of all Institutions in the respective State for sending it to CMU. The lead Institution,
selected was generally located in the capital of the State so as to have easy access and coordination with
State departments. Forty two Institutions in 25 States/UTs were finally selected for the Monitoring and
Supervision of ICDS at the State Level (Table 1). Of the 10 states/UTS where suitable academic
Institutions were either not available or were not willing to participate in the activity NIPCCD Staff/Staff of
CMU was deputed for field visits and data collection. The details of selected institutions are given in
Annexure V.

13
List of Selected Institutions
S.No. Name of State No. of
Districts
Proposed
No. of
Institutions
selected
No. of
Institutions
selected
1 Andhra Pradesh 23 2 2
2 Arunachal Pradesh 15 1 0
3 Assam 23 3 1
4 Bihar 37 3 3
5 Chhattisgarh 16 2 2
6 Goa 2 1 1
7 Gujarat 25 2 1
8 Haryana 19 1 1
9 Himachal Pradesh 12 1 1
10 Jammu &
Kashmir 14 2 2
11 Jharkhand 22 2 2
12 Karnataka 27 3 2
13 Kerala 14 1 1
14 Madhya Pradesh 48 3 3
15 Maharashtra 35 3 3
16 Manipur 9 1 1
17 Orissa 30 3 3
18 Punjab 17 1 1
19 Pondicherry 4 1 1
20 Rajasthan 32 3 0
21 Tamil Nadu 30 2 2
22 Uttaranchal 13 2 1
23 Uttar Pradesh 70 4 3
24 West Bengal 18 2 2
25 Chandigarh 1 1 1
26 Dadar & Nagar
Haveli 1 1 0
27 Daman & Diu 1 1 0
28 Delhi 9 1 1
29 Andaman &
Nicobar 2 2 1
Total 554 51 42

14
Tasks to be carried out by the selected Institutions
The selected Institutions would carry out the following tasks:
(i) Collate and analyze the data and reports received from the Districts and State Headquarters
on the performance of ICDS Scheme on pre-determined set of indicators.
(ii) Collect data through field visits to selected ICDS Projects in the area assigned to it and
furnish the data/reports to the lead Institution for the State.
(iii) Every Institution shall:
a) Visit the ICDS Projects
b) Launch Supervision Missions
c) Monitor Anganwadi Workers Training Centers/MLTCs.
The details of above mentioned tasks are as under.
(i) Visit to ICDS Project :
i) It is essential for the Consultants to have comprehensive and accurate information about the
functioning of urban, rural and tribal ICDS projects in the State in which they are located so as
to make qualitative and quantitative assessment of ICDS correctly. In order to provide
assessment report of the ICDS projects it was decided that Consultants would visit at least
10% of Districts, one Project and five Anganwadi Centers every quarter on rotational basis,
make assessment, test the accuracy of data (on sample basis) based on progress reports and
furnish to CMU detailed recommendations for improving efficiency and effectiveness of
ICDS Scheme. Such visits would also enable the Consultants to identify the projects where the
Central Mission teams could visit.
ii) During the visit to ICDS project, the Consultants collect baseline information about the project
area as also the system of delivery of package of services, coverage of the target group,
problems faced by the project functionaries in the delivery of services, support they receive
from the local community etc.
15
iii) In the interest of coordination and economy of time and effort, as far as possible, visit to ICDS
project and visit to AWTC/MLTC for purposes of monitoring should be combined. The initial
visits to ICDS projects has been undertaken preferably in projects where IMR, Malnutrition
and other indicators are poor as per district/state data record.
iv) The Consultants have also prepared a comprehensive report about the ICDS project visited by
them relating to quality aspects of projects visited.
The Performa being used by the Consultants to collect information from the ICDS projects during
their visit is given at Annexure - VI. The data received from Consultants have been analysed and given in
Chapter – 3.
2.4 Financial Support to Selected Institutions
i). Each Institution including Lead Institution has engaged maximum three Consultants for which NIPCCD
is providing funds @ Rs. 6000/- per Consultant per annum, up to Rs. 30,000/- per annum for field visits,
state visits and monitoring, and Rs. 1.00 lakh per annum for space and utility & other services.
ii). The funds were released by NIPCCD to each institutions. First installment representing about 50% of
total entitlement for year has been released in or around October. Remaining 50% will be released on
receipt of audited statement of accounts and Statement of Expenditure (SOE) by 15 March 2009.
16
CHAPTER – III
DATA ANALYSIS AND RESULTS
The selected institutions deputed their consultants and consultants made visits to ICDS projects for
monitoring visits. We are receiving regular monitoring data on quarterly basis now and the data of 418
AWCs furnished by 92 consultants till the month of February have been compiled and presented in this
chapter. The list of ICDS projects is placed at Annexure I.
3.1 Child Development Project Officers
During the monitoring visits information related to various aspects of implementation of ICDS scheme was
sought from the Child Development Project Officers. Analysis of the information received from CDPOs is
given in following paragraph
3.1.1 Baseline Information
(i) Supplies to Anganwadi Centers
The interview with 92 CDPOs revealed that the supply of materials to AWC was not upto the mark (Table-
3.1). The data showed that PSE kit A & B was supplied by 55 CDPOs, MPR Forms by 74 CDPOs and
Growth Charts by 71 CDPOs to AWWs. The supply of Referral slip and NHED kit at AWC was reported
by only 26 CDPOs each in all states which clearly shows unsatisfactory mechanism of supply of material to
AWC and needs to be monitored at the state level. The status of supplies of both PSE kit and NHED kit
was reported nil in Jharkhand as compared to Kerala which had reported supply of all material to AWC.
The supply of weighing scales showed a good response (82 out of 92) in all states except for Rajasthan
where weighing scales were available in half of the AWCs visited. No weighing scales were found in the
AWCs of Punjab (3) and Gujarat (1) on visit. The availability of medicine kit was poor in almost all states
except Andhra Pradesh wherein all the 9 CDPOs interviewed responded that they have supplied medicine
kit.

17
Table 3.1 : Supplies to Anganwadi Centers as Reported by CDPOs
S.
No.
Name of the
State/UTS
No. of
CDPOs
Intervie-
wed
PSE
Kit
-A
&B
Weighi
ng
Scales
Growth
Chart
Register
Utensils Referral
Slips
MPR
forms
Medic
ine
Kit
NHED
Kit
1 Andhra Pradesh 9 6 7 7 7 4 8 9 5
2 Assam 5 3 5 5 5 0 5 2 1
3 Chhattisgarh 2 2 2 2 2 0 2 0 0
4 Delhi 3 3 3 0 0 1 2 3 0
5 Goa 1 1 1 1 1 0 1 1 1
6 Gujarat 1 1 0 1 1 1 1 1 1
7 Haryana 3 3 3 2 1 1 1 1 0
8
Himachal
Pradesh 3 1 3 3 2 2 2 2 0
9
Jammu &
Kashmir 6 4 5 5 6 0 4 0 0
10 Jharkhand 3 0 3 3 3 0 3 1 0
11 Karnataka 5 4 5 4 4 2 2 4 1
12 Kerala 3 3 3 3 3 3 3 3 3
13
Madhya
Pradesh 6 3 6 4 4 3 6 1 3
14 Maharashtra 6 2 6 6 4 3 5 5 1
15 Orissa 5 3 5 3 5 1 5 4 1
16 Punjab 3 1 0 1 1 0 2 1 0
17 Rajasthan 6 2 3 3 4 1 6 5 1
18 Tamilnadu 6 6 6 6 5 0 3 3 4
19 Uttar Pradesh 7 1 7 4 5 1 4 4 1
20 West Bengal 5 3 5 4 4 2 5 3 2
21 A&N Islands 3 3 3 3 3 0 3 3 0
22 Chandigarh 1 1 1 1 0 0 1 1 1
Total 92 55 82 71 70 26 74 57 26
(ii) CDPOs Office as a Resource Center
As per the instructions of MWCD, CDPOs Office in the states acts as resource centers. The reading material
related to ICDS is supplied to CDPOs for their reference and use. The same is utilized by CDPOs/ other
functionaries for planning NHED session for the functionaries as well as community. Therefore, the availability of
reading material/ manuals/ books is important.
The availability of ICDS reading material at CDPOs office was enquired from 92 CDPOs, out of which 51 (55.4%)
CDPOs reported that manual/booklets were available with them (Table 3.2). The least availability (33.3%) was
18
reported by CDPOs of Jharkhand and Rajasthan in comparison to all the CDPOs of Chandigarh, Andaman Nicobar
Islands, Gujarat, Goa and Delhi who possessed manual/booklets. It was observed that PSE kit and the Compilation of
Guidelines issued by the Ministry of Women and Child Development was available in only half (55.4% and 52.2%)
each of the projects which showed that reading material do not reach all. The material/booklet on SHG was available
with 41.3 percent CDPOs.
Table 3.2 CDPO Office as a Resource Center
Sl.
No.
Name of the
State/UTs
No. of
CDPOs
intervie
wed Ma
nu
al
/Bo
ok
lets
Gu
ideb
oo
k o
f A
WW
Gro
wth
Mo
nit
ori
n
g M
an
ual
Co
mp
ila
ti
on
o
f
Gu
idel
ines
PS
E
Kit
Ma
teri
al
No. % No. % No. % No. % No. %
1 Andhra Pradesh 9 7 77.8 7 77.8 6 66.7 7 77.8 7 77.8
2 Assam 5 0 0 2 40 4 80 1 20 1 20
3 Chhattisgarh 2 0 0 2 100 2 100 2 100 2 100
4 Delhi 3 3 100 2 66.7 0 0 1 33.3 2 66.7
5 Goa 1 1 100 1 100 1 100 1 100 1 100
6 Gujarat 1 1 100 0 0 0 0 0 0 0 0
7 Haryana 3 0 0 2 66.7 0 0 1 33.3 1 33.3
8 Himachal Pradesh 3 2 66.7 3 100 2 66.7 3 100 3 100
9 Jammu & Kashmir 6 3 50 5 83.3 3 50 2 33.3 3 50
10 Jharkhand 3 1 33.3 1 33.3 1 33.3 1 33.3 0 0
11 Karnataka 5 4 80 4 80 4 80 3 60 4 80
12 Kerala 3 0 0 1 33.3 0 0 0 0 0 0
13 Madhya Pradesh 6 4 66.7 4 66.7 2 33.3 3 50 3 50
14 Maharashtra 6 4 66.7 3 50 4 66.7 0 0 3 50
15 Orissa 5 3 60 2 40 3 60 2 40 2 40
16 Punjab 3 0 0 1 33.3 0 0 1 33.3 1 33.3
17 Rajasthan 6 2 33.3 2 33.3 2 33.3 4 66.7 1 16.7
18 Tamilnadu 6 5 83.3 5 83.3 5 83.3 4 66.7 5 83.3
19 Uttar Pradesh 7 4 57.1 3 42.9 4 57.1 4 57.1 4 57.1
20 West Bengal 5 3 60 4 80 3 60 5 100 4 80
21 A&N Islands 3 3 100 3 100 3 100 2 66.7 3 100
22 Chandigarh 1 1 100 1 100 1 100 1 100 1 100
Total 92 51 55.4 58 63 50 54.3 48 52.2 51 55.4

19
Continued……. Table 3.2 CDPO Office as a Resource Center
Sl.
No.
Name of the
State/UTs
No. of
CDPOs
interviewed
NH
ED
Kit
Ma
teri
al
Bo
ok
let
on
SH
G
MP
Rs
&
MIS
Mu
sica
l
Inst
rum
e
nt
Rec
ord
s
&
Reg
iste
r
No. % No. % No. % No. % No. %
1 Andhra Pradesh 9 4 44.4 6 66.7 7 77.8 5 55.5 9 100
2 Assam 5 2 40 0 0 2 40 0 0 5 100
3 Chhattisgarh 2 0 0 2 100 2 100 0 0 2 100
4 Delhi 3 0 0 2 66.7 3 100 0 0 3 100
5 Goa 1 1 100 0 0 1 100 0 0 1 100
6 Gujarat 1 0 0 0 0 0 0 0 0 0 0
7 Haryana 3 0 0 1 33.3 0 0 0 0 3 100
8
Himachal
Pradesh 3 2 66.7 2 66.7 3 100 2 66.6 3 100
9
Jammu &
Kashmir 6 0 0 1 16.7 3 50 0 0 4 66.7
10 Jharkhand 3 0 0 1 33.3 2 66.7 0 0 3 100
11 Karnataka 5 2 40 3 60 4 80 1 20 4 80
12 Kerala 3 0 0 0 0 0 0 0 0 3 100
13 Madhya Pradesh 6 1 16.7 3 50 3 50 1 16.7 6 100
14 Maharashtra 6 3 50 3 50 2 33.3 1 16.7 2 33.3
15 Orissa 5 0 0 2 40 2 40 1 20 5 100
16 Punjab 3 1 33.3 1 33.3 0 0 0 0 2 66.7
17 Rajasthan 6 0 0 4 66.7 2 33.3 0 0 5 83.3
18 Tamilnadu 6 4 66.7 3 50 4 66.7 0 0 5 83.3
19 Uttar Pradesh 7 0 0 1 14.3 3 42.9 0 0 5 71.4
20 West Bengal 5 2 40 3 60 3 60 0 0 5 100
21 A&N Islands 3 1 33.3 1 33.3 3 100 0 0 3 100
22 Chandigarh 1 1 100 0 0 1 100 0 0 1 100
Total 92 24 26.1 39 42.4 50 54.3 11 11.9 79 86
Further, it was heartening to note that records and registers were available with 85.9 percent CDPOs but
availability of MPRs and MIS Performa were reported by half of the CDPOs (54.3%) which could hamper the
reporting system. Musical instrument for use by functionaries was available with only 11.9 percent CDPOs office in
State of Andhra Pradesh, Haryana, Karnataka, Madhya Pradesh, Maharashtra and Orissa.
3.1.2 Monitoring and Supervision of Anganwadi Centres
(i) Visits of AWCs by CDPOs
20
Monitoring and Supervision of AWCs by CDPOs and Supervisor is an inbuilt component of ICDS programme.
It helps AWWs in proper functioning and reporting. Monitoring visits of CDPOs/Supervisors as reported by CDPOs
is given in (Table 3.3).
Most of the CDPOs (88.0%) reported regular visits to the projects. Only one CDPO from Delhi and Punjab out of
the 3 interviewed in each state reported regular visits to the AWCs. The visits to AWC were reported by 2 out of 3
CDPOs from Kerala, Haryana, and Himachal Pradesh. 68.5 percent CDPOs reported having of checklists for
Monitoring and Supervision of AWC.
Table 3.3 Visit to AWCs and Monitoring Mechanism
S.
No. Name of the State/UT
No. of
CDPOs
interviewed
CDPO visit
regularly
CDPOs
having
checklists
for
monitoring
and
Supervision
of AWCs
Monitoring of Mechanism by CDPO
Interview
during
visits
Use
checklist Observation
No. % No. % No. % No. % No. %
1 Andhra Pradesh 9 9 100.0 5 55.6 6 66.7 2 22.2 8 88.9
2 Assam 5 4 80.0 2 40.0 4 80.0 2 40.0 5 100.0
3 Chhattisgarh 2 2 100.0 2 100.0 2 100.0 2 100.0 2 100.0
4 Delhi 3 1 33.3 1 33.3 3 100.0 1 33.3 3 100.0
5 Goa 1 1 100.0 1 100.0 1 100.0 1 100.0 1 100.0
6 Gujarat 1 1 100.0 0 0.0 0 0.0 0 0.0 0 0.0
7 Haryana 3 2 66.7 1 33.3 1 33.3 1 33.3 3 100.0
8 Himachal Pradesh 3 2 66.7 2 66.7 0 0.0 2 66.7 1 33.3
9 Jammu & Kashmir 6 6 100.0 5 83.3 1 16.7 2 33.3 6 100.0
10 Jharkhand 3 3 100.0 3 100.0 2 66.7 2 66.7 2 66.7
11 Karnataka 5 5 100.0 4 80.0 2 40.0 2 40.0 3 60.0
12 Kerala 3 2 66.7 2 66.7 1 33.3 0 0.0 3 100.0
13 Madhya Pradesh 6 6 100.0 3 50.0 5 83.3 4 66.7 6 100.0
14 Maharashtra 6 6 100.0 4 66.7 4 66.7 4 66.7 5 83.3
15 Orissa 5 5 100.0 3 60.0 1 20.0 2 40.0 4 80.0
16 Punjab 3 1 33.3 3 100.0 0 0.0 2 66.7 2 66.7
17 Rajasthan 6 6 100.0 6 100.0 4 66.7 3 50.0 5 83.3
18 Tamilnadu 6 5 83.3 6 100.0 2 33.3 5 83.3 3 50.0
19 Uttar Pradesh 7 6 85.7 2 28.6 4 57.1 2 28.6 3 42.9
20 West Bengal 5 4 80.0 4 80.0 4 80.0 3 60.0 5 100.0
21 A&N Islands 3 3 100.0 3 100.0 0 0.0 3 100.0 3 100.0
22 Chandigarh 1 1 100.0 1 100.0 1 100.0 1 100.0 1 100.0
Total 92 81 88.0 63 68.5 48 52.2 46 50.0 74 80.4
21
(ii) Monitoring Mechanism
On asking about the mechanism of Monitoring of AWCs, CDPOs reported that either interview through daily
visits (52.2%), use of checklist (50.0%) or observation (80.4%) was adopted by them for monitoring during their visit
(Table 3.3). Though the availability of checklist for monitoring and supervision was reported by 68.5 percent
CDPOs, but use of checklist for monitoring was reported only by half (50%) of them. However, 80.4 percent
CDPOs said that they observed the functioning of AWWs during visits. Monitoring by Observation was reported by
the CDPOs of Assam, Delhi, Haryana, Jammu & Kashmir, Kerala, Madhya Pradesh, West Bengal and Andaman &
Nicobar Islands. The CDPO’s of Chhattisgarh, Goa and Chandigarh reported monitoring using all the above three
methods.
(iii) Guiding supervisors for planning visit
As a good practice, 81.5 percent CDPOs helped their supervisors plan the monitoring visits to AWC where
as 15.2 percent supervisors plan their own visits (Table 3.4). The reason cited by those CDPOs who do not plan
visits of supervisors included lack of time (3.2%).
Table 3.4 Planning Visits for Supervisors
S.
No.
Name of the State/UTs
No. of CDPOs
interviewed
Reasons for not planning Supervisors' visits by
CDPO
No. of CDPOs
planning visits of
supervisors
Supervisors
plan their
visits
Lack of
time
No. % No. % No. %
1 Andhra Pradesh 9 7 77.8 2 22.2 0 0.0
2 Assam 5 5 100.0 0 0.0 0 0.0
3 Chhattisgarh 2 2 100.0 0 0.0 0 0.0
4 Delhi 3 2 66.7 1 33.3 0 0.0
5 Goa 1 1 100.0 0 0.0 0 0.0
6 Gujarat 1 1 100.0 0 0.0 0 0.0
7 Haryana 3 2 66.7 1 33.3 0 0.0
8 Himachal Pradesh 3 2 66.7 0 0.0 1 33.3
9 Jammu & Kashmir 6 6 100.0 0 0.0 0 0.0
10 Jharkhand 3 3 100.0 1 33.3 0 0.0
11 Karnataka 5 4 80.0 0 0.0 0 0.0
12 Kerala 3 2 66.7 0 0.0 1 33.3
13 Madhya Pradesh 6 5 83.3 1 16.7 0 0.0
14 Maharashtra 6 5 83.3 1 16.7 1 16.7
15 Orissa 5 3 60.0 2 40.0 0 0.0
16 Punjab 3 3 100.0 0 0.0 0 0.0

22
17 Rajasthan 6 4 66.7 1 16.7 0 0.0
18 Tamilnadu 6 6 100.0 0 0.0 0 0.0
19 Uttar Pradesh 7 4 57.1 3 42.9 0 0.0
20 West Bengal 5 5 100.0 0 0.0 0 0.0
21 A&N Islands 3 3 100.0 0 0.0 0 0.0
22 Chandigarh 1 0 0.0 1 100.0 0 0.0
Total 92 75 81.5 14 15.2 3 3.26
(iv) Guidance to Functionaries
The main objective of supervision and monitoring is to improve the functioning of AWCs. The corrective
measures as suggested by CDPOs/Supervisors during their monitoring visits helps AWWs in improving their
services. Almost all the CDPOs (91) except for one reported they provide on the spot guidance to AWWs which help
in improving their working and utilization of services (Table 3.5). Guidance to AWWs was provided by either giving
instructions (33.6%), demonstration of growth monitoring (18.4%) by giving suggestions (28.6%) and by writing in
supervision register (6.6%) and by conducting Mother’s meetings/ Bal Vikas Samitis (6.6%), 19.8 % CDPO’s
informed that they guided AWW’s in maintaining proper records and registers.
Table 3.5 Guidance Provided by CDPOs to AWWs
S.
No.
Name of the
State/UT
No. of
CDPO
s
intervi
ewed
No. of CDPOs
provide on
the spot
guidance to
AWWs
Method of Guiding AWWs
By giving
instruction
Demonstrati
on (GM/SN)
By giving
suggestion
Maintenanc
e records
& register
Conducting
mother
meetings/
Bal vikas
samiti
meetings
No. % No. % No. % No. % No. % No. %
1 Andhra Pradesh 9 9 100.0 2 22.2 3 33.3 3 33.3 1 11.1 1 11.1
2 Assam 5 5 100.0 4 80.0 1 20.0 0 0.0 0 0.0 0 0.0
3 Chhattisgarh 2 2 100.0 0 0.0 0 0.0 0 0.0 0 0.0 0 0.0
4 Delhi 3 3 100.0 1 33.3 1 33.3 0 0.0 2 66.7 0 0.0
5 Goa 1 1 100.0 1 100.0 1 100.0 0 0.0 1 100.0 0 0.0
6 Gujarat 1 1 100.0 0 0.0 0 0.0 0 0.0 0 0.0 0 0.0
7 Haryana 3 3 100.0 0 0.0 0 0.0 2 66.7 0 0.0 0 0.0
8 Himachal Pradesh 3 3 100.0 0 0.0 0 0.0 2 66.7 0 0.0 0 0.0
9 Jammu & Kashmir 6 6 100.0 1 16.7 2 33.3 1 16.7 1 16.7 1 16.7
10 Jharkhand 3 3 100.0 1 33.3 2 66.7 1 33.3 1 33.3 0 0.0
11 Karnataka 5 5 100.0 3 60.0 1 20.0 2 40.0 2 40.0 1 20.0
12 Kerala 3 3 100.0 0 0.0 0 0.0 1 33.3 1 33.3 0 0.0
13 Madhya Pradesh 6 6 100.0 4 66.7 1 16.7 0 0.0 2 33.3 0 0.0

23
14 Maharashtra 6 6 100.0 2 33.3 0 0.0 3 50.0 1 16.7 2 33.3
15 Orissa 5 5 100.0 3 60.0 1 20.0 2 40.0 1 20.0 1 20.0
16 Punjab 3 3 100.0 0 0.0 0 0.0 2 66.7 0 0.0 0 0.0
17 Rajasthan 6 6 100.0 1 16.7 1 16.7 0 0.0 2 33.3 0 0.0
18 Tamilnadu 6 6 100.0 4 66.7 2 33.3 4 66.7 1 16.7 0 0.0
19 Uttar Pradesh 7 7 100.0 3 42.9 1 14.3 0 0.0 1 14.3 0 0.0
20 West Bengal 5 4 80.0 1 25.0 0 0.0 3 75.0 1 25.0 0 0.0
21 A&N Islands 3 3 100.0 3 100.0 0 0.0 0 0.0 0 0.0 0 0.0
22 Chandigarh 1 1 100.0 0 0.0 0 0.0 0 0.0 0 0.0 0 0.0
Total 92 91 98.9 31 33.6 17 18.4 26 28.6 18 19.8 6 6.6
Two CDPOs from Tamil Nadu informed that they demonstrated preparation of recipes used for
supplementary nutrition to the AWWs. Whereas only 19.8 percent CDPOs reported guiding AWWs in maintenance
of proper record and register, it was a matter of concern that Mothers meetings/Bal Vikas Samiti meetings were not
being conducted by majority of CDPOs. Only 6.6 percent CDPOs from the states of Andhra Pradesh, Jammu &
Kashmir, Karnataka, Maharashtra, Tamil Nadu, Orissa reported conducting the meetings.
(v) Assessment of Performance
The assessment of AWCs was done regularly by 90.2 percent CDPOs (Table 3.6). Different methods were used by
CDPOs for assessing the performance of AWWs. Observing the activities of AWWs (61.4%) and checking records
and registers (60.2%) were the two major methods of assessment.
Assessment through performance indicators such as cleanliness, behaviour, punctuality, was reported by 14.5
percent CDPOs. Interacting with the community beneficiaries is (37.3 %) was also used as one of the important
methods of assessing the performance of AWWs. Some of the CDPOs used indicators like attendance of children in
AWC (12.0 %) record keeping and coordination with other departments (10.8 %). 8.4 percent CDPOs reported use
of checklist followed grading system (6.0%)
Table 3.6 Assessment of AWWs as Reported by CDPOs
S.No No. %
1 No. of CDPOs interviewed 92
2 No. of CDPOs Assessing to AWCs 83 90.2
Methods used to Assess the Performance of AWCs
1 Observation on delivery & Services 51 61.4
2 Use of Checklist 7 8.4

24
3 Checking Record & Register 50 60.2
4 Interacting with Community/ Beneficiaries
31 37.3
5 Grading AWWs 5 6.0
6
Performance of AWWs (cleanliness, Behaviour, Punctuality) 12 14.5
7 Attendance of children at AWC
10 12.0
8 Co-ordination with Other Departments 9 10.8
(vi) Strength and Weaknesses of Functionaries
The quality of services provided by either the AWWs or the Supervisors depend on their capabilities and
skills to provide services, which in turn is affected by the strength and weaknesses possessed by the worker in
delegating their job responsibilities.
The CDPOs were asked to define the strengths and weaknesses of their AWWs/Supervisors. The same as
reported by 79 CDPOs out of 92 interviewed as depicted in (Table 3.7). Some of the strengths of AWWs and
Supervisors highlighted by CDPOs included sincerity/ adjustable/dedication (25.3 % AWWs; 24.1% supervisors);
hard working (22.8 % AWWs; 25.3% Supervisor) and good rapport with community (17.7%
AWWs;5.1%supervisors). 12.7 percent supervisors were reported to be supervising AWC regularly and promoting
activities at AWCs. Well trained/educated as strength was reported in 10.1 percent AWW as compared to only 8.9
percent supervisors. With regards to weaknesses, a long list was reported by the CDPOs (Table 3.8) which
highlighted the fact the AWWs (11.4%) and supervisors (6.3%) were not punctual. 7.6 percent AWWs and 6.3
percent supervisors were either not qualified or not knowledgeable. Lack of motivation/ overwork stress was reported
by 11.4 percent AWWs and 5.1 percent supervisors. Lack of proper training was reported in 8.9 percent AWWs and
3.8 percent supervisor. 8.9 percent AWWs were reported to be sluggish in maintaining records. Irregular supervision
was done by 12.7 percent supervisors as reported by CDPOs.
Table 3.7 Strengths of AWWs & Supervisors as Reported by CDPOs N = 79
S.No. Strengths AWWs Supervisors
No. % No. %
1 Sincerity/ Adjustable/ Dedicated/ Obedient 20 25.3 19 24.1
2 Hardworking 18 22.8 20 25.3
3 Good rapport with community 14 17.7 4 5.1
4 Good Co- ordination 9 11.4 15 19.0

25
Table 3.8 Weakness of AWWs & supervisors as reported by CDPOs
N = 79
No. of AWWs and Supervisors
Weakness of AWW and Supervisors as reported
by CDPOs
AWWs
Supervisors
No. % No. %
2.6(b)1(a)
1- Not Punctual 10 12.7 6 7.5
2 -Less Qualified / Less knowledgeable 7 8.9 5 6.3
3 -Overwork Stress/ lack of motivation 17 21.5 8 10.1
4 -Weak in Community Participation 6 7.6 3 3.8
5 -Lacks in record keeping 12 15.2 9 11.3
6- Lacks in proper Guidance 0 0.0 12 15.1
7-Not functional (Some are not functional) 2 2.5 3 2.5
8-Non availability of facilities 1 1.3 0 0.0
9-Family responsibilities 2 2.5 1 1.2
10-Low honorariums 9 11.4 4 5.0
11- Lacks Training 0 0.0 3 3.8
12- Not proper Co-ordination 0 0.0 1 1.2
13- Political pressure/ interference 2 2.5 0 0.0
14- Poor leadership qualities 2 2.5 2 2.5
(vii) Continuing Education of Functionaries
CDPOs being responsible for the overall functioning of the ICDS programme have the responsibility of
providing continuing education to AWWs and supervisors of their projects. Most of them provide continuing
education during the sectoral meeting or the monthly pay days.
It was encouraging to note that 78.3 percent CDPOs organized continuing education sessions for AWWs and
supervisors in their projects with the aim to provide information on recent developments in the field. Frequency of
organizing continuing education session as reported CDPOs by was once a month (76.3%) once in two month (8.3%)
once a quarter (4.2%) and twice a year (5.6%). The information that the session was organized after 2 years received
from one CDPO out of 6 CDPOs from Tamil Nadu was discouraging (Table 3.9).
5 Well trained/ experienced/ educated 8 10.1 7 8.9
6 Regular Visit 0 0.0 10 12.7
7 Efficient in delivery of services 7 8.9 1 1.3
8 Maintenance of Records 3 3.8 0 0.0
9 Good communication skills 5 6.3 1 1.3
10 Provide Guidance 0 0.0 2 2.5
26
Table 3.9 Frequency of Organizing Continuing Education Session
SE Name of the
State/UT
No. of
CDPOs
interviewed
No. of
Projects
organized
continuing
education
Frequency of organizing Continuing Education Session
Once in a
month
Once in a
two month
Once in
three
months
Once in 6
months
Once in a
year
No. % No. % No. % No. % No. % No. %
1 Andhra Pradesh 9 8 88.9 5 62.5 2 25.0 0 0.0 1 12.5 0 0.0
2 Assam 5 4 80.0 4 75.0 0 0.0 0 0.0 0 0.0 0 0.0
3 Chhattisgarh 2 2 100.0 2 100.0 0 0.0 0 0.0 0 0.0 0 0.0
4 Delhi 3 1 33.3 0 0.0 0 0.0 0 0.0 1 100.0 0 0.0
5 Goa 1 1 100.0 1 100.0 0 0.0 0 0.0 0 0.0 0 0.0
6 Gujarat 1 1 100.0 1 100.0 0 0.0 0 0.0 0 0.0 0 0.0
7 Haryana 3 3 100.0 1 33.3 0 0.0 2 66.7 0 0.0 0 0.0
8
Himachal
Pradesh 3 3 100.0 2 66.7 0 0.0 0 0.0 1 33.3 0 0.0
9
Jammu &
Kashmir 6 5 83.3 4 80.0 1 20.0 0 0.0 0 0.0 0 0.0
10 Jharkhand 3 2 66.7 2 100.0 0 0.0 0 0.0 0 0.0 0 0.0
11 Karnataka 5 5 100.0 4 80.0 1 20.0 0 0.0 0 0.0 0 0.0
12 Kerala 3 1 33.3 0 0.0 1 100.0 0 0.0 0 0.0 0 0.0
13 Madhya Pradesh 6 4 66.7 2 50.0 0 0.0 0 0.0 1 25.0 0 0.0
14 Maharashtra 6 6 100.0 3 50.0 0 0.0 1 16.7 0 0.0 1 16.7
15 Orissa 5 5 100.0 4 80.0 0 0.0 0 0.0 0 0.0 0 0.0
16 Punjab 3 3 100.0 2 66.7 0 0.0 0 0.0 0 0.0 1 33.3
17 Rajasthan 6 5 83.3 4 80.0 1 20.0 0 0.0 0 0.0 0 0.0
18 Tamilnadu 6 5 83.3 3 60.0 0 0.0 0 0.0 0 0.0 1 20.0
19 Uttar Pradesh 7 3 42.9 3 100.0 0 0.0 0 0.0 0 0.0 0 0.0
20 West Bengal 5 1 20.0 1 100.0 0 0.0 0 0.0 0 0.0 0 0.0
21 A&N Islands 3 3 100.0 3 100.0 0 0.0 0 0.0 0 0.0 0 0.0
22 Chandigarh 1 1 100.0 1 100.0 0 0.0 0 0.0 0 0.0 0 0.0
Total 92 72 78.3 55 76.3 6 8.3 3 4.2 4 5.6 3 4.2
The topics covered during continuing education session related to different services provided at the AWC are
given in (Table 3.10).The table reveals that sessions on breastfeeding, care of pregnant and lactating mother were
discussed by maximum number (23.6%) of CDPOs followed by practical demonstration in PSE activities and
immunization (16.7%), HIV/AIDS (9.7%) and supplementary nutrition (13.8%). The least information (1.4%) was
given on topics like mortality rate, locally available foods, low cost recipes and importance of savings.

27
Table 3.10 Topics Covered during Continuing Education Session N=72
S.No. Topic No. of Projects %
1 Breast Feeding/ Pregnant Women/ Lactating Mothers 17 23.6
2 Female Foeiticide 2 2.8
3 Kishori Shakti Yojna/Balika Samridhi yojna/Ladli 12 16.6
4 Morbidity /Mortality 5 6.9
5 HIV/AIDS 7 9.7
6 Child Marriage 2 2.8
7 Supplementary Nutrition 10 13.8
8 Growth Monitoring 3 4.2
9 Services Provided Under ICDS 9 12.5
10 PSE activities/ Practical Demonstration 12 16.7
11 Locally available foods 1 1.4
12 Adolescent girls Nutrition 2 2.8
13 Record Keeping/Surveys 7 9.7
14 Safe drinking water/Diarrhea/Sanitation 7 9.7
15 Iodine deficiency 2 2.8
16 Diarrhea/ sanitation 5 6.9
17 Nutrition Education 17 23.6
18 Low cost recipes 1 1.4
19 Balika samridhi yojna 4 5.6
20 Mental Health 4 5.6
21 Immunization 12 16.7
22 Diabetes 2 2.8
3.1.3 PRI Involvement and IEC Activities
(i) PRI Involvement
ICDS has been envisaged and conceptualized as a community based programme PRIs play an significant role in
making ICDS as a widely accepted programme therefore he involvement of PRIs in implementation of ICDS has
been well accepted. During the visits it was observed that 68.5 percent CDPOs involved PRIs in different activities of
AWC (Table 3.11).

28
Table 3.11 Involvement of PRIs in Implementation of ICDS
S. No. Name of the State/UTS No. of CDPOs
interviewed
Involving
PRIs
Involving of
PRIs for
Quality
Improvement
No. % No. %
1 Andhra Pradesh 9 3 33.3 6 66.7
2 Assam 5 5 100.0 5 100.0
3 Chhattisgarh 2 2 100.0 2 100.0
4 Delhi 3 0 0.0 0 0.0
5 Goa 1 0 0.0 0 0.0
6 Gujarat 1 1 100.0 0 0.0
7 Haryana 3 2 66.7 1 33.3
8 Himachal Pradesh 3 3 100.0 3 100.0
9 Jammu & Kashmir 6 1 16.7 3 50.0
10 Jharkhand 3 2 66.7 3 100.0
11 Karnataka 5 4 80.0 4 80.0
12 Kerala 3 2 66.7 3 100.0
13 Madhya Pradesh 6 1 16.7 1 16.7
14 Maharashtra 6 5 83.3 5 83.3
15 Orissa 5 3 60.0 3 60.0
16 Punjab 3 3 100.0 3 100.0
17 Rajasthan 6 6 100.0 2 33.3
18 Tamilnadu 6 4 66.7 5 83.3
19 Uttar Pradesh 7 7 100.0 5 71.4
20 West Bengal 5 5 100.0 5 100.0
21 A&N Islands 3 3 100.0 3 100.0
22 Chandigarh 1 1 100.0 0 0.0
Total 92 63 68.5 62 67.4
The involvement of PRIs was stated by almost all CDPOs belonging to Assam, Chhattisgarh, Gujarat, Himachal
Pradesh, Punjab, Rajasthan, Uttar Pradesh, West Bengal, Andaman & Nicobar Islands and Chandigarh. In the States
of Delhi, Goa there was no involvement of PRIs reported by the CDPOs who were interviewed.
The CDPOs were further probed to give their views on involvement of PRIs in improving the
quality of services in ICDS. It was heartening to note that 67.4 percent CDPOs accepted the fact that PRIs should be
involved with ICDS activities to improve its quality. While all the CDPOs of Assam, Chhattisgarh, Himachal

29
Pradesh, Jharkhand, Kerala, Punjab, West Bengal and Andaman & Nicobar Islands supported the view of involving
PRIs in bringing quality improvement in ICDS. The CDPOs of Delhi, Goa, Gujarat and Chandigarh did not
responded positively to the idea of involvement of PRIs. Involvement of PRIs was not much appreciated by the states
of Andhra Pradesh (33.3%) Madhya Pradesh and Jammu & Kashmir (16.7%) each.
(ii) IEC Activities
IEC activities need to be organized regularly at the project level for which sufficient funds are
available with State Government as well as at project level. (Table 3.12) reveals the Status of IEC activities in the
States. 59 (64.1 %) out of 92 CDPOs reported organizing IEC activities regularly. No information regarding IEC
activities was given by CDPOs of Delhi and Goa in comparison to the States of Chhattisgarh, Goa, Gujarat, Haryana,
Himachal Pradesh, Jharkhand, Punjab and A&N Islands, where all CDPOs Interviewed reported organizing IEC
activities.
Out of 59 CDPOs who reported organization of IEC activities, the IEC Funds were utilized by only 48
CDPOs. The States of Assam, Delhi, Goa, Gujarat, and Kerala did not utilize any IEC funds (Table3.12). Majority of
IEC funds were utilized for preparation of different training materials like pamphlets/wall board, slogan/wall
writings, organizing NHED during Breastfeeding Week/ Nutrition Week, and Community Meeting etc. One CDPO
each from the States of Himachal Pradesh and Madhya Pradesh reported that the funds were utilized as per the action
plan provided by the Health Department. 47.9 and 25 percent CDPOs spent IEC funds on preparing pamphlets/wall
board and organizing NHED during breastfeeding week respectively. Out of all CDPOs who reported utilization of
funds (Table 3.12).
The CDPOs were further asked about the type of activities conducted under IEC and the responses are
listed in (Table 3.13)
Table 3.13 Type of IEC Activities Conducted by CDPOs
N=59
S.No IEC Activities No. %
1 NHED 50 84.7
2 Celebration of Breastfeeding week 13 22.0
30
and nutrition week
3 Involvement of PRIs 2 3.4
4 Mahila Jagriti Shivir/Ksy/Mahila
Mandal
7 11.9
5 Distribution of Communication
Material
1 1.7
84.7 percent CDPOs reported organizing NHED sessions under IEC, Mahila Jagriti Shivir /KSY /Mahila Mandal
meetings for women and adolescent girls,(11.9%) campaigns during Breastfeeding/ Nutrition week were (22.0%)
organized as IEC activities. Only one CDPOs reported distribution of IEC funds for celebration of nutrition week.
Only one CDPO reported distribution of communication material as IEC activity.
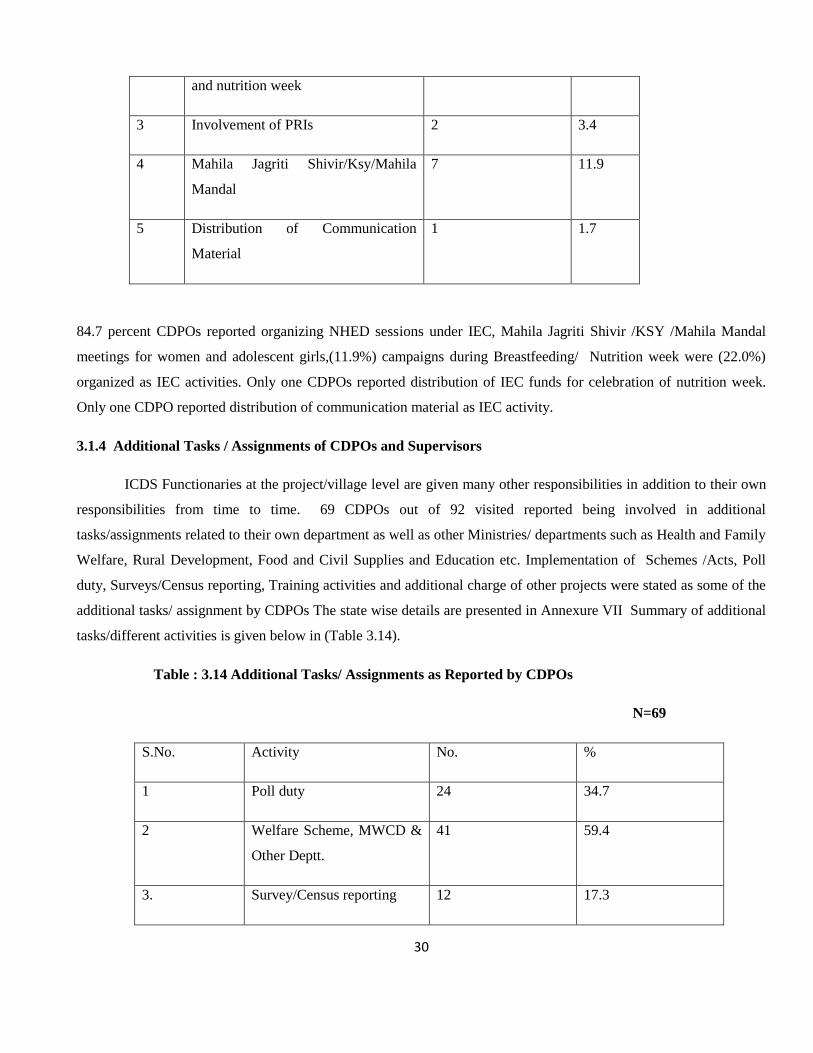
3.1.4 Additional Tasks / Assignments of CDPOs and Supervisors
ICDS Functionaries at the project/village level are given many other responsibilities in addition to their own
responsibilities from time to time. 69 CDPOs out of 92 visited reported being involved in additional
tasks/assignments related to their own department as well as other Ministries/ departments such as Health and Family
Welfare, Rural Development, Food and Civil Supplies and Education etc. Implementation of Schemes /Acts, Poll
duty, Surveys/Census reporting, Training activities and additional charge of other projects were stated as some of the
additional tasks/ assignment by CDPOs The state wise details are presented in Annexure VII Summary of additional
tasks/different activities is given below in (Table 3.14).
Table : 3.14 Additional Tasks/ Assignments as Reported by CDPOs
N=69
S.No. Activity No. %
1 Poll duty 24 34.7
2 Welfare Scheme, MWCD &
Other Deptt.
41 59.4
3. Survey/Census reporting 12 17.3
31
4. Additional Charge 21 30.4
5. Health Activity (Pulse Polio) 18 26.0
6 Training Activities 11 15.9
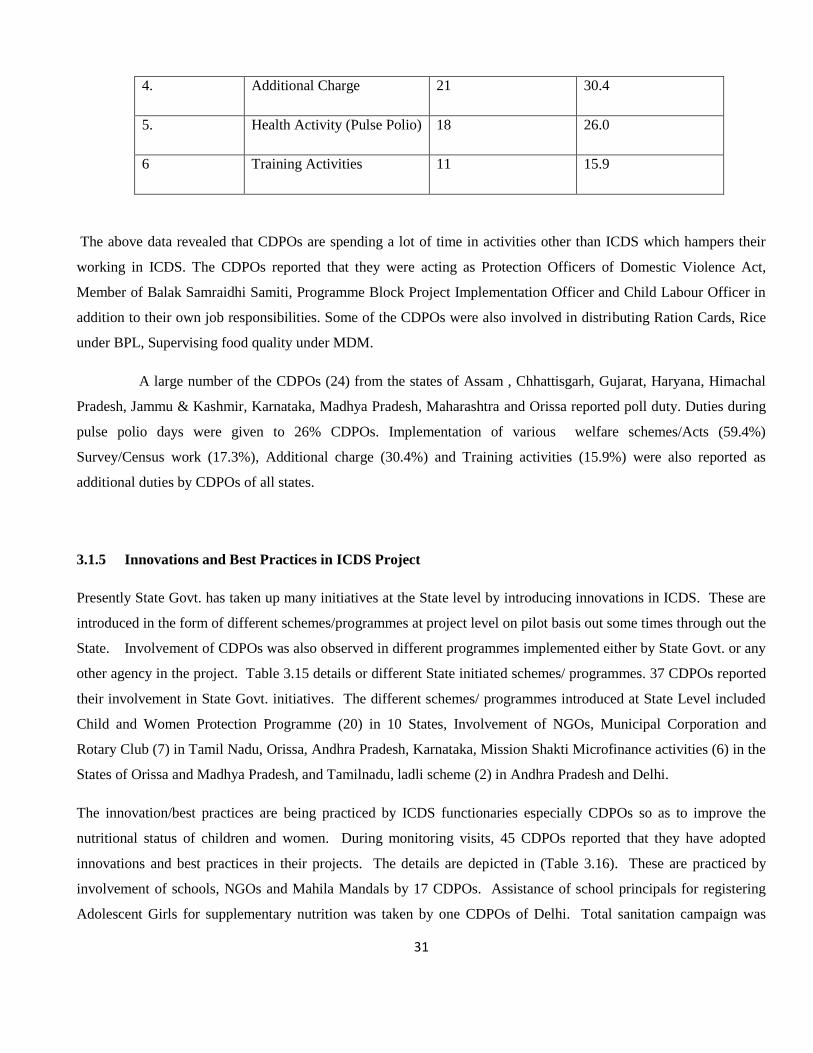
The above data revealed that CDPOs are spending a lot of time in activities other than ICDS which hampers their
working in ICDS. The CDPOs reported that they were acting as Protection Officers of Domestic Violence Act,
Member of Balak Samraidhi Samiti, Programme Block Project Implementation Officer and Child Labour Officer in
addition to their own job responsibilities. Some of the CDPOs were also involved in distributing Ration Cards, Rice
under BPL, Supervising food quality under MDM.
A large number of the CDPOs (24) from the states of Assam , Chhattisgarh, Gujarat, Haryana, Himachal
Pradesh, Jammu & Kashmir, Karnataka, Madhya Pradesh, Maharashtra and Orissa reported poll duty. Duties during
pulse polio days were given to 26% CDPOs. Implementation of various welfare schemes/Acts (59.4%)
Survey/Census work (17.3%), Additional charge (30.4%) and Training activities (15.9%) were also reported as
additional duties by CDPOs of all states.
3.1.5 Innovations and Best Practices in ICDS Project
Presently State Govt. has taken up many initiatives at the State level by introducing innovations in ICDS. These are
introduced in the form of different schemes/programmes at project level on pilot basis out some times through out the
State. Involvement of CDPOs was also observed in different programmes implemented either by State Govt. or any
other agency in the project. Table 3.15 details or different State initiated schemes/ programmes. 37 CDPOs reported
their involvement in State Govt. initiatives. The different schemes/ programmes introduced at State Level included
Child and Women Protection Programme (20) in 10 States, Involvement of NGOs, Municipal Corporation and
Rotary Club (7) in Tamil Nadu, Orissa, Andhra Pradesh, Karnataka, Mission Shakti Microfinance activities (6) in the
States of Orissa and Madhya Pradesh, and Tamilnadu, ladli scheme (2) in Andhra Pradesh and Delhi.
The innovation/best practices are being practiced by ICDS functionaries especially CDPOs so as to improve the
nutritional status of children and women. During monitoring visits, 45 CDPOs reported that they have adopted
innovations and best practices in their projects. The details are depicted in (Table 3.16). These are practiced by
involvement of schools, NGOs and Mahila Mandals by 17 CDPOs. Assistance of school principals for registering
Adolescent Girls for supplementary nutrition was taken by one CDPOs of Delhi. Total sanitation campaign was

32
adopted by 18 CDPOs and community participation was elicited by 17 CDPOs for wall painting of the centres.
Innovations and best practices adopted by one CDPO of Jammu & Kashmir resulted in increase in immunization
coverage and decrease in morbidity/mortality. CDPOs from Karnataka, Tamilnadu and Jharkhand encouraged AWW
to perform better by giving them appreciation awards/star grading, Focussed group discussion contacting elected
representative for seeking their cooperation in implementing ICDS.
3.1.6 Problems Faced by CDPOs in Implementation of ICDS Services
For proper implementation of the programme, it is essential that physical facilities and supplies are adequate. The
same was not seen during the visits. The CDPOs were asked to explain the problems faced by them if any, in
Implementing the programme in their projects and also to give specific suggestions for improvement. The same is
given in Tables (3.17 & 3.18).
Table : 3.17 Constraints/Problems in Implementation of ICDS as Reported by CDPOs
S.No. Problems/Constraints No. % N=84
1. Lack of Support from Subordinate 14 16.6
2. Lack of Proper Infrastructure
(office space,Telephone,AWC)
50 59.5
3. Shortage of Staff 21 25.0
4. Unavailability/delay in Supplies/Material 36 42.8
5. Lack of Funds 22 26.1
6 Lack of Community Participation 14 16.6
7 Additional work responsibility 31 36.9
8 Inadequate Training 14 16.6
9 Low honorarium/Irregular Salary 15 17.8
10 Political Interference 7 8.3
11 No vehicle 38 45.2

33
The constraints/problems faced were reported by 84 CDPOs out of 92 interviewed (Table 3.17). It may be
noted that more than half (59.5%)of the CDPOs have reported lack of proper insfrastructral facilities which include
temporary /Rented CDPOs office, no facility for telephone or inadequate toilet and water facility either at AWC or in
their office. In addition lack of proper buildings of AWC was also reported. 42.8 percent CDPOs were of the view
that delivery of services was being affected due unavailability or delay in supplies and material. The unavailability
of weighing machines, PSE kits, NHED kits and irregular supply of supplementary nutrition was mentioned by them.
The improper monitoring and supervision was reported by 45.2 percent CDPOs due to lack of vehicle CDPOs find it
very difficult to visit AWC which were at distant / far away places from their place of office 16.6 percent CDPOs
mentioned problems like lack of support from subordinates, inadequate training of functionaries and lack of
community participation in the ICDS programme. 36.9 percent CDPOs reported that they were unable to perform
their duties regularly and properly due to additional work/tasks assigned to them. Political interference (8.3%), low
honorarium/irregular salary (17.8%) and lack of funds (26.1%) were also some of the major problems/constraints
reported for improper implementation of the ICDS programme.
3.1.7 Suggestions given by CDPOs to improve the services of ICDS
The major suggestions given by CDPOs for improving implementation of ICDS programme include proper
infrastructural facilities at project level and as well as AWC level (33.6%).Convergence of services (66.6%)
especially the services provided by Health department. The coordination with health department is required in
delivery of services related to health check-up, immunization and referral. 61.9 percent CDPOs suggested that
adequate supply of material may improve the delivery of services. The responses of 71.4 percent CDPOs depicted
that community needs to be involved in the delivery of services so as to improve their participation in the
programme. Increase in honorarium of AWWs was suggested by 25.0 percent CDPOs so that they are more
committed to their work. The filling up of vacant posts so as to improve staff position was one of the suggestion
given by (29.7%)one third of CDPOs which seems to be a matter of concern. 15.1 percent CDPOs were of the view
that there is a need for strict monitoring supervision of services. These they suggested can be done by involving
PRIs and Mahila Mandals.
To bring about change in the knowledge, attitudes and practices of community especially women, it is essential that
they are provided complete and latest information imparted through Nutrition and Health Education. More than half
(58.3%) of the CDPOs viewed NHED as an important factor in improving ICDS.
Some of the suggestions given by CDPOs to improve the services of ICDS are given in the Table 3.18

34
Table 3.18 : Suggestions for Quality Improvement of ICDS
N=84
S.No. Suggestions No %
1 Proper Infrastructure 40 33.6
2 Monitoring and Supervision by Community/ Mahila
Mandal/ PRIs
18 15.1
3 Filling up of Vacant Posts 25 29.7
4 Adequate Supplies/Material 52 61.9
5 Vehicle/Transport 28 33.3
6 Training 14 16.6
7 Increase in Honorarium 21 25.0
8 Nutritional and Health Educational 49 58.3
9 Convergence of Services 56 66.6
10 Community Participation 60 71.4
3.1.8 Training Need Assessment
The Consultants during the visits were required to identify training requirements of ICDS functionaries. The
consultants identified that all ICDS functionaries i.e. CDPOs, supervisors and AWWs including PRIs are required to
be given different types of training (Table 3.19)
Table 3.19 : Training Need Assessment Identified by Consultants
S.No
Type of Training
CDPOs
No. %
Supervisors
No. %
AWWs
No. %
PRIs
No. %
1. Job Training 16 30.8 16 29.6 13 31.0 - -
2. Refresher 26 50.0 24 44.4 15 35.7 - -
3. Skills Training 19 36.5 24 44.4 19 47.6 - -
4. Sensitization
workshops
- - - - 28 77.7

35
Consultants suggested that training needs of functionaries include Job training for 30.8 percent CDPOs, 29.6 percent
Supervisors and 31.0 percent AWWs, and refresher training for CDPOs (50.0%); Supervisors 44.4 percent and
AWWs (35.7%) ; so that they are well aware of the recent developments in the field, regularorientation / skill training
on different subjects /areas was suggested by consultants. These include CDPOs (36.5%), Supervisors (44.4%) and
AWWs (47.6%) and supervising skills were recommended to be given to functionaries based on their job
responsibilities. Keeping in view the involvement of PRIs it was also suggested worth while to orient/sensitize PRIs
(77.7%).
Table 3.20 : Views of the CDPos About the Quality of Training Imparted to AWWs / Supervisors
S.No Views of CDPOs No. %
1. Adequately Trained 65 78.3
2. Needs improvement quality 18 21.6
3. Regular Refesher Training 52 62.6
4. Increased duration of Training 45 54.2
Training and supervision are integral part of the ICDS system. Inadequacy in Training was stated by CDPOs as one
of the constraints in implementation of ICDS therefore views of CDPOs were solicited on improving the quality of
training of AWWs/Supervisor (Table 3.20) As stated the above table 78.3 percent CDPOs were of the view that the
functionaries were adequately trained where as 21.6 percent CDPOs were not satisfied by the training being imparted
to them. A large number of CDPOs (62.6%) suggested regular refresher training to all the functionaries so as to
apprise them to recent developments and changes for improvement in the functioning. In addition to above
suggestion, increase in duration of training was also suggested by more than half of the CDPOs (54.2%) so that
enhancement of skills in delivery of services is emphasized during training.
36
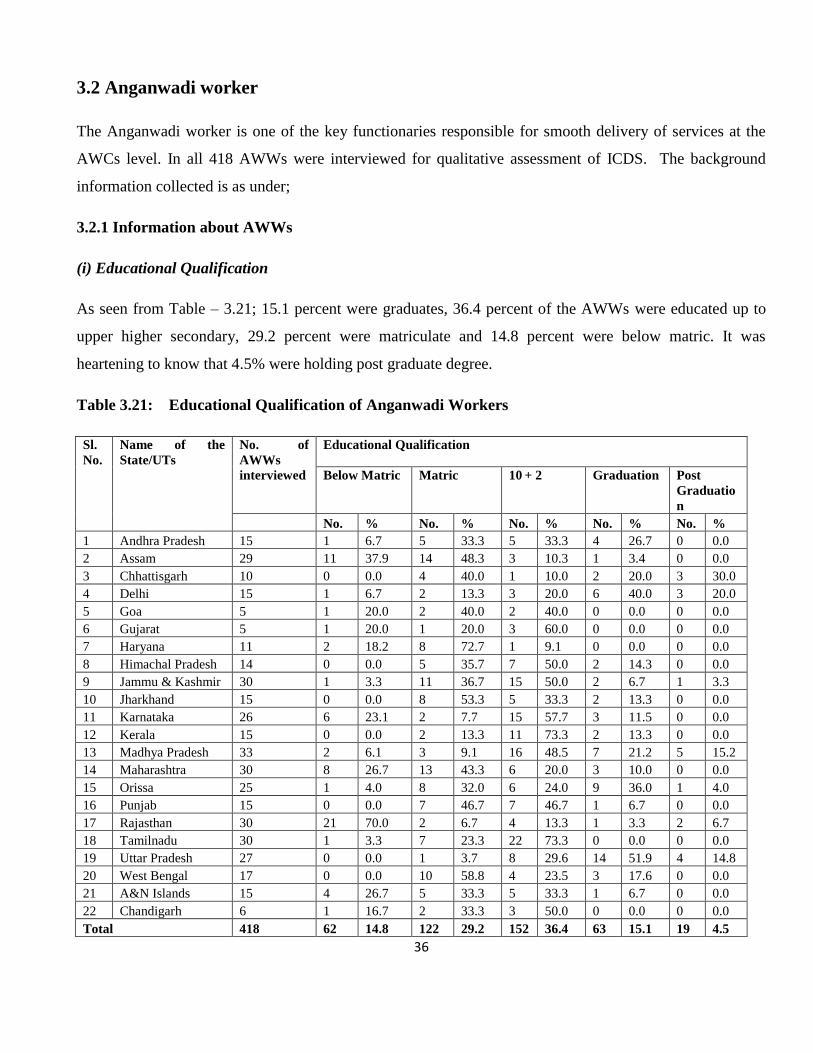
3.2 Anganwadi worker
The Anganwadi worker is one of the key functionaries responsible for smooth delivery of services at the
AWCs level. In all 418 AWWs were interviewed for qualitative assessment of ICDS. The background
information collected is as under;
3.2.1 Information about AWWs
(i) Educational Qualification
As seen from Table – 3.21; 15.1 percent were graduates, 36.4 percent of the AWWs were educated up to
upper higher secondary, 29.2 percent were matriculate and 14.8 percent were below matric. It was
heartening to know that 4.5% were holding post graduate degree.
Table 3.21: Educational Qualification of Anganwadi Workers
Sl.
No.
Name of the
State/UTs
No. of
AWWs
interviewed
Educational Qualification
Below Matric Matric 10 + 2 Graduation Post
Graduatio
n
No. % No. % No. % No. % No. %
1 Andhra Pradesh 15 1 6.7 5 33.3 5 33.3 4 26.7 0 0.0
2 Assam 29 11 37.9 14 48.3 3 10.3 1 3.4 0 0.0
3 Chhattisgarh 10 0 0.0 4 40.0 1 10.0 2 20.0 3 30.0
4 Delhi 15 1 6.7 2 13.3 3 20.0 6 40.0 3 20.0
5 Goa 5 1 20.0 2 40.0 2 40.0 0 0.0 0 0.0
6 Gujarat 5 1 20.0 1 20.0 3 60.0 0 0.0 0 0.0
7 Haryana 11 2 18.2 8 72.7 1 9.1 0 0.0 0 0.0
8 Himachal Pradesh 14 0 0.0 5 35.7 7 50.0 2 14.3 0 0.0
9 Jammu & Kashmir 30 1 3.3 11 36.7 15 50.0 2 6.7 1 3.3
10 Jharkhand 15 0 0.0 8 53.3 5 33.3 2 13.3 0 0.0
11 Karnataka 26 6 23.1 2 7.7 15 57.7 3 11.5 0 0.0
12 Kerala 15 0 0.0 2 13.3 11 73.3 2 13.3 0 0.0
13 Madhya Pradesh 33 2 6.1 3 9.1 16 48.5 7 21.2 5 15.2
14 Maharashtra 30 8 26.7 13 43.3 6 20.0 3 10.0 0 0.0
15 Orissa 25 1 4.0 8 32.0 6 24.0 9 36.0 1 4.0
16 Punjab 15 0 0.0 7 46.7 7 46.7 1 6.7 0 0.0
17 Rajasthan 30 21 70.0 2 6.7 4 13.3 1 3.3 2 6.7
18 Tamilnadu 30 1 3.3 7 23.3 22 73.3 0 0.0 0 0.0
19 Uttar Pradesh 27 0 0.0 1 3.7 8 29.6 14 51.9 4 14.8
20 West Bengal 17 0 0.0 10 58.8 4 23.5 3 17.6 0 0.0
21 A&N Islands 15 4 26.7 5 33.3 5 33.3 1 6.7 0 0.0
22 Chandigarh 6 1 16.7 2 33.3 3 50.0 0 0.0 0 0.0
Total 418 62 14.8 122 29.2 152 36.4 63 15.1 19 4.5

37
Among all states Chhattisgarh reported to have maximum percentage (30.0%) of postgraduate
AWWs followed by Delhi (20.0%), Madhya Pradesh (15.2%) and Uttar Pradesh (14.8%). The educational
qualification of AWWs from Rajasthan seemed to be poor in comparison to above states as 70.0 percent of
AWWs were below matric.
(ii) Status of Training
The status of training of AWWs as reflected in Table - 3.22 shows that 96.7percent AWWs were trained. In
order to deliver the services properly, AWWs on recruitment are provided induction training till the time
job training (one month course) is conducted or them.
Table 3.22 Status of Training of Aganwadi Workers
Sl.
No.
Name of the
State/UTs
No. of
AWWs
No. of
AWWsTrained
Type of Training
Induction Job
Training
Refresher Other
Training
No. % No. % No. % No. % No. %
1 Andhra Pradesh 15 15 100.0 5 33.3 15 100.0 9 60.0 0 0.0
2 Assam 29 24 82.8 1 3.4 22 75.9 14 48.3 10 34.5
3 Chhattisgarh 10 10 100.0 2 20.0 10 100.0 8 80.0 3 30.0
4 Delhi 15 15 100.0 5 33.3 14 93.3 14 93.3 2 13.3
5 Goa 5 5 100.0 0 0.0 5 100.0 5 100.0 1 20.0
6 Gujarat 5 5 100.0 1 20.0 4 80.0 5 100.0 5 100.0
7 Haryana 11 11 100.0 6 54.5 5 45.5 11 100.0 2 18.2
8 Himachal Pradesh 14 12 85.7 9 64.3 12 85.7 12 85.7 1 7.1
9 Jammu & Kashmir 30 30 100.0 1 3.3 29 96.7 15 50.0 0 0.0
10 Jharkhand 15 15 100.0 10 66.7 11 73.3 12 80.0 2 13.3
11 Karnataka 26 26 100.0 10 38.5 17 65.4 10 38.5 2 7.7
12 Kerala 15 15 100.0 0 0.0 15 100.0 10 66.7 1 6.7
13 Madhya Pradesh 33 31 93.9 23 69.7 26 78.8 20 60.6 0 0.0
14 Maharashtra 30 29 96.7 27 90.0 14 46.7 27 90.0 6 20.0
15 Orissa 25 24 96.0 24 96.0 23 92.0 12 48.0 2 8.0
16 Punjab 15 15 100.0 6 40.0 11 73.3 11 73.3 1 6.7
17 Rajasthan 30 30 100.0 20 66.7 22 73.3 11 36.7 1 3.3
18 Tamilnadu 30 30 100.0 4 13.3 27 90.0 15 50.0 9 30.0
19 Uttar Pradesh 27 26 96.3 13 48.1 23 85.2 12 44.4 2 7.4
20 West Bengal 17 16 94.1 6 35.3 12 70.6 10 58.8 0 0.0
21 A&N Islands 15 14 93.3 0 0.0 13 86.7 4 26.7 0 0.0
22 Chandigarh 6 6 100.0 6 100.0 6 100.0 6 100.0 0 0.0
Total 418 404 96.7 179 42.8 336 80.4 253 60.5 50 12.0
38
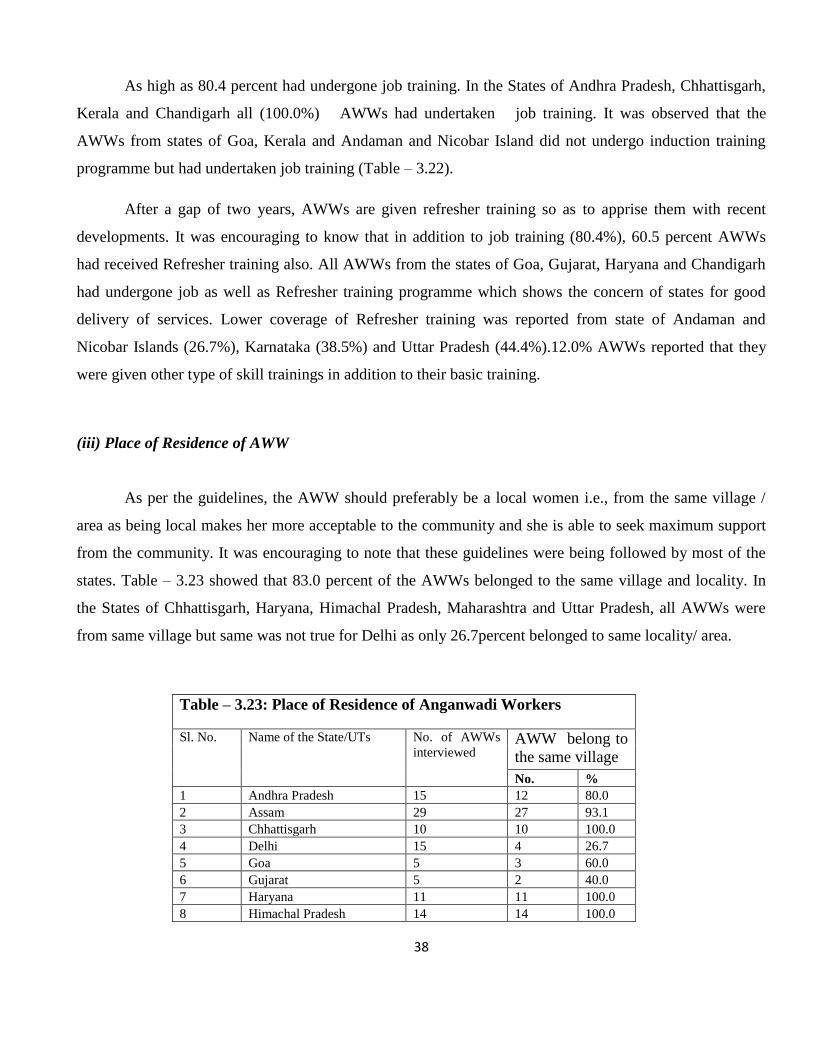
As high as 80.4 percent had undergone job training. In the States of Andhra Pradesh, Chhattisgarh,
Kerala and Chandigarh all (100.0%) AWWs had undertaken job training. It was observed that the
AWWs from states of Goa, Kerala and Andaman and Nicobar Island did not undergo induction training
programme but had undertaken job training (Table – 3.22).
After a gap of two years, AWWs are given refresher training so as to apprise them with recent
developments. It was encouraging to know that in addition to job training (80.4%), 60.5 percent AWWs
had received Refresher training also. All AWWs from the states of Goa, Gujarat, Haryana and Chandigarh
had undergone job as well as Refresher training programme which shows the concern of states for good
delivery of services. Lower coverage of Refresher training was reported from state of Andaman and
Nicobar Islands (26.7%), Karnataka (38.5%) and Uttar Pradesh (44.4%).12.0% AWWs reported that they
were given other type of skill trainings in addition to their basic training.
(iii) Place of Residence of AWW
As per the guidelines, the AWW should preferably be a local women i.e., from the same village /
area as being local makes her more acceptable to the community and she is able to seek maximum support
from the community. It was encouraging to note that these guidelines were being followed by most of the
states. Table – 3.23 showed that 83.0 percent of the AWWs belonged to the same village and locality. In
the States of Chhattisgarh, Haryana, Himachal Pradesh, Maharashtra and Uttar Pradesh, all AWWs were
from same village but same was not true for Delhi as only 26.7percent belonged to same locality/ area.
Table – 3.23: Place of Residence of Anganwadi Workers
Sl. No. Name of the State/UTs No. of AWWs
interviewed AWW belong to
the same village
No. %
1 Andhra Pradesh 15 12 80.0
2 Assam 29 27 93.1
3 Chhattisgarh 10 10 100.0
4 Delhi 15 4 26.7
5 Goa 5 3 60.0
6 Gujarat 5 2 40.0
7 Haryana 11 11 100.0
8 Himachal Pradesh 14 14 100.0

39
9 Jammu & Kashmir 30 28 93.3
10 Jharkhand 15 14 93.3
11 Karnataka 26 23 88.5
12 Kerala 15 12 80.0
13 Madhya Pradesh 33 27 81.8
14 Maharashtra 30 30 100.0
15 Orissa 25 21 84.0
16 Punjab 15 10 66.7
17 Rajasthan 30 26 86.7
18 Tamilnadu 30 21 70.0
19 Uttar Pradesh 27 27 100.0
20 West Bengal 17 6 35.3
21 A&N Islands 15 14 93.3
22 Chandigarh 6 5 83.3
Total 418 347 83.0
3.2.2 Physical Infrastructure of AWCs
Data was collected on different aspects concerning physical set up of AWCs i.e., the kind of building/
place from where the AWC was being run, its overall condition and location, availability/ adequacy of
indoor and outdoor space in AWCs etc.
(i) Type of Building
Table – 3.24 give details about the type of building in which the AWCs were located. Out of the 418
AWCs visited, 303 (72.5%) were located in pucca buildings, 19.1 percent were in semi pucca structures
and 7.2 percent were in kutcha building. Very few (1.2%) AWCs were running in open.
There is no denial of the fact that AWCs should have sufficient indoor and outdoor space for group
activities of children. Ideally each AWC should have sufficient covered floor area to accommodate children
to sit on for different types of individual and group activities. Other than this, it should have sufficient
space for display of work of children as well as chart’s, posters and pictures for learning activities.
Table 3.24: Type of Building of AWCs
Sl.
No.
Name of the
State/UTs
No. of
AWs
Type of building
Kutcha Semi Pucca Pucca Open Space
No. % No. % No. % No. %
1 Andhra Pradesh 15 1 6.7 5 33.3 9 60.0 0 0.0
2 Assam 29 3 10.3 3 10.3 23 79.3 0 0.0

40
3 Chhattisgarh 10 0 0.0 0 0.0 10 100.0 0 0.0
4 Delhi 15 0 0.0 1 6.7 14 93.3 0 0.0
5 Goa 5 0 0.0 0 0.0 5 100.0 0 0.0
6 Gujarat 5 0 0.0 2 40.0 3 60.0 0 0.0
7 Haryana 11 0 0.0 0 0.0 11 100.0 0 0.0
8 Himachal Pradesh 14 0 0.0 3 21.4 11 78.6 0 0.0
9 Jammu & Kashmir 30 5 16.7 10 33.3 15 50.0 0 0.0
10 Jharkhand 15 6 40.0 1 6.7 8 53.3 0 0.0
11 Karnataka 26 0 0.0 4 15.4 21 80.8 1 3.8
12 Kerala 15 2 13.3 3 20.0 10 66.7 0 0.0
13 Madhya Pradesh 33 2 6.1 10 30.3 21 63.6 0 0.0
14 Maharashtra 30 0 0.0 6 20.0 24 80.0 0 0.0
15 Orissa 25 1 4.0 4 16.0 20 80.0 0 0.0
16 Punjab 15 0 0.0 7 46.7 8 53.3 0 0.0
17 Rajasthan 30 4 13.3 6 20.0 20 66.7 0 0.0
18 Tamilnadu 30 1 3.3 11 36.7 18 60.0 0 0.0
19 Uttar Pradesh 27 0 0.0 1 3.7 23 85.2 3 11.1
20 West Bengal 17 2 11.8 2 11.8 12 70.6 1 5.9
21 A&N Islands 15 3 20.0 1 6.7 11 73.3 0 0.0
22 Chandigarh 6 0 0.0 0 0.0 6 100.0 0 0.0
Total 418 30 7.2 80 19.1 303 72.5 5 1.2
Information was thus gathered in respect of availability of indoor and outdoor space and is
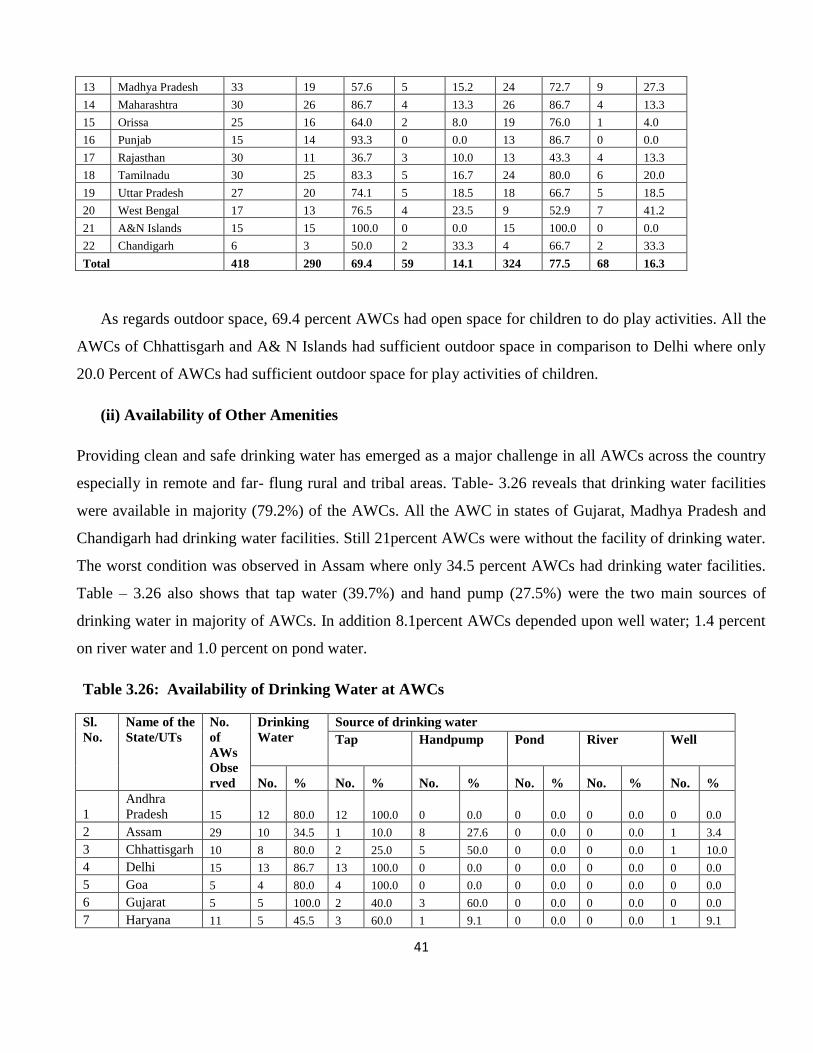
presented in Table- 3.25. It shows that majority of AWCs (77.5%) had sufficient indoor space available to
them. Lack of space was observed in majority of AWCs 60.0 percent of percent Andhra Pradesh, West
Bengal (41.2%), and Jharkhand (40.0%).
Table 3.25: Availability of space
Sl.
No.
Name of the
State/UT
No. of
AWs
Observed
Outdoor Space Indoor Space
Available Available but
inadequate
Available Available but
inadequate
No. % No. % No. % No. %
1 Andhra Pradesh 15 4 26.7 8 53.3 6 40.0 9 60.0
2 Assam 29 21 72.4 8 27.6 21 72.4 8 27.6
3 Chhattisgarh 10 10 100.0 0 0.0 10 100.0 0 0.0
4 Delhi 15 3 20.0 3 20.0 12 80.0 3 20.0
5 Goa 5 4 80.0 1 20.0 5 100.0 0 0.0
6 Gujarat 5 3 60.0 0 0.0 5 100.0 0 0.0
7 Haryana 11 10 90.9 0 0.0 11 100.0 0 0.0
8 Himachal Pradesh 14 12 85.7 1 7.1 13 92.9 1 7.1
9 Jammu & Kashmir 30 23 76.7 0 0.0 30 100.0 0 0.0
10 Jharkhand 15 8 53.3 3 20.0 9 60.0 6 40.0
11 Karnataka 26 16 61.5 5 19.2 22 84.6 3 11.5
12 Kerala 15 14 93.3 0 0.0 15 100.0 0 0.0
41
13 Madhya Pradesh 33 19 57.6 5 15.2 24 72.7 9 27.3
14 Maharashtra 30 26 86.7 4 13.3 26 86.7 4 13.3
15 Orissa 25 16 64.0 2 8.0 19 76.0 1 4.0
16 Punjab 15 14 93.3 0 0.0 13 86.7 0 0.0
17 Rajasthan 30 11 36.7 3 10.0 13 43.3 4 13.3
18 Tamilnadu 30 25 83.3 5 16.7 24 80.0 6 20.0
19 Uttar Pradesh 27 20 74.1 5 18.5 18 66.7 5 18.5
20 West Bengal 17 13 76.5 4 23.5 9 52.9 7 41.2
21 A&N Islands 15 15 100.0 0 0.0 15 100.0 0 0.0
22 Chandigarh 6 3 50.0 2 33.3 4 66.7 2 33.3
Total 418 290 69.4 59 14.1 324 77.5 68 16.3
As regards outdoor space, 69.4 percent AWCs had open space for children to do play activities. All the
AWCs of Chhattisgarh and A& N Islands had sufficient outdoor space in comparison to Delhi where only
20.0 Percent of AWCs had sufficient outdoor space for play activities of children.
(ii) Availability of Other Amenities
Providing clean and safe drinking water has emerged as a major challenge in all AWCs across the country
especially in remote and far- flung rural and tribal areas. Table- 3.26 reveals that drinking water facilities
were available in majority (79.2%) of the AWCs. All the AWC in states of Gujarat, Madhya Pradesh and
Chandigarh had drinking water facilities. Still 21percent AWCs were without the facility of drinking water.
The worst condition was observed in Assam where only 34.5 percent AWCs had drinking water facilities.
Table – 3.26 also shows that tap water (39.7%) and hand pump (27.5%) were the two main sources of
drinking water in majority of AWCs. In addition 8.1percent AWCs depended upon well water; 1.4 percent
on river water and 1.0 percent on pond water.
Table 3.26: Availability of Drinking Water at AWCs
Sl.
No.
Name of the
State/UTs
No.
of
AWs
Obse
rved
Drinking
Water
Source of drinking water
Tap Handpump Pond River Well
No. % No. % No. % No. % No. % No. %
1
Andhra
Pradesh 15 12 80.0 12 100.0 0 0.0 0 0.0 0 0.0 0 0.0
2 Assam 29 10 34.5 1 10.0 8 27.6 0 0.0 0 0.0 1 3.4
3 Chhattisgarh 10 8 80.0 2 25.0 5 50.0 0 0.0 0 0.0 1 10.0
4 Delhi 15 13 86.7 13 100.0 0 0.0 0 0.0 0 0.0 0 0.0
5 Goa 5 4 80.0 4 100.0 0 0.0 0 0.0 0 0.0 0 0.0
6 Gujarat 5 5 100.0 2 40.0 3 60.0 0 0.0 0 0.0 0 0.0
7 Haryana 11 5 45.5 3 60.0 1 9.1 0 0.0 0 0.0 1 9.1

42
8
Himachal
Pradesh 14 13 92.9 10 76.9 3 21.4 0 0.0 0 0.0 0 0.0
9
Jammu &
Kashmir 30 28 93.3 24 85.7 1 3.3 0 0.0 0 0.0 3 10.0
10 Jharkhand 15 13 86.7 0 0.0 9 60.0 1 6.7 0 0.0 3 20.0
11 Karnataka 26 23 88.5 9 39.1 7 26.9 1 3.8 1 3.8 5 19.2
12 Kerala 15 13 86.7 1 7.7 0 0.0 0 0.0 0 0.0 12 80.0
13
Madhya
Pradesh 33 33 100.0 22 66.7 7 21.2 0 0.0 4 12.1 0 0.0
14 Maharashtra 30 23 76.7 12 52.2 8 26.7 1 3.3 0 0.0 2 6.7
15 Orissa 25 16 64.0 4 25.0 10 40.0 0 0.0 0 0.0 2 8.0
16 Punjab 15 14 93.3 8 57.1 6 40.0 0 0.0 0 0.0 0 0.0
17 Rajasthan 30 12 40.0 4 33.3 8 26.7 0 0.0 0 0.0 0 0.0
18 Tamilnadu 30 28 93.3 19 67.9 5 16.7 1 3.3 1 3.3 2 6.7
19
Uttar
Pradesh 27 24 88.9 0 0.0 24 88.9 0 0.0 0 0.0 0 0.0
20 West Bengal 17 15 88.2 4 26.7 9 52.9 0 0.0 0 0.0 2 11.8
21
A&N
Islands 15 13 86.7 13 100.0 0 0.0 0 0.0 0 0.0 0 0.0
22 Chandigarh 6 6 100.0 5 83.3 1 16.7 0 0.0 0 0.0 0 0.0
Total
418 331 79.2 172 52.0 115 27.5 4 1.0 6 1.4 34 8.1
In Goa, all the AWCs were provided with water from tap. Table- 3.27 depicts the availability of
toilet facility at the AWCs. The data shows that only half of the AWC (50.2%) had toilet facilities. In
Rajasthan & Orissa only 16.7 percent and 12.0 percent AWC respectively had toilet facility, which shows a
grim picture and needs to be addressed.
Table 3.27: Availability of Toilet Facility at AWCs
Sl. No. Name of the State/UT No. of AWs
Observed
Toilet Facility
No. %
1 Andhra Pradesh 15 9 60.0
2 Assam 29 7 24.1
3 Chhattisgarh 10 7 70.0
4 Delhi 15 13 86.7
5 Goa 5 2 40.0
6 Gujarat 5 2 40.0
7 Haryana 11 5 45.5
8 Himachal Pradesh 14 8 57.1
9 Jammu & Kashmir 30 19 63.3
10 Jharkhand 15 6 40.0
11 Karnataka 26 20 76.9
12 Kerala 15 11 73.3

43
13 Madhya Pradesh 33 18 54.5
14 Maharashtra 30 14 46.7
15 Orissa 25 3 12.0
16 Punjab 15 8 53.3
17 Rajasthan 30 5 16.7
18 Tamilnadu 30 19 63.3
19 Uttar Pradesh 27 15 55.6
20 West Bengal 17 5 29.4
21 A&N Islands 15 10 66.7
22 Chandigarh 6 4 66.7
Total 418 210 50.2
3.2.3 Services Provided at AWC
3.2.3.1 Supplementary Nutrition
The supplementary nutrition programme under ICDS aims to bridge the calorie and protein gap in children
and women thereby improving their nutritional status and preventing malnutrition.
(a) Selection of Beneficiaries
Based on the guidelines issued from time to time by the Ministry of Women and Child Development,
Government of India in context for selection of beneficiaries, Supplementary Nutrition is provided to
children below 6yrs of age and to pregnant & nursing mothers. Information was collected on the selection
criteria of beneficiaries for supplementary nutrition being adopted by the states and the same has been
depicted in Table – 3.28. Responses were received from 361 out of 418 AWWs interviewed. It can be
stipulated that in only 21.7 percent AWC there was 100.0 percent coverage of children for supplementary
nutrition i.e., all those present at AWC were provided supplementary nutrition. Supplementary nutrition
was reported to be given as per ICDS norms by (80.9%) i.e., children 3-6 years and pregnant and lactating
mothers. All the AWWs from the states of Goa, Gujarat and West Bengal reported following the ICDS
norms for selection of beneficiaries. 19.1 percent AWWs reported that they did not follow any specific
guidelines for selection of supplementary beneficiaries.
Table 3.28: Criteria for selection of beneficiaries
Sl.
No.
Name of the
State/UT
No. of AWs
Interviewed
No. of AWs
responded
As per ICDS
norms
No Specific
Criteria
No. % No. %
1 Andhra Pradesh 15 14 13 92.9 1 7.1

44
2 Assam 29 25 20 80.0 5 20.0
3 Chhattisgarh 10 10 10 100.0 0 0.0
4 Delhi 15 15 13 86.7 2 13.3
5 Goa 5 5 5 100.0 0 0.0
6 Gujarat 5 5 5 100.0 0 0.0
7 Haryana 11 9 6 66.7 3 33.3
8 Himachal Pradesh 14 12 4 33.3 8 66.7
9 Jammu & Kashmir 30 27 13 48.1 14 51.9
10 Jharkhand 15 14 10 71.4 4 28.6
11 Karnataka 26 21 18 85.7 3 14.3
12 Kerala 15 14 10 71.4 4 28.6
13 Madhya Pradesh 33 31 23 74.2 8 25.8
14 Maharashtra 30 23 22 95.7 1 4.3
15 Orissa 25 25 21 84.0 4 16.0
16 Punjab 15 15 12 80.0 3 20.0
17 Rajasthan 30 30 30 100.0 0 0.0
18 Tamilnadu 30 26 19 73.1 7 26.9
19 Uttar Pradesh 27 18 16 88.9 2 11.1
20 West Bengal 17 17 17 100.0 0 0.0
21 A&N Islands 15 0 0 0
22 Chandigarh 6 5 5 100.0 0 0.0
Total 418 361 292 80.9 69 19.1
66.7 percent AWWs in Himachal Pradesh and 51.9 percent in Jammu and Kashmir were states which were
not following any specific criteria in comparison to all the AWWs from the states of Goa, Gujarat, West
Bengal and Chandigarh who reported following the ICDS norms for selection of beneficiaries while
enrolling beneficiaries under the ICDS scheme.
(b) Type of Food Provided & Acceptability
It has been observed that states were either providing cooked food or Ready- To- Eat (RTE) food. In some
states both cooked food and RTE was being served to children as supplementary nutrition. Table- 3.29
shows that 58.6 percent AWWs provided cooked meals and 9.3 percent AWWs distributed RTE food. 30.9
percent AWWs provided both cooked food & RTE as supplementary nutrition. Practice of providing
cooked meals was more prevalent (100.0% coverage) in Delhi, Goa, Gujarat, Jammu & Kashmir and West
Bengal where as states of Rajasthan and Karnataka were providing both cooked meals as well as RTE. In
Andhra Pradesh 93.3 percent of food items were RTE, also some of the projects in Andhra Pradesh
provided modified therapeutic foods as well.
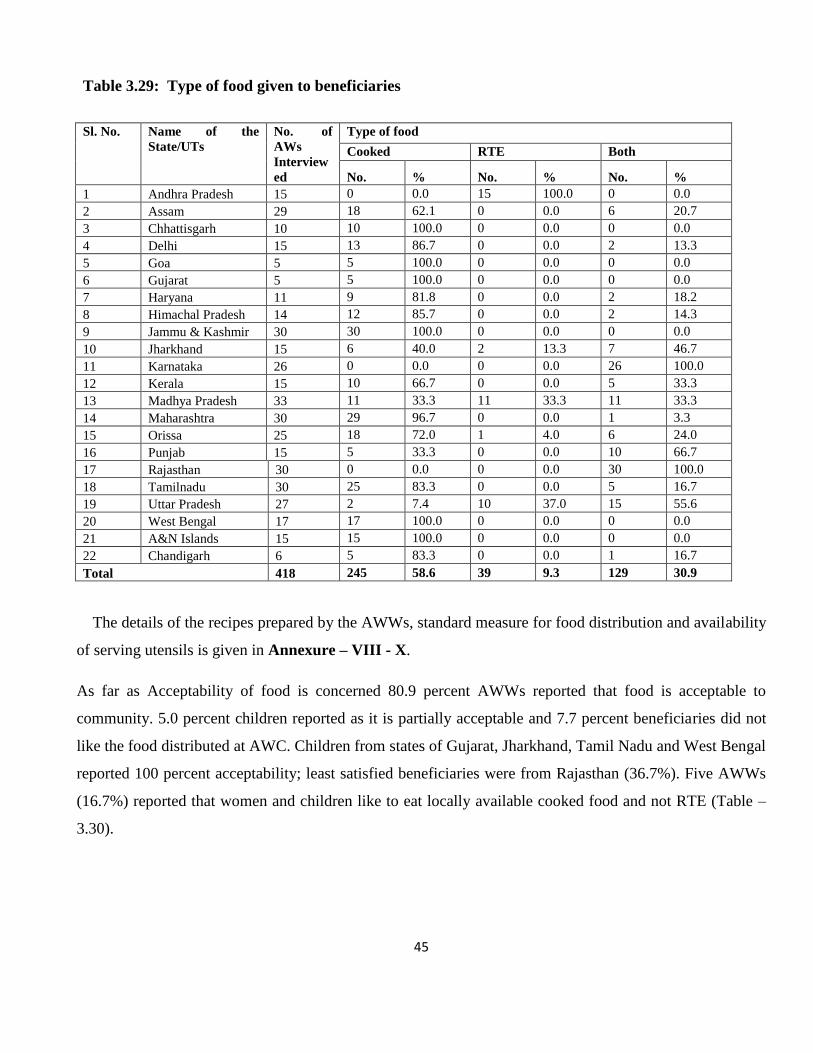
45
Table 3.29: Type of food given to beneficiaries
Sl. No. Name of the
State/UTs
No. of
AWs
Interview
ed
Type of food
Cooked RTE Both
No. % No. % No. %
1 Andhra Pradesh 15 0 0.0 15 100.0 0 0.0
2 Assam 29 18 62.1 0 0.0 6 20.7
3 Chhattisgarh 10 10 100.0 0 0.0 0 0.0
4 Delhi 15 13 86.7 0 0.0 2 13.3
5 Goa 5 5 100.0 0 0.0 0 0.0
6 Gujarat 5 5 100.0 0 0.0 0 0.0
7 Haryana 11 9 81.8 0 0.0 2 18.2
8 Himachal Pradesh 14 12 85.7 0 0.0 2 14.3
9 Jammu & Kashmir 30 30 100.0 0 0.0 0 0.0
10 Jharkhand 15 6 40.0 2 13.3 7 46.7
11 Karnataka 26 0 0.0 0 0.0 26 100.0
12 Kerala 15 10 66.7 0 0.0 5 33.3
13 Madhya Pradesh 33 11 33.3 11 33.3 11 33.3
14 Maharashtra 30 29 96.7 0 0.0 1 3.3
15 Orissa 25 18 72.0 1 4.0 6 24.0
16 Punjab 15 5 33.3 0 0.0 10 66.7
17 Rajasthan 30 0 0.0 0 0.0 30 100.0
18 Tamilnadu 30 25 83.3 0 0.0 5 16.7
19 Uttar Pradesh 27 2 7.4 10 37.0 15 55.6
20 West Bengal 17 17 100.0 0 0.0 0 0.0
21 A&N Islands 15 15 100.0 0 0.0 0 0.0
22 Chandigarh 6 5 83.3 0 0.0 1 16.7
Total 418 245 58.6 39 9.3 129 30.9
The details of the recipes prepared by the AWWs, standard measure for food distribution and availability
of serving utensils is given in Annexure – VIII - X.
As far as Acceptability of food is concerned 80.9 percent AWWs reported that food is acceptable to
community. 5.0 percent children reported as it is partially acceptable and 7.7 percent beneficiaries did not
like the food distributed at AWC. Children from states of Gujarat, Jharkhand, Tamil Nadu and West Bengal
reported 100 percent acceptability; least satisfied beneficiaries were from Rajasthan (36.7%). Five AWWs
(16.7%) reported that women and children like to eat locally available cooked food and not RTE (Table –
3.30).

46
Table 3.30: Acceptability of Food Among Beneficiaries as Reported by AWWs
Sl.
No.
Name of the
State/UTs
No. of AWs
Observed
Acceptability of food
Acceptable Not Acceptable Partially
Acceptable
No. % No. % No. %
1 Andhra Pradesh 15 11 73.3 1 6.7 3 20.0
2 Assam 29 23 79.3 1 3.4 0 0.0
3 Chhattisgarh 10 9 90.0 1 10.0 0 0.0
4 Delhi 15 9 60.0 2 13.3 4 26.7
5 Goa 5 5 100.0 0 0.0 0 0.0
6 Gujarat 5 5 100.0 0 0.0 0 0.0
7 Haryana 11 9 81.8 2 18.2 0 0.0
8 Himachal Pradesh 14 13 92.9 0 0.0 1 7.1
9 Jammu & Kashmir 30 23 76.7 6 20.0 1 3.3
10 Jharkhand 15 15 100.0 0 0.0 0 0.0
11 Karnataka 26 18 69.2 2 7.7 6 23.1
12 Kerala 15 15 100.0 0 0.0 0 0.0
13 Madhya Pradesh 33 31 93.9 0 0.0 2 6.1
14 Maharashtra 30 25 83.3 1 3.3 4 13.3
15 Orissa 25 24 96.0 1 4.0 0 0.0
16 Punjab 15 11 73.3 1 6.7 3 20.0
17 Rajasthan 30 11 36.7 13 43.3 6 20.0
18 Tamilnadu 30 30 100.0 0 0.0 0 0.0
19 Uttar Pradesh 27 22 81.5 2 7.4 3 11.1
20 West Bengal 17 17 100.0 0 0.0 0 0.0
21 A&N Islands 15 15 100.0 0 0.0 0 0.0
22 Chandigarh 6 6 100.0 0 0.0 0 0.0
Total 418 347 80.9 33 7.7 33 5.0
The quality of food was checked and tasted by the consultants who visited AWCs for monitoring. Out of
418 AWC visited, quality of food was checked in 332 AWC. It may be mentioned that 70.2 percent found
the quality of food to be good followed by 25.6 percent who found quality of food as average and 4.2
percent as poor. Consultants from Gujarat, Kerala, and Andaman & Nicobar Islands were completely
satisfied (Table- 3.31) with the quality of food. The poor quality of food was observed in few AWCs of the
states/ UTs of Delhi (13.3 %), Himachal Pradesh (12.5%), Jammu and Kashmir (14.3%), Madhya Pradesh
(6.5%), Orissa (5.0%), Rajasthan (10.3%) and Karnataka (5.6%).

47
Table 3.31 Quality of Food (As Reported by Consultants)
Quality of food
Sl.
No.
Name of the State/Uts No. of
AWs
Obser
ved
No. of AWCs
in which
food was
tested
Good Average Poor (non-
acceptable)
No. % No. % No. %
1 Andhra Pradesh 15 13 12 92.3 1 7.7 0 0.0
2 Assam 29 18 15 83.3 3 16.7 0 0.0
3 Chhattisgarh 10 9 6 66.7 3 33.3 0 0.0
4 Delhi 15 15 8 53.3 5 33.3 2 13.3
5 Goa 5 0 0 0.0 0 0.0 0 0.0
6 Gujarat 5 3 3 100.0 0 0.0 0 0.0
7 Haryana 11 8 4 50.0 4 50.0 0 0.0
8 Himachal Pradesh 14 8 4 50.0 3 37.5 1 12.5
9 Jammu & Kashmir 30 28 21 75.0 3 10.7 4 14.3
10 Jharkhand 15 11 8 72.7 3 27.3 0 0.0
11 Karnataka 26 18 12 66.7 5 27.8 1 5.6
12 Kerala 15 11 11 100.0 0 0.0 0 0.0
13 Madhya Pradesh 33 31 26 83.9 3 9.7 2 6.5
14 Maharashtra 30 26 22 84.6 4 15.4 0 0.0
15 Orissa 25 20 4 20.0 15 75.0 1 5.0
16 Punjab 15 11 5 45.5 6 54.5 0 0.0
17 Rajasthan 30 29 11 37.9 15 51.7 3 10.3
18 Tamilnadu 30 21 20 95.2 1 4.8 0 0.0
19 Uttar Pradesh 27 18 10 55.6 8 44.4 0 0.0
20 West Bengal 17 16 15 93.8 1 6.3 0 0.0
21 A&N Islands 15 14 14 100.0 0 0.0 0 0.0
22 Chandigarh 6 4 2 50.0 2 50.0 0 0.0
Total 418 332 233 70.2 85 25.6 14 4.2
(C) Source of Supplementary Nutrition Supplied
The supplementary nutrition in ICDS is being provided at the state level. Some of the State Governments
procure food from other agencies like CARE and WFP. Table- 3.32 outlined the sources of procuring
supplementary nutrition in the AWCs visited by the consultants. The available data revealed that in
majority 92.9 percent projects, the supplementary nutrition is provided by State government and other
sources mentioned by the AWWs were WFP (2.6%), CARE (1.1%) and various state level NGOs (3.4%).
Food of WFP is distributed in the states of Jammu & Kashmir, Karnataka and Kerala.

48
Table 3.32: Source of Supplementary Nutrition Supplied at AWCs
Sl.
No.
Name of the
State/UT
No. of AWs
Interviewed
No. of
AWs
responded
Type of food provided to the AWCs
State Govt. CARE
food
WFP Food Others*
No. % No. % No. % No. %
1 Andhra Pradesh 15 15 13 86.7 0 0.0 0 0.0 2 13.3
2 Assam 29 7 4 57.1 0 0.0 0 0.0 3 42.9
3 Chhattisgarh 10 10 10 100.0 0 0.0 0 0.0 0 0.0
4 Delhi 15 10 6 60.0 0 0.0 0 0.0 4 40.0
5 Goa 5 5 5 100.0 0 0.0 0 0.0 0 0.0
6 Gujarat 5 5 5 100.0 0 0.0 0 0.0 0 0.0
7 Haryana 11 7 5 71.4 0 0.0 0 0.0 2 28.6
8 Himachal Pradesh 14 13 13 100.0 0 0.0 0 0.0 0 0.0
9 Jammu & Kashmir 30 30 26 86.7 3 10.0 1 3.3 0 0.0
10 Jharkhand 15 14 13 92.9 0 0.0 0 0.0 1 7.1
11 Karnataka 26 26 19 73.1 0 0.0 7 26.9 0 0.0
12 Kerala 15 14 13 92.9 0 0.0 1 7.1 0 0.0
13 Madhya Pradesh 33 33 32 97.0 0 0.0 1 3.0 0 0.0
14 Maharashtra 30 28 28 100.0 0 0.0 0 0.0 0 0.0
15 Orissa 25 23 23 100.0 0 0.0 0 0.0 0 0.0
16 Punjab 15 14 13 92.9 1 7.1 0 0.0 0 0.0
17 Rajasthan 30 30 30 100.0 0 0.0 0 0.0 0 0.0
18 Tamilnadu 30 30 30 100.0 0 0.0 0 0.0 0 0.0
19 Uttar Pradesh 27 27 26 96.3 0 0.0 0 0.0 1 3.7
20 West Bengal 17 17 17 100.0 0 0.0 0 0.0 0 0.0
21 A&N Islands 15 14 14 100.0 0 0.0 0 0.0 0 0.0
22 Chandigarh 6 6 6 100.0 0 0.0 0 0.0 0 0.0
Total 418 378 351 92.9 4 1.1 10 2.6 13 3.4
* SHG, Local purchase Pvt. Company etc.
(d) Community Contribution/ Support for Supplementary Nutrition
ICDS has been envisaged and conceptualized as a community based programme. The support provided by
community for supplementary nutrition is reported in Table-3.33. AWWs stated that they got community
support in the form of providing water/ water filter for children (6.1%), utensils for cooking (5.0%), food
items (19.2%) and fuel (0.6%). Community/ Mothers also help AWWs in cooking/distribution of
supplementary nutrition (11.9%). It was observed that more than half (57.2%) of the community members
were not contributing anything. The community participation component needs to be strengthened as far as
ICDS programme is concerned.

49
Table 3.33 Community Contribution/Support for Supplementary Nutrition
Sl.
No.
Name of the
State/UT
No. of
AWs
Intervi
-ewed
No. of
AWs
respo-
nded
Contribution
Provided
water
/water
filter
Provided
utensils
Provided
ration/
food
items
Provided
fuel
Cooking
/distributi
on of food
None
No. % No. % No. % No. % No. % No. %
1 Andhra Pradesh 15 15 2 13.3 1 6.7 0 0.0 0 0.0 1 6.7 11 73.3
2 Assam 29 21 2 9.5 2 9.5 5 23.8 2 9.5 9 42.9 1 4.8
3 Chhattisgarh 10 5 0 0.0 0 0.0 1 20.0 0 0.0 4 80.0 0 0.0
4 Delhi 15 13 0 0.0 2 15.4 2 15.4 0 0.0 1 7.7 8 61.5
5 Goa 5 4 1 25.0 0 0.0 3 75.0 0 0.0 0 0.0 0 0.0
6 Gujarat 5 5 0 0.0 0 0.0 4 80.0 0 0.0 1 20.0 0 0.0
7 Haryana 11 11 0 0.0 0 0.0 1 9.1 0 0.0 8 72.7 2 18.2
8
Himachal
Pradesh 14 11 1 9.1 0 0.0 3 27.3 0 0.0 0 0.0 7
63.6
9
Jammu &
Kashmir 30 22 1 4.5 1 4.5 4 18.2 0 0.0 0 0.0 16
72.7
10 Jharkhand 15 15 1 6.7 0 0.0 6 40.0 0 0.0 2 13.3 6 40.0
11 Karnataka 26 23 3 13.0 0 0.0 6 26.1 0 0.0 1 4.3 13 56.5
12 Kerala 15 11 1 9.1 0 0.0 3 27.3 0 0.0 2 18.2 5 45.5
13 Madhya Pradesh 33 33 0 0.0 2 6.1 1 3.0 0 0.0 1 3.0 29 87.9
14 Maharashtra 30 27 1 3.7 0 0.0 5 18.5 0 0.0 0 0.0 21 77.8
15 Orissa 25 24 1 4.2 1 4.2 1 4.2 0 0.0 2 8.3 19 79.2
16 Punjab 15 11 0 0.0 0 0.0 7 63.6 0 0.0 0 0.0 4 36.4
17 Rajasthan 30 30 3 10.0 0 0.0 6 20.0 0 0.0 3 10.0 18 60.0
18 Tamilnadu 30 22 2 9.1 5 22.7 8 36.4 0 0.0 1 4.5 6 27.3
19 Uttar Pradesh 27 20 2 10.0 0 0.0 1 5.0 0 0.0 6 30.0 11 55.0
20 West Bengal 17 17 1 5.9 2 11.8 1 5.9 0 0.0 1 5.9 12 70.6
21 A&N Islands 15 14 0 0.0 0 0.0 0 0.0 0 0.0 0 0.0 14 100.0
22 Chandigarh 6 6 0 0.0 2 33.3 1 16.7 0 0.0 0 0.0 3 50.0
Total 418 360 22 6.1 18 5.0 69 19.2 2 0.6 43 11.9 206 57.2
(e) Storage & Cooking Facility
Another important aspect of Supplementary Nutrition is storage and cooking facility. A total of 185 AWWs
(44.3%) reported to have space for storage among the 418 interviewed. Table-3.34 Proper cooking facility
was available in only AWCs 211 AWC (50.5%) which is a matter of concern as according to the guidelines
cooked meals are to be provided to children at the AWCs. If proper cooking facilities are not available the
norm for providing hot cooked meal to children cannot be complied with.
50
Table 3.34: Availability of Space of Storage and Cooking
Sl. No. Name of the State/UTs No. of AWs
Observed
Separate space
for Storage
Cooking Facility
No. % No. %
1 Andhra Pradesh 15 3 20.0 3 20.0
2 Assam 29 16 55.2 9 31.0
3 Chhattisgarh 10 8 80.0 7 70.0
4 Delhi 15 8 53.3 7 46.7
5 Goa 5 4 80.0 2 40.0
6 Gujarat 5 4 80.0 3 60.0
7 Haryana 11 5 45.5 4 36.4
8 Himachal Pradesh 14 1 7.1 3 21.4
9 Jammu & Kashmir 30 8 26.7 28 93.3
10 Jharkhand 15 5 33.3 5 33.3
11 Karnataka 26 23 88.5 21 80.8
12 Kerala 15 9 60.0 11 73.3
13 Madhya Pradesh 33 7 21.2 16 48.5
14 Maharashtra 30 9 30.0 17 56.7
15 Orissa 25 3 12.0 4 16.0
16 Punjab 15 5 33.3 8 53.3
17 Rajasthan 30 12 40.0 12 40.0
18 Tamilnadu 30 25 83.3 28 93.3
19 Uttar Pradesh 27 9 33.3 4 14.8
20 West Bengal 17 11 64.7 7 41.2
21 A&N Islands 15 9 60.0 10 66.7
22 Chandigarh 6 1 16.7 2 33.3
Total 418 185 44.3 211 50.5
(f) Interruption in Food Distribution
The AWWs were also asked about the regularity in supply distribution during past 3-6 months of
supplementary nutrition given to the beneficiaries. Table- 3.35 shows that total of 95 AWWs reported
(22.7%) interruptions in food distribution during past 3-6 months. The main reasons for interruption of food
distribution stated were shortage of supply (88.4%) and lack of proper storage facility (5.3%).
51
(g) Problems regarding Supplementary Nutrition
Though supply and distribution of Supplementary Nutrition was reported to be satisfactory still out of 418
AWC visited, 204 AWWs were facing some problems related to supply and distribution of supplementary
nutrition. These were irregular supply of food material (27.0%), non availability of cooking space (26.0%),
unsatisfactory quality of food material (10.8%) and financial constraints (14.2%) as shown in Table 3.36.
Table 3.35 Interruption in Food Distribution at AWC
Sl.
No.
Name of the
State/UTs
No. of
AWWs
Interviewed
Interruptions
during past
3-6 months
Causes of interruption
Shortage of
supply
Storage of
items
No. % No. % No. %
1 Andhra Pradesh 15 2 13.3 2 100 0 0
2 Assam 29 25 86.2 25 100 0 0
3 Chhattisgarh 10 1 10 1 100 0 0
4 Delhi 15 0 0 0 0 0 0
5 Goa 5 0 0 0 0 0 0
6 Gujarat 5 0 0 0 0 0 0
7 Haryana 11 0 0 0 0 0 0
8 Himachal Pradesh 14 4 28.6 4 100 0 0
9 Jammu & Kashmir 30 8 26.7 7 87.5 1 12.5
10 Jharkhand 15 0 0 0 0 0 0
11 Karnataka 26 7 26.9 7 100 0 0
12 Kerala 15 1 6.7 1 100 0 0
13 Madhya Pradesh 33 0 0 0 0 0 0
14 Maharashtra 30 6 20 6 100 0 0
15 Orissa 25 20 80 16 75 4 20
16 Punjab 15 2 13.3 2 100 0 0
17 Rajasthan 30 2 6.7 2 100 0 0
18 Tamilnadu 30 4 13.3 4 100 0 0
19 Uttar Pradesh 27 5 18.5 5 100 0 0
20 West Bengal 17 8 47.1 8 37.5 0 0
21 A&N Islands 15 0 0 0 0 0 0
22 Chandigarh 6 0 0 0 0 0 0
Total 418 95 22.7 90 88.4 5 5.3

52
Table 3.36: Problem/Observation Regarding Supplementary Nutrition
N=204
Sl. No. Problems/Observations No. %
1 No separate Kitchen/No cooking facility 53 26.0
2 Irregular Supply of Food Material/ Inadequate supply/No
supply
55 27.0
3 No Storage & Fuel Facility 6 2.9
4 Provision of hot water for children Grade II malnutrition 9 4.4
5 Poor quality of food material 35 17.2
6 No intervention for Grade II malnutrition 2 1.0
7 Unclean surroundings 4 2.0
8 Non cooperation by PRIs 5 2.5
9 Financial constraints 29 14.2
10 No regular monitoring 5 2.5
11 Transportation problem 1 0.5
3.2.3.2 Growth Monitoring
Regular weighing of the children, recording of the weight on a growth chart and giving advice to the
mother based on growth curve is called “Growth monitoring”. Success of Growth Monitoring depends on
the extent to which weighing scales; Growth charts etc. are available at the AWCs and the skills of AWWs
in providing counseling and support to the mothers. Thus type of scale used for weighing children and
accuracy of plotting growth curve was assured and assessed.
The data on availability of scales, type of scales etc. was collected from 418 AWWs and is depicted in
Table- 3.37. The data revealed that out of the total 418 AWCs visited three fourth i.e., (72.0%) had Salter
scale/ Spring Balance. Other scales used for similar purpose were Weighing Pan (5.3%), Bar Scale (4.1%),
Weighing Machine/ Weighing Balance (11.5%) and MUAC tape (0.5%) no scales were available in 12.4
percent AWCs.
It may be note that in Chhattisgarh, Delhi, Gujarat and West Bengal weighing scales (Salter Scale) were
available in each AWC. MUAC tape was used for growth monitoring in 2 AWC in Jammu & Kashmir.
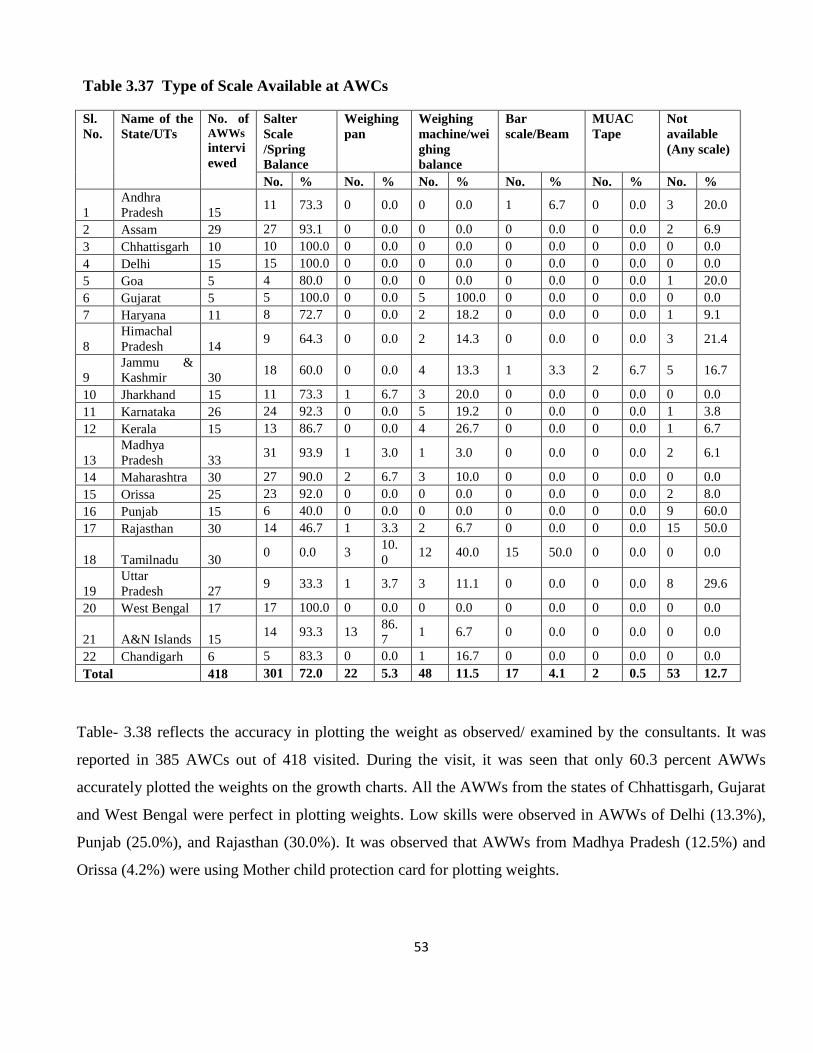
53
Table 3.37 Type of Scale Available at AWCs
Sl.
No.
Name of the
State/UTs
No. of AWWs
intervi
ewed
Salter
Scale
/Spring
Balance
Weighing
pan
Weighing
machine/wei
ghing
balance
Bar
scale/Beam
MUAC
Tape
Not
available
(Any scale)
No. % No. % No. % No. % No. % No. %
1
Andhra
Pradesh 15 11 73.3 0 0.0 0 0.0 1 6.7 0 0.0 3 20.0
2 Assam 29 27 93.1 0 0.0 0 0.0 0 0.0 0 0.0 2 6.9
3 Chhattisgarh 10 10 100.0 0 0.0 0 0.0 0 0.0 0 0.0 0 0.0
4 Delhi 15 15 100.0 0 0.0 0 0.0 0 0.0 0 0.0 0 0.0
5 Goa 5 4 80.0 0 0.0 0 0.0 0 0.0 0 0.0 1 20.0
6 Gujarat 5 5 100.0 0 0.0 5 100.0 0 0.0 0 0.0 0 0.0
7 Haryana 11 8 72.7 0 0.0 2 18.2 0 0.0 0 0.0 1 9.1
8
Himachal
Pradesh 14 9 64.3 0 0.0 2 14.3 0 0.0 0 0.0 3 21.4
9
Jammu &
Kashmir 30 18 60.0 0 0.0 4 13.3 1 3.3 2 6.7 5 16.7
10 Jharkhand 15 11 73.3 1 6.7 3 20.0 0 0.0 0 0.0 0 0.0
11 Karnataka 26 24 92.3 0 0.0 5 19.2 0 0.0 0 0.0 1 3.8
12 Kerala 15 13 86.7 0 0.0 4 26.7 0 0.0 0 0.0 1 6.7
13
Madhya
Pradesh 33 31 93.9 1 3.0 1 3.0 0 0.0 0 0.0 2 6.1
14 Maharashtra 30 27 90.0 2 6.7 3 10.0 0 0.0 0 0.0 0 0.0
15 Orissa 25 23 92.0 0 0.0 0 0.0 0 0.0 0 0.0 2 8.0
16 Punjab 15 6 40.0 0 0.0 0 0.0 0 0.0 0 0.0 9 60.0
17 Rajasthan 30 14 46.7 1 3.3 2 6.7 0 0.0 0 0.0 15 50.0
18 Tamilnadu 30 0 0.0 3
10.
0 12 40.0 15 50.0 0 0.0 0 0.0
19
Uttar
Pradesh 27 9 33.3 1 3.7 3 11.1 0 0.0 0 0.0 8 29.6
20 West Bengal 17 17 100.0 0 0.0 0 0.0 0 0.0 0 0.0 0 0.0
21 A&N Islands 15 14 93.3 13
86.
7 1 6.7 0 0.0 0 0.0 0 0.0
22 Chandigarh 6 5 83.3 0 0.0 1 16.7 0 0.0 0 0.0 0 0.0
Total 418 301 72.0 22 5.3 48 11.5 17 4.1 2 0.5 53 12.7
Table- 3.38 reflects the accuracy in plotting the weight as observed/ examined by the consultants. It was
reported in 385 AWCs out of 418 visited. During the visit, it was seen that only 60.3 percent AWWs
accurately plotted the weights on the growth charts. All the AWWs from the states of Chhattisgarh, Gujarat
and West Bengal were perfect in plotting weights. Low skills were observed in AWWs of Delhi (13.3%),
Punjab (25.0%), and Rajasthan (30.0%). It was observed that AWWs from Madhya Pradesh (12.5%) and
Orissa (4.2%) were using Mother child protection card for plotting weights.

54
It was discouraging to note that 10.9 percent AWWs did not plot weight accurately and more over in 20.0
percent AWC, growth charts/ registers were not available. 46.7 percent AWWs of Rajasthan and 38.5
percent of Himachal Pradesh did not accurately plot the weight in growth chart which reflects the poor
skills of AWWs. It is recommended that training in growth monitoring may be imparted to them. Further, it
may be observed from Table- 3.38 that 76.6 percent AWWs organized counseling sessions with mothers
after plotting and interpreting the growth curve. It may be mentioned that until counseling of mothers is
conducted, the growth monitoring is meaningless. Andhra Pradesh, Goa and Tamil Nadu were states where
cent percent (100.0 %) Counseling was reported in comparison to Rajasthan (36.7%) and Jammu &
Kashmir (40.0%).
Table 3.38 Accuracy in plotting the weight as observed/examined by the Consultants /Faculty
Members
S.
No.
Name of the
State/UTs
No. of
AWWs
Intervie
wed
Ob
ser
ved
Accuracy in
Plotting
Not Accurate Using MCPC
Cards
Growth
Charts are
not
maintained .
AWWs
organising
Counseling
sessions
No. % No. % No. % No. % No. %
1
Andhra
Pradesh 15 15 12 80.0 2 13.3 0 0.0 1 6.7 15
100.0
2 Assam 29 24 10 41.7 5 20.8 0 0.0 9 37.5 14 48.3
3 Chhattisgarh 10 10 10 100.0 0 0.0 0 0.0 0 0.0 10 100.0
4 Delhi 15 15 2 13.3 0 0.0 0 0.0 12 80.0 13 86.7
5 Goa 5 5 2 40.0 0 0.0 0 0.0 3 60.0 4 80.0
6 Gujarat 5 5 5 100.0 0 0.0 0 0.0 0 0.0 5 100.0
7 Haryana 11 10 5 50.0 0 0.0 0 0.0 5 50.0 8 72.7
8
Himachal
Pradesh 14 13 7 53.8 5 38.5 0 0.0 1 7.7 14
100.0
9
Jammu &
Kashmir 30 27 9 33.3 0 0.0 0 0.0 12 44.4 12
40.0
10 Jharkhand 15 15 11 73.3 0 0.0 0 0.0 4 26.7 14 93.3
11 Karnataka 26 24 22 91.7 1 4.2 0 0.0 1 4.2 23 88.5
12 Kerala 15 15 9 60.0 3 20.0 0 0.0 3 20.0 14 93.3
13
Madhya
Pradesh
33
32
24
75.0
1
3.1
4
12.5
3
9.4
32
97.0
14 Maharashtra 30 28 20 71.4 3 10.7 0 0.0 5 17.8 24 80.0
15 Orissa 25 24 13 54.2 4 16.7 1 4.2 6 24.0 22 88.0
16 Punjab 15 12 3 25.0 0 0.0 0 0.0 9 75.0 8 53.3
17 Rajasthan 30 30 9 30.0 14 46.7 0 0.0 7 23.3 11 36.7
18 Tamilnadu 30 18 17 94.4 1 5.6 0 0.0 0 0.0 30 100.0
19
Uttar
Pradesh 27 26 11 42.3 3 11.5 0 0.0 12 44.4 14
51.9
20 West Bengal 17 17 14 82.4 0 0.0 0 0.0 3 13.6 14 82.4
21
A&N
Islands 15 14 14 100.0 0 0.0 0 0.0 0 0.0 14
93.3

55
22 Chandigarh 6 6 3 50.0 0 0.0 0 0.0 3 50.0 5 83.3
Total 418 385 232 60.3 42 10.9 5 1.3 99 25.7 320 76.6
3.2.3.3 Pre-School Education (PSE)
The Pre- school education component in ICDS has been envisaged as a vital component to ensure a
holistic development of children before going into formal education system. Further there has been a
growing awareness among the parents about the crucial significance of the pre-school years (2 to 6 years)
as development of a child’s personality takes place in these years. The need for pre-school education is also
considered most pronounced in case of children from disadvantages society. Data during monitoring visits
was collected in respect of PSE activities conducted at AWC, method for PSE and quality of PSE activities.
Table – 3.39 shows the responses of 262 AWWs in providing services related to PSE. PSE was being
imparted by almost all Anganwadi workers as per schedule except 6.9 percent. 37.8 percentage of AWWs
followed time table provided by the state institution in comparison to 6.9 percent AWWs who did not
follow any schedule of activities. Majority of the AWWs from West Bengal, Chandigarh, Andhra Pradesh
and Himachal Pradesh followed schedule Weekly theme based schedule was followed by 8.4 percent
AWWs of Assam (22.2%) Karnataka (23.8%) Kerala (60.0%), Madhya Pradesh (23.1%) and Rajasthan
(14.8%) where as monthly schedule was followed by 3.8 percent AWWs of Madhya Pradesh. Different
methods were being used by AWWs in conducted PSE activities which included play way method (32.0%),
use of charts/posters (9.2%). In the State of Orissa PSE activities, module based on the lines of Arunima
project (State Govt. initiative) was adopted.

56
Table 3.39 Time Table & Methods used for PSE Activities
Time Table Methods used for PSE Activities
S.
No.
Name of
the State
/UTS
No.
of
AW
Ws
Inter
view
ed
No.
of
AW
Ws
Resp
onde
d
Time -Table
given by
State
Institution
Education
CDPO
Primary
level time
table
Mothly
Schedule
follow
Weekly
theme
based
No schedule Chart/
Posters
Through
play way
method/
role play
No. % No. % No. % No. % No. % No. % No. %
1 Andhra Pradesh 15 8
6 75.0 0 0.0 0 0.0 0 0.0
0 0.0
2 25.0 0 0.0
2 Assam 29 18 6 33.3 0 0.0 0 0.0 4 22.2 0 0.0 1 5.6 7 38.9
3 Chhattisgarh 10 8 2 25.0 0 0.0 0 0.0 0 0.0 0 0.0 0 0.0 6 75.0
4 Delhi 15 10 0 0.0 0 0.0 0 0.0 0 0.0 0 0.0 3 30.0 7 70.0
5 Goa 5 4 2 50.0 0 0.0 0 0.0 0 0.0 1 25.0 0 0 1 25.0
6 Gujarat 5 4 2 50.0 0 0.0 0 0.0 0 0.0 0 0.0 0 0.0 0 0.0
7 Haryana 11 5 4 100.0 0 0.0 0 0.0 0 0.0 2 40.0 0 0.0 1 20.0
8 Himachal Pradesh 14 12
2 40.0 0 0.0 0 0.0 0 0.0
2 16.7
0 0.0 0 0.0
9
Jammu &
Kashmir 30 21 10 83.3 0 0.0 0 0.0 0
0.0 1
4.8 2 9.5 15 71.4
10 Jharkhand 15 12 4 19.0 0 0.0 0 0.0 0 0.0 1 8.3 0 0.0 4 33.3
11 Karnataka 26 21 6 28.6 0 0.0 0 0.0 5 23.8 3 14.3 1 4.8 6 28.6
12 Kerala 15 10 2 20.0 0 0.0 0 0.0 6 60.0 0 0.0 0 0.0 2 20.0
13
Madhya
Pradesh 33 26 8 30.8 1 3.8 1 3.8 6
23.1 0
0.0 5 19.2 9 34.6
14 Maharashtra 30 9 1 11.1 0 0.0 0 0.0 0 0.0 2 22.2 4 44.4 4 44.4
15 Orissa 25 17 6 35.3 0 0.0 0 0.0 0 0.0 0 0.0 0 0.0 11 64.7
16 Punjab 15 4 2 50.0 0 0.0 0 0.0 0 0.0 1 25.0 1 25.0 1 25.0
17 Rajasthan 30 21 14 66.6 0 0.0 0 0.0 1 4.8 1 4.8 5 23.8 8 38.1
18 Tamilnadu 30 20 15 75.0 1 5.0 1 5.0 0 0.0 1 5.0 0 0.0 2 10.0
19 Uttar Pradesh 27 12
9 75.0 0 0.0 0 0.0 0 0.0
3 25.0
0 0.0 0 0.0
20 West Bengal 17 15 15 100.0 0 0.0 0 0.0 0 0.0 0 0.0 0 0.0 0 0.0
21 A&N Islands 15 0 0 0.0 0 0.0 0 0.0 0 0.0 0 0.0 0 0.0 0 0.0
22 Chandigarh 6 5 4 80.0 0 0.0 0 0.0 0 0.0 0 0.0 0 0.0 0 0.0
Total 418 262 126 48.0 2 0.8 2 0.8 22 8.4 18 6.9 24 9.2 84 32.0
In order to assess the quality of PSE activities conducted by AWWs the observation were made by the
consultants (Table-3.40). Most of the AWWs were performing /organizing activities satisfactorily (62.7%)
so as to benefit children.11.9 percent AWWs were not performing up to the mark

57
Table 3.40 : Quality of Pre-School Education as Observed by Consultants
S.No. Observation Number %
N=375
1 Availability of PSE material
(charts, Poster, Toys)
57 13.6
2 Non-availability of PSE material 17 4.0
3 Organising Pre-school Activities (satisfactorily) 257 62.7
4 Pre-school activities( not satisfactory) 50 11.9
5 Poor attendance of children 27 6.4
6 Use of innovative methods 12 2.8
7 Formal education 10 2.3
8 Children enjoying activities 5 1.1
Performance of AWWs in organizing PSE activities depend largely on availability of educational material
with AWWs. It was observed that charts and posters and toys were available with 13.6 percent AWWs as
compared to 4.0 percent who reported non-availability of education material. In 6.4 percent Anganwadi
Centers there was poor attendance of children during Pre school hours. It was good to note that 2.8 percent
AWWs were using innovative methods for imparting pre-school education, 2.3 percent AWWs were found
to be imparting formal education to Pre- school children which is not required to be done by AWWs.
3.2.3.4 Health Check-up and Immunization
ICDS programmes lay great emphasis on health services with the aim to improve the health of
children and women through preventive measure. These include health check-up, Immunization and
Referral Services. The Health Check-up is done for children up to 6 years and pregnant and lactating
women. The Health Services at AWCs are provided in coordination with health department, therefore

58
convergence of ICDS and health is required at all levels. Table 3.41 gives the observation of 410
consultants on status of health services and Immunization at the AWC.
Table 3.41: Status of Immunization, Health Check-up and Referral Services as Observed by Consultants
Observation Number %
N=280 Immunization Coverage
Good 170 41.1
Satisfactory 156 38.0
Unsatisfactory 84 20.4
Low/Unavailability of vaccines 130 31.7
Maintenance of records and registers 240 58.5
Health Checkup done regularly 160 57.1
Referral Services available/ children referred 236 84.2
No Referral/ Not Satisfactory services 164 58.5
The services were rated as good by 41.1, percent a satisfactory by 38.0 and not satisfactory by 20.4
percent consultants. 31.7 percent consultants reported unavailability/ delay in supply of vaccine which
could hampers the immunization activities. More than half (58.5) of the AWWs were reported to maintain
records and registers of immunization. In few of the centers, it was observed that records were also
maintained for ANMs who were immunizing the children.
3.2.3.5 Referral Services
Referral as a service was available in the states but it was observed that very few referrals/no
referrals (13.9) were being made by AWWs. Health Check-up was taken up in all the AWC visited, though
it was observed that it was not done in the manner as envisaged in the scheme. It was being done on regular
basis. The health check-up were provided by VHN/MCD or MCH personnel.
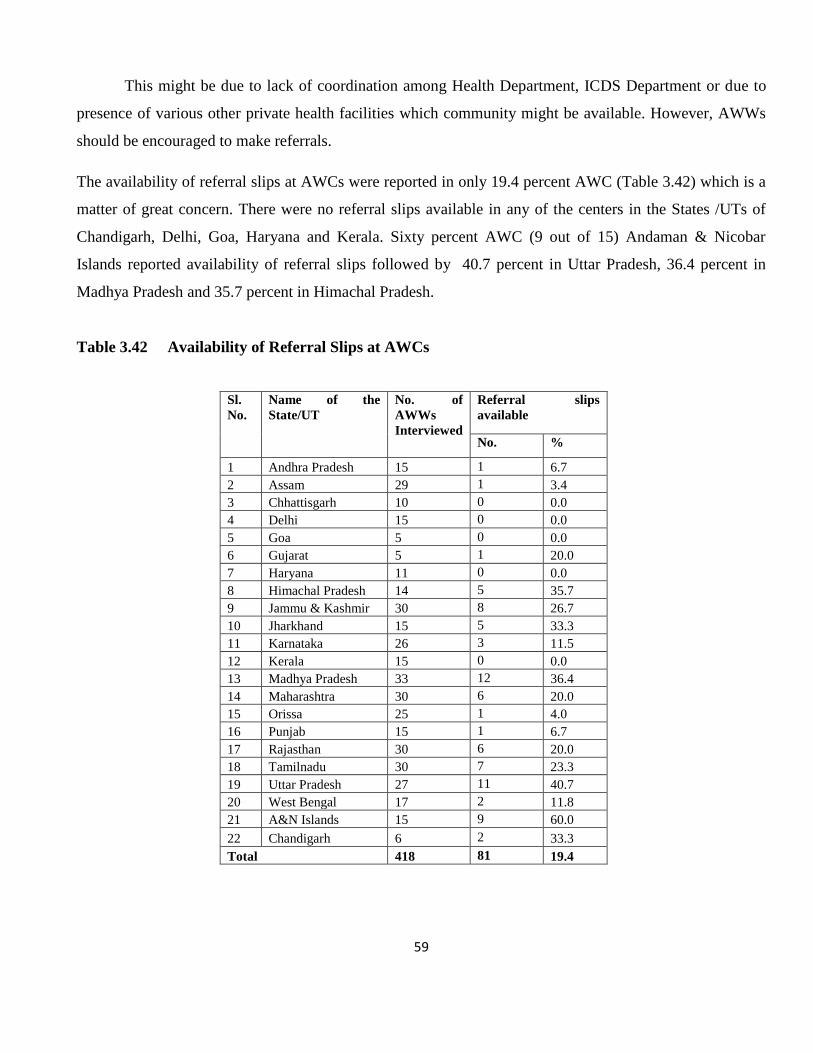
59
This might be due to lack of coordination among Health Department, ICDS Department or due to
presence of various other private health facilities which community might be available. However, AWWs
should be encouraged to make referrals.
The availability of referral slips at AWCs were reported in only 19.4 percent AWC (Table 3.42) which is a
matter of great concern. There were no referral slips available in any of the centers in the States /UTs of
Chandigarh, Delhi, Goa, Haryana and Kerala. Sixty percent AWC (9 out of 15) Andaman & Nicobar
Islands reported availability of referral slips followed by 40.7 percent in Uttar Pradesh, 36.4 percent in
Madhya Pradesh and 35.7 percent in Himachal Pradesh.
Table 3.42 Availability of Referral Slips at AWCs
Sl.
No.
Name of the
State/UT
No. of
AWWs
Interviewed
Referral slips
available
No. %
1 Andhra Pradesh 15 1 6.7
2 Assam 29 1 3.4
3 Chhattisgarh 10 0 0.0
4 Delhi 15 0 0.0
5 Goa 5 0 0.0
6 Gujarat 5 1 20.0
7 Haryana 11 0 0.0
8 Himachal Pradesh 14 5 35.7
9 Jammu & Kashmir 30 8 26.7
10 Jharkhand 15 5 33.3
11 Karnataka 26 3 11.5
12 Kerala 15 0 0.0
13 Madhya Pradesh 33 12 36.4
14 Maharashtra 30 6 20.0
15 Orissa 25 1 4.0
16 Punjab 15 1 6.7
17 Rajasthan 30 6 20.0
18 Tamilnadu 30 7 23.3
19 Uttar Pradesh 27 11 40.7
20 West Bengal 17 2 11.8
21 A&N Islands 15 9 60.0
22 Chandigarh 6 2 33.3
Total 418 81 19.4

60
3.2.3.6 Community support
Local women/SHGs are required to assist the AWWs in promotion of services in the community and
strengthening these services by way of extending help to AWWs in better coverage and utilization of
services at the Anganwadis. Table 3.43 gives the information on meetings with local women groups/SHGs
being organized by AWWs. It revealed that out of 418 AWWs, 339 (81.1%) organized meetings with local
women groups/SHGs. Only 36.7 percent AWWs from Jammu & Kashmir and 46.7 percent from Orissa
organized meeting with local women. The AWWs of Jammu & Kashmir and Orissa are required to be
encouraged to conduct the meetings. These meeting are generally organized for imparting nutrition and
health education to mothers/community.
Table 3.43 No. of AWW Organise meeting with local Women Groups/SGHs
Sl. No.
Name of the State/UT
No. of AWWs
Interviewed
No. of AWW Organise meeting with local
Women Groups/SGHs
No. %
1 Andhra Pradesh 15 15 100.0
2 Assam 29 28 96.6
4 Chhattisgarh 10 10 100.0
5 Delhi 15 15 100.0
6 Goa 5 4 80.0
7 Gujarat 5 5 100.0
8 Haryana 11 8 72.7
9 Himachal Pradesh 14 14 100.0
10 Jammu & Kashmir 30 11 36.7
11 Jharkhand 15 15 100.0
12 Karnataka 26 23 88.5
13 Kerala 15 14 93.3
14 Madhya Pradesh 33 25 75.8
15 Maharashtra 30 28 93.3
17 Orissa 25 23 92.0
18 Punjab 15 12 80.0
19 Rajasthan 30 30 100.0
20 Tamilnadu 30 28 93.3
21 Uttar Pradesh 27 23 85.2
23 West Bengal 17 14 82.4
24 A&N Islands 15 15 100.0
25 Chandigarh 6 6 100.0
Total 418 366 87.6

61
3.2.3.7 Nutrition and Health Education
Nutrition and Health education (NHEd) is another very essential service of ICDS scheme. It is
meant for effective transmission of certain basic health and nutrition messages to enhance the level of
awareness of the community at large particularly that of mothers about the needs of their children and her
capacity for provide care for protection and development to the children within the family takes into
account. NHED is provided to all women in the age group of 15-45 years, though priority is given to
expectant and nursing mothers and malnourished children.
(i) Themes/Topics covered during NHED session
The Table-3.44 details out the topics/themes covered during NHED sessions, training materials/aids and
methods used for disseminating the information. The information on above Para mention was elicited from
AWWs.
All the AWWs reported that they organized Nutrition and health education with the support of
supervisors, helpers/community. Table-3.44 depicts information concerning the theme/topics covered
during NHED session. The above tables clearly shows that 74.5 percent AWWs organized nutrition and
health education as topics like Care of children, followed by 4.7 percent on anaemia. Personal hygiene and
environmental sanitation was covered by 29.0 percent AWWs immunization and health care of pregnant
women was discussed by 17.4 and 15.2 percent AWWs. Data also suggests that topics related to women
empowerment were covered through sessions on legal rights (10.9%) family planning (20.3%) and small
scale entrepreneurship (34.5%). Immunization on emerging diseases like HIV/AIDS was also given to
mothers by 69.4 percent AWWs.
In order to popularize ICDS the community 10.9 percent AWWs have reported informing
community about the Importance and services of ICDS and PSE (20.3%). Very few AWWs provided
information topics infant mortality (7.2%) and disaster Management (10.9%) which shows that the interest
of AWWs in sharing important knowledge and information with their beneficiaries.
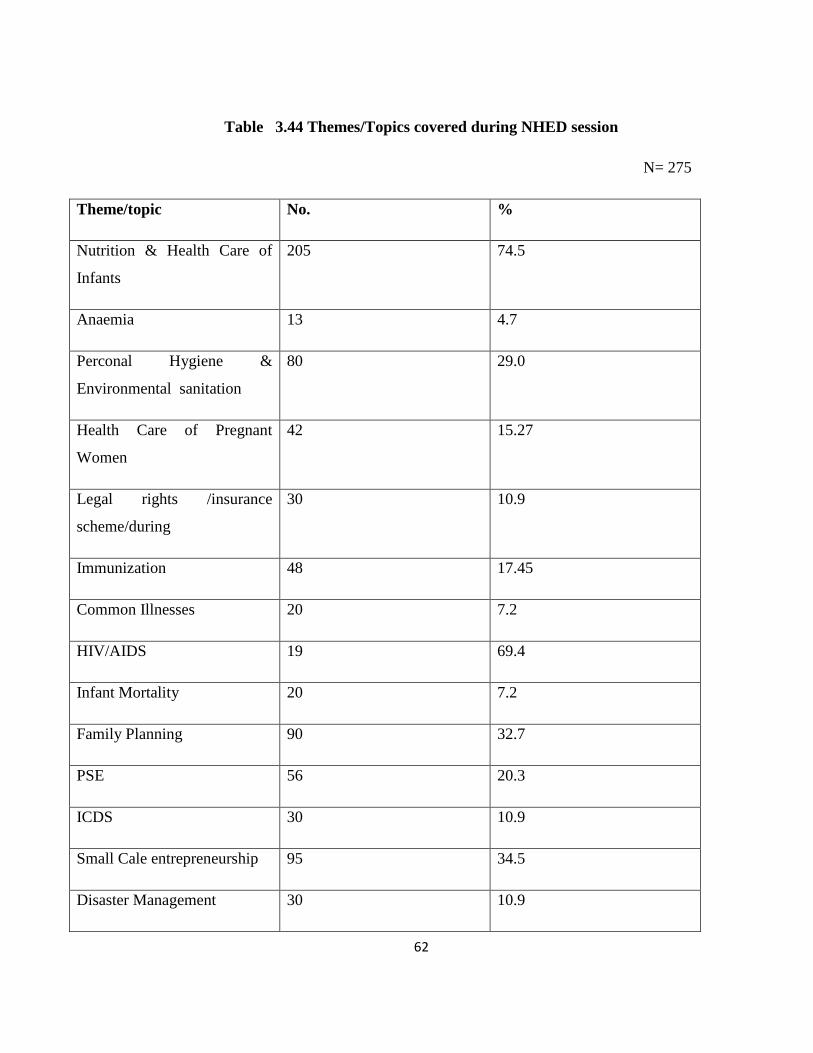
62
Table 3.44 Themes/Topics covered during NHED session
N= 275
Theme/topic No. %
Nutrition & Health Care of
Infants
205 74.5
Anaemia 13 4.7
Perconal Hygiene &
Environmental sanitation
80 29.0
Health Care of Pregnant
Women
42 15.27
Legal rights /insurance
scheme/during
30 10.9
Immunization 48 17.45
Common Illnesses 20 7.2
HIV/AIDS 19 69.4
Infant Mortality 20 7.2
Family Planning 90 32.7
PSE 56 20.3
ICDS 30 10.9
Small Cale entrepreneurship 95 34.5
Disaster Management 30 10.9

63
(ii) NHEd Methods/Teaching Aids
AWWs were asked about various methods and teaching aids/material used by them during NHED
sessions with mothers. It is important to mention that mostly the sessions were covered through lecture-
cum-discussion (70.1%) and interpersonal contact as a method to talk to mothers (Table- 3.45)
Table 3.45 Methods and Teaching Aids used by AWWs
The Table – 3.45 shows that 40.7 percent used charts/posters with mothers to impart education to
mothers individually or in groups. Data also reflects that AWWs used teaching aids/material like
demonstration of recipes (9.8%) use of guide, booklets (5.0%) puzzles/pamphlets, banners (0.5%). Visual
aids like flip cards/flipcharts/flash cards (13.0%).
Sl. No. Methods and Aids/material No. %
N=275
1 Lecture-cum-discussion 127 48.1
2 Demonstration 27 9.8
3 Use/Charts/toys/Posters/Banners/Pamphlets 112 40.7
4 Bal Swasthya Guide/Guide 10 3.8
5 Booklet for pregnant and Nursing mothers 4 1.5
6 Puzzles 29 10.5
7 Booklets 24 8.7
8 Flip charts 36 13.0
9 Books/Guides 14 5.0

64
Education and communication aids were found to be grossly inadequate in AWCs. Oral
conversation was observed as the most common method used by AWWs with the mothers.
(iii) Availability of Training Material for NHEd
The Data in Table – 3.46 reflects the adequate training material was available in 42.1 percent AWC
where as in 30.7 percent no training material was found. Though in 27.2 percent AWCs material was
available but was inadequate.
Table 3.46 Availability of training material for NHEd at AWCs as observed by
Consultants/Faculty member
Sl.
No.
Name of the State/UT No. of AWWs
Observed
No. of AWWs in
which Training
material was
observed
Availability trainig material for NHED
Adequate/
good
Inadequate Not
Available
No. % No. % No. %
1 Andhra Pradesh 15 15 6 40.0 3 20.0 6 40.0
2 Assam 29 21 11 52.4 4 19.0 6 28.6
4 Chhattisgarh 10 9 4 44.4 4 44.4 1 11.1
5 Delhi 15 14 8 57.1 5 35.7 1 7.1
6 Goa 5 5 4 80.0 0 0.0 1 20.0
7 Gujarat 5 5 3 60.0 1 20.0 1 20.0
8 Haryana 11 9 4 44.4 3 33.3 2 22.2
9 Himachal Pradesh 14 14 4 28.6 5 35.7 5 35.7
10 Jammu & Kashmir 30 22 5 22.7 3 13.6 14 63.6
11 Jharkhand 15 15 9 60.0 4 26.7 2 13.3
12 Karnataka 26 22 10 45.5 10 45.5 2 9.1
13 Kerala 15 12 6 50.0 4 33.3 2 16.7
14 Madhya Pradesh 33 31 13 41.9 9 29.0 9 29.0
15 Maharashtra 30 29 15 51.7 3 10.3 11 37.9
17 Orissa 25 22 6 27.3 7 31.8 9 40.9
18 Punjab 15 14 6 42.9 4 28.6 4 28.6
19 Rajasthan 30 30 10 33.3 13 43.3 7 23.3
20 Tamilnadu 30 28 14 50.0 4 14.3 10 35.7
21 Uttar Pradesh 27 25 13 52.0 4 16.0 8 32.0
23 West Bengal 17 16 2 12.5 10 62.5 4 25.0
24 A&N Islands 15 11 4 36.4 1 9.1 6 54.5
25 Chandigarh 6 6 1 16.7 1 16.7 4 66.7
Total 418 375 158 42.1 102 27.2 115 30.7
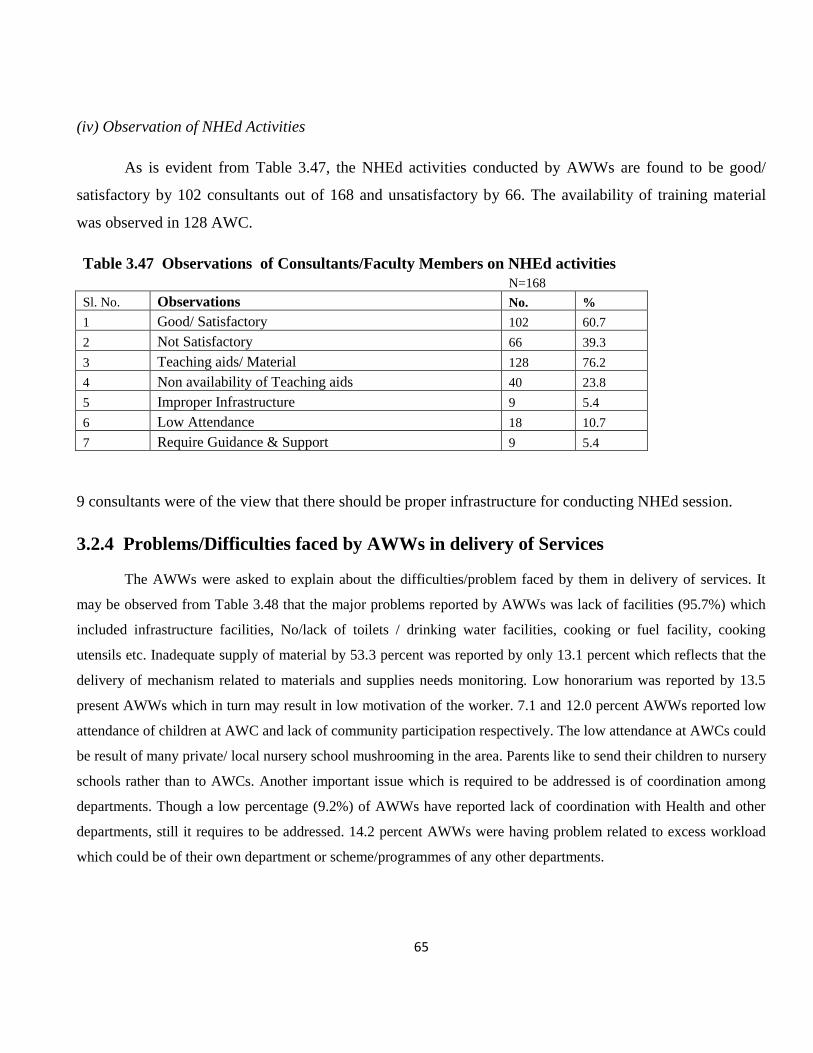
65
(iv) Observation of NHEd Activities
As is evident from Table 3.47, the NHEd activities conducted by AWWs are found to be good/
satisfactory by 102 consultants out of 168 and unsatisfactory by 66. The availability of training material
was observed in 128 AWC.
Table 3.47 Observations of Consultants/Faculty Members on NHEd activities
N=168
Sl. No. Observations No. %
1 Good/ Satisfactory 102 60.7
2 Not Satisfactory 66 39.3
3 Teaching aids/ Material 128 76.2
4 Non availability of Teaching aids 40 23.8
5 Improper Infrastructure 9 5.4
6 Low Attendance 18 10.7
7 Require Guidance & Support 9 5.4
9 consultants were of the view that there should be proper infrastructure for conducting NHEd session.
3.2.4 Problems/Difficulties faced by AWWs in delivery of Services
The AWWs were asked to explain about the difficulties/problem faced by them in delivery of services. It
may be observed from Table 3.48 that the major problems reported by AWWs was lack of facilities (95.7%) which
included infrastructure facilities, No/lack of toilets / drinking water facilities, cooking or fuel facility, cooking
utensils etc. Inadequate supply of material by 53.3 percent was reported by only 13.1 percent which reflects that the
delivery of mechanism related to materials and supplies needs monitoring. Low honorarium was reported by 13.5
present AWWs which in turn may result in low motivation of the worker. 7.1 and 12.0 percent AWWs reported low
attendance of children at AWC and lack of community participation respectively. The low attendance at AWCs could
be result of many private/ local nursery school mushrooming in the area. Parents like to send their children to nursery
schools rather than to AWCs. Another important issue which is required to be addressed is of coordination among
departments. Though a low percentage (9.2%) of AWWs have reported lack of coordination with Health and other
departments, still it requires to be addressed. 14.2 percent AWWs were having problem related to excess workload
which could be of their own department or scheme/programmes of any other departments.
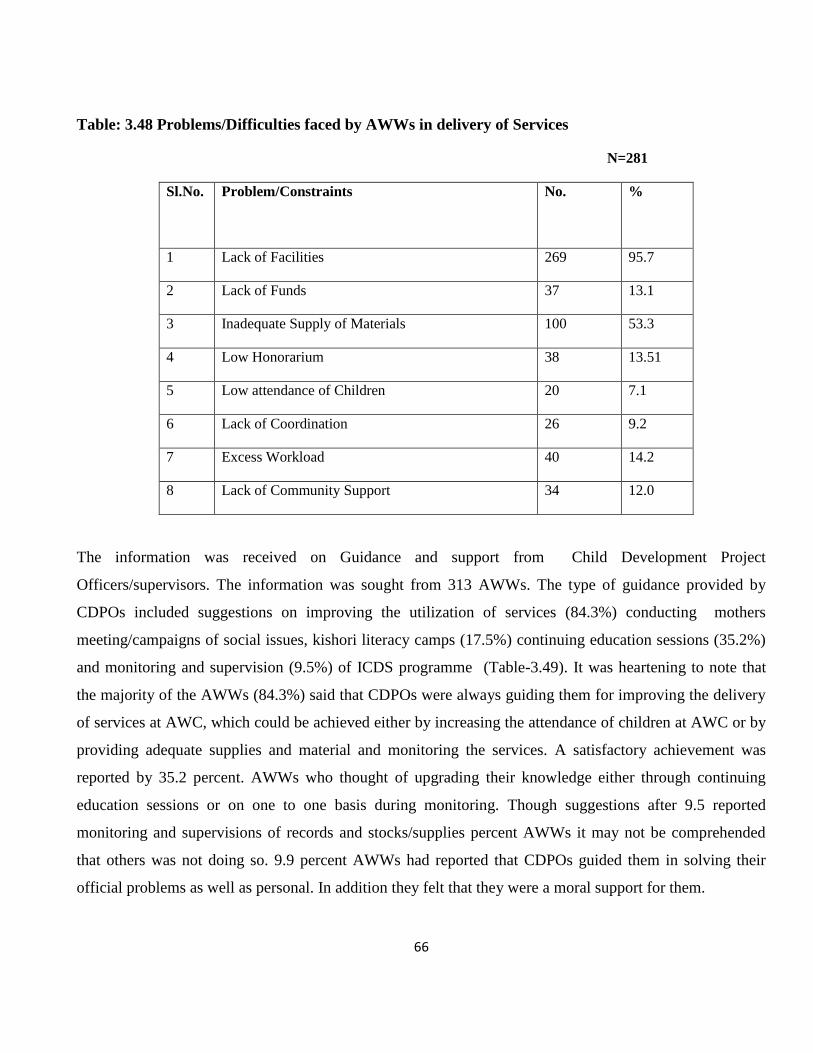
66
Table: 3.48 Problems/Difficulties faced by AWWs in delivery of Services
N=281
Sl.No. Problem/Constraints No. %
1 Lack of Facilities 269 95.7
2 Lack of Funds 37 13.1
3 Inadequate Supply of Materials 100 53.3
4 Low Honorarium 38 13.51
5 Low attendance of Children 20 7.1
6 Lack of Coordination 26 9.2
7 Excess Workload 40 14.2
8 Lack of Community Support 34 12.0
The information was received on Guidance and support from Child Development Project
Officers/supervisors. The information was sought from 313 AWWs. The type of guidance provided by
CDPOs included suggestions on improving the utilization of services (84.3%) conducting mothers
meeting/campaigns of social issues, kishori literacy camps (17.5%) continuing education sessions (35.2%)
and monitoring and supervision (9.5%) of ICDS programme (Table-3.49). It was heartening to note that
the majority of the AWWs (84.3%) said that CDPOs were always guiding them for improving the delivery
of services at AWC, which could be achieved either by increasing the attendance of children at AWC or by
providing adequate supplies and material and monitoring the services. A satisfactory achievement was
reported by 35.2 percent. AWWs who thought of upgrading their knowledge either through continuing
education sessions or on one to one basis during monitoring. Though suggestions after 9.5 reported
monitoring and supervisions of records and stocks/supplies percent AWWs it may not be comprehended
that others was not doing so. 9.9 percent AWWs had reported that CDPOs guided them in solving their
official problems as well as personal. In addition they felt that they were a moral support for them.

67
Table 3.49: Guidance and Support from Services for Improvement
N=313
Sl.No. Suggestions No. %
1 Improved utilization of services 264 84.3
2 Mothers meeting/campaigns 55 17.5
3 Continuing education of functionaries 99 35.2
4 Problem solving 28 9.9
5 Monitoring and supervision 27 9.6

68
CHAPTER - IV
CONCLUSIONS
4.1 Child Development Project Officer
Supplies to Anganwadi Centres
The Status of supplies of both PSE and NHED kit was poor in most of the States.
There was no supply of PSE of NHED kit in the State of Rajasthan, Punjab and Uttar Pradesh.
The supply of weighing scales showed good responses in all States except Rajasthan, Punjab and Gujarat.
The availability of medicine kit was poor in almost all State except Andhra Pradesh.
CDPO Office as Resource Center
The availability of reading material (manual/booklets) was found to be average. The least availability of
reading material was found in Chandigarh, Andaman & Nicobar Islands, Gujarat, Goa and Delhi
The maintenance of records and register was found to be satisfactory in all States
The availability of MPRs and MIS performance was poor which could hamper the report system
Monitoring and Supervision of AWCs
For monitoring of AWCs, CDPOs used different methods i.e. through regular visits, use of checklist and
observation.
In Goa, Chattisgarh and Chandigarh, CDPOs were using all the three method.
In the States of Assam, Delhi, Haryana Jammu & Kashmir, Kerala, West Bengal and Andaman & Nicobar
Islands monitoring was being done by observation only.

69
Assessment of Performance
The assessment of AWCs was done regularly by 90.2 percent CDPOs.
Methods used for assessment of performance included punctuality was interacting with the
beneficiaries, attendance of children in AWC read keeping and surprise visits.
Guiding Supervisors for Planning Visit
81.5 (percent) CDPOs helped their supervisors plan the monitoring visit to AWC.
Few of them were not planning visit due lack of time, vacant post of Supervisor, or Supervisor Plan their
own visits.
Guidance to functionaries was provided through use is instructions, demonstration of growth monitoring,
supplementary nutrition and by giving suggestions for improvement.
The mother and child protection card were used by only one CDPOs from Madhya Pradesh for providing
guidance.
Mothers meeting/balvikas samiti meeting were not being conducted by majority of CDPOs.
Strengths and Weakness
Some of the strength of AWWs and supervisors highlighted by CDPOs included sincerity/adjustable
dedication. Co-operative nature a good rapport with community as well as well educated knowledgeable.
Weakness included lack of motivation/over work/stress, lack of proper training, irregular supervision,
continuing education of functionaries
78.3 percent were providing continuing continuing education to AWWs and supervisors.
IEC Activities
The IEC activities were organized regularly.
Noinfornation regarding IEC activities was given by CDPOs of Delhi, Goa in Comparison to the States
of Chattisgarh, goa, Gujarat, Haryana, Himachal Pradesh Jharkhand, Punjab and Andaman & Nicobar
Islands where organizing IEC activities regularly.
Different types of IEC activities organized included Mahila Jagriti Shivir and Women and Adolescent
Girls, Campaigns during Breastfeeding/nutrition week.
The States of Assam, Delhi, Goa, Gujarat, Kerala did not utilized any IEC funds.

70
The IEC funds were utilized for preparation of different training materials pamphlets/wall board,
slogans/wall writing organizing NHED during breast-feeding week nutrition and community meeting etc.
Topic of continuing education session. The topics covered during continuing education session related to
different services provided
Maximum number of sessions on demonstration on PSE activities immunization, HIV/AIDS and
supplementary nutrition. The topic like mortality rate, locally available food, low cost recipes and
importance of savings.
PRI Involvement and IEC Activities
ICDS has been envisaged and conceptulised as a community based programme The improvement of
PRIS was stated by almost all CDPOs belonging to Assam, Chattisgarh, Gujarat, Himachal Pradesh,
Punjab, Rajasthan, Uttar Pradesh, West Bengal, Andaman & Nicobar Islands Chandigarh & Kerala, PRI
members were involved in bringing quality improvement in ICDS.
In States of Delhi, Goa there was no involvement of PRIS reported by the CDPOs.
Scheme/Programmes
State Government has taken up many initiatives at the state level by introducing innovation in ICDS.
The different scheme/programmes introduced by state level included child and women protection
programme in 10 States.
Municipal Corporation Rotary Club/Mission Shakti and Micro finance activities and Ladli Scheme.
Innovations and Best Practices
The innovation/best practices were being practiced by ICDS functionaries 45 CDPOs out of 92 have
adopted innovation & best practices.
Increase immunization coverage and decrease in morbidity/mortality were reported by CDPOs from
Karnataka
Additional Tasks/Assignments of CDPOs and Supervisors
ICDS functionaries at the project village level are given many other responsibilities in addition to their
own responsibilities.

71
Additional task/assignments related to their own department as well as other ministries/departments
such as Health and Family Welfare, Rural Development Food and Civil Supplies and Education etc.
For proper implementation of the programme it is essential that physical facilities and supplies are
adequate. It may not be noted that half of the CDPOs reported lack of proper infrastructural facilities, no
facility for telephonic or inadequate toilet and water facility either at AWC on in their office.
The unavailability of weighing machines, PSE kits, NHEd kit and irregular supply of Supplementary
Nutrition.
The improper monitoring and supervision was due to lack of vehicle
Lack of support from subordinate, inadequate training of functionaries and lack of community participation
add to slow improvement in the ICDS programme.
4.2 Anganwadi Workers
Information about AWWs
Majority of AWWs were literate 15.1 percent graduate and 4.5 percent AWWs were postgraduate. Among
all States Chhattisgarh reported maximum number of educated AWWs that included 30.0 percent post
graduate. AWWs
None were below matric.
As high as 80.4 percent had undergone job training. Andhra Pradesh, Chattisgarh, Kerala and Andaman &
Nicobar Islands cent percent (100.0%) AWWs were trained.
60.5 percent AWWs had received Refresher Training
AWWs should preferably be from same village/locality. It is to be noted that 83 percent of AWWs
belonged to same village/locality.
Physical Infrastructure of AWCs
Out of the 418 AWCs visited, 303 (72.5%) were located in pucca building and very few (1.2%) AWCs
were running in open.
Majority of AWCs (77.5%) had sufficient indoor and outdoor (69.4%) space available to them. However,
lack of indoor space was observed in States like Andhra Pradesh (60.0%), followed by West Bengal
(41.2%).
Jharkhand (40.0%) and Delhi were only 20.0 percent of AWCs had outdoor space. Chattisgarh emerged
as State with cent percent (100%) sufficient availability of both indoor as well outdoor space.

72
Despite all efforts still 21 percent of AWCs were without drinking water facility. Worst condition was
observed in Assam where only 34.5 percent AWCs had drinking water facility. But all the AWCs in
States of Gujarat, Madhya Pradesh and Chattisgarh had proper facilities infact all the Anganwadis in Goa
were provided tap water.
Only half of the AWC (50.2%) had toilet facilities. 86.7 percent AWCs at Delhi reported toilet facility.
Services provided at AWC
Supplementary Nutrition
Supplementary Nutrition was found more than satisfactory among 418 AWCs visited.
80.9 percent beneficiaries were being selected as per ICDS norms
92.9 percent were receiving food supplied is a State Government besides this 2.6 percent were receiving
support from WFP and 1.1 percent (Jammu & Kashmir and Punjab) from CARE.
Practice of providing cooled meal was more prevalent (100.0%) in Delhi, Goa, Gujarat, Jammu & Kashmir
and West Bengal where as States like Rajasthan and Karnataka were providing both cooked foods as well as
RTE.
As far as acceptability of food is concerned 80.9 percent AWWs and 70.2 percent consultants found it to be
acceptable.
A total of 185 AWWs (44.3%) reported to have space for storage and only 50.5 percent reported proper
cooking facility, which is a matter of concern.
Though the programme was running successfully, the major cause of interruption of Supplementary
Nutrition was shortage of supply (94.7%) and lack of proper storage facility (5.3%).
As regards community support, it was reported to be poor in all States. It was reported that more than half
(57.2%) community members were not contributing anything.
Growth Monitoring
Success of growth monitoring depends on the extent to which weighing scales; growth charts etc. are
available. The data revealed that 70.3 percent AWCs had salter scale/spring balance. Chattisgarh, Delhi,
Gujarat and West Bengal reported cent percent (100.0%) availability of salter scales.
Monitoring Status of Punjab was worst as only one third (33.3%) AWCs had weighing scales and one fourth
(25..0%) AWWs were accurate enough to plot growth curves.

73
PSE
Data during monitoring visits was collected in respect of PSE activities conducted at all the AWWs were
providing services related to PSE.
Different methods were being used included play way method (28.6%), role play (9.2) etc.
Health Check-up and Immunization
Health Check-up and Immunization Services were rated as good by 60.7 percent consultant
Majority (85.7%) of the AWWs were reported to maintenance proper of records and registers of
immunization.
Referral Services
The availability of referral slips at AWCs was reported in only 19.4 percent AWC and no slips were
available in any of the centers in States/Uts of Chandigarh, Delhi, Goa, Haryana and Kerala, which is matter
of great concern.
Community Support
81.1 percent local women/SHGs were attending meeting being organized by AWWs. These meeting are
generally organized for imparting nutrition and health education to mothers/community.
Nutrition and Health Education
NHED is another very essential service of ICDS scheme. 74.5 percent AWWs organized nutrition and health
education sessions.
In order to popularize the ICDS in community 10.9 percent AWWs have reported informing about the
importance and services of ICDS.
The most prevalent methods used by them during NHEd sessions with mothers were lecture-cum-discussion
(70.1%).
Data reflected that the NHEd materials were grossly inadequate in AWCs to conduct the activities smoothly.

74
Problems/difficulties faced by AWWs
The major problem reported by AWWs was lack of facilities (95.7%) these were mainly lack of
infrastructure and improper drinking water and toilet facilities. Other problems listed were lack of funds
(13.1%), excess workload (14.2) and lack of community support (12.0%).
Support Guidance
37.4 percent AWWs received guidance and support from supervisors/CDPOs on record keeping followed by
NHEd session (18.0%), Health and nutrition, which also. However, 19.8 percent AWWs did not receive any
specific guidance and support from their respective supervisors/CDPOs.
SUGGESTIONS
The major suggestions for improving implementation ICDS programme include:
Proper infrastructural facilities at project level as well as AWC level
Convergence of services with health department for health check-up, immunization and referral
Increase in honorarium of AWW
Filling up of vacant position
Strict monitoring and supervision of delivery of services
Regular supply and quality to supplementary nutrition programme to be assessed
Proper Growth Monitoring and functional weighing scales
Ensuring supply of medicine kit and vaccines at AWC
PSE/NHED kits to be made available
Availability of vehicle for monitoring
Village level involvement of PRIs for village level monitoring
To bring out change in the knowledge attitudes and practices of community it essential that complete and latest
information is imp


