
Morphological and physiological changes in Microcystisaeruginosa as a result of interactions with heterotrophicbacteria
HONG SHEN*, †, YUAN NIU †, PING XIE †, * , MIN TAO † AND XI YANG †
*Fisheries College of Huazhong Agricultural University, Wuhan, China†Donghu Experimental Station of Lake Ecosystems, State Key Laboratory of Freshwater Ecology and Biotechnology of China,
Institute of Hydrobiology, Chinese Academy of Sciences, Wuhan, China
SUMMARY
1. To reveal the role of aquatic heterotrophic bacteria in the process of development of
Microcystis blooms in natural waters, we cocultured unicellular Microcystis aeruginosa with
a natural Microcystis-associated heterotrophic bacterial community.
2. Unicellular M. aeruginosa at different initial cell densities aggregated into colonies in the
presence of heterotrophic bacteria, while axenic Microcystis continued to grow as single
cells. The specific growth rate, the chl a content, the maximum electron transport rate
(ETRmax) and the synthesis and secretion of extracellular polysaccharide (EPS) were higher
in non-axenic M. aeruginosa than in axenic M. aeruginosa after cell aggregation, whereas
axenic and non-axenic M. aeruginosa displayed the same physiological characteristic before
aggregation.
3. Heterotrophic bacterial community composition was analysed by PCR–denaturing
gradient gel electrophoresis (PCR–DGGE) fingerprinting. The biomass of heterotrophic
bacteria strongly increased in the coinoculated cultures, but the DGGE banding patterns in
coinoculated cultures were distinctly dissimilar to those in control cultures with only
heterotrophic bacteria. Sequencing of DGGE bands suggested that Porphyrobacter, Flavo-
bacteriaceae and one uncultured bacterium could be specialist bacteria responsible for the
aggregation of M. aeruginosa.
4. The production of EPS in non-axenic M. aeruginosa created microenvironments that
probably served to link both cyanobacterial cells and their associated bacterial cells into
mutually beneficial colonies. Microcystis colony formation facilitates the maintenance of
high biomass for a long time, and the growth of heterotrophic bacteria was enhanced by
EPS secretion from M. aeruginosa.
5. The results from our study suggest that natural heterotrophic bacterial communities
have a role in the development of Microcystis blooms in natural waters. The mechanisms
behind the changes of the bacterial community and interaction between cyanobacteria and
heterotrophic bacteria need further investigations.
Keywords: aggregation, community composition, extracellular polysaccharide, heterotrophic bacteria,Microcystis aeruginosa
Introduction
The phytoplankton in eutrophied lakes is usually
dominated by large, colony-forming species of cyano-
bacteria (Dokulil & Teubner, 2000). Species of the
Correspondence: Ping Xie, Donghu Experimental Station of
Lake Ecosystems, State Key Laboratory of Freshwater Ecology
and Biotechnology of China, Institute of Hydrobiology, Chinese
Academy of Sciences, China. E-mail: [email protected]
Freshwater Biology (2011) 56, 1065–1080 doi:10.1111/j.1365-2427.2010.02551.x
� 2011 Blackwell Publishing Ltd 1065
genus Microcystis frequently achieve large popula-
tions and form dense toxic surface blooms, which can
create serious water quality problems (Sivonen, 1996;
Jochimsen et al., 1998; Tyagi et al., 1999). To achieve
and maintain such dominance, Microcystis possesses a
broad array of specific morphological and physiolog-
ical adaptive mechanisms. In freshwaters, Microcystis
commonly forms large mucilaginous colonies with
numerous heterotrophic bacteria embedded in the
mucilage (Whitton, 1973; Brunberg, 1999). The
formation of colonies and aggregates is of decisive
importance for the physiology and behaviour of
cyanobacteria (Dokulil & Teubner, 2000). Microcystis
occurs mainly as colonial morphs under natural
conditions (Reynolds et al., 1981), but as single cells
in laboratory cultures. Previous laboratory studies
(Shen & Song, 2007; Wu et al., 2007) indicated that
unicellular and colonial Microcystis display different
physiological characteristics, especially in terms of
their responses to environmental stress. Formation of
colonies or aggregates could be induced by flagellate
grazing (Burkert et al., 2001; Yang et al., 2008) and by
extracellular microcystins (Sedmak & Elersek, 2005).
The typical development and decline of Microcystis
blooms includes aggregation of cells, formation of
colonies and disaggregation of colonies and has been
studied extensively (Worm & Søndergaard, 1998;
Jacoby et al., 2000; Wilson, Wilson & Hay, 2006;
Yoshida et al., 2007). In this regard, the role of aquatic
bacteria has received increasing attention. Doucette
(1995) suggested that interactions between bacteria
and harmful algal species are important for under-
standing the dynamics of harmful algal blooms.
Grossart, Czub & Simon (2006) showed that hetero-
trophic bacteria play an important role in the control
of the development and aggregation of a diatom. In
aquatic ecosystems, bacteria and algae are the numer-
ically dominant organisms in the plankton, and their
metabolism largely controls energy flow and nutrient
cycling (Cole, 1982). Each lake has its own distinct
bacterioplankton community, suggesting that differ-
ences are partly related to the equilibrium state of the
lake (Gucht et al., 2005). Different phylogenetic groups
of bacteria, with specialised exoenzymes to metabolise
specific types of organic matter, are associated with
the initiation, maintenance and termination phases of
algal blooms (Smith et al., 1995; Riemann, Steward &
Azam, 2000). On the other hand, the quantitative
and qualitative differences in phytoplankton species
composition may lead to pronounced differences in
the bacterioplankton species composition (Pinhassi
et al., 2004). Some bacteria may promote the growth of
algae or live in symbiosis with them (Ferrier, Martin &
Rooney-Varga, 2002; Uribe & Espejo, 2003), while
others inhibit the growth of algae or exert algicidal
activities (Lovejoy, Bowman & Hallegraeff, 1998; Lee
et al., 2000).
A considerable number of studies have focused on
the interactions between Microcystis species and its
associated bacteria. These studies include the follow-
ing: (i) competition or exchange of nutrients (Steppe
et al., 1996; Fuks et al., 2005; Jiang et al., 2007), (ii) lysis
of Microcystis cells directly or indirectly (Manage,
Kawabata & Nakano, 2001; Ozaki et al., 2008) and (iii)
degradation of microcystin (Maruyama et al., 2003;
Lemes et al., 2008). In natural freshwaters, the rela-
tionship between Microcystis and bacteria is probably
as complex as any other kind of interaction. Results
from field experiments (Worm & Søndergaard, 1998;
Kapustina, 2006) have shown significant differences in
the quantity, production and activity of Microcystis-
associated bacteria and free-living bacteria. In addi-
tion, growth and physiological traits of Microcystis
may change during the development of blooms
because cyanobacteria may play a role both as
primary producers and prey in the microbial loop
(Fuks et al., 2005).
Despite the large number of field and experimental
studies that have been carried out, understanding of
the interaction between Microcystis and its associated
bacteria remains unclear. The above-mentioned re-
sults are from laboratory studies of Microcystis-bacte-
ria interactions obtained with monoclonal bacterial
strains. It is therefore quite difficult to extrapolate
these results to natural conditions and to understand
the complexity of the interaction since most (>99%)
aquatic bacteria cannot be purified and cultured. To
understand how bacteria influence the development
of Microcystis blooms in natural waters, it is necessary
to test the impact of natural bacterial communities
and not just the impact of monoclonal strains. Micro-
cystis populations mainly consist of colonies under
natural conditions (Reynolds et al., 1981), and we
hypothesised that heterotrophic bacterial communi-
ties might be crucial for the aggregation of Microcystis
cells and through morphological changes of Microcys-
tis lead to physiological changes, which facilitate
maintenance of a high biomass. The aim of this study
1066 H. Shen et al.
� 2011 Blackwell Publishing Ltd, Freshwater Biology, 56, 1065–1080
was to simulate the natural environment in a surface
cyanobacterial bloom to study the interactions be-
tween Microcystis aeruginosa and a natural bacterial
community. The morphological and physiological
characteristics of M. aeruginosa and changes of het-
erotrophic bacterial community composition were
investigated in the course of coculture of M. aerugin-
osa and heterotrophic bacterial community. Our
results contribute to understanding the specific role
of heterotrophic bacteria in the dynamics of Microcys-
tis bloom in natural water bodies.
Methods
Strains, cultivation and experimental design
A unicellular toxic M. aeruginosa strain was obtained
from the Culture Collections of Freshwater Algae of
the Institute of Hydrobiology, Wuhan, China. This
strain was isolated from Lake Taihu (a shallow
eutrophic lake in the east China) in 1997. An axenic
isolate was established by streak plate isolation on
BG-11 agar medium (Stanier et al., 1971), and then
grown in batch culture in BG-11 medium at 25 ± 1 �C
and illuminated in a 12 : 12 h light : dark cycle at
irradiance of 50 lE m)2 s)1. The axenic cultures were
transferred weekly to fresh medium and were main-
tained in the exponential phase. Regular inspection
using DAPI staining, in conjunction with epifluores-
cence microscope, showed that cultures were axenic
at the beginning of the experiment and that the
biomass of bacteria in the axenic cultures never
exceeded 1% of Microcystis biomass during the
experiment.
The natural bacterial community used in this study
was isolated from the mucilage of Microcystis colonies.
Lake water was taken from the surface layer (0.5 m) of
Lake Taihu (31�24¢N, 120�14¢E) in June 2008. At the
time of sampling, a large part of the lake surface was
covered with dense Microcystis blooms, consisting
mainly of M. aeruginosa. The Microcystis colonies were
collected by filtration of 1 L of lake water through a
20-lm mesh plankton net. According to Worm &
Søndergaard (1998) and Kapustina (2006), we opera-
tionally defined that bacteria attached to Microcystis
dominated the >20-lm size fraction in abundance and
activity. The collected Microcystis samples were
washed in sterile deionised water (‡16 MW) to
disaggregate the colonies into single cells and to
dissolve the Microcystis mucilage (Plude et al., 1991).
The suspension was centrifuged at 10 000 g for 10 min
at 4 �C, and the supernatant was transferred to a new
flask. The remaining pellet was washed and centri-
fuged three times. The supernatant, containing the
natural bacterial community from the mucilage of
Microcystis, was filtered through GF ⁄C filter papers
(pore size 1.2 lm, Whatman, UK) before use to rule
out contamination by naturally occurring Microcystis
cells. Each step of the isolation procedure was carried
out under sterile conditions. The experiment was
started immediately after isolation.
The axenic M. aeruginosa was harvested by centri-
fugation, washed and centrifuged three times with
sterile distilled water and thereafter transferred to 1-L
Erlenmeyer flasks containing 500-mL autoclaved
BG-11 medium. Seven different treatments were
established (see Table 1): three axenic treatments
(treatment 1, 3 and 5) with initial cyanobacterial cell
concentrations of 1, 10 and 100 · 105 cells mL)1; three
different non-axenic treatments (treatment 2, 4 and 6)
with initial cyanobacterial cell concentrations of 1, 10
and 100 · 105 cells mL)1, all three inoculated with
25 mL of the natural heterotrophic bacterial commu-
nity with initial concentration of 10 · 105 cells mL)1;
and one treatment with a pure culture of heterotro-
phic bacteria (treatment 7) with an initial cell concen-
tration of 10 · 105 cells mL)1. Each treatment was
prepared in triplicate, and all the cultures were
incubated under the conditions described above. The
whole experiment lasted 34 days, and the cultures
were harvested every third day to monitor changes in
growth and physiological parameters. The harvested
culture volume was replaced with fresh medium to
sustain growth.
Microcystis cell count and cell morphology
After staining with Lugol’s Iodine solution, Microcys-
tis cells were enumerated in a haemocytometer using
an Olympus BX50 (Tokyo, Japan) microscope at 600·magnification. The specific growth rate was calculated
using the method given by Pirt (1975). Cell size was
determined with an object micrometre at 600· mag-
nification. Cyanobacterial cells and colonies in at least
10 randomly fields of view were measured. The areas
of cyanobacterial cells and colonies were calculated by
measuring diameter and width (Montagnes et al.,
1994).
Microcystis-heterotrophic bacterial community interactions 1067
� 2011 Blackwell Publishing Ltd, Freshwater Biology, 56, 1065–1080
DGGE analyses of bacterial community composition
The composition of the bacterial community was
determined by DGGE of the PCR-amplified fragments
of 16S rDNA gene, followed by cloning and sequenc-
ing of all visible bands.
A 10-mL sample of culture was sonicated to detach
associated bacteria and pre-filtered with 3-lm filters
to remove M. aeruginosa (Xing & Kong, 2007). The
filtrate was then filtered through a 0.2-lm pore size
polycarbonate filter (Whatman) to capture bacteria.
Filters were frozen at )80 �C immediately and kept
frozen until use. For DNA extraction, the filters
containing microbes were cut into small pieces (1–
2 mm2) with a sterile scalpel, and then total DNA was
extracted using a bacterial DNA Kit (Omega, Bio-tek,
Doraville, GA, USA) according to the manufacturer’s
recommendations. The variable V3 region of 16S
rRNA fragments was amplified by PCR using a
universal primer 518R (5¢-ATTACCGCGGCTGCT-
GG-3¢) and a bacterial primer 357F (5¢-CCTACGGG-
AGGCAGCAG-3¢) with a 40-bp GC clamp attached to
its 5¢ end (Muyzer, Waal & Uitterlinden, 1993). PCRs
of 50 lL contained 1 · PCR buffer, 1.5 mMM MgCl2,
200 lMM of each dNTP, 0.2 lMM of each primer, 2.5 units
of Taq DNA polymerase (Takara, Shuzo, Japan), 50 ng
of template DNA and DNase- and RNase-free water.
Touchdown PCR was conducted according to the
modified method of Riemann et al. (1999). With 5-min
initial denaturation at 94 �C followed by a thermal
cycling programme as follows: 1-min denaturation at
94 �C; 1-min primer annealing at an initial 65 �C,
decreasing 1 �C every cycle to a final of 55 �C; 3-min
primer extension at 72 �C. Thirty cycles were run
followed by a final 7-min incubation at 72 �C. A
negative control, in which the template was replaced
by an equivalent volume of sterile deionised water,
was included in the PCRs. After PCR, the size of the
products was confirmed on a 1.5% agarose gel.
About 20 lL of PCR products was loaded on a 8%
(w ⁄v) polyacrylamide gel (37.5 : 1 acrylamide: bis-
acrylamide) with a denaturing gradient that ranged
from 40 to 60%, where 100% denaturant was defined
as 7 MM urea plus 40% deionised formamide. DGGE
was performed with a Dcode system (Bio-Rad Labo-
ratories, Hercules, CA, USA) using 1 · TAE running
buffer (20 mMM Tris, 10 mMM acetic acid, 0.5 mMM EDTA,
pH 8.0) at 60 �C for 7 h at 150 V. The gel was stained
in 1 : 10000 diluted GelRed (Biotium, Hayward, CA,
USA) nucleic acid staining solution for 30 min and
photographed using a Bio Image System (Gene Com.
Ltd., Hong Kong) under UV light.
All visible bands in the DGGE gel were carefully
excised from the gel, and DNA was eluted overnight
at 4 �C in 40 lL of sterile deionised water. One
microlitre of eluted DNA was used as a template for
PCR amplification with the same primers and
programme as described above. The reamplicons
were electrophoresed again on a DGGE gel to check
the positions of the original band and then purified
by a Gel Recovery Purification Kit (AxyPrep�,
Union City, CA, USA) and ligated into pMD18-T
plasmid vector system (Takara) and transformed into
Escherichia coli DH5a-competent cells. Positive clones
were cultured overnight and then submitted for
sequencing using M13 primers and an automated
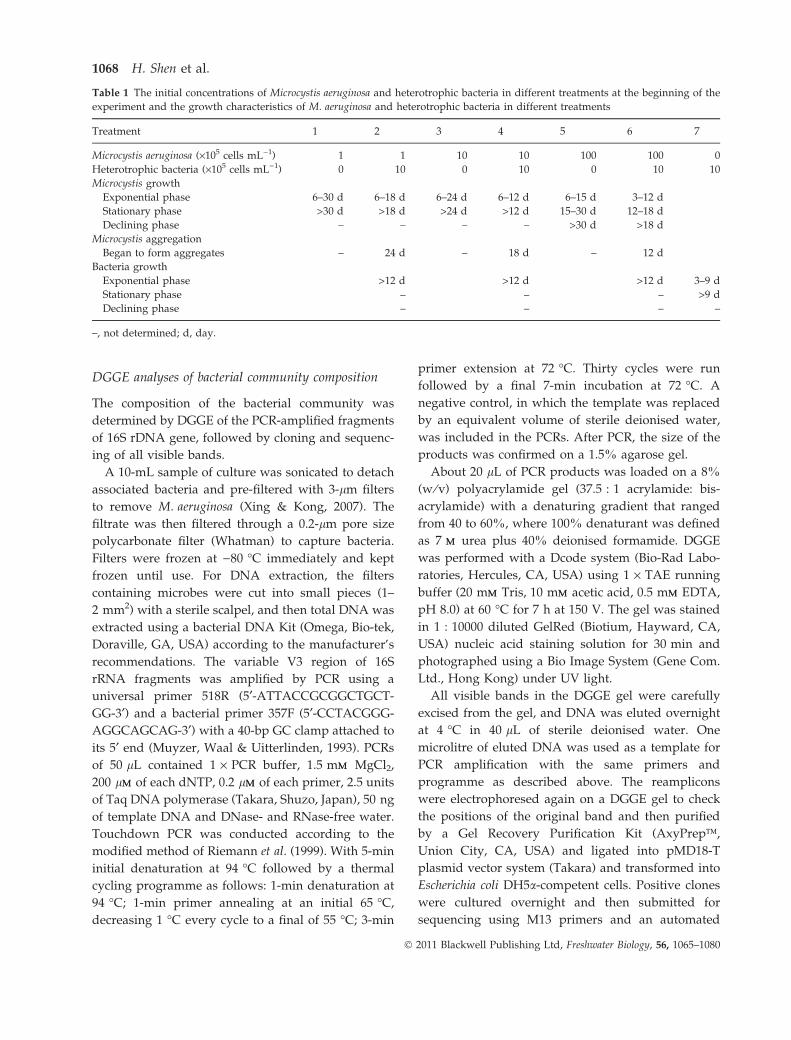
Table 1 The initial concentrations of Microcystis aeruginosa and heterotrophic bacteria in different treatments at the beginning of the
experiment and the growth characteristics of M. aeruginosa and heterotrophic bacteria in different treatments
Treatment 1 2 3 4 5 6 7
Microcystis aeruginosa (·105 cells mL)1) 1 1 10 10 100 100 0
Heterotrophic bacteria (·105 cells mL)1) 0 10 0 10 0 10 10
Microcystis growth
Exponential phase 6–30 d 6–18 d 6–24 d 6–12 d 6–15 d 3–12 d
Stationary phase >30 d >18 d >24 d >12 d 15–30 d 12–18 d
Declining phase – – – – >30 d >18 d
Microcystis aggregation
Began to form aggregates – 24 d – 18 d – 12 d
Bacteria growth
Exponential phase >12 d >12 d >12 d 3–9 d
Stationary phase – – – >9 d
Declining phase – – – –
–, not determined; d, day.
1068 H. Shen et al.
� 2011 Blackwell Publishing Ltd, Freshwater Biology, 56, 1065–1080
ABI DNA sequencer at the Genomics Company
(Wuhan, China).
Cluster analyses of DGGE profiles were performed
with the NTSYS program version 2.10e (Exeter soft-
ware, Setauket, NY, USA). A binary matrix was
constructed by scoring presence or absence of DGGE
bands. Pairwise similarities between gel banding
patterns were quantified using the Dice coefficient
as: SD = (2NAB) ⁄ (NA + NB), where NAB is the number
of bands common to the samples A and B, and NA and
NB are the number of bands in samples A and B,
respectively. The unweighted pair group method with
arithmetic average (UPGMA) was used to investigate
differences among bacterial community composition
according to the method of Xing & Kong (2007).
Bacterial sequences were compared to known
sequences in the GenBank database by the BLAST
algorithm to identify sequences with a high degree of
similarity. Sequences were aligned using CLUSTAL
W and corrected manually to delete ambiguous and
non-informative bases, and phylogenetic tree was
constructed using a neighbour-joining algorithm
with MEGA 4. The 16S rRNA gene sequences from
this study were deposited in the NCBI GenBank
database under accession numbers GU362868–
362879.
Bacterial abundance
Samples for determination of bacterial abundance
were preserved with 4% (v ⁄v) formaldehyde. The
fixed sample of 0.5–2 mL was stained with 4¢6¢diamidino-2-phenolindole [DAPI; Sigma (St Louis,
MO, USA), final concentration 1 lg mL)1] for 10–
15 min (Porter & Feig, 1980). Afterwards, the sample
was gently filtered onto a 0.2-lm pore size black
polycarbonate filter (Whatman, Maidstone, UK). Total
bacterial cell numbers were counted using epifluores-
cence microscope (Zeiss Axioskop 20, Oberkochen,
Germany). A minimum of 10 replicates was counted
for each sample.
Determination of chlorophyll a content in Microcystis
To determine the content of chlorophyll a (Chl a) in
M. aeruginosa, the cyanobacterial cells were extracted
overnight in 95% ethanol in the dark. Debris was then
removed by centrifugation, and the supernatant was
analysed spectrophotometrically (UV-1601; Shimadzu,
Kyoto, Japan) at 665 nm and 649 nm against 95%
ethanol as blank. The concentration of Chl a was
calculated according to Wellburn (1994).
Determination of chlorophyll fluorescence parameters
A pulse-amplitude-modulated fluorescence monitor-
ing system (PAM; Walz, Effeltrich, Germany) was
used to measure the in vivo chlorophyll fluorescence
at room temperature. The rapid light curves (RLCs)
based on measurement of the relative ETRs were
derived from estimates of DFv ⁄Fm¢ (the operational
quantum yield of photosynthetic system II (PSII),
FPSIIe). The numerical values of chlorophyll fluores-
cence of samples exposed to 12 intensities of actinic
light increasing from 0 to 1265 lmol photons PAR
m)2 s)1 were recorded during a 3-min time series. The
photosynthetic ETR was calculated using the follow-
ing formula: ETR = ((Fm¢ – Ft) ⁄Fm¢ · 0.84 · 0.5 · PAR
(m)2 s)1)), where Fm¢ and Ft denote the maximum and
steady state fluorescence in light, respectively. The
approximate amount of incident light absorbed by the
algae was 0.84, of which approximately 0.5 was
transferred to PSII (Shen & Song, 2007).
Determination of extracellular polysaccharides
Actively growing cultures of M. aeruginosa colonies
were harvested for staining of bound extracellular
polysaccharides (EPS) by low-speed centrifugation
and resuspended in approximately 0.5 mL of distilled
water. Two drops of the cell suspension were mixed
with five drops of stain (0.1% w ⁄v Alcian Blue 8GX in
0.5 N acetic acid) in a small test tube, mixed and
allowed to stand at room temperature for 5 min
(Crayton, 1982). Samples were observed and photo-
graphed using a microscope (Olympus BX50) under
bright field illumination and at a magnification of
600·. The concentrations of the total dissolved EPS in
the medium of all five treatments were determined by
the phenol-H2SO4 method (Dubois et al., 1956) using a
standard of D-galactose.
Statistics and data processing
Results are expressed as means ± standard deviation
(SD). The statistical analysis was carried out using
one-way ANOVAANOVA followed by a Tukey post hoc test
to elucidate any significant differences between
Microcystis-heterotrophic bacterial community interactions 1069
� 2011 Blackwell Publishing Ltd, Freshwater Biology, 56, 1065–1080
treatment groups and control groups. Probability
values of <0.05 were accepted. Regression analysis
was used to test the relationship between specific
growth rate and M. aeruginosa initial concentration
and followed by Student’s t-test to test the significance
of the correlation coefficient. Statistics and graphs
were obtained using the software Microcal� Origin
7.0 (Microcal Software Inc., Northampton, MA, USA).
Results
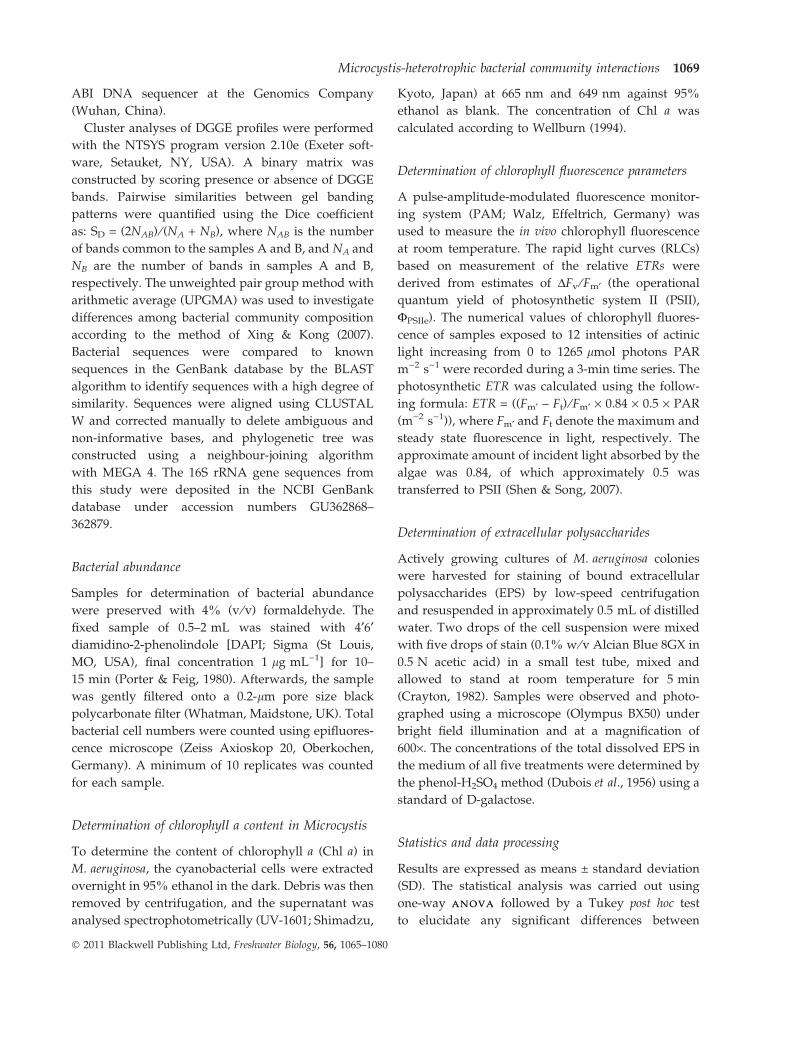
Cell aggregation
Axenic and non-axenic cultures of unicellular M. aeru-
ginosa displayed distinct morphological differences
during the experiment. Axenic M. aeruginosa main-
tained its single-celled form (Fig. 1a) throughout
the observation period with cells evenly spread in
the counting chamber. In contrast, M. aeruginosa in the
non-axenic treatments 2, 4 and 6 aggregated into
colonies (Fig. 1b). The colonies consisted of multicel-
lular structures that were surrounded by a polysac-
charide substance so that the cells remained in tight
arrangements after shaking. When aggregates of
M. aeruginosa in the non-axenic treatments were
stained with Alcian Blue, the cells surface turned blue
(Fig. 1c), which is cytochemical evidence for the
presence of acidic polysaccharides in the colonies.
However, the axenic M. aeruginosa cells failed to stain
with Alcian blue.
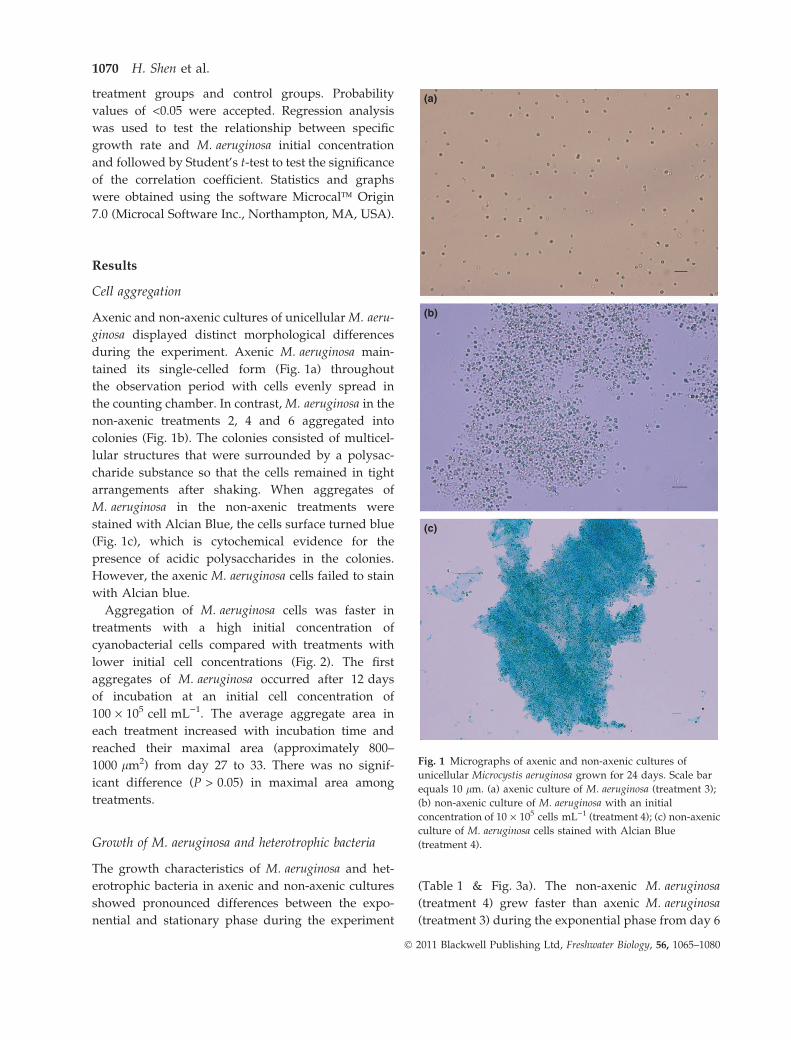
Aggregation of M. aeruginosa cells was faster in
treatments with a high initial concentration of
cyanobacterial cells compared with treatments with
lower initial cell concentrations (Fig. 2). The first
aggregates of M. aeruginosa occurred after 12 days
of incubation at an initial cell concentration of
100 · 105 cell mL)1. The average aggregate area in
each treatment increased with incubation time and
reached their maximal area (approximately 800–
1000 lm2) from day 27 to 33. There was no signif-
icant difference (P > 0.05) in maximal area among
treatments.
Growth of M. aeruginosa and heterotrophic bacteria
The growth characteristics of M. aeruginosa and het-
erotrophic bacteria in axenic and non-axenic cultures
showed pronounced differences between the expo-
nential and stationary phase during the experiment
(Table 1 & Fig. 3a). The non-axenic M. aeruginosa
(treatment 4) grew faster than axenic M. aeruginosa
(treatment 3) during the exponential phase from day 6
(a)
(b)
(c)
Fig. 1 Micrographs of axenic and non-axenic cultures of
unicellular Microcystis aeruginosa grown for 24 days. Scale bar
equals 10 lm. (a) axenic culture of M. aeruginosa (treatment 3);
(b) non-axenic culture of M. aeruginosa with an initial
concentration of 10 · 105 cells mL)1 (treatment 4); (c) non-axenic
culture of M. aeruginosa cells stained with Alcian Blue
(treatment 4).
1070 H. Shen et al.
� 2011 Blackwell Publishing Ltd, Freshwater Biology, 56, 1065–1080
to 18. However, the exponential phase of non-axenic
M. aeruginosa (treatment 4) lasted shorter period
than that of axenic M. aeruginosa (treatment 3). During
the stationary phase, the cell density of axenic
M. aeruginosa (treatment 3) was higher than that of
non-axenic M. aeruginosa (treatment 4) (Fig. 3a). Sim-
ilarly, the growth of heterotrophic bacteria in non-
axenic M. aeruginosa (treatment 4) and in pure
culture (treatment 7) also showed significant differ-
ences (Fig. 3a). Cell densities of heterotrophic bacte-
ria in the pure culture (treatment 7) reached a
maximum on day 9 and remained almost constant
thereafter. In contrast, cell densities of heterotrophic
bacteria cocultured with M. aeruginosa (treatment 4)
were higher than that in the pure culture throughout
the whole experiment period. In the non-axenic
cultures (treatment 4), the growth of M. aeruginosa
stabilised and the cells entered the stationary phase
when the density of heterotrophic bacteria increased
dramatically after day 12. A similar phenomenon
was also observed in treatment 2 and 6 (data not
shown).
The specific growth rate of non-axenic M. aeruginosa
correlated negatively (r = )0.948, n = 9, P < 0.001) to
the initial cyanobacterial density (Fig. 3b), and the
specific growth rates were higher in the two non-
axenic M. aeruginosa treatments with initial inocula-
tion concentrations of 1 · 105 (F = 35.7071,
P = 0.00938) and 10 · 105 cell mL)1 (F = 19.311,
P = 0.02184) than that in the axenic M. aeruginosa
(treatment 1 and 3), whereas the growth rate in
treatment 6 (initial cell concentration of 100 · 105)
compared to axenic M. aeruginosa (treatment 5) was
slightly higher (P > 0.05) (Fig. 3b). On the other hand,
M. aeruginosa in higher concentrations promoted het-
erotrophic bacterial growth. The growth rate of
heterotrophic bacteria in coculture with M. aeruginosa
(treatment 2, 4 and 6) compared to those in pure
Fig. 2 The influence of heterotrophic bacteria on the average
aggregate area of unicellular Microcystis aeruginosa with different
initial cell concentration of 1 · 105 cell mL)1,
10 · 105 cell mL)1,100 · 105 cell mL)1, respectively. Values are
means ± SD.
(a)
(b)
Fig. 3 Growth characteristics of Microcystis aeruginosa and
heterotrophic bacteria in various treatments. Treatment 1, 3, 5:
axenic culture of M. aeruginosa, initial cell density 1 · 105,
10 · 105 and 100 · 105 cell mL)1, respectively; Treatment 2, 4,
6: coculture, initial heterotrophic bacterial cell density all
10 · 105 cell mL)1 and initial cyanobacterial cell density
1 · 105, 10 · 105 and 100 · 105 cell mL)1, respectively; Treat-
ment 7: pure culture of heterotrophic bacteria, initial cell
density 10 · 105 cells mL)1. Values represent means and error
bars represent SD. (a) Cell density changes of M. aeruginosa
and heterotrophic bacteria in treatment 3, 4 and 7. Open
symbols represent cyanobacteria growth; Filled symbols
represent heterotrophic bacteria growth. (b) The specific
growth rates of M. aeruginosa and bacteria in the exponential
phase.
Microcystis-heterotrophic bacterial community interactions 1071
� 2011 Blackwell Publishing Ltd, Freshwater Biology, 56, 1065–1080
culture (treatment 7) was significantly stimulated
(F3 = 47.8632, P = 0.00136) by M. aeruginosa, which
were correlated positively (r = 0.998, n = 9, P < 0.001)
with the M. aeruginosa initial concentration.
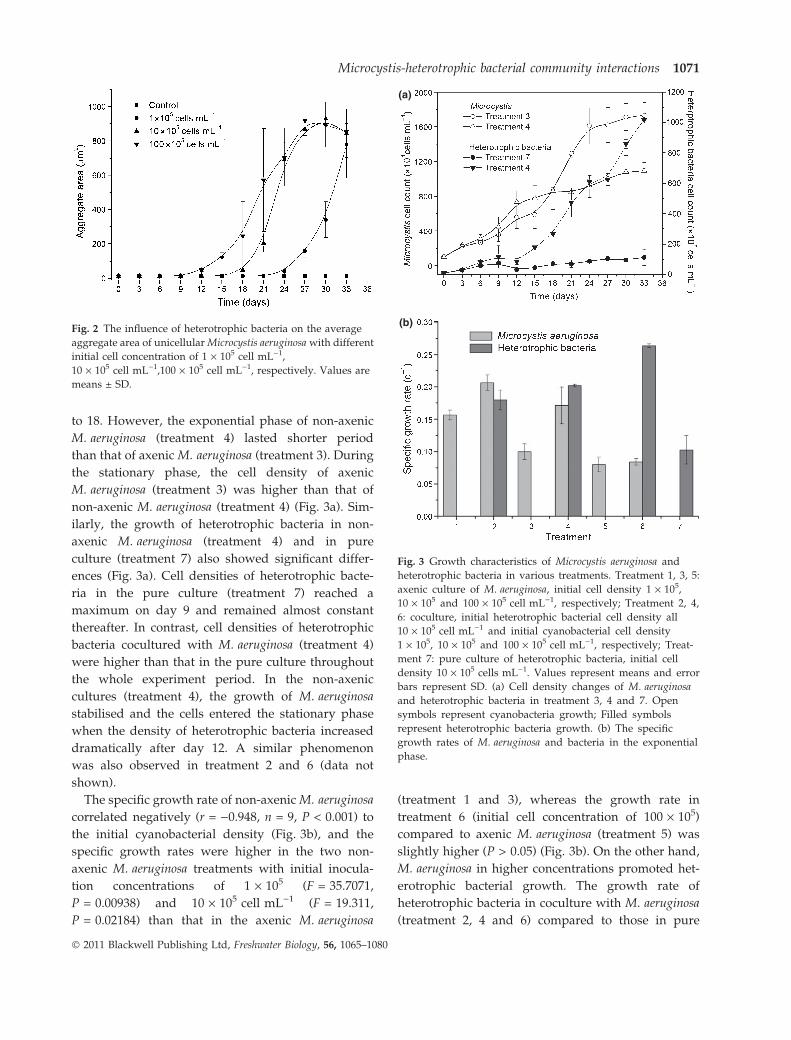
Heterotrophic bacteria community composition
The DGGE gel showed pronounced changes in rela-
tive brightness and position of DGGE bands of PCR-
amplified community DNA in the non-axenic culture
of M. aeruginosa (treatment 4) during the course of the
experiment, especially after day 9 (Fig. 4a). The
heterotrophic bacterial community consisted of 15
distinguishable DGGE bands on day 0, but had
decreased to five by day 9. After day 9, the numbers
of detected 16S rDNA bands remained about the
same. UPGMA clustering based on the position and
intensity of the bands indicated that the bacterial
community on day 0 was different from that on other
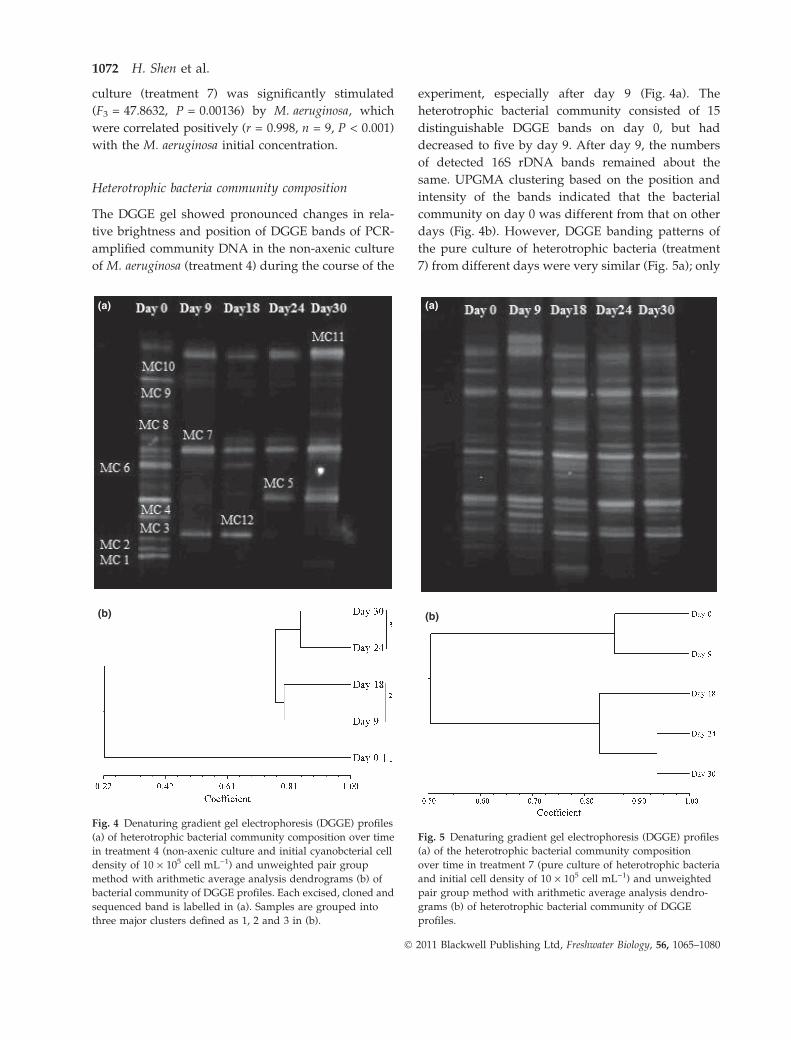
days (Fig. 4b). However, DGGE banding patterns of
the pure culture of heterotrophic bacteria (treatment
7) from different days were very similar (Fig. 5a); only
(a)
(b)
Fig. 4 Denaturing gradient gel electrophoresis (DGGE) profiles
(a) of heterotrophic bacterial community composition over time
in treatment 4 (non-axenic culture and initial cyanobcterial cell
density of 10 · 105 cell mL)1) and unweighted pair group
method with arithmetic average analysis dendrograms (b) of
bacterial community of DGGE profiles. Each excised, cloned and
sequenced band is labelled in (a). Samples are grouped into
three major clusters defined as 1, 2 and 3 in (b).
(a)
(b)
Fig. 5 Denaturing gradient gel electrophoresis (DGGE) profiles
(a) of the heterotrophic bacterial community composition
over time in treatment 7 (pure culture of heterotrophic bacteria
and initial cell density of 10 · 105 cell mL)1) and unweighted
pair group method with arithmetic average analysis dendro-
grams (b) of heterotrophic bacterial community of DGGE
profiles.
1072 H. Shen et al.
� 2011 Blackwell Publishing Ltd, Freshwater Biology, 56, 1065–1080
minor differences among days were observed
(Fig. 5b). Bands from different days with identical
vertical positions in the gel were assumed to have
identical sequences (Riemann et al., 1999). A total of 12
bands in treatment 4 were excised and successfully
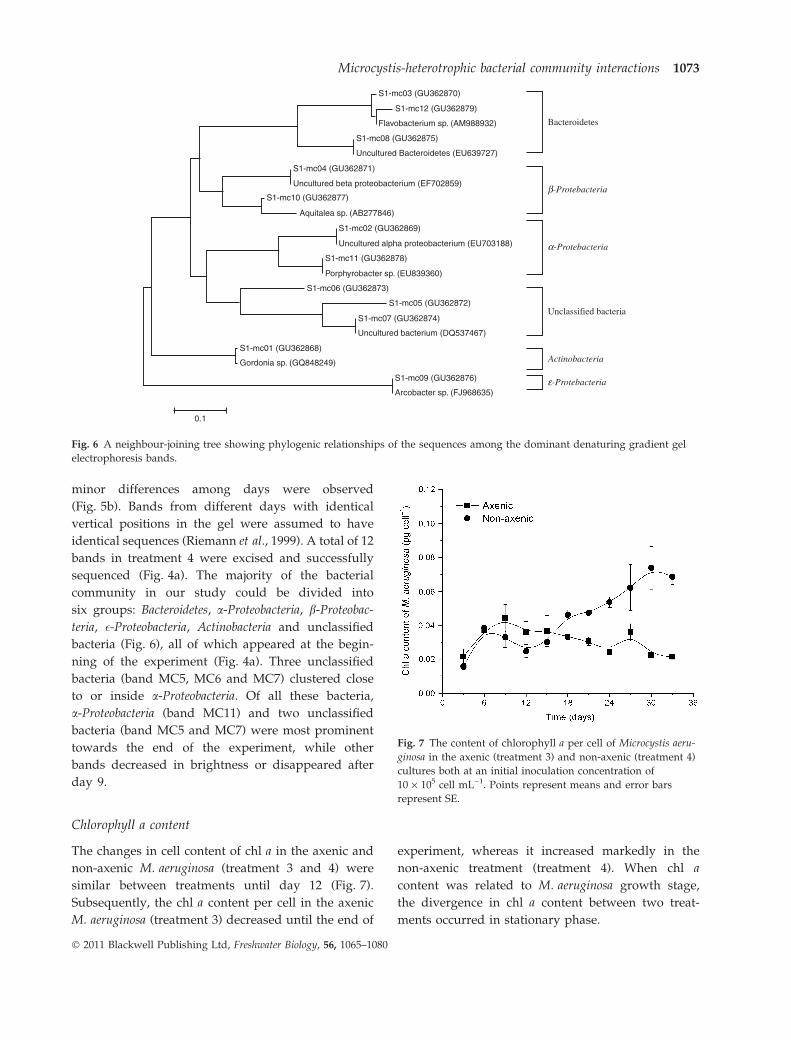
sequenced (Fig. 4a). The majority of the bacterial
community in our study could be divided into
six groups: Bacteroidetes, a-Proteobacteria, b-Proteobac-
teria, �-Proteobacteria, Actinobacteria and unclassified
bacteria (Fig. 6), all of which appeared at the begin-
ning of the experiment (Fig. 4a). Three unclassified
bacteria (band MC5, MC6 and MC7) clustered close
to or inside a-Proteobacteria. Of all these bacteria,
a-Proteobacteria (band MC11) and two unclassified
bacteria (band MC5 and MC7) were most prominent
towards the end of the experiment, while other
bands decreased in brightness or disappeared after
day 9.
Chlorophyll a content
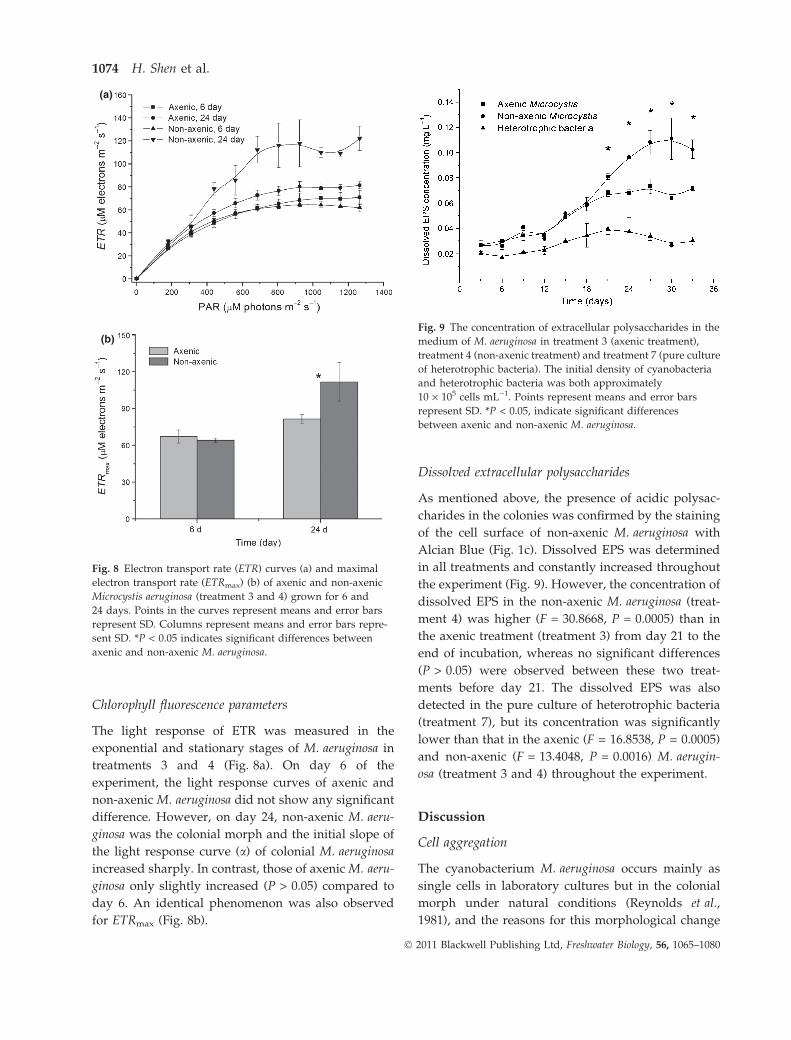
The changes in cell content of chl a in the axenic and
non-axenic M. aeruginosa (treatment 3 and 4) were
similar between treatments until day 12 (Fig. 7).
Subsequently, the chl a content per cell in the axenic
M. aeruginosa (treatment 3) decreased until the end of
experiment, whereas it increased markedly in the
non-axenic treatment (treatment 4). When chl a
content was related to M. aeruginosa growth stage,
the divergence in chl a content between two treat-
ments occurred in stationary phase.
S1-mc03 (GU362870)
Bacteroidetes
b-Protebacteria
a-Protebacteria
Unclassified bacteria
Actinobacteria
e-Protebacteria
S1-mc12 (GU362879)
Flavobacterium sp. (AM988932)
S1-mc08 (GU362875)
Uncultured Bacteroidetes (EU639727)
S1-mc04 (GU362871)
S1-mc10 (GU362877)
S1-mc02 (GU362869)
S1-mc11 (GU362878)
S1-mc06 (GU362873)
S1-mc05 (GU362872)
S1-mc07 (GU362874)
S1-mc01 (GU362868)
Gordonia sp. (GQ848249)
0.1
S1-mc09 (GU362876)
Porphyrobacter sp. (EU839360)
Arcobacter sp. (FJ968635)
Aquitalea sp. (AB277846)
Uncultured beta proteobacterium (EF702859)
Uncultured alpha proteobacterium (EU703188)
Uncultured bacterium (DQ537467)
Fig. 6 A neighbour-joining tree showing phylogenic relationships of the sequences among the dominant denaturing gradient gel
electrophoresis bands.
Fig. 7 The content of chlorophyll a per cell of Microcystis aeru-
ginosa in the axenic (treatment 3) and non-axenic (treatment 4)
cultures both at an initial inoculation concentration of
10 · 105 cell mL)1. Points represent means and error bars
represent SE.
Microcystis-heterotrophic bacterial community interactions 1073
� 2011 Blackwell Publishing Ltd, Freshwater Biology, 56, 1065–1080
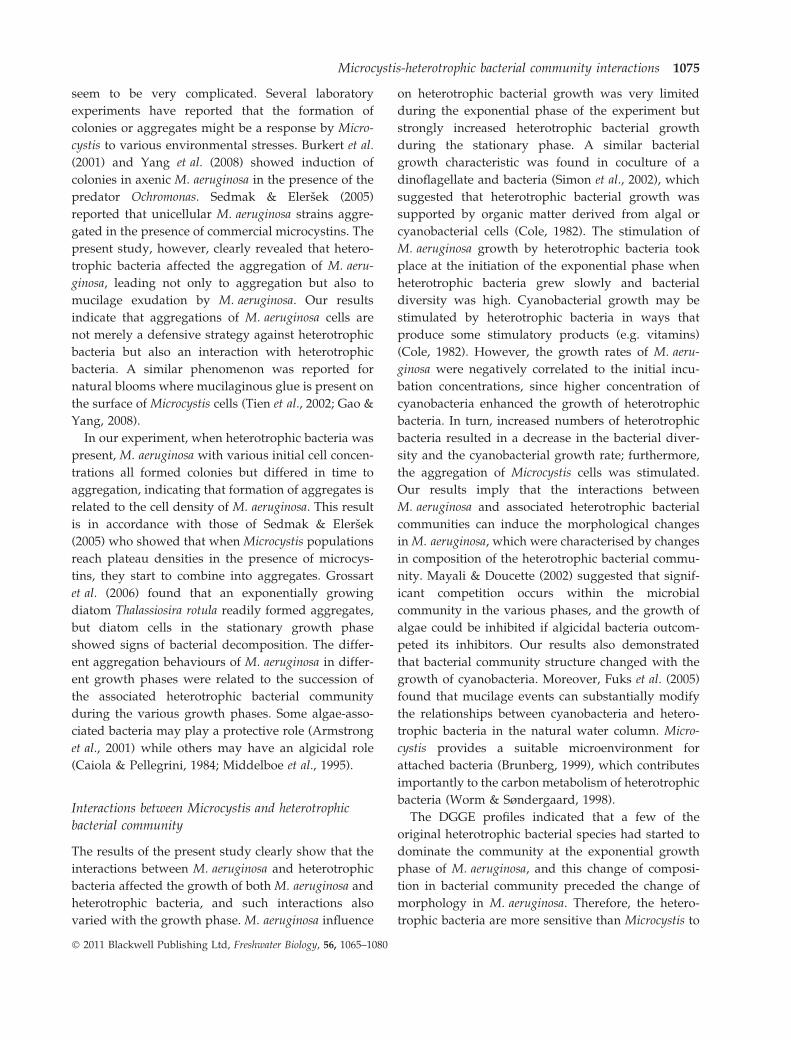
Chlorophyll fluorescence parameters
The light response of ETR was measured in the
exponential and stationary stages of M. aeruginosa in
treatments 3 and 4 (Fig. 8a). On day 6 of the
experiment, the light response curves of axenic and
non-axenic M. aeruginosa did not show any significant
difference. However, on day 24, non-axenic M. aeru-
ginosa was the colonial morph and the initial slope of
the light response curve (a) of colonial M. aeruginosa
increased sharply. In contrast, those of axenic M. aeru-
ginosa only slightly increased (P > 0.05) compared to
day 6. An identical phenomenon was also observed
for ETRmax (Fig. 8b).
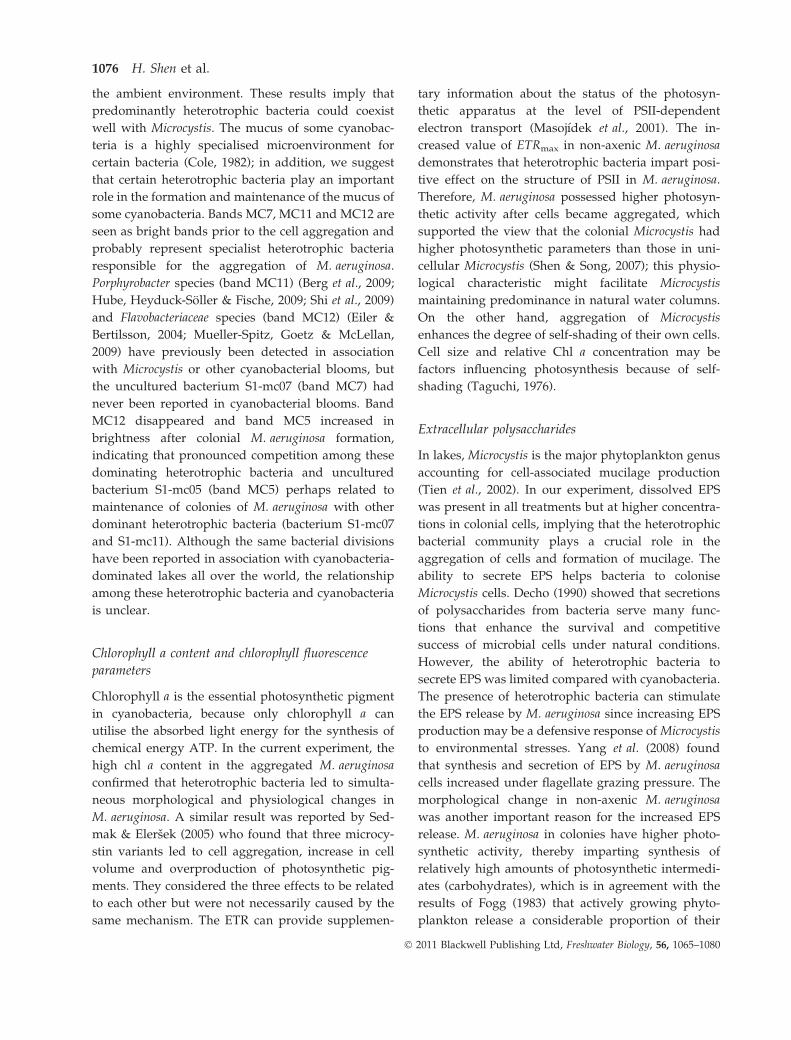
Dissolved extracellular polysaccharides
As mentioned above, the presence of acidic polysac-
charides in the colonies was confirmed by the staining
of the cell surface of non-axenic M. aeruginosa with
Alcian Blue (Fig. 1c). Dissolved EPS was determined
in all treatments and constantly increased throughout
the experiment (Fig. 9). However, the concentration of
dissolved EPS in the non-axenic M. aeruginosa (treat-
ment 4) was higher (F = 30.8668, P = 0.0005) than in
the axenic treatment (treatment 3) from day 21 to the
end of incubation, whereas no significant differences
(P > 0.05) were observed between these two treat-
ments before day 21. The dissolved EPS was also
detected in the pure culture of heterotrophic bacteria
(treatment 7), but its concentration was significantly
lower than that in the axenic (F = 16.8538, P = 0.0005)
and non-axenic (F = 13.4048, P = 0.0016) M. aerugin-
osa (treatment 3 and 4) throughout the experiment.
Discussion
Cell aggregation
The cyanobacterium M. aeruginosa occurs mainly as
single cells in laboratory cultures but in the colonial
morph under natural conditions (Reynolds et al.,
1981), and the reasons for this morphological change
(a)
(b)
Fig. 8 Electron transport rate (ETR) curves (a) and maximal
electron transport rate (ETRmax) (b) of axenic and non-axenic
Microcystis aeruginosa (treatment 3 and 4) grown for 6 and
24 days. Points in the curves represent means and error bars
represent SD. Columns represent means and error bars repre-
sent SD. *P < 0.05 indicates significant differences between
axenic and non-axenic M. aeruginosa.
Fig. 9 The concentration of extracellular polysaccharides in the
medium of M. aeruginosa in treatment 3 (axenic treatment),
treatment 4 (non-axenic treatment) and treatment 7 (pure culture
of heterotrophic bacteria). The initial density of cyanobacteria
and heterotrophic bacteria was both approximately
10 · 105 cells mL)1. Points represent means and error bars
represent SD. *P < 0.05, indicate significant differences
between axenic and non-axenic M. aeruginosa.
1074 H. Shen et al.
� 2011 Blackwell Publishing Ltd, Freshwater Biology, 56, 1065–1080
seem to be very complicated. Several laboratory
experiments have reported that the formation of
colonies or aggregates might be a response by Micro-
cystis to various environmental stresses. Burkert et al.
(2001) and Yang et al. (2008) showed induction of
colonies in axenic M. aeruginosa in the presence of the
predator Ochromonas. Sedmak & Elersek (2005)
reported that unicellular M. aeruginosa strains aggre-
gated in the presence of commercial microcystins. The
present study, however, clearly revealed that hetero-
trophic bacteria affected the aggregation of M. aeru-
ginosa, leading not only to aggregation but also to
mucilage exudation by M. aeruginosa. Our results
indicate that aggregations of M. aeruginosa cells are
not merely a defensive strategy against heterotrophic
bacteria but also an interaction with heterotrophic
bacteria. A similar phenomenon was reported for
natural blooms where mucilaginous glue is present on
the surface of Microcystis cells (Tien et al., 2002; Gao &
Yang, 2008).
In our experiment, when heterotrophic bacteria was
present, M. aeruginosa with various initial cell concen-
trations all formed colonies but differed in time to
aggregation, indicating that formation of aggregates is
related to the cell density of M. aeruginosa. This result
is in accordance with those of Sedmak & Elersek
(2005) who showed that when Microcystis populations
reach plateau densities in the presence of microcys-
tins, they start to combine into aggregates. Grossart
et al. (2006) found that an exponentially growing
diatom Thalassiosira rotula readily formed aggregates,
but diatom cells in the stationary growth phase
showed signs of bacterial decomposition. The differ-
ent aggregation behaviours of M. aeruginosa in differ-
ent growth phases were related to the succession of
the associated heterotrophic bacterial community
during the various growth phases. Some algae-asso-
ciated bacteria may play a protective role (Armstrong
et al., 2001) while others may have an algicidal role
(Caiola & Pellegrini, 1984; Middelboe et al., 1995).
Interactions between Microcystis and heterotrophic
bacterial community
The results of the present study clearly show that the
interactions between M. aeruginosa and heterotrophic
bacteria affected the growth of both M. aeruginosa and
heterotrophic bacteria, and such interactions also
varied with the growth phase. M. aeruginosa influence
on heterotrophic bacterial growth was very limited
during the exponential phase of the experiment but
strongly increased heterotrophic bacterial growth
during the stationary phase. A similar bacterial
growth characteristic was found in coculture of a
dinoflagellate and bacteria (Simon et al., 2002), which
suggested that heterotrophic bacterial growth was
supported by organic matter derived from algal or
cyanobacterial cells (Cole, 1982). The stimulation of
M. aeruginosa growth by heterotrophic bacteria took
place at the initiation of the exponential phase when
heterotrophic bacteria grew slowly and bacterial
diversity was high. Cyanobacterial growth may be
stimulated by heterotrophic bacteria in ways that
produce some stimulatory products (e.g. vitamins)
(Cole, 1982). However, the growth rates of M. aeru-
ginosa were negatively correlated to the initial incu-
bation concentrations, since higher concentration of
cyanobacteria enhanced the growth of heterotrophic
bacteria. In turn, increased numbers of heterotrophic
bacteria resulted in a decrease in the bacterial diver-
sity and the cyanobacterial growth rate; furthermore,
the aggregation of Microcystis cells was stimulated.
Our results imply that the interactions between
M. aeruginosa and associated heterotrophic bacterial
communities can induce the morphological changes
in M. aeruginosa, which were characterised by changes
in composition of the heterotrophic bacterial commu-
nity. Mayali & Doucette (2002) suggested that signif-
icant competition occurs within the microbial
community in the various phases, and the growth of
algae could be inhibited if algicidal bacteria outcom-
peted its inhibitors. Our results also demonstrated
that bacterial community structure changed with the
growth of cyanobacteria. Moreover, Fuks et al. (2005)
found that mucilage events can substantially modify
the relationships between cyanobacteria and hetero-
trophic bacteria in the natural water column. Micro-
cystis provides a suitable microenvironment for
attached bacteria (Brunberg, 1999), which contributes
importantly to the carbon metabolism of heterotrophic
bacteria (Worm & Søndergaard, 1998).
The DGGE profiles indicated that a few of the
original heterotrophic bacterial species had started to
dominate the community at the exponential growth
phase of M. aeruginosa, and this change of composi-
tion in bacterial community preceded the change of
morphology in M. aeruginosa. Therefore, the hetero-
trophic bacteria are more sensitive than Microcystis to
Microcystis-heterotrophic bacterial community interactions 1075
� 2011 Blackwell Publishing Ltd, Freshwater Biology, 56, 1065–1080
the ambient environment. These results imply that
predominantly heterotrophic bacteria could coexist
well with Microcystis. The mucus of some cyanobac-
teria is a highly specialised microenvironment for
certain bacteria (Cole, 1982); in addition, we suggest
that certain heterotrophic bacteria play an important
role in the formation and maintenance of the mucus of
some cyanobacteria. Bands MC7, MC11 and MC12 are
seen as bright bands prior to the cell aggregation and
probably represent specialist heterotrophic bacteria
responsible for the aggregation of M. aeruginosa.
Porphyrobacter species (band MC11) (Berg et al., 2009;
Hube, Heyduck-Soller & Fische, 2009; Shi et al., 2009)
and Flavobacteriaceae species (band MC12) (Eiler &
Bertilsson, 2004; Mueller-Spitz, Goetz & McLellan,
2009) have previously been detected in association
with Microcystis or other cyanobacterial blooms, but
the uncultured bacterium S1-mc07 (band MC7) had
never been reported in cyanobacterial blooms. Band
MC12 disappeared and band MC5 increased in
brightness after colonial M. aeruginosa formation,
indicating that pronounced competition among these
dominating heterotrophic bacteria and uncultured
bacterium S1-mc05 (band MC5) perhaps related to
maintenance of colonies of M. aeruginosa with other
dominant heterotrophic bacteria (bacterium S1-mc07
and S1-mc11). Although the same bacterial divisions
have been reported in association with cyanobacteria-
dominated lakes all over the world, the relationship
among these heterotrophic bacteria and cyanobacteria
is unclear.
Chlorophyll a content and chlorophyll fluorescence
parameters
Chlorophyll a is the essential photosynthetic pigment
in cyanobacteria, because only chlorophyll a can
utilise the absorbed light energy for the synthesis of
chemical energy ATP. In the current experiment, the
high chl a content in the aggregated M. aeruginosa
confirmed that heterotrophic bacteria led to simulta-
neous morphological and physiological changes in
M. aeruginosa. A similar result was reported by Sed-
mak & Elersek (2005) who found that three microcy-
stin variants led to cell aggregation, increase in cell
volume and overproduction of photosynthetic pig-
ments. They considered the three effects to be related
to each other but were not necessarily caused by the
same mechanism. The ETR can provide supplemen-
tary information about the status of the photosyn-
thetic apparatus at the level of PSII-dependent
electron transport (Masojıdek et al., 2001). The in-
creased value of ETRmax in non-axenic M. aeruginosa
demonstrates that heterotrophic bacteria impart posi-
tive effect on the structure of PSII in M. aeruginosa.
Therefore, M. aeruginosa possessed higher photosyn-
thetic activity after cells became aggregated, which
supported the view that the colonial Microcystis had
higher photosynthetic parameters than those in uni-
cellular Microcystis (Shen & Song, 2007); this physio-
logical characteristic might facilitate Microcystis
maintaining predominance in natural water columns.
On the other hand, aggregation of Microcystis
enhances the degree of self-shading of their own cells.
Cell size and relative Chl a concentration may be
factors influencing photosynthesis because of self-
shading (Taguchi, 1976).
Extracellular polysaccharides
In lakes, Microcystis is the major phytoplankton genus
accounting for cell-associated mucilage production
(Tien et al., 2002). In our experiment, dissolved EPS
was present in all treatments but at higher concentra-
tions in colonial cells, implying that the heterotrophic
bacterial community plays a crucial role in the
aggregation of cells and formation of mucilage. The
ability to secrete EPS helps bacteria to colonise
Microcystis cells. Decho (1990) showed that secretions
of polysaccharides from bacteria serve many func-
tions that enhance the survival and competitive
success of microbial cells under natural conditions.
However, the ability of heterotrophic bacteria to
secrete EPS was limited compared with cyanobacteria.
The presence of heterotrophic bacteria can stimulate
the EPS release by M. aeruginosa since increasing EPS
production may be a defensive response of Microcystis
to environmental stresses. Yang et al. (2008) found
that synthesis and secretion of EPS by M. aeruginosa
cells increased under flagellate grazing pressure. The
morphological change in non-axenic M. aeruginosa
was another important reason for the increased EPS
release. M. aeruginosa in colonies have higher photo-
synthetic activity, thereby imparting synthesis of
relatively high amounts of photosynthetic intermedi-
ates (carbohydrates), which is in agreement with the
results of Fogg (1983) that actively growing phyto-
plankton release a considerable proportion of their
1076 H. Shen et al.
� 2011 Blackwell Publishing Ltd, Freshwater Biology, 56, 1065–1080

photoassimilated carbon into the aquatic environ-
ment.
The mucilage exudation is crucial for the formation
of aggregates of Microcystis, which may relate to
certain ecological processes. Reynolds (2007) reviewed
the role and functions of the mucilage provision in
phytoplankton and found that it included density
reduction, dynamic streamlining, sequestration and
storage of nutrients, defence against oxygen, metal
poisoning and grazing. In the present study, the
production of EPS in non-axenic M. aeruginosa created
microenvironments that serve to link both cyanobac-
terial cells and their associated bacterial cells into
mutually beneficial colonies. This result from the
laboratory helps explain field observations (Mayali &
Doucette, 2002) that the number of bacteria was low as
long as the algal cells were in low concentrations as a
result of the minimal amount of algal-derived dis-
solved organic matter in the water. However, bacteria
populations increased when, or soon after, the phy-
toplankton biomass reached it maximum. Giroldo,
Ortoland & Vieira (2007) also found that phytoplank-
tonic extracellular organic compounds, including
carbohydrates, supported dense bacterial popula-
tions, even at very low concentrations. Dissolved
EPS released from phytoplankton is a major compo-
nent of dissolved organic carbon (DOC) in freshwater
and is beneficial for bacterial growth (Sundh, 1992).
On the other hand, bacterial activity strongly influ-
enced aggregation behaviour of algae because of
biodegradability of DOC by the bacterial community
(Grossart et al., 2006). Hence, the roles of EPS in the
Microcystis-heterotrophic bacteria interaction are very
significant and need to be further studied in future
work.
Conclusion
To date, no study has addressed the changes in
morphology of Microcystis induced by heterotrophic
bacteria. Our study indicates that the Microcystis-
heterotrophic bacteria community interaction resulted
in substantial physiological changes to M. aeruginosa
including morphology, growth, pigment content, ETR
and EPS; meanwhile, the composition of the hetero-
trophic bacterial community was also changed. The
general process can be described as follows: the
growth of M. aeruginosa was promoted by heterotro-
phic bacteria when the cyanobacteria were at low
concentration. With the increase in cyanobacterial
concentration, the bacterial community increased
markedly in biomass and the predominance of
heterotrophic bacteria changed, inducing cyanobacte-
rial cells to form colonies. The increase of EPS
originating from M. aeruginosa played an important
role in the aggregation of cells and formation of
mucilage. The results from our study can partly
explain the role of natural bacterial communities in
the development of Microcystis blooms in natural
waters, although the mechanisms behind the changes
in the bacterial community and the interaction
between cyanobacteria and heterotrophic bacteria
need further investigations.
Acknowledgments
We thank Dr. Susanne Gustafsson for valuable com-
ments on an earlier version of this manuscript, and
two anonymous reviewers and Professor Roger Jones
for their constructive suggestions and professional
editing. This study was jointly supported by the
National Basic Research Program of China (Grant No.
2008CB418101), the Knowledge Innovation Project of
the Chinese Academy of Sciences (Grant No. KZCX1-
YW-14-6-1) and the National Science Foundation for
Postdoctoral Scientists of China (Grant No.
20070420915).
References
Armstrong E., Yan L.M., Boyd K.G., Wright P.C. &
Burgess G.J. (2001) The symbiotic role of marine
microbes on living surfaces. Hydrobiologia, 461, 37–
40.
Berg K.A., Lyra C., Sivonen K., Paulin L., Suomalainen S.,
Tuomi P. et al. (2009) High diversity of cultivable
heterotrophic bacteria in association with cyanobacte-
rial water blooms. The ISME journal, 3, 314–325.
Brunberg A.K. (1999) Contribution of bacteria in the
mucilage of Microcystis spp. (Cyanobacteria) to benthic
and pelagic bacterial production in a hypereutrophic
lake. FEMS Microbiology Ecology, 29, 13–22.
Burkert U., Hyenstrand P., Drakare S. & Blomqvist P.
(2001) Effects of the mixotrophic flagellate Ochromonas
sp. on colony formation in Microcystis aeruginosa.
Aquatic Ecology, 35, 9–17.
Caiola M.G. & Pellegrini S. (1984) Lysis of Microcystis
aeruginosa (K}utz) by Bdellovibrio-like bacteria. Journal
of Phycology, 20, 471–475.
Microcystis-heterotrophic bacterial community interactions 1077
� 2011 Blackwell Publishing Ltd, Freshwater Biology, 56, 1065–1080
Cole J.J. (1982) Interactions between bacteria and algae in
aquatic ecosystems. Annual Review of Ecology and
Systematics, 13, 291–314.
Crayton M.A. (1982) A comparative cytochemical study
of volvocacean matrix polysaccharides. Journal of
Phycology, 18, 336–344.
Decho A.W. (1990) Microbial exopolymer secretions in
ocean environments: their role(s) in food webs and
marine processes. Oceanography and Marine Biology: An
Annual Review, 28, 73–153.
Dokulil M.T. & Teubner K. (2000) Cyanobacterial dom-
inance in lakes. Hydrobiologia, 438, 1–12.
Doucette G.J. (1995) Interactions between bacteria and
harmful algae: a review. Natural Toxins, 3, 65–74.
Dubois M., Gilles K.A., Hamilton J.K., Rebers P.A. &
Smith F. (1956) Colorimetric methods for determina-
tion of sugars and related substances. Analytical
Chemistry, 28, 350–356.
Eiler A. & Bertilsson S. (2004) Composition of freshwater
bacterial communities associated with cyanobacterial
blooms in four Swedish lakes. Environmental Microbi-
ology, 6, 1228–1243.
Ferrier M., Martin J.L. & Rooney-Varga J.N. (2002)
Stimulation of Alexandrium fundyense growth by bacte-
rial assemblages from the Bay of Fundy. Journal of
Applied Microbiology, 92, 706–716.
Fogg G.E. (1983) The ecological significance of extracel-
lular products of phytoplankton photosynthesis. Botan-
ica Marina, 26, 3–14.
Fuks D., Radic J., Radic T., Najdek M., Blazina M.,
Degobbis D. et al. (2005) Relationships between het-
erotrophic bacteria and cyanobacteria in the northern
Adriatic in relation to the mucilage phenomenon.
Science of the Total Environment, 353, 178–188.
Gao G. & Yang L.Y. (2008) Physiological and ecological
characteristics of blue-green algae in Lake Taihu. In:
Lake Taihu, China. Monographiae Biologicae, 87, 197–227.
Giroldo D., Ortoland P.I.C. & Vieira A.A.H. (2007)
Bacteria-algae association in batch cultures of phyto-
plankton from a tropical reservoir: the significance of
algal carbohydrates. Freshwater Biology, 52, 1281–1289.
Grossart H.P., Czub G. & Simon M. (2006) Algae–bacteria
interactions and their effects on aggregation and
organic matter flux in the sea. Environmental Microbi-
ology, 8, 1074–1084.
Gucht K.V., Vandekerckhove T., Vloemans N., Cousin S.,
Muylaert K., Sabbe K. et al. (2005) Characterization of
bacterial communities in four freshwater lakes differ-
ing in nutrient load and food web structure. FEMS
Microbiology Ecology, 53, 205–220.
Hube A.E., Heyduck-Soller B. & Fische U. (2009) Phylo-
genetic classification of heterotrophic bacteria associ-
ated with filamentous marine cyanobacteria in culture.
Systematic and Applied Microbiology, 32, 256–265.
Jacoby J.M., Collier D.C., Welch E.B., Hardy F.J. &
Crayton M. (2000) Environmental factors associated
with a toxic bloom of Microcystis aeruginosa. Canadian
Journal of Fisheries and Aquatic Sciences, 57, 231–240.
Jiang L.J., Yang L.Y., Xiao L., Shi X.L., Gao G. & Qin B.Q.
(2007) Quantitative studies on phosphorus transfer-
ence occurring between Microcystis aeruginosa and its
attached bacterium (Pseudomonas sp.). Hydrobiologia,
581, 161–165.
Jochimsen E.M., Carmichael W.W., An J.S., Cardo D.M.,
Cookson S.T., Holmes C.E. et al. (1998) Liver failure
and death after exposure to microcystins at a hemod-
ialysis center in Brazil. The New England Journal of
Medicine, 338, 873–878.
Kapustina L.L. (2006) Experimental study of Microcystis-
associated and free-living bacteria. Microbiology, 75,
606–610.
Lee S., Kato J., Takiguchi N., Kuroda A., Ikeda T.,
Mitsutani A. et al. (2000) Involvement of an extracel-
lular protease in algicidal activity of the marine
bacterium Pseudoalteromonas sp. strain A28. Applied
and Environmental Microbiology, 66, 4334–4339.
Lemes G.A.F., Kersanach R., Pinto L.P., Dellagostin O.A.,
Yunes J.S. & Matthiensen A. (2008) Biodegradation of
microcystins by aquatic Burkholderia sp. from a South
Brazilian coastal lagoon. Ecotoxicology and Environmen-
tal Safety, 69, 358–365.
Lovejoy C., Bowman J.P. & Hallegraeff G.M. (1998)
Algicidal effects of a novel marine Pseudoalteromonas
isolate (Class Proteobacteria, Gamma Subdivision) on
harmful algal bloom species of the genera Chattonella,
Gymnodinium, and Heterosigma. Applied and Environ-
mental Microbiology, 64, 2806–2813.
Manage P.A., Kawabata Z. & Nakano S. (2001) Dynamics
of cyanophage-like particles and algicidal bacteria
causing Microcystis aeruginosa mortality. Limnology, 2,
73–78.
Maruyama T., Kato K., Yokoyama A., Tanaka T., Hiaishi
A. & Park H.D. (2003) Dynamics of microcystin-
degrading bacteria in mucilage of Microcystis. Microbial
Ecology, 46, 279–288.
Masojıdek J., Grobbelaar J.U., Pechar L. & KoblıZek M.
(2001) Photosystem II electron transport rates and
oxygen production in natural waterblooms of fresh-
water cyanobacteria during a diel cycle. Journal of
Plankton Research, 23, 57–66.
Mayali X. & Doucette G.J. (2002) Microbial community
interactions and population dynamics of an algicidal
bacterium active against Karenia brevis (Dinophyceae).
Harmful Algae, 1, 277–293.
1078 H. Shen et al.
� 2011 Blackwell Publishing Ltd, Freshwater Biology, 56, 1065–1080
Middelboe M., Søndergaard M., Letarte Y. & Borch N.H.
(1995) Attached and free-living bacteria: production
and polymer hydrolysis during a diatom bloom.
Microbial Ecology, 29, 231–248.
Montagnes D.J.S., Berges J.A., Harrison P.J. & Taylor
F.J.R. (1994) Estimating carbon, nitrogen, protein, and
chlorophyll a from volume in marine phytoplankton.
Limnology and Oceanography, 39, 1044–1060.
Mueller-Spitz S.R., Goetz G.W. & McLellan S.L. (2009)
Temporal and spatial variability in nearshore bacte-
rioplankton communities of Lake Michigan. FEMS
Microbiology Ecology, 67, 511–522.
Muyzer G., Waal E.C.D. & Uitterlinden A.G. (1993)
Profiling of complex microbial populations by dena-
turing gradient gel electrophoresis analysis of poly-
merase chain reaction-amplified genes coding for 16S
rRNA. Applied and Environmental Microbiology, 59, 695–
700.
Ozaki K., Ohta A., Iwata C., Horikawa A., Tsuji K., Ito E.
et al. (2008) Lysis of cyanobacteria with volatile organic
compounds. Chemosphere, 71, 1531–1538.
Pinhassi J., Sala M.M., Havskum H., Peters F., Guada-
yol O., Malits A. et al. (2004) Changes in bacterio-
plankton composition under different phytoplankton
regimens. Applied and Environmental Microbiology, 70,
6753–6766.
Pirt S.J. (1975) Principles of Microbe and Cell Cultivation,
pp. 4–6. Blackwell Scientific Publications, Oxford, UK.
Plude J.L., Parker D.L., Schommer O.J., Timmerman R.J.,
Hagstrom S.A., Joers J.M. et al. (1991) Chemical char-
acterization of polysaccharide from the slime layer of
the cyanobacterium Microcystis flos-aquae C3-40. Ap-
plied and Environmental Microbiology, 57, 1696–1700.
Porter K.G. & Feig Y.S. (1980) The use of DAPI for
identifying and counting aquatic microflora. Limnology
and Oceanography, 25, 943–948.
Reynolds C.S. (2007) Variability in the provision and
function of mucilage in phytoplankton: facultative
responses to the environment. Hydrobiologia, 578, 37–45.
Reynolds C.S., Jaworski G.H.M., Cmiech H.A. & Leedale
G.F. (1981) On the annual cycle of the blue-green alga
Microcystis aeruginosa Kuetz. emend. Elenkin. Philo-
sophical Transactions of the Royal Society of London. Series
B, Biological Sciences, 293, 419–477.
Riemann L., Steward G.F., Fandino L.B., Campbell L.,
Landry M.R. & Azam F. (1999) Bacterial community
composition during two consecutive NE Monsoon
periods in the Arabian Sea studied by denaturing
gradient gel electrophoresis (DGGE) of rRNA genes.
Deep-Sea Research. Part II, Topical Studies in Oceanogra-
phy, 46, 1791–1811.
Riemann L., Steward G.F. & Azam F. (2000) Dynamics of
bacterial community composition and activity during a
mesocosm diatom bloom. Applied and Environmental
Microbiology, 66, 578–587.
Sedmak B. & Elersek T. (2005) Microcystins induce
morphological and physiological changes in selected
representative phytoplanktons. Microbial Ecology, 50,
298–305.
Shen H. & Song L.R. (2007) Comparative studies on
physiological responses to phosphorus in two pheno-
types of bloom-forming Microcystis. Hydrobiologia, 592,
475–486.
Shi L., Cai Y., Yang H., Xing P., Li P., Kong L. et al. (2009)
Phylogenetic diversity and specificity of bacteria
associated with Microcystis aeruginosa and other
cyanobacteria. Journal of Environmental Sciences (China),
21, 1581–1590.
Simon N., Biegala I.C., Smith E.A. & Vaulot D. (2002)
Kinetics of attachment of potentially toxic bacteria to
Alexandrium tamarense. Aquatic Microbial Ecology, 28,
249–256.
Sivonen K. (1996) Cyanobacterial toxins and toxin pro-
duction. Phycologia, 35, 12–24.
Smith D.C., Steward G.F., Long R.A. & Azam F. (1995)
Bacterial mediation of carbon fluxes during a diatom
bloom in a mesocosm. Deep-Sea Research Part II, Topical
Studies in Oceanography, 42, 75–97.
Stanier R.Y., Kunisawa R., Mandel M. & Cohen-Bazire G.
(1971) Purification and properties of unicellular
blue-green algae (order Chroococcales). Bacteriological
Reviews, 35, 171–181.
Steppe T.F., Olson J.B., Paerl H.W., Litaker R.W. &
Belnap J. (1996) Consortial N2 fixation: a strategy for
meeting nitrogen requirements of marine and terres-
trial cyanobacterial mats. FEMS Microbiology Ecology,
21, 149–156.
Sundh I. (1992) Biochemical composition of dissolved
organic carbon derived from phytoplankton and used
by heterotrophic bacteria. Applied and Environmental
Microbiology, 58, 2938–2947.
Taguchi S. (1976) Relationship between photosynthesis
and cell size of marine diatoms. Journal of Phycology, 12,
185–189.
Tien C.J., Krivtsov V., Levado E., Sigee D.C. & White
K.N. (2002) Occurrence of cell-associated mucilage and
soluble extracellular polysaccharides in Rostherne
Mere and their possible significance. Hydrobiologia,
485, 245–252.
Tyagi M.M., Thakur J.K., Singh D.P., Kumar A., Prasuna
E.G. & Kumar A. (1999) Cyanobacterial toxins: the
current status. Journal of Microbiology and Biotechnology,
9, 9–21.
Uribe P. & Espejo R.T. (2003) Effect of associated bacteria
on the growth and toxicity of Alexandrium catebella.
Applied and Environmental Microbiology, 69, 659–662.
Microcystis-heterotrophic bacterial community interactions 1079
� 2011 Blackwell Publishing Ltd, Freshwater Biology, 56, 1065–1080
Wellburn A.R. (1994) The spectral determination of
chlorophylls a and b, as well as total carotenoids,
using various solvents with spectrophotometers of
different resolution. Journal of Plant Physiology, 144,
307–313.
Whitton B.A. (1973) Interactions with other organisms.
In: The Biology of Blue-green Algae (Eds N.G. Carr & B.A.
Whitton), pp. 415–433. Blackwell, Oxford.
Wilson A.E., Wilson W.A. & Hay A.E. (2006) Intraspe-
cific variation in growth and morphology of the
bloom-forming cyanobacterium Microcystis aeruginosa.
Applied and Environmental Microbiology, 72, 7286–
7389.
Worm J. & Søndergaard M. (1998) Dynamics of hetero-
trophic bacteria attached to Microcystis spp. (Cyano-
bacteria). Aquatic Microbial Ecology, 14, 19–28.
Wu Z.X., Gan N.Q., Huang Q. & Song L.R. (2007)
Response of Microcystis to copper stress —Do pheno-
types of Microcystis make a difference in stress toler-
ance? Environmental Pollution, 147, 324–330.
Xing P. & Kong F.X. (2007) Intra-habitat heterogeneity of
environmental factors regulating bacterioplankton
community composition in Lake Taihu, China. Aquatic
Microbial Ecology, 48, 113–122.
Yang Z., Kong F., Shi X., Zhang M., Xing P. & Cao H.
(2008) Changs in the morphology and polysaccharide
content of Microcystis aeruginosa (cyanobacteria)
during flagellate grazing. Journal of Phycology, 44,
716–720.
Yoshida M., Yoshida T., Takashima Y., Hosoda N. &
Hiroishi S. (2007) Dynamics of microcystin-producing
and non-microcystin-producing Microcystis popula-
tions is correlated with nitrate concentration in a
Japanese lake. FEMS Microbiology Letters, 266, 49–53.
(Manuscript accepted 19 November 2010)
1080 H. Shen et al.
� 2011 Blackwell Publishing Ltd, Freshwater Biology, 56, 1065–1080


