

Mutual Fund ScreenerFor the quarter ended June 2019
Mutual Fund Screener- What’s Inside
01Industry Size
02Inflow Outflow Analysis
03Category Performance
04Investor Trends
05Industry Insights
06RegulatoryUpdate
Mutual Fund Screener - June 2019
Source: AMFI, ICRA Online Research; Note: AUM – Assets Under Management
QoQ
Gro
wth
(In
%)
QA
AU
M (I
n R
s. C
rore
)
QA
AU
M (I
n R
s. C
rore
)
Jun-19 Mar-19 % Change QoQ
HDFCMutualFund
ICICIPrudential
Mutual Fund
SBIMutualFund
Aditya BirlaSun Life
Mutual Fund
RelianceMutualFund
UTIMutualFund
KotakMahindra
Mutual Fund
FranklinTempleton
Mutual Fund
AxisMutualFund
IDFCMutualFund
Industry SizeSection I
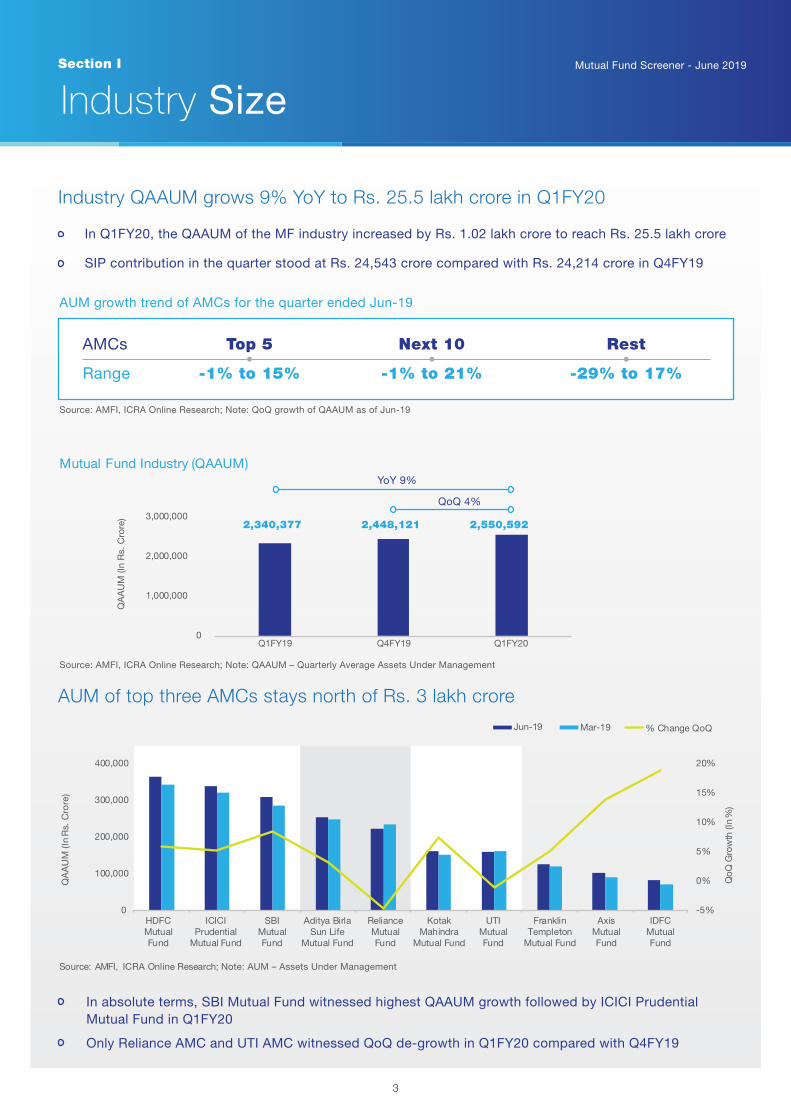
Industry QAAUM grows 9% YoY to Rs. 25.5 lakh crore in Q1FY20
In Q1FY20, the QAAUM of the MF industry increased by Rs. 1.02 lakh crore to reach Rs. 25.5 lakh crore
SIP contribution in the quarter stood at Rs. 24,543 crore compared with Rs. 24,214 crore in Q4FY19
Mutual Fund Industry (QAAUM)
Source: AMFI, ICRA Online Research; Note: QAAUM – Quarterly Average Assets Under Management
QoQ 4%
YoY 9%
AUM growth trend of AMCs for the quarter ended Jun-19
Top 5
-1% to 15%
Next 10
-1% to 21%
Rest
-29% to 17%
AMCs
Range
Source: AMFI, ICRA Online Research; Note: QoQ growth of QAAUM as of Jun-19
2,340,377 2,448,121 2,550,592
AUM of top three AMCs stays north of Rs. 3 lakh crore
3
Mutual Fund Screener - June 2019
0
1,000,000
2,000,000
3,000,000
Q1FY19 Q4FY19 Q1FY20
-5%
0%
5%
10%
15%
20%
0
100,000
200,000
300,000
400,000
In absolute terms, SBI Mutual Fund witnessed highest QAAUM growth followed by ICICI Prudential Mutual Fund in Q1FY20
Only Reliance AMC and UTI AMC witnessed QoQ de-growth in Q1FY20 compared with Q4FY19
4
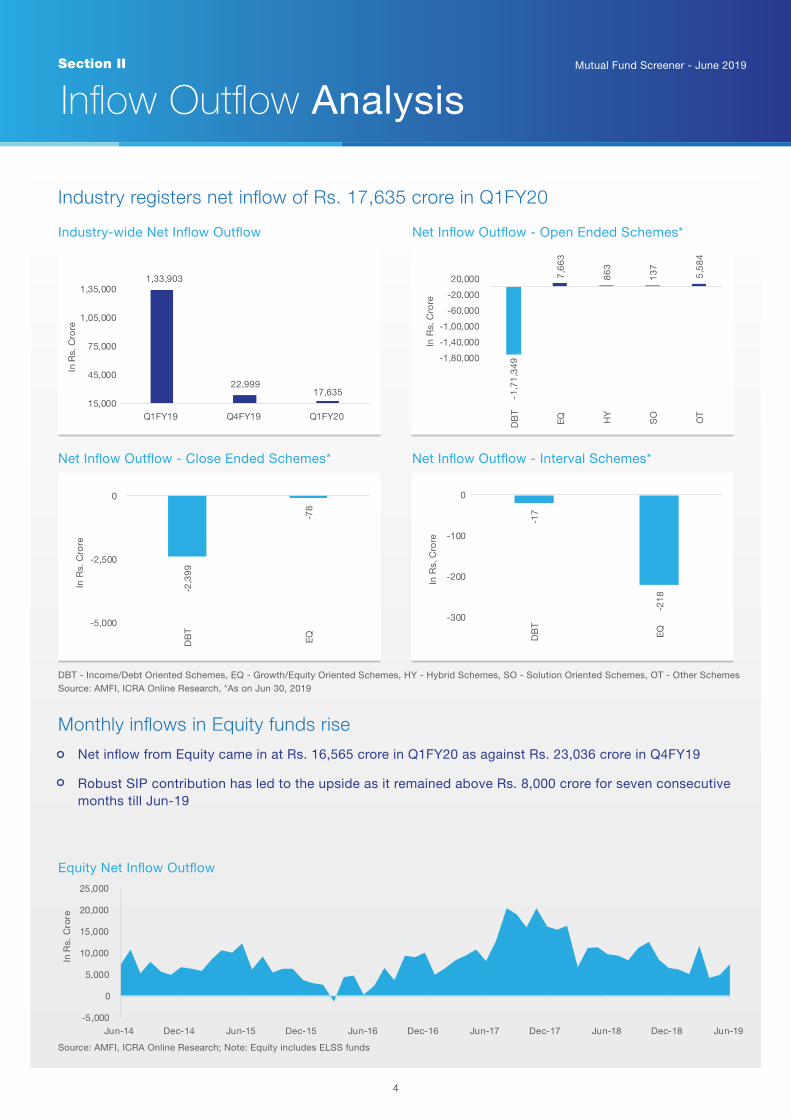
Industry registers net inflow of Rs. 17,635 crore in Q1FY20
Monthly inflows in Equity funds rise
Net in�ow from Equity came in at Rs. 16,565 crore in Q1FY20 as against Rs. 23,036 crore in Q4FY19
Robust SIP contribution has led to the upside as it remained above Rs. 8,000 crore for seven consecutive months till Jun-19
Inflow Outflow AnalysisSection II
Equity Net In�ow Out�ow
Industry-wide Net In�ow Out�ow Net In�ow Out�ow - Open Ended Schemes*
Net In�ow Out�ow - Close Ended Schemes* Net In�ow Out�ow - Interval Schemes*
Mutual Fund Screener - June 2019
Source: AMFI, ICRA Online Research; Note: Equity includes ELSS funds
DBT - Income/Debt Oriented Schemes, EQ - Growth/Equity Oriented Schemes, HY - Hybrid Schemes, SO - Solution Oriented Schemes, OT - Other SchemesSource: AMFI, ICRA Online Research, *As on Jun 30, 2019
-5,000
0
5,000
10,000
15,000
20,000
25,000
Jun-14 Dec-14 Jun-15 Dec-15 Jun-16 Dec-16 Jun-17 Dec-17 Jun-18 Dec-18 Jun-19
In R
s. C
rore
1,33,903
22,99917,635
15,000
45,000
75,000
1,05,000
1,35,000
Q1FY19 Q4FY19 Q1FY20
In R
s. C
rore
-1,7
1,3
49
7,6
63
86
3
13
7
5,5
84
-1,80,000
-1,40,000
-1,00,000
-60,000
-20,000
20,000
DB
T
EQ HY
SO OT
In R
s. C
rore
-2,3
99
-78
-5,000
-2,500
0
DB
T
EQ
In R
s. C
rore
-17
-21
8
-300
-200
-100
0
DB
T
EQ
In R
s. C
rore
AUM over Past 1 Year 3, 5
5
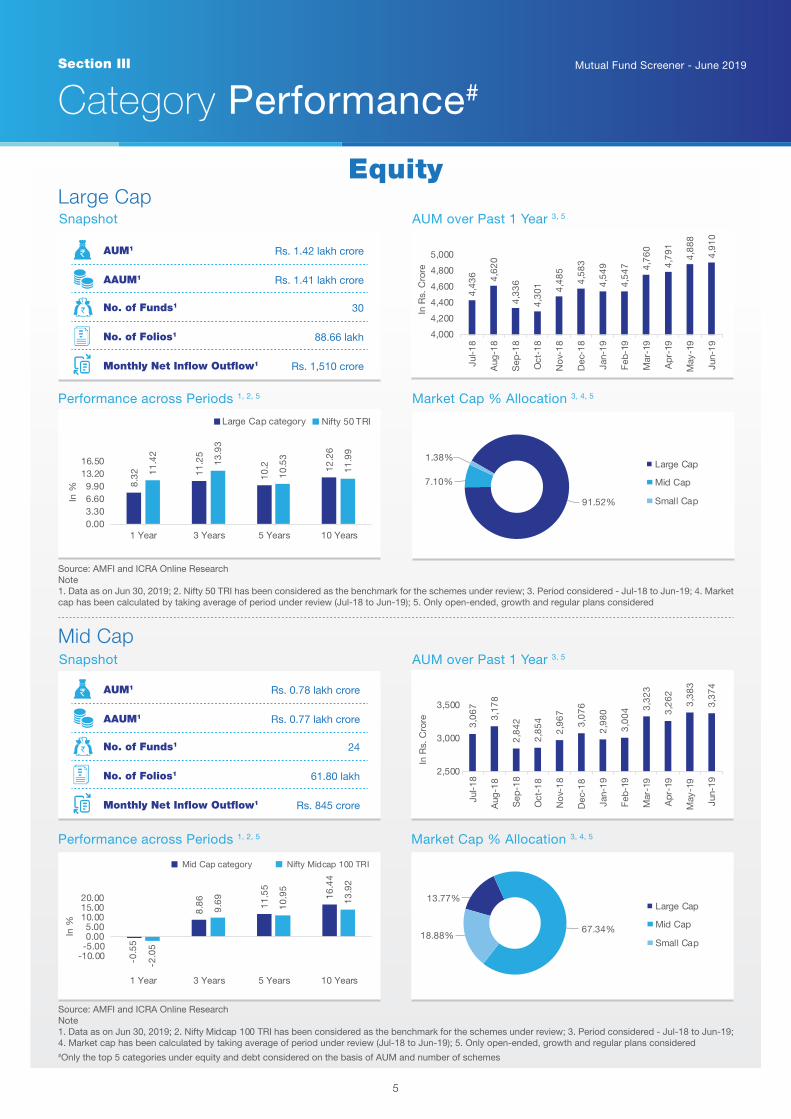
Large Cap
Category Performance#Section III Mutual Fund Screener - June 2019
4,4
36 4,6
20
4,3
36
4,3
01 4,4
85
4,5
83
4,5
49
4,5
47 4,7
60
4,7
91
4,8
88
4,9
10
4,000
4,200
4,400
4,600
4,800
5,000
Jul-1
8
Aug
-18
Sep
-18
Oct
-18
No
v-1
8
Dec
-18
Jan-
19
Feb
-19
Mar
-19
Apr
-19
May
-19
Jun-
19
In R
s. C
rore
Source: AMFI and ICRA Online ResearchNote 1. Data as on Jun 30, 2019; 2. Nifty 50 TRI has been considered as the benchmark for the schemes under review; 3. Period considered - Jul-18 to Jun-19; 4. Market cap has been calculated by taking average of period under review (Jul-18 to Jun-19); 5. Only open-ended, growth and regular plans considered
AUM over Past 1 Year 3, 5
Mid Cap
Source: AMFI and ICRA Online ResearchNote 1. Data as on Jun 30, 2019; 2. Nifty Midcap 100 TRI has been considered as the benchmark for the schemes under review; 3. Period considered - Jul-18 to Jun-19; 4. Market cap has been calculated by taking average of period under review (Jul-18 to Jun-19); 5. Only open-ended, growth and regular plans considered
3,0
67
3,1
78
2,8
42
2,8
54
2,9
67
3,0
76
2,9
80
3,0
04 3
,32
3
3,2
62
3,3
83
3,3
74
2,500
3,000
3,500
Jul-1
8
Aug
-18
Sep
-18
Oct
-18
No
v-1
8
Dec
-18
Jan-
19
Feb
-19
Mar
-19
Apr
-19
May
-19
Jun-
19
In R
s. C
rore
Snapshot
AUM1 Rs. 1.42 lakh crore
AAUM1 Rs. 1.41 lakh crore
No. of Funds1 30
No. of Folios1 88.66 lakh
Monthly Net Inflow Outflow1 Rs. 1,510 crore
AUM1 Rs. 0.78 lakh crore
AAUM1 Rs. 0.77 lakh crore
No. of Funds1 24
No. of Folios1 61.80 lakh
Monthly Net Inflow Outflow1 Rs. 845 crore
Snapshot
Large Cap
Mid Cap
Small Cap
Market Cap % Allocation 3, 4, 5
91.52%
7.10%
1.38%
Performance across Periods 1, 2, 5
Mid Cap category Nifty Midcap 100 TRI
-0.5
5
8.8
6
11
.55
16
.44
-2.0
5
9.6
9
10
.95
13
.92
-10.00-5.000.005.00
10.0015.0020.00
1 Year 3 Years 5 Years 10 Years
In %
Market Cap % Allocation 3, 4, 5
Large Cap
Mid Cap
Small Cap
13.77%
67.34%18.88%
Performance across Periods 1, 2, 5
Large Cap category Nifty 50 TRI
8.3
2 11
.25
10
.2 12
.26
11
.42
13
.93
10
.53
11
.99
0.003.306.609.90
13.2016.50
1 Year 3 Years 5 Years 10 Years
In %
Equity
#Only the top 5 categories under equity and debt considered on the basis of AUM and number of schemes
6
Mutual Fund Screener - June 2019Category Performance
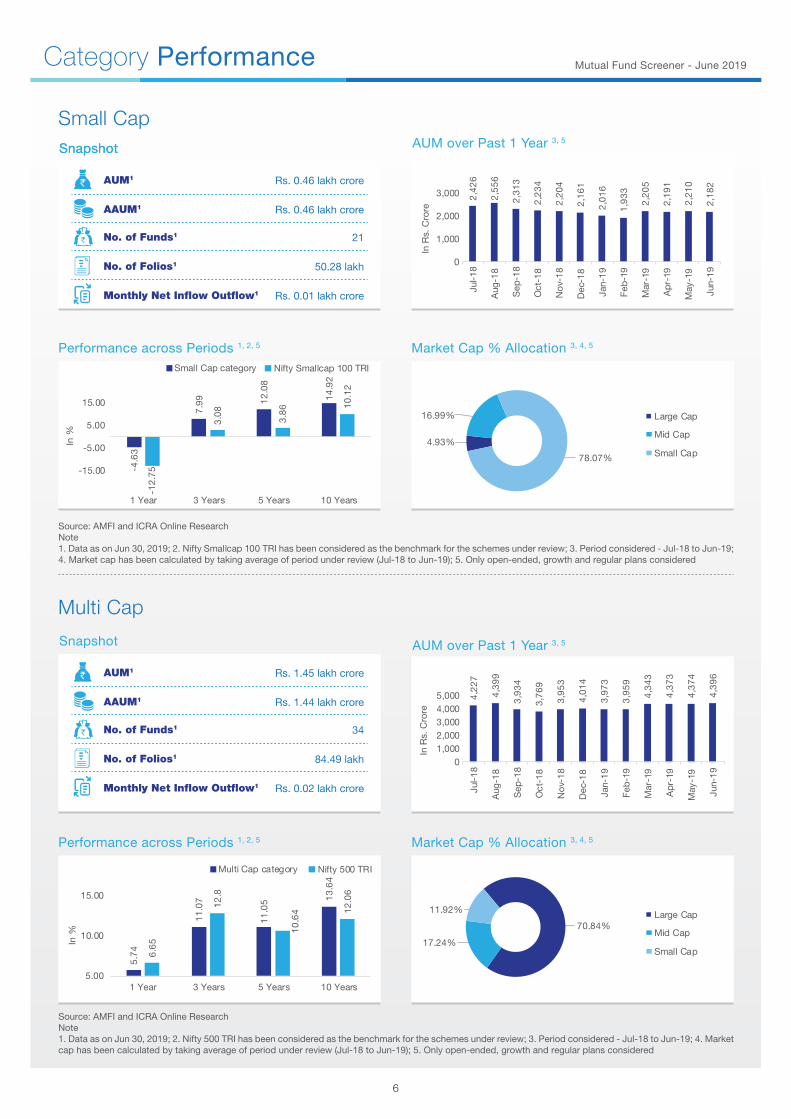
Small Cap
Source: AMFI and ICRA Online ResearchNote 1. Data as on Jun 30, 2019; 2. Nifty Smallcap 100 TRI has been considered as the benchmark for the schemes under review; 3. Period considered - Jul-18 to Jun-19; 4. Market cap has been calculated by taking average of period under review (Jul-18 to Jun-19); 5. Only open-ended, growth and regular plans considered
AUM over Past 1 Year 3, 5
Multi Cap
Source: AMFI and ICRA Online ResearchNote 1. Data as on Jun 30, 2019; 2. Nifty 500 TRI has been considered as the benchmark for the schemes under review; 3. Period considered - Jul-18 to Jun-19; 4. Market cap has been calculated by taking average of period under review (Jul-18 to Jun-19); 5. Only open-ended, growth and regular plans considered
AUM over Past 1 Year 3, 5
2,4
26
2,5
56
2,3
13
2,2
34
2,2
04
2,1
61
2,0
16
1,9
33
2,2
05
2,1
91
2,2
10
2,1
82
0
1,000
2,000
3,000
Jul-1
8
Aug
-18
Sep
-18
Oct
-18
No
v-1
8
Dec
-18
Jan-
19
Feb
-19
Mar
-19
Apr
-19
May
-19
Jun-
19
In R
s. C
rore
4,2
27
4,3
99
3,9
34
3,7
69
3,9
53
4,0
14
3,9
73
3,9
59
4,3
43
4,3
73
4,3
74
4,3
96
01,0002,0003,0004,0005,000
Jul-1
8
Aug
-18
Sep
-18
Oct
-18
No
v-1
8
Dec
-18
Jan-
19
Feb
-19
Mar
-19
Apr
-19
May
-19
Jun-
19
In R
s. C
rore
Performance across Periods 1, 2, 5
Small Cap category Nifty Smallcap 100 TRI
-4.6
3
7.9
9 12
.08
14
.92
-12
.75
3.0
8
3.8
6 10
.12
-15.00
-5.00
5.00
15.00
1 Year 3 Years 5 Years 10 Years
In %
Large Cap
Mid Cap
Small Cap
Market Cap % Allocation 3, 4, 5
4.93%
16.99%
78.07%
Performance across Periods 1, 2, 5
Multi Cap category Nifty 500 TRI
5.7
4
11
.07
11
.05 1
3.6
4
6.6
5
12
.8
10
.64 1
2.0
6
5.00
10.00
15.00
1 Year 3 Years 5 Years 10 Years
In %
Large Cap
Mid Cap
Small Cap
Market Cap % Allocation 3, 4, 5
70.84%
17.24%
11.92%
AUM1 Rs. 0.46 lakh crore
AAUM1 Rs. 0.46 lakh crore
No. of Funds1 21
No. of Folios1 50.28 lakh
Monthly Net Inflow Outflow1 Rs. 0.01 lakh crore
SnapshotSnapshot
AUM1 Rs. 1.45 lakh crore
AAUM1 Rs. 1.44 lakh crore
No. of Funds1 34
No. of Folios1 84.49 lakh
Monthly Net Inflow Outflow1 Rs. 0.02 lakh crore
Snapshot
7
Mutual Fund Screener - June 2019Category Performance
AUM over Past 1 Year 3, 5
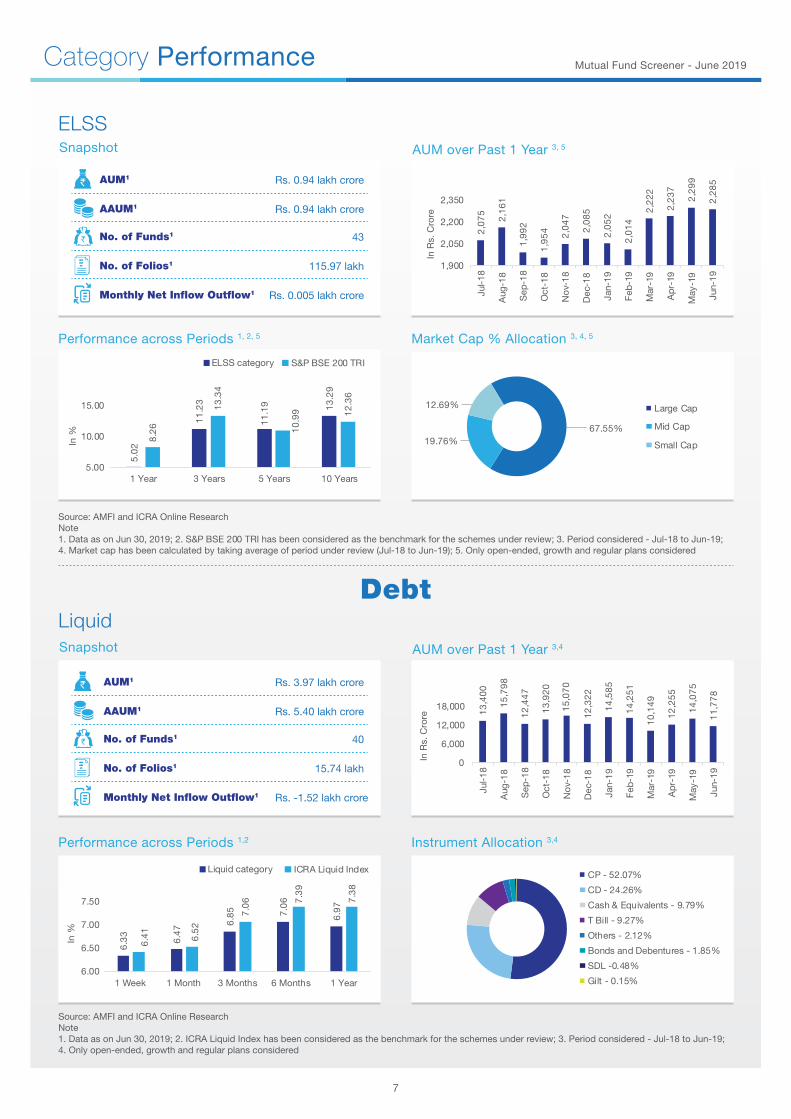
ELSS
Source: AMFI and ICRA Online ResearchNote 1. Data as on Jun 30, 2019; 2. S&P BSE 200 TRI has been considered as the benchmark for the schemes under review; 3. Period considered - Jul-18 to Jun-19;4. Market cap has been calculated by taking average of period under review (Jul-18 to Jun-19); 5. Only open-ended, growth and regular plans considered
AUM over Past 1 Year 3,4
Liquid
Source: AMFI and ICRA Online ResearchNote 1. Data as on Jun 30, 2019; 2. ICRA Liquid Index has been considered as the benchmark for the schemes under review; 3. Period considered - Jul-18 to Jun-19;4. Only open-ended, growth and regular plans considered
2,0
75
2,1
61
1,9
92
1,9
54 2,0
47
2,0
85
2,0
52
2,0
14
2,2
22
2,2
37
2,2
99
2,2
85
1,900
2,050
2,200
2,350
Jul-1
8
Aug
-18
Sep
-18
Oct
-18
No
v-1
8
Dec
-18
Jan-
19
Feb
-19
Mar
-19
Apr
-19
May
-19
Jun-
19
In R
s. C
rore
Performance across Periods 1,2
Liquid category ICRA Liquid Index
6.3
3
6.4
7 6.8
5 7.0
6
6.9
7
6.4
1
6.5
2
7.0
6 7.3
9
7.3
8
6.00
6.50
7.00
7.50
1 Week 1 Month 3 Months 6 Months 1 Year
In %
13
,40
0
15
,79
8
12
,44
7
13
,92
0
15
,07
0
12
,32
2
14
,58
5
14
,25
1
10
,14
9
12
,25
5
14
,07
5
11
,77
8
0
6,000
12,000
18,000
Jul-1
8
Aug
-18
Sep
-18
Oct
-18
No
v-1
8
Dec
-18
Jan-
19
Feb
-19
Mar
-19
Apr
-19
May
-19
Jun-
19
In R
s. C
rore
CP - 52.07%
CD - 24.26%
Cash & Equivalents - 9.79%
T Bill - 9.27%
Others - 2.12%
Bonds and Debentures - 1.85%
SDL -0.48%
Gilt - 0.15%
Instrument Allocation 3,4
Performance across Periods 1, 2, 5
ELSS category S&P BSE 200 TRI
5.0
2
11
.23
11
.19 13
.29
8.2
6
13
.34
10
.99 12
.36
5.00
10.00
15.00
1 Year 3 Years 5 Years 10 Years
In %
Large Cap
Mid Cap
Small Cap
Market Cap % Allocation 3, 4, 5
67.55%19.76%
12.69%
AUM1 Rs. 0.94 lakh crore
AAUM1 Rs. 0.94 lakh crore
No. of Funds1 43
No. of Folios1 115.97 lakh
Monthly Net Inflow Outflow1 Rs. 0.005 lakh crore
Snapshot
AUM1 Rs. 3.97 lakh crore
AAUM1 Rs. 5.40 lakh crore
No. of Funds1 40
No. of Folios1 15.74 lakh
Monthly Net Inflow Outflow1 Rs. -1.52 lakh crore
Snapshot
Debt
8
Mutual Fund Screener - June 2019Category Performance
AUM over Past 1 Year 3,4
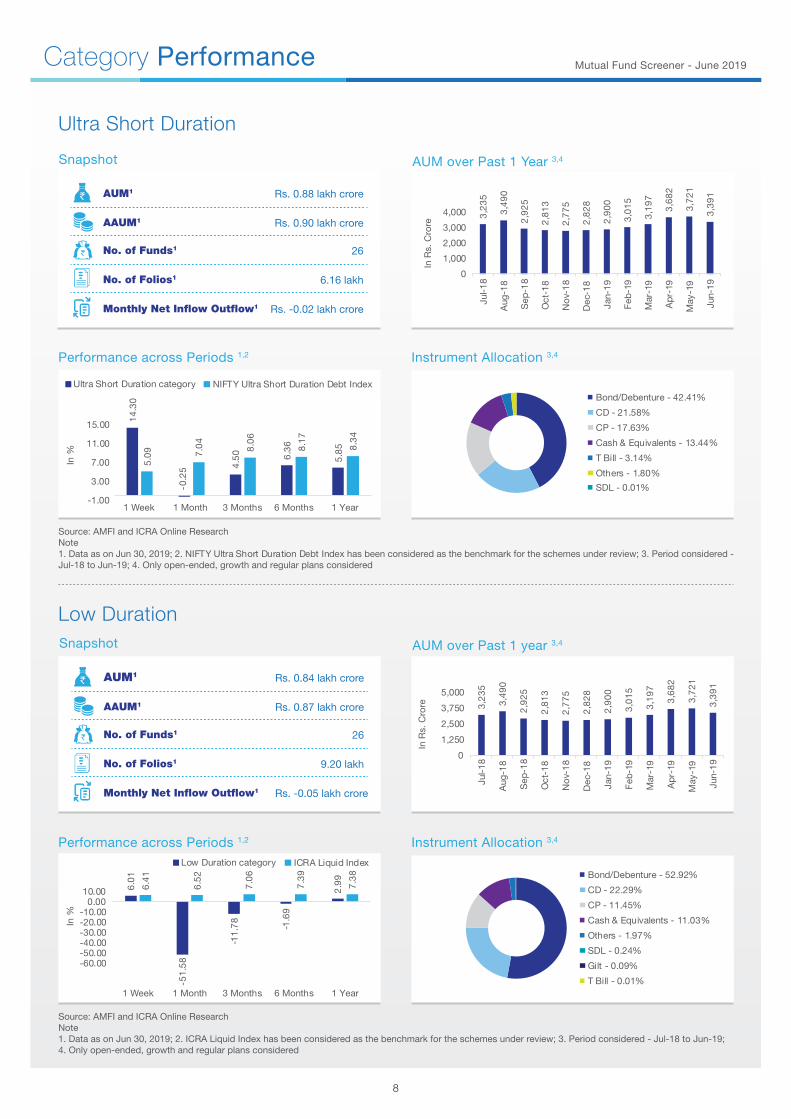
Ultra Short Duration
Source: AMFI and ICRA Online ResearchNote 1. Data as on Jun 30, 2019; 2. NIFTY Ultra Short Duration Debt Index has been considered as the benchmark for the schemes under review; 3. Period considered - Jul-18 to Jun-19; 4. Only open-ended, growth and regular plans considered
AUM over Past 1 year 3,4
Low Duration
Source: AMFI and ICRA Online ResearchNote 1. Data as on Jun 30, 2019; 2. ICRA Liquid Index has been considered as the benchmark for the schemes under review; 3. Period considered - Jul-18 to Jun-19;4. Only open-ended, growth and regular plans considered
Performance across Periods 1,2
Ultra Short Duration category NIFTY Ultra Short Duration Debt Index
14
.30
-0.2
5 4.5
0 6.3
6
5.8
5
5.0
9 7.0
4
8.0
6
8.1
7
8.3
4
-1.00
3.00
7.00
11.00
15.00
1 Week 1 Month 3 Months 6 Months 1 Year
In %
3,2
35
3,4
90
2,9
25
2,8
13
2,7
75
2,8
28
2,9
00
3,0
15
3,1
97
3,6
82
3,7
21
3,3
91
0
1,000
2,000
3,000
4,000
Jul-1
8
Aug
-18
Sep
-18
Oct
-18
No
v-1
8
Dec
-18
Jan-
19
Feb
-19
Mar
-19
Apr
-19
May
-19
Jun-
19
In R
s. C
rore
Instrument Allocation 3,4
Bond/Debenture - 42.41%
CD - 21.58%
CP - 17.63%
Cash & Equivalents - 13.44%
T Bill - 3.14%
Others - 1.80%
SDL - 0.01%3
,23
5
3,4
90
2,9
25
2,8
13
2,7
75
2,8
28
2,9
00
3,0
15
3,1
97
3,6
82
3,7
21
3,3
91
0
1,250
2,500
3,750
5,000
Jul-1
8
Aug
-18
Sep
-18
Oct
-18
No
v-1
8
Dec
-18
Jan-
19
Feb
-19
Mar
-19
Apr
-19
May
-19
Jun-
19
In R
s. C
rore
Instrument Allocation 3,4
Bond/Debenture - 52.92%
CD - 22.29%
CP - 11.45%
Cash & Equivalents - 11.03%
Others - 1.97%
SDL - 0.24%
Gilt - 0.09%
T Bill - 0.01%
Performance across Periods 1,2
Low Duration category ICRA Liquid Index
6.0
1
-51
.58
-11
.78
-1.6
9
2.9
9
6.4
1
6.5
2
7.0
6
7.3
9
7.3
8
-60.00-50.00-40.00-30.00-20.00-10.00
0.0010.00
1 Week 1 Month 3 Months 6 Months 1 Year
In %
AUM1 Rs. 0.88 lakh crore
AAUM1 Rs. 0.90 lakh crore
No. of Funds1 26
No. of Folios1 6.16 lakh
Monthly Net Inflow Outflow1 Rs. -0.02 lakh crore
Snapshot
AUM1 Rs. 0.84 lakh crore
AAUM1 Rs. 0.87 lakh crore
No. of Funds1 26
No. of Folios1 9.20 lakh
Monthly Net Inflow Outflow1 Rs. -0.05 lakh crore
Snapshot
9
Mutual Fund Screener - June 2019Category Performance
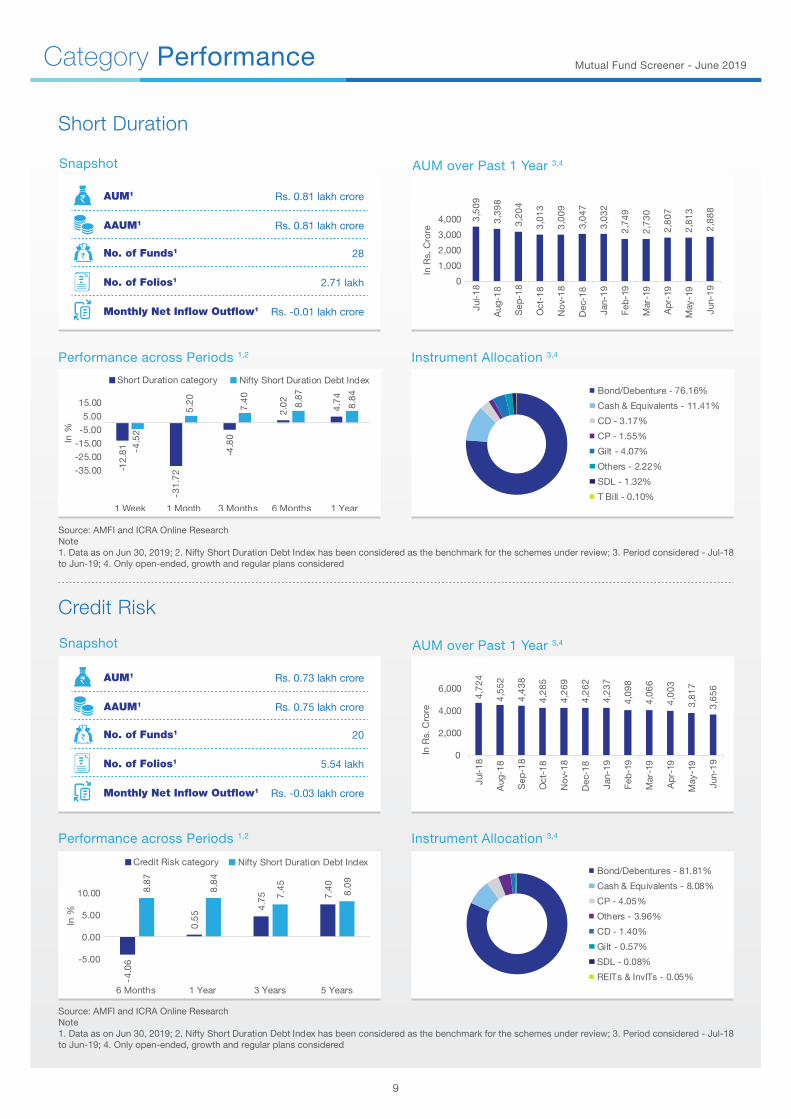
Short Duration
AUM over Past 1 Year 3,4
Credit Risk
Source: AMFI and ICRA Online ResearchNote 1. Data as on Jun 30, 2019; 2. Nifty Short Duration Debt Index has been considered as the benchmark for the schemes under review; 3. Period considered - Jul-18 to Jun-19; 4. Only open-ended, growth and regular plans considered
AUM over Past 1 Year 3,4
Source: AMFI and ICRA Online ResearchNote 1. Data as on Jun 30, 2019; 2. Nifty Short Duration Debt Index has been considered as the benchmark for the schemes under review; 3. Period considered - Jul-18 to Jun-19; 4. Only open-ended, growth and regular plans considered
Performance across Periods 1,2
Short Duration category Nifty Short Duration Debt Index
-12
.81
-31
.72
-4.8
0
2.0
2
4.7
4
-4.5
2
5.2
0
7.4
0
8.8
7
8.8
4
-35.00-25.00-15.00-5.005.00
15.00
1 Week 1 Month 3 Months 6 Months 1 Year
In %
3,5
09
3,3
98
3,2
04
3,0
13
3,0
09
3,0
47
3,0
32
2,7
49
2,7
30
2,8
07
2,8
13
2,8
88
0
1,000
2,000
3,000
4,000
Jul-1
8
Aug
-18
Sep
-18
Oct
-18
No
v-1
8
Dec
-18
Jan-
19
Feb
-19
Mar
-19
Apr
-19
May
-19
Jun-
19
In R
s. C
rore
Instrument Allocation 3,4
Bond/Debenture - 76.16%
Cash & Equivalents - 11.41%
CD - 3.17%
CP - 1.55%
Gilt - 4.07%
Others - 2.22%
SDL - 1.32%
T Bill - 0.10%
Performance across Periods 1,2
Credit Risk category Nifty Short Duration Debt Index
-4.0
6
0.5
5 4.7
5 7.4
0
8.8
7
8.8
4
7.4
5
8.0
9
-5.00
0.00
5.00
10.00
6 Months 1 Year 3 Years 5 Years
In %
Instrument Allocation 3,4
Bond/Debentures - 81.81%
Cash & Equivalents - 8.08%
CP - 4.05%
Others - 3.96%
CD - 1.40%
Gilt - 0.57%
SDL - 0.08%
REITs & InvITs - 0.05%
4,7
24
4,5
52
4,4
38
4,2
85
4,2
69
4,2
62
4,2
37
4,0
98
4,0
66
4,0
03
3,8
17
3,6
56
0
2,000
4,000
6,000
Jul-1
8
Aug
-18
Sep
-18
Oct
-18
No
v-1
8
Dec
-18
Jan-
19
Feb
-19
Mar
-19
Apr
-19
May
-19
Jun-
19
In R
s. C
rore
AUM1 Rs. 0.81 lakh crore
AAUM1 Rs. 0.81 lakh crore
No. of Funds1 28
No. of Folios1 2.71 lakh
Monthly Net Inflow Outflow1 Rs. -0.01 lakh crore
Snapshot
AUM1 Rs. 0.73 lakh crore
AAUM1 Rs. 0.75 lakh crore
No. of Funds1 20
No. of Folios1 5.54 lakh
Monthly Net Inflow Outflow1 Rs. -0.03 lakh crore
Snapshot
10
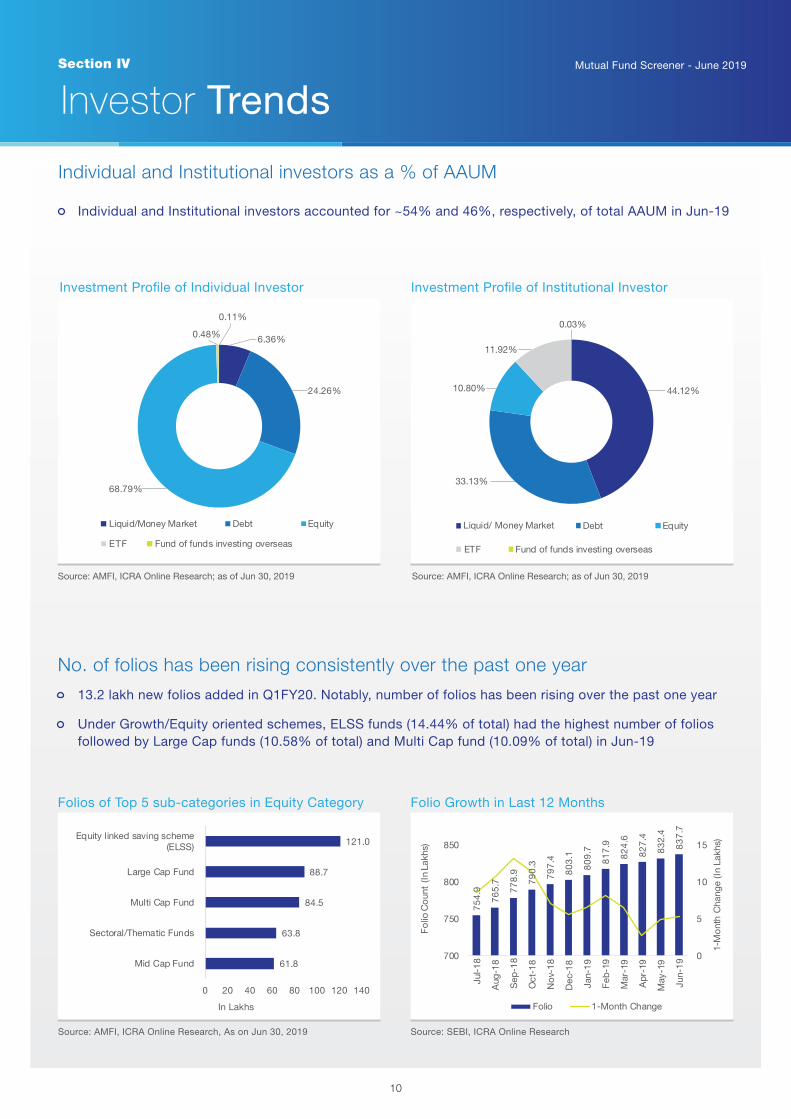
Individual and Institutional investors accounted for ~54% and 46%, respectively, of total AAUM in Jun-19
Individual and Institutional investors as a % of AAUM
Investment Pro�le of Institutional InvestorInvestment Pro�le of Individual Investor
Liquid/Money Market
ETF Fund of funds investing overseas
Debt Equity
Source: AMFI, ICRA Online Research; as of Jun 30, 2019 Source: AMFI, ICRA Online Research; as of Jun 30, 2019
Liquid/ Money Market Debt Equity
ETF Fund of funds investing overseas
24.26% 44.12%
0.03%
11.92%
10.80%
33.13%
6.36%
0.11%
0.48%
68.79%
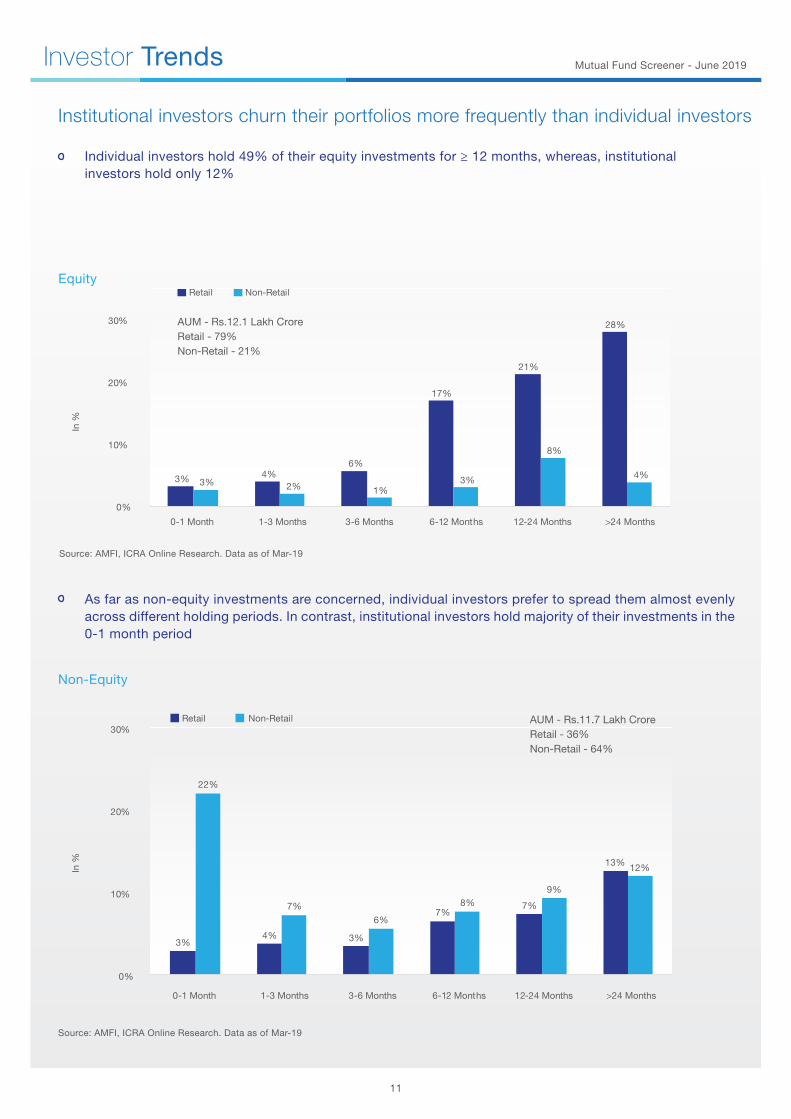
No. of folios has been rising consistently over the past one year
13.2 lakh new folios added in Q1FY20. Notably, number of folios has been rising over the past one year
Under Growth/Equity oriented schemes, ELSS funds (14.44% of total) had the highest number of folios followed by Large Cap funds (10.58% of total) and Multi Cap fund (10.09% of total) in Jun-19
Folios of Top 5 sub-categories in Equity Category Folio Growth in Last 12 Months
Source: AMFI, ICRA Online Research, As on Jun 30, 2019 Source: SEBI, ICRA Online Research
61.8
63.8
84.5
88.7
121.0
0 20 40 60 80 100 120 140
Mid Cap Fund
Sectoral/Thematic Funds
Multi Cap Fund
Large Cap Fund
Equity linked saving scheme(ELSS)
In Lakhs
75
4.9
76
5.7
77
8.9
79
0.3
79
7.4
80
3.1
80
9.7
81
7.9
82
4.6
82
7.4
83
2.4
83
7.7
0
5
10
15
700
750
800
850
Jul-1
8
Aug
-18
Sep
-18
Oct
-18
No
v-1
8
Dec
-18
Jan-
19
Feb
-19
Mar
-19
Apr
-19
May
-19
Jun-
19
1-M
ont
h C
hang
e (I
n La
khs)
Fo
lio C
oun
t (I
n La
khs)
Folio 1-Month Change
Investor TrendsSection IV Mutual Fund Screener - June 2019
Retail Non-Retail
Institutional investors churn their portfolios more frequently than individual investors
Individual investors hold 49% of their equity investments for ≥ 12 months, whereas, institutional investors hold only 12%
As far as non-equity investments are concerned, individual investors prefer to spread them almost evenly across different holding periods. In contrast, institutional investors hold majority of their investments in the 0-1 month period
Source: AMFI, ICRA Online Research. Data as of Mar-19
3% 4%6%
17%
21%
28%
3% 2% 1%3%
8%
4%
0%
10%
20%
30%
0-1 Month 1-3 Months 3-6 Months 6-12 Months 12-24 Months >24 Months
Equity
AUM - Rs.12.1 Lakh CroreRetail - 79%Non-Retail - 21%
In %
Source: AMFI, ICRA Online Research. Data as of Mar-19
Non-Equity
3%4% 3%
7%7%
13%
22%
7%
6%
8%9%
12%
0%
10%
20%
30%
0-1 Month 1-3 Months 3-6 Months 6-12 Months 12-24 Months >24 Months
AUM - Rs.11.7 Lakh CroreRetail - 36%Non-Retail - 64%
Retail Non-Retail
In %
Mutual Fund Screener - June 2019
11
Investor Trends
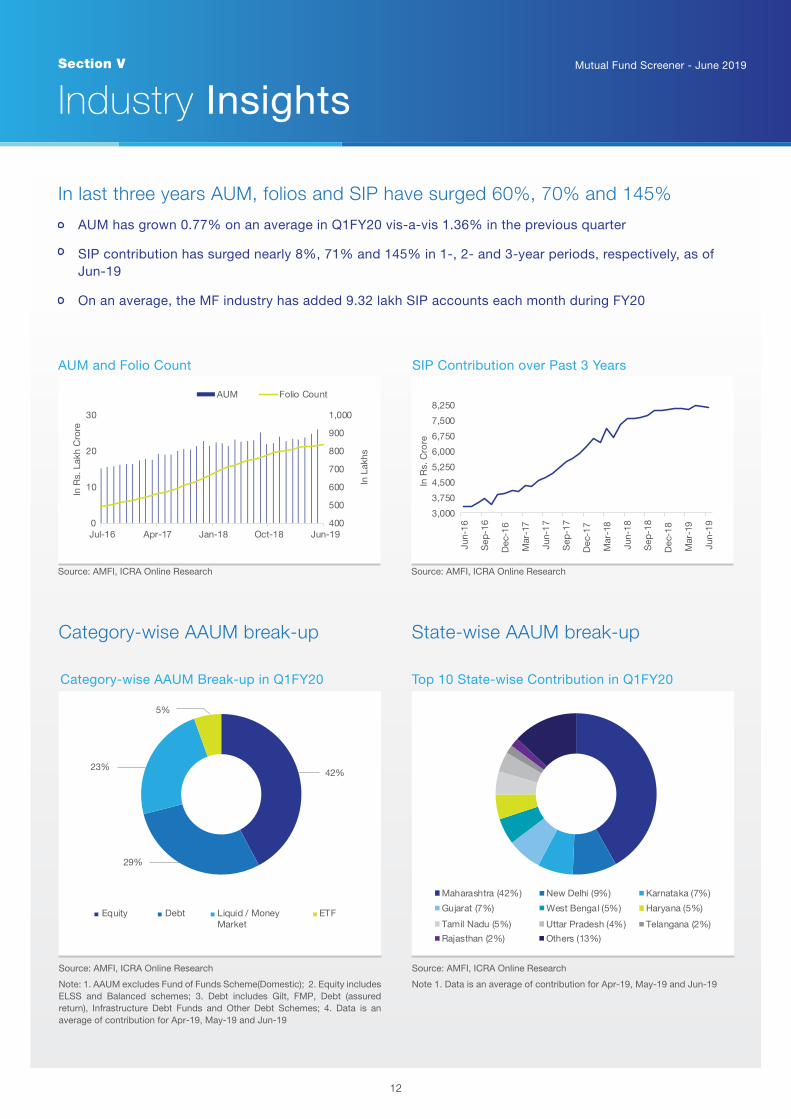
SIP Contribution over Past 3 Years
12
AUM has grown 0.77% on an average in Q1FY20 vis-a-vis 1.36% in the previous quarter
SIP contribution has surged nearly 8%, 71% and 145% in 1-, 2- and 3-year periods, respectively, as of Jun-19
On an average, the MF industry has added 9.32 lakh SIP accounts each month during FY20
Category-wise AAUM break-up State-wise AAUM break-up
Industry InsightsSection V
Top 10 State-wise Contribution in Q1FY20Category-wise AAUM Break-up in Q1FY20
Equity Debt Liquid / MoneyMarket
ETF
Maharashtra (42%) New Delhi (9%) Karnataka (7%)
Gujarat (7%) West Bengal (5%) Haryana (5%)
Tamil Nadu (5%) Uttar Pradesh (4%) Telangana (2%)
Rajasthan (2%) Others (13%)
Source: AMFI, ICRA Online Research
Note: 1. AAUM excludes Fund of Funds Scheme(Domestic); 2. Equity includes ELSS and Balanced schemes; 3. Debt includes Gilt, FMP, Debt (assured return), Infrastructure Debt Funds and Other Debt Schemes; 4. Data is an average of contribution for Apr-19, May-19 and Jun-19
Source: AMFI, ICRA Online Research
Note 1. Data is an average of contribution for Apr-19, May-19 and Jun-19
In last three years AUM, folios and SIP have surged 60%, 70% and 145%
Mutual Fund Screener - June 2019
42%
29%
23%
5%
AUM and Folio Count
AUM Folio Count
3,000
3,750
4,500
5,250
6,000
6,750
7,500
8,250
Jun-
16
Sep
-16
Dec
-16
Mar
-17
Jun-
17
Sep
-17
Dec
-17
Mar
-18
Jun-
18
Sep
-18
Dec
-18
Mar
-19
Jun-
19
In R
s. C
rore
400
500
600
700
800
900
1,000
0
10
20
30
Jul-16 Apr-17 Jan-18 Oct-18 Jun-19
In R
s. L
akh
Cro
re
In L
akhs
Source: AMFI, ICRA Online Research Source: AMFI, ICRA Online Research
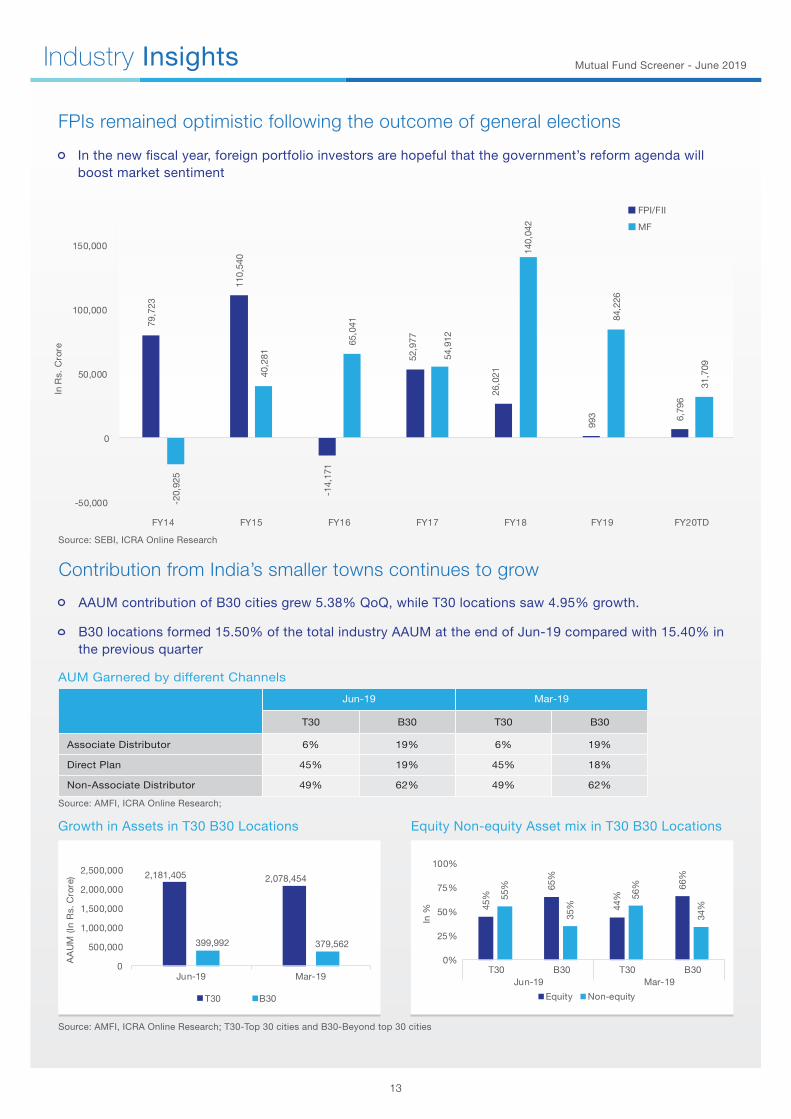
Growth in Assets in T30 B30 Locations Equity Non-equity Asset mix in T30 B30 Locations
AUM Garnered by different Channels
T30 B30 T30 B30
Mar-19Jun-19
Associate Distributor
Direct Plan
Non-Associate Distributor
6%
45%
49%
19%
19%
62%
6%
45%
49%
19%
18%
62%
Source: AMFI, ICRA Online Research; T30-Top 30 cities and B30-Beyond top 30 cities
Source: SEBI, ICRA Online Research
Source: AMFI, ICRA Online Research;
0
500,000
1,000,000
1,500,000
2,000,000
2,500,000
Jun-19 Mar-19
AA
UM
(In
Rs.
Cro
re)
In %
T30 B30
2,181,405
399,992
2,078,454
379,562
45%
65%
44%
66%
55%
35%
56%
34%
0%
25%
50%
75%
100%
T30 B30 T30 B30Jun-19 Mar-19
Equity Non-equity
AAUM contribution of B30 cities grew 5.38% QoQ, while T30 locations saw 4.95% growth.
B30 locations formed 15.50% of the total industry AAUM at the end of Jun-19 compared with 15.40% in the previous quarter
Contribution from India’s smaller towns continues to grow
13
Mutual Fund Screener - June 2019Industry Insights
In the new �scal year, foreign portfolio investors are hopeful that the government’s reform agenda will boost market sentiment
FPIs remained optimistic following the outcome of general elections79
,723
110,
540
-14,
171
52,9
77
26,0
21
993 6,79
6
-20,
925
40,2
81
65,0
41
54,9
12
140,
042
84,2
26
31,7
09
-50,000
0
50,000
100,000
150,000
FY14 FY15 FY16 FY17 FY18 FY19 FY20TD
In R
s. C
rore
FPI/FII
MF
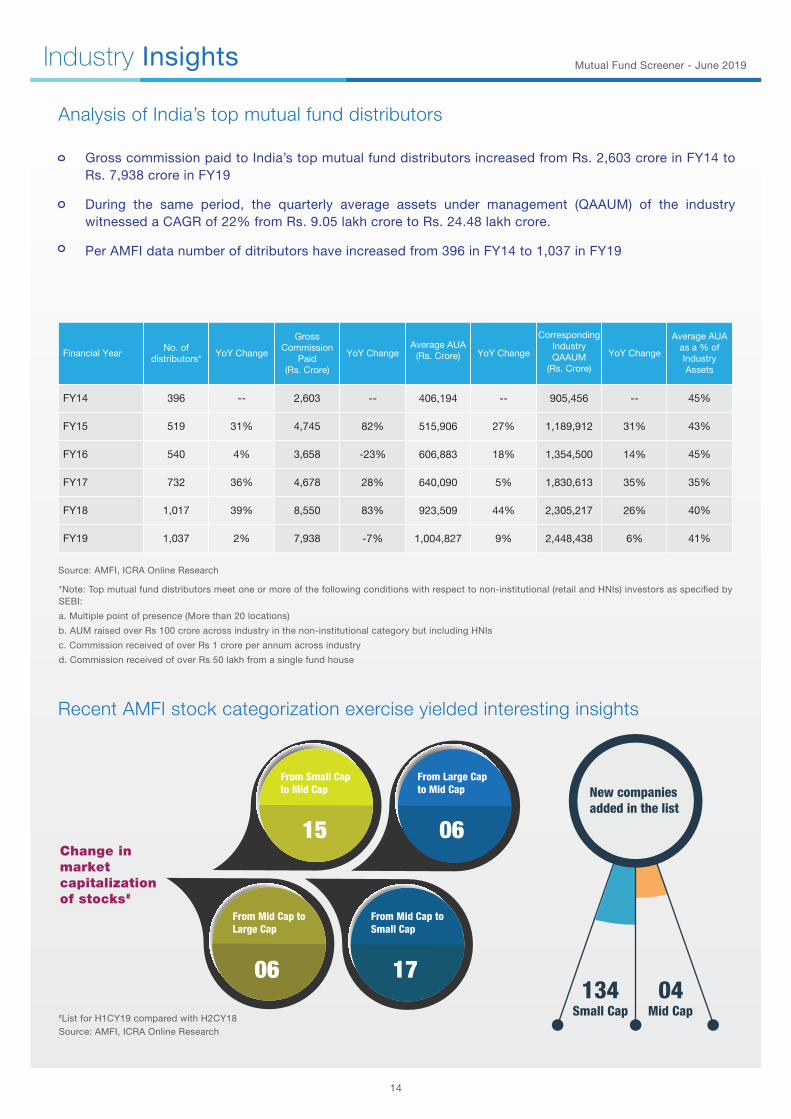
Recent AMFI stock categorization exercise yielded interesting insights
Change in market capitalization of stocks#
From Small Cap to Mid Cap
15
From Large Cap to Mid Cap
06
From Mid Cap to Large Cap
06
From Mid Cap to Small Cap
17
New companies added in the list
Mid Cap04
Small Cap134
Source: AMFI, ICRA Online Research
#List for H1CY19 compared with H2CY18
FY14
FY15
FY16
FY17
FY18
FY19
396
519
540
732
1,017
1,037
--
31%
4%
36%
39%
2%
2,603
4,745
3,658
4,678
8,550
7,938
--
82%
-23%
28%
83%
-7%
--
27%
18%
5%
44%
9%
905,456
1,189,912
1,354,500
1,830,613
2,305,217
2,448,438
--
31%
14%
35%
26%
6%
406,194
515,906
606,883
640,090
923,509
1,004,827
No. ofdistributors*
YoY ChangeFinancial Year YoY Change YoY Change YoY Change
45%
43%
45%
35%
40%
41%
GrossCommission
Paid(Rs. Crore)
Analysis of India’s top mutual fund distributors
Gross commission paid to India’s top mutual fund distributors increased from Rs. 2,603 crore in FY14 to Rs. 7,938 crore in FY19
During the same period, the quarterly average assets under management (QAAUM) of the industry witnessed a CAGR of 22% from Rs. 9.05 lakh crore to Rs. 24.48 lakh crore.
Per AMFI data number of ditributors have increased from 396 in FY14 to 1,037 in FY19
Mutual Fund Screener - June 2019Industry Insights
Average AUA (Rs. Crore)
Average AUA as a % of Industry Assets
Corresponding Industry QAAUM
(Rs. Crore)
Source: AMFI, ICRA Online Research
*Note: Top mutual fund distributors meet one or more of the following conditions with respect to non-institutional (retail and HNIs) investors as speci�ed by SEBI:
a. Multiple point of presence (More than 20 locations)
b. AUM raised over Rs 100 crore across industry in the non-institutional category but including HNIs
c. Commission received of over Rs 1 crore per annum across industry
d. Commission received of over Rs 50 lakh from a single fund house
14
Mutual Fund Screener - June 2019Industry Insights
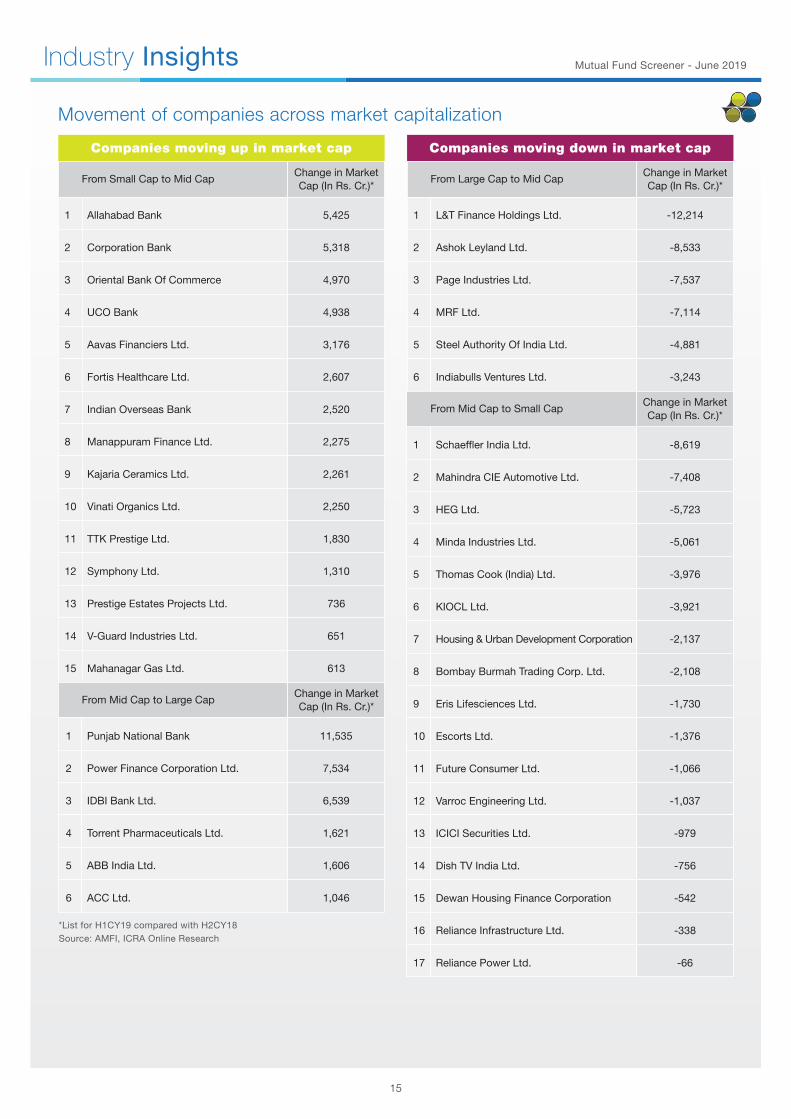
Movement of companies across market capitalization
From Small Cap to Mid CapChange in MarketCap (In Rs. Cr.)*
Companies moving up in market cap
1
2
3
4
5
6
7
8
9
10
11
12
13
14
15
Allahabad Bank
Corporation Bank
Oriental Bank Of Commerce
UCO Bank
Aavas Financiers Ltd.
Fortis Healthcare Ltd.
Indian Overseas Bank
Manappuram Finance Ltd.
Kajaria Ceramics Ltd.
Vinati Organics Ltd.
TTK Prestige Ltd.
Symphony Ltd.
Prestige Estates Projects Ltd.
V-Guard Industries Ltd.
Mahanagar Gas Ltd.
5,425
5,318
4,970
4,938
3,176
2,607
2,520
2,275
2,261
2,250
1,830
1,310
736
651
613
1
2
3
4
5
6
L&T Finance Holdings Ltd.
Ashok Leyland Ltd.
Page Industries Ltd.
MRF Ltd.
Steel Authority Of India Ltd.
Indiabulls Ventures Ltd.
-12,214
-8,533
-7,537
-7,114
-4,881
-3,243
1
2
3
4
5
6
7
8
9
10
11
12
13
14
15
16
17
Schaef�er India Ltd.
Mahindra CIE Automotive Ltd.
HEG Ltd.
Minda Industries Ltd.
Thomas Cook (India) Ltd.
KIOCL Ltd.
Housing & Urban Development Corporation
Bombay Burmah Trading Corp. Ltd.
Eris Lifesciences Ltd.
Escorts Ltd.
Future Consumer Ltd.
Varroc Engineering Ltd.
ICICI Securities Ltd.
Dish TV India Ltd.
Dewan Housing Finance Corporation
Reliance Infrastructure Ltd.
Reliance Power Ltd.
-8,619
-7,408
-5,723
-5,061
-3,976
-3,921
-2,137
-2,108
-1,730
-1,376
-1,066
-1,037
-979
-756
-542
-338
-66
From Large Cap to Mid CapChange in MarketCap (In Rs. Cr.)*
Companies moving down in market cap
Change in MarketCap (In Rs. Cr.)*
From Mid Cap to Large Cap
Change in MarketCap (In Rs. Cr.)*
From Mid Cap to Small Cap
1
2
3
4
5
6
Punjab National Bank
Power Finance Corporation Ltd.
IDBI Bank Ltd.
Torrent Pharmaceuticals Ltd.
ABB India Ltd.
ACC Ltd.
11,535
7,534
6,539
1,621
1,606
1,046
15
Source: AMFI, ICRA Online Research*List for H1CY19 compared with H2CY18
Mutual Fund Screener - June 2019Industry Insights
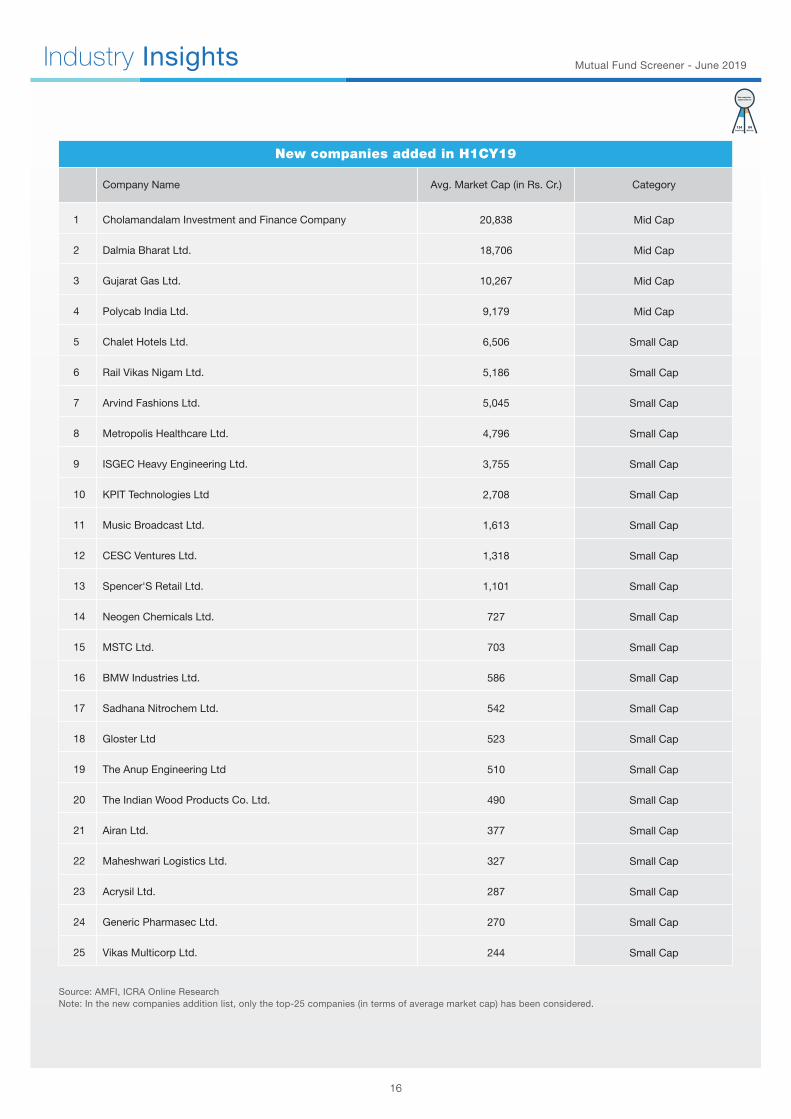
Company Name Avg. Market Cap (in Rs. Cr.)
New companies added in H1CY19
Category
1
2
3
4
5
6
7
8
9
10
11
12
13
14
15
16
17
18
19
20
21
22
23
24
25
Cholamandalam Investment and Finance Company
Dalmia Bharat Ltd.
Gujarat Gas Ltd.
Polycab India Ltd.
Chalet Hotels Ltd.
Rail Vikas Nigam Ltd.
Arvind Fashions Ltd.
Metropolis Healthcare Ltd.
ISGEC Heavy Engineering Ltd.
KPIT Technologies Ltd
Music Broadcast Ltd.
CESC Ventures Ltd.
Spencer'S Retail Ltd.
Neogen Chemicals Ltd.
MSTC Ltd.
BMW Industries Ltd.
Sadhana Nitrochem Ltd.
Gloster Ltd
The Anup Engineering Ltd
The Indian Wood Products Co. Ltd.
Airan Ltd.
Maheshwari Logistics Ltd.
Acrysil Ltd.
Generic Pharmasec Ltd.
Vikas Multicorp Ltd.
20,838
18,706
10,267
9,179
6,506
5,186
5,045
4,796
3,755
2,708
1,613
1,318
1,101
727
703
586
542
523
510
490
377
327
287
270
244
Mid Cap
Mid Cap
Mid Cap
Mid Cap
Small Cap
Small Cap
Small Cap
Small Cap
Small Cap
Small Cap
Small Cap
Small Cap
Small Cap
Small Cap
Small Cap
Small Cap
Small Cap
Small Cap
Small Cap
Small Cap
Small Cap
Small Cap
Small Cap
Small Cap
Small Cap
Source: AMFI, ICRA Online Research Note: In the new companies addition list, only the top-25 companies (in terms of average market cap) has been considered.
16
New companies added in the list
Mid Cap04
Small Cap134
Regulatory UpdateSection VI
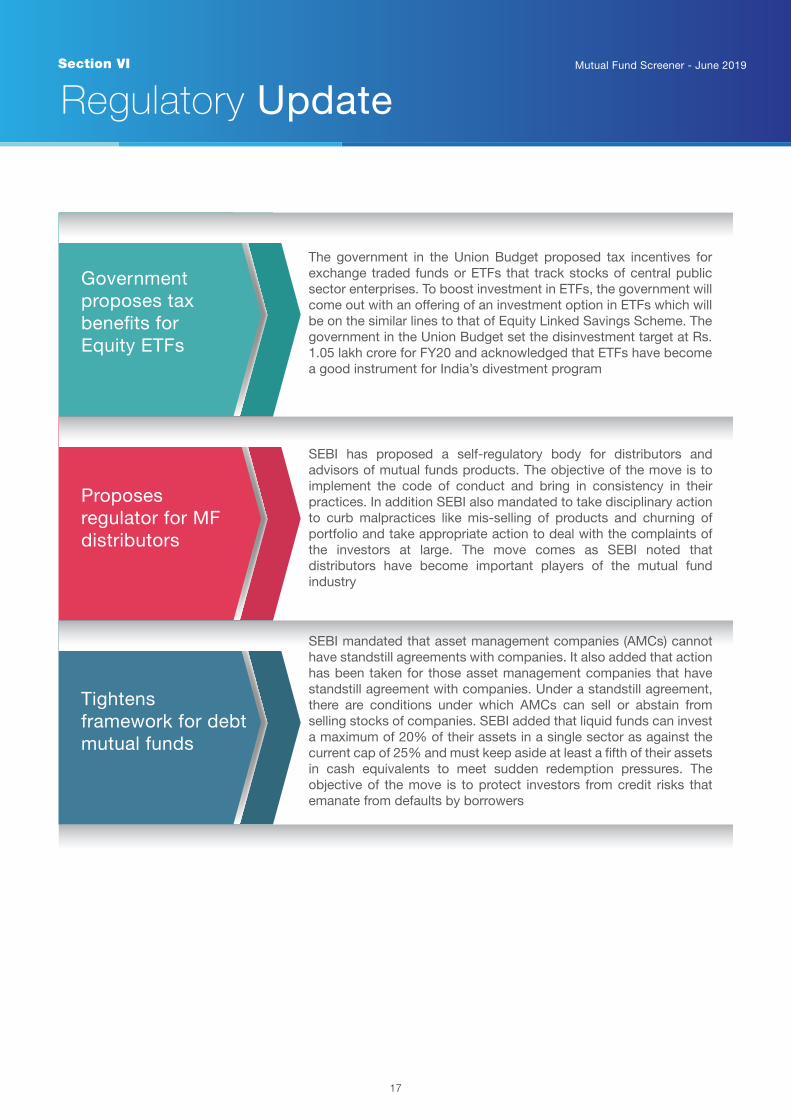
SEBI mandated that asset management companies (AMCs) cannot have standstill agreements with companies. It also added that action has been taken for those asset management companies that have standstill agreement with companies. Under a standstill agreement, there are conditions under which AMCs can sell or abstain from selling stocks of companies. SEBI added that liquid funds can invest a maximum of 20% of their assets in a single sector as against the current cap of 25% and must keep aside at least a �fth of their assets in cash equivalents to meet sudden redemption pressures. The objective of the move is to protect investors from credit risks that emanate from defaults by borrowers
Tightens framework for debt mutual funds
SEBI has proposed a self-regulatory body for distributors and advisors of mutual funds products. The objective of the move is to implement the code of conduct and bring in consistency in their practices. In addition SEBI also mandated to take disciplinary action to curb malpractices like mis-selling of products and churning of portfolio and take appropriate action to deal with the complaints of the investors at large. The move comes as SEBI noted that distributors have become important players of the mutual fund industry
Proposes regulator for MF distributors
The government in the Union Budget proposed tax incentives for exchange traded funds or ETFs that track stocks of central public sector enterprises. To boost investment in ETFs, the government will come out with an offering of an investment option in ETFs which will be on the similar lines to that of Equity Linked Savings Scheme. The government in the Union Budget set the disinvestment target at Rs. 1.05 lakh crore for FY20 and acknowledged that ETFs have become a good instrument for India’s divestment program
Government proposes tax bene�ts for Equity ETFs
Mutual Fund Screener - June 2019
17
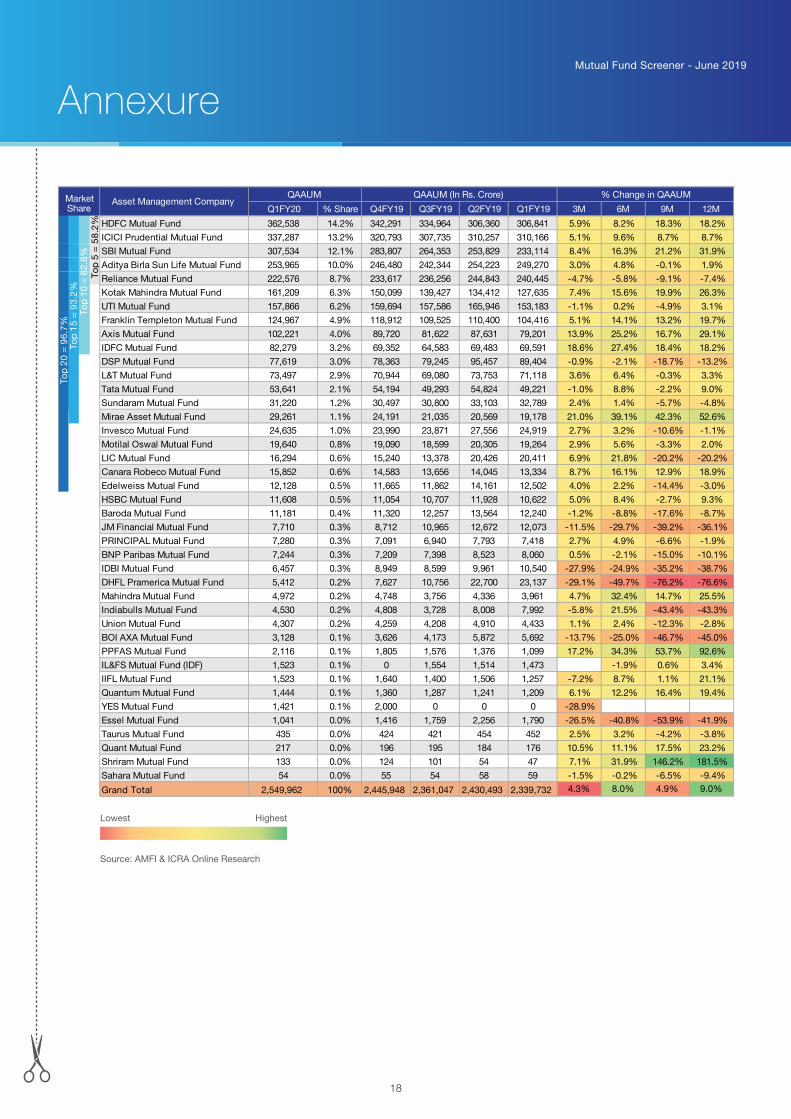
18
AnnexureMutual Fund Screener - June 2019
Q1FY20 % Share Q4FY19 Q3FY19 Q2FY19 Q1FY19 3M 6M 9M 12M
HDFC Mutual Fund 362,538 14.2% 342,291 334,964 306,360 306,841 5.9% 8.2% 18.3% 18.2%
ICICI Prudential Mutual Fund 337,287 13.2% 320,793 307,735 310,257 310,166 5.1% 9.6% 8.7% 8.7%
SBI Mutual Fund 307,534 12.1% 283,807 264,353 253,829 233,114 8.4% 16.3% 21.2% 31.9%
Aditya Birla Sun Life Mutual Fund 253,965 10.0% 246,480 242,344 254,223 249,270 3.0% 4.8% -0.1% 1.9%
Reliance Mutual Fund 222,576 8.7% 233,617 236,256 244,843 240,445 -4.7% -5.8% -9.1% -7.4%
Kotak Mahindra Mutual Fund 161,209 6.3% 150,099 139,427 134,412 127,635 7.4% 15.6% 19.9% 26.3%
UTI Mutual Fund 157,866 6.2% 159,694 157,586 165,946 153,183 -1.1% 0.2% -4.9% 3.1%
Franklin Templeton Mutual Fund 124,967 4.9% 118,912 109,525 110,400 104,416 5.1% 14.1% 13.2% 19.7%
Axis Mutual Fund 102,221 4.0% 89,720 81,622 87,631 79,201 13.9% 25.2% 16.7% 29.1%
IDFC Mutual Fund 82,279 3.2% 69,352 64,583 69,483 69,591 18.6% 27.4% 18.4% 18.2%
DSP Mutual Fund 77,619 3.0% 78,363 79,245 95,457 89,404 -0.9% -2.1% -18.7% -13.2%
L&T Mutual Fund 73,497 2.9% 70,944 69,080 73,753 71,118 3.6% 6.4% -0.3% 3.3%
Tata Mutual Fund 53,641 2.1% 54,194 49,293 54,824 49,221 -1.0% 8.8% -2.2% 9.0%
Sundaram Mutual Fund 31,220 1.2% 30,497 30,800 33,103 32,789 2.4% 1.4% -5.7% -4.8%
Mirae Asset Mutual Fund 29,261 1.1% 24,191 21,035 20,569 19,178 21.0% 39.1% 42.3% 52.6%
Invesco Mutual Fund 24,635 1.0% 23,990 23,871 27,556 24,919 2.7% 3.2% -10.6% -1.1%
Motilal Oswal Mutual Fund 19,640 0.8% 19,090 18,599 20,305 19,264 2.9% 5.6% -3.3% 2.0%
LIC Mutual Fund 16,294 0.6% 15,240 13,378 20,426 20,411 6.9% 21.8% -20.2% -20.2%
Canara Robeco Mutual Fund 15,852 0.6% 14,583 13,656 14,045 13,334 8.7% 16.1% 12.9% 18.9%
Edelweiss Mutual Fund 12,128 0.5% 11,665 11,862 14,161 12,502 4.0% 2.2% -14.4% -3.0%
HSBC Mutual Fund 11,608 0.5% 11,054 10,707 11,928 10,622 5.0% 8.4% -2.7% 9.3%
Baroda Mutual Fund 11,181 0.4% 11,320 12,257 13,564 12,240 -1.2% -8.8% -17.6% -8.7%
JM Financial Mutual Fund 7,710 0.3% 8,712 10,965 12,672 12,073 -11.5% -29.7% -39.2% -36.1%
PRINCIPAL Mutual Fund 7,280 0.3% 7,091 6,940 7,793 7,418 2.7% 4.9% -6.6% -1.9%
BNP Paribas Mutual Fund 7,244 0.3% 7,209 7,398 8,523 8,060 0.5% -2.1% -15.0% -10.1%
IDBI Mutual Fund 6,457 0.3% 8,949 8,599 9,961 10,540 -27.9% -24.9% -35.2% -38.7%
DHFL Pramerica Mutual Fund 5,412 0.2% 7,627 10,756 22,700 23,137 -29.1% -49.7% -76.2% -76.6%
Mahindra Mutual Fund 4,972 0.2% 4,748 3,756 4,336 3,961 4.7% 32.4% 14.7% 25.5%
Indiabulls Mutual Fund 4,530 0.2% 4,808 3,728 8,008 7,992 -5.8% 21.5% -43.4% -43.3%
Union Mutual Fund 4,307 0.2% 4,259 4,208 4,910 4,433 1.1% 2.4% -12.3% -2.8%
BOI AXA Mutual Fund 3,128 0.1% 3,626 4,173 5,872 5,692 -13.7% -25.0% -46.7% -45.0%
PPFAS Mutual Fund 2,116 0.1% 1,805 1,576 1,376 1,099 17.2% 34.3% 53.7% 92.6%
IL&FS Mutual Fund (IDF) 1,523 0.1% 0 1,554 1,514 1,473 -1.9% 0.6% 3.4%
IIFL Mutual Fund 1,523 0.1% 1,640 1,400 1,506 1,257 -7.2% 8.7% 1.1% 21.1%
Quantum Mutual Fund 1,444 0.1% 1,360 1,287 1,241 1,209 6.1% 12.2% 16.4% 19.4%
YES Mutual Fund 1,421 0.1% 2,000 0 0 0 -28.9%
Essel Mutual Fund 1,041 0.0% 1,416 1,759 2,256 1,790 -26.5% -40.8% -53.9% -41.9%
Taurus Mutual Fund 435 0.0% 424 421 454 452 2.5% 3.2% -4.2% -3.8%
Quant Mutual Fund 217 0.0% 196 195 184 176 10.5% 11.1% 17.5% 23.2%
Shriram Mutual Fund 133 0.0% 124 101 54 47 7.1% 31.9% 146.2% 181.5%
Sahara Mutual Fund 54 0.0% 55 54 58 59 -1.5% -0.2% -6.5% -9.4%4.3% 8.0% 4.9% 9.0%Grand Total 2,549,962 100% 2,445,948 2,361,047 2,430,493 2,339,732
Top
20
= 9
6.7%
Top
15
= 9
3.2%
Top
10
= 8
2.8%
Top
5 =
58
.2%
MarketShare
Asset Management CompanyQAAUM QAAUM (In Rs. Crore) % Change in QAAUM
Source: AMFI & ICRA Online Research
Lowest Highest
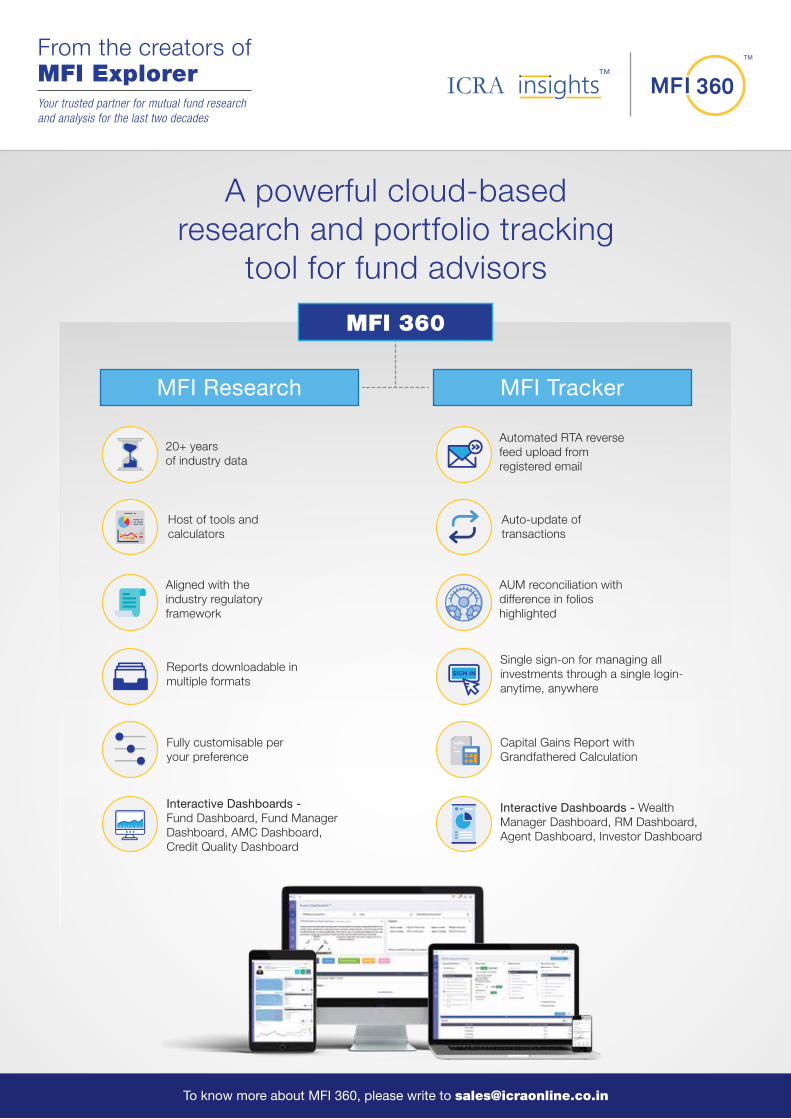
A powerful cloud-based research and portfolio tracking
tool for fund advisors
From the creators ofMFI ExplorerYour trusted partner for mutual fund researchand analysis for the last two decades
20+ yearsof industry data
Fully customisable per your preference
Host of tools and calculators
Reports downloadable in multiple formats
Aligned with the industry regulatory framework
Automated RTA reverse feed upload from registered email
Capital Gains Report with Grandfathered Calculation
Interactive Dashboards -Fund Dashboard, Fund Manager Dashboard, AMC Dashboard,Credit Quality Dashboard
Interactive Dashboards - Wealth Manager Dashboard, RM Dashboard, Agent Dashboard, Investor Dashboard
Auto-update of transactions
Single sign-on for managing all investments through a single login- anytime, anywhere
AUM reconciliation with difference in folios highlighted
MFI Research MFI Tracker
TM
To know more about MFI 360, please write to [email protected]
MFI 360
Saugat Acharya+91 98209 [email protected]
Atul Sharma+91 96191 [email protected]
Eshna Basu
Contact Information
+91 96747 [email protected]
Disclaimer
All information contained herein is obtained by ICRA Online Limited (“ICRON”) from sources believed by it to be accurate and reliable. Because of the possibility of human or mechanical error as well as other factors, however, all information contained herein is provided “AS IS” without warranty of any kind. ICRON adopts all necessary measures so that the information it uses is of sufficient quality and from sources ICRON considers to be reliable including, when appropriate, independent third-party sources. However, ICRON is not an auditor and cannot in every instance independently verify or validate information received in preparing this document.
All information contained herein must be construed solely as statements of opinion, and ICRA Online Limited or its affiliates or group companies and its respective and any of its officers, directors, personnel and employees, disclaim liability to any loss, damage of any nature, including but not limited to direct, indirect, punitive, special, exemplary, consequential, as also any loss of profit in any way arising from the use of this document or its contents in any manner or for any contingency within or beyond the control of, ICRON or any of its directors, officers, employees, agents, representatives, licensors or suppliers, arising from or in connection with the information contained herein or the use of or inability to use any such information. Opinions expressed in the document are not the opinions of our holding company, ICRA Limited (ICRA), and should not be construed as any indication of credit rating or grading of ICRA for any instruments that have been issued or are to be issued by any entity. The recipient alone shall be fully responsible and/or are liable for any decision taken on the basis of this document and/or the information contained herein.
Please go to http://www.icraonline.com/legal/standard-disclaimer.html for disclaimer
Copyright © 2019, ICRA Online Ltd. All rights reserved.


