

THE MANUFACTURING ECONOMIC UPDATE
Dr. Chad MoutrayChief Economist
National Association of Manufacturers
Updated April 8, 2013

2010:1 2010:2 2010:3 2010:4 2011:1 2011:2 2011:3 2011:4 2012:1 2012:2 2012:3 2012:4 2013:140%
50%
60%
70%
80%
90%
100%
69.5%73.9% 74.5% 74.9%
82.8%86.4%
65.4%
80.2%
88.7%
83.1%
69.2%
51.8%
70.1%
Manufacturing Business OutlookBy Quarter, 2010-2013
Source: NAM/Industry Week Survey of ManufacturersNote: Percentage of respondents who characterized the current business outlook at somewhat or very positive. Percentages are annual averages. Q4:2010 and Q1:2011 data are imputed from comparable data using a regression model.
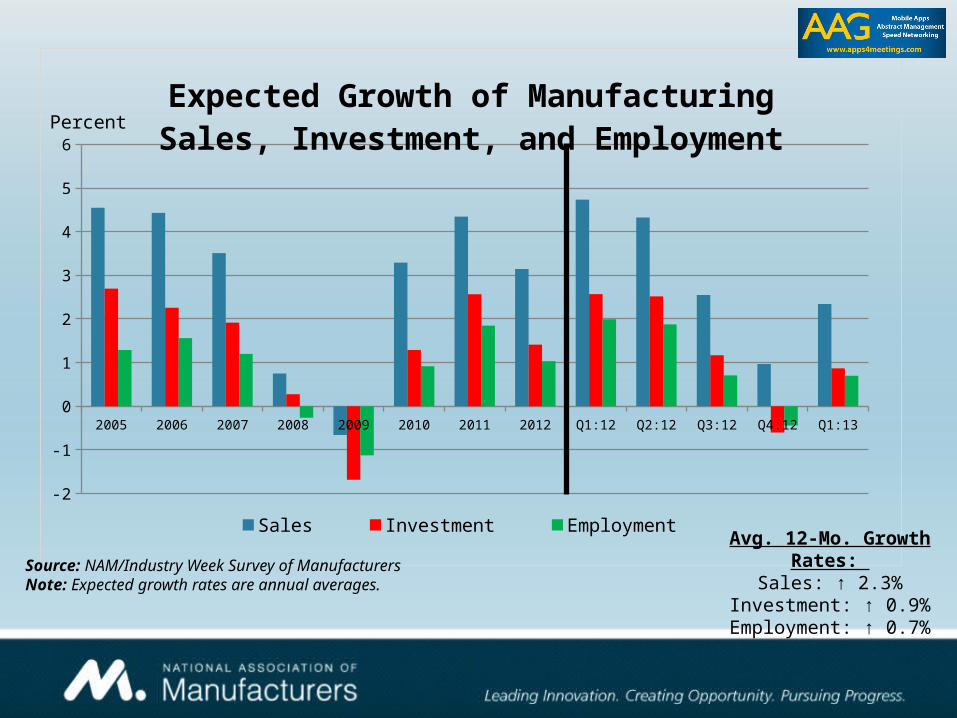
2005 2006 2007 2008 2009 2010 2011 2012 Q1:12 Q2:12 Q3:12 Q4:12 Q1:13
-2
-1
0
1
2
3
4
5
6
Expected Growth of Manufacturing Sales, Investment, and Employment
Sales Investment Employment
Percent
Source: NAM/Industry Week Survey of ManufacturersNote: Expected growth rates are annual averages.
Avg. 12-Mo. Growth Rates:
Sales: ↑ 2.3%Investment: ↑ 0.9%
Employment: ↑ 0.7%
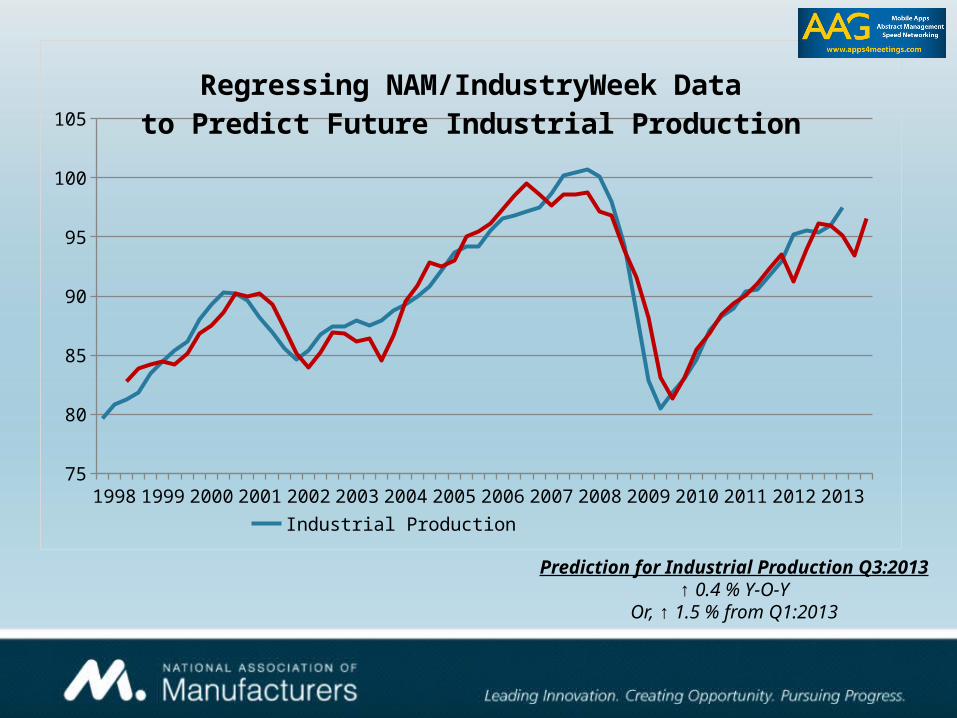
199819992000200120022003200420052006200720082009201020112012201375
80
85
90
95
100
105
Regressing NAM/IndustryWeek Datato Predict Future Industrial Production
Industrial Production Industrial Production (Predicted)
Prediction for Industrial Production Q3:2013
↑ 0.4 % Y-O-YOr, ↑ 1.5 % from Q1:2013

Source: NAM/Industry Week Survey of ManufacturersNote: Respondents were able to check all that apply. Therefore, responses exceed 100 percent.
Challenges with access to capital or other forms of financing
Weaker global growth and slower export sales
Rising energy and raw material costs for our products
Attracting and retaining a quality workforce
Weaker domestic economy and sales for our products to U.S. customers
Unfavorable business climate (e.g., taxes, regulation)
Uncertainties related to the political climate (e.g., debt/deficit debate, pending budget cuts)
Rising health care/insurance costs
4.7%
27.9%
37.3%
41.1%
49.9%
67.7%
72.1%
74.0%
Primary Current Business Chal-lenges,
First Quarter 2013
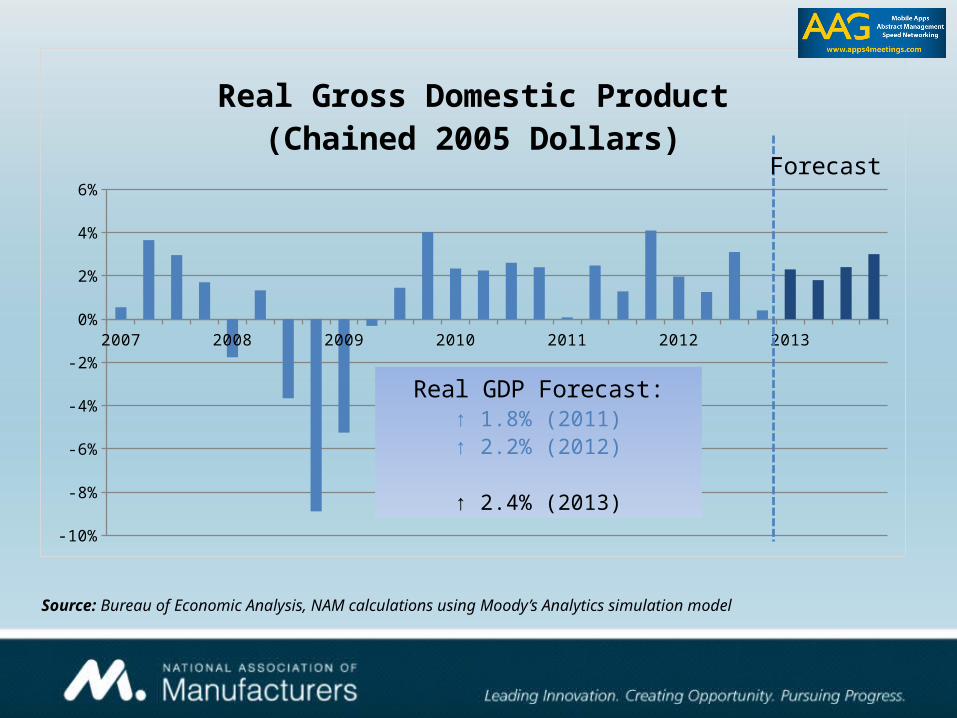
2007 2008 2009 2010 2011 2012 2013
-10%
-8%
-6%
-4%
-2%
0%
2%
4%
6%
Real Gross Domestic Product(Chained 2005 Dollars)
Real GDP Forecast:↑ 1.8% (2011)↑ 2.2% (2012)
↑ 2.4% (2013)
Forecast
Source: Bureau of Economic Analysis, NAM calculations using Moody’s Analytics simulation model
Q1:2010
Q2:2010
Q3:2010
Q4:2010
Q1:2011
Q2:2011
Q3:2011
Q4:2011
Q1:2012
Q2:2012
Q3:2012
Q4:2012
-1.0%
0.0%
1.0%
2.0%
3.0%
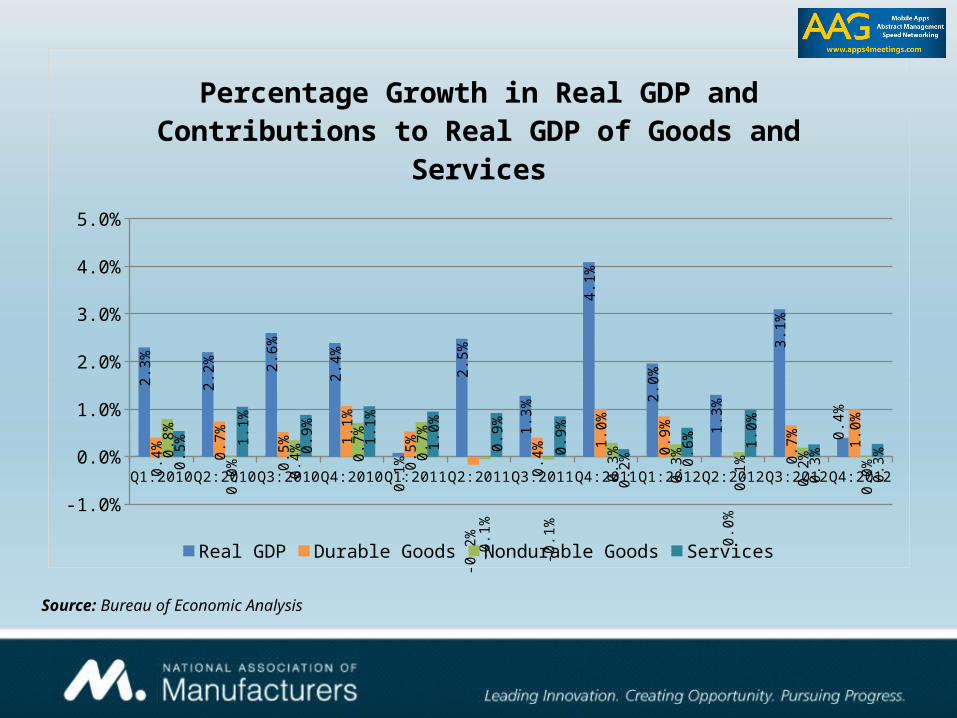
4.0%
5.0%
2.3
%
2.2
% 2.6
%
2.4
%
0.1
%
2.5
%
1.3
%
4.1
%
2.0
%
1.3
%
3.1
%
0.4
%
0.4
% 0.7
%
0.5
% 1.1
%
0.5
%
-0.2
%
0.4
% 1.0
%
0.9
%
0.0
%
0.7
% 1.0
%
0.8
%
0.0
% 0.4
% 0.7
%
0.7
%
-0.1
%
-0.1
%
0.3
%
0.3
%
0.1
%
0.2
%
0.0
%0.5
% 1.1
%
0.9
%
1.1
%
1.0
%
0.9
%
0.9
%
0.2
% 0.6
% 1.0
%
0.3
%
0.3
%
Percentage Growth in Real GDP andContributions to Real GDP of Goods and
Services
Real GDP Durable Goods Nondurable Goods Services
Source: Bureau of Economic Analysis

2005 2006 2007 2008 2009 2010 2011 2012 2013$130
$150
$170
$190
$210
$230
$250
Manufactured Durable Goods(in Billions of Dollars)
New Orders Shipments
Source: U.S. Census Bureau

2007 2008 2009 2010 2011 2012 201365
70
75
80
85
90
95
100
105Industrial Production
Industrial Production Capacity Utilization
Industrial Production/Capacity Utilization %
Source: Federal Reserve Board

Jan-12 Feb Mar Apr May Jun Jul Aug Sep Oct Nov Dec 13-Jan Feb
-1.5
-1
-0.5
0
0.5
1
1.5
2
2.5
3
% Changes in Manufacturing Production, 2012-2013
Manufacturing Durable Goods Nondurable Goods
Percent
Source: Federal Reserve Board

2008 2009 2010 2011 2012 201320.0
30.0
40.0
50.0
60.0
70.0
ISM Manufacturing Indices
Purchasing Managers Index New Orders Index Employment IndexInventories Index
Source: Institute for Supply Management
2011 2012 2013
-30
-20
-10
0
10
20
30
40
80
82
84
86
88
90
92
94
96
98
100
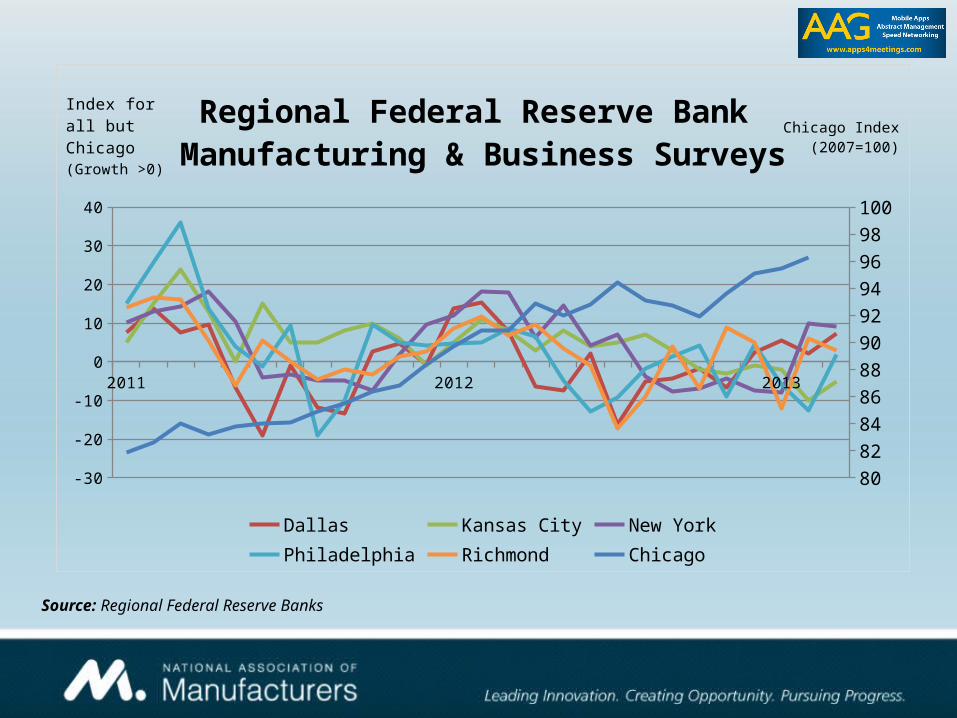
Regional Federal Reserve Bank Manufacturing & Business Surveys
Dallas Kansas City New YorkPhiladelphia Richmond Chicago
Index for all but Chicago(Growth >0)
Chicago Index(2007=100)
Source: Regional Federal Reserve Banks
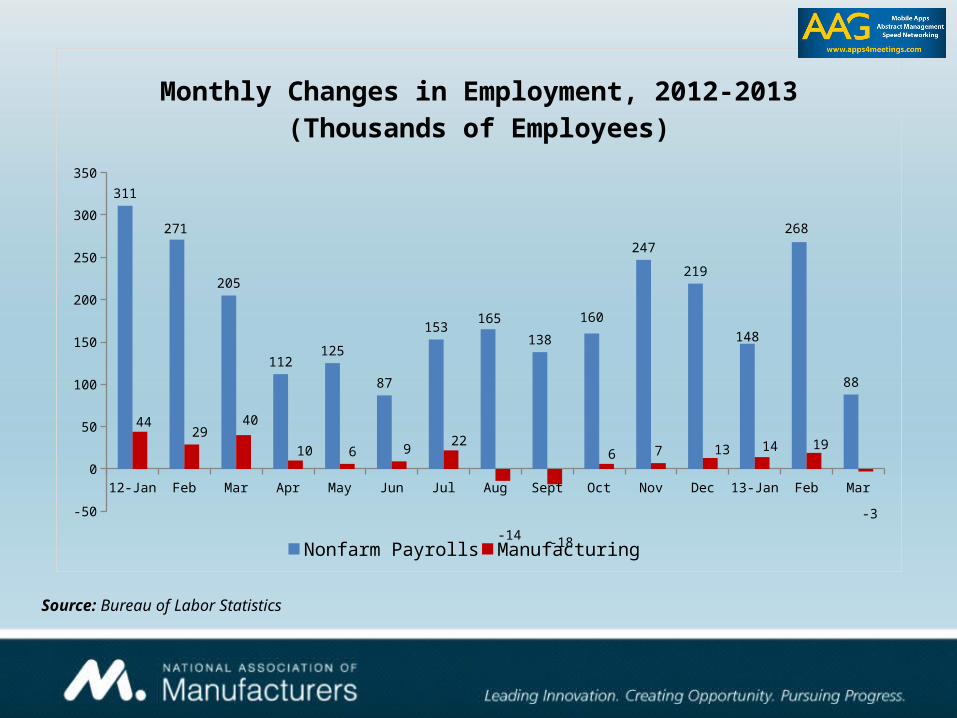
12-Jan Feb Mar Apr May Jun Jul Aug Sept Oct Nov Dec 13-Jan Feb Mar
-50
0
50
100
150
200
250
300
350
311
271
205
112125
87
153165
138
160
247
219
148
268
88
4429
40
10 6 922
-14 -18
6 7 13 14 19
-3
Monthly Changes in Employment, 2012-2013
(Thousands of Employees)
Nonfarm Payrolls Manufacturing
Source: Bureau of Labor Statistics
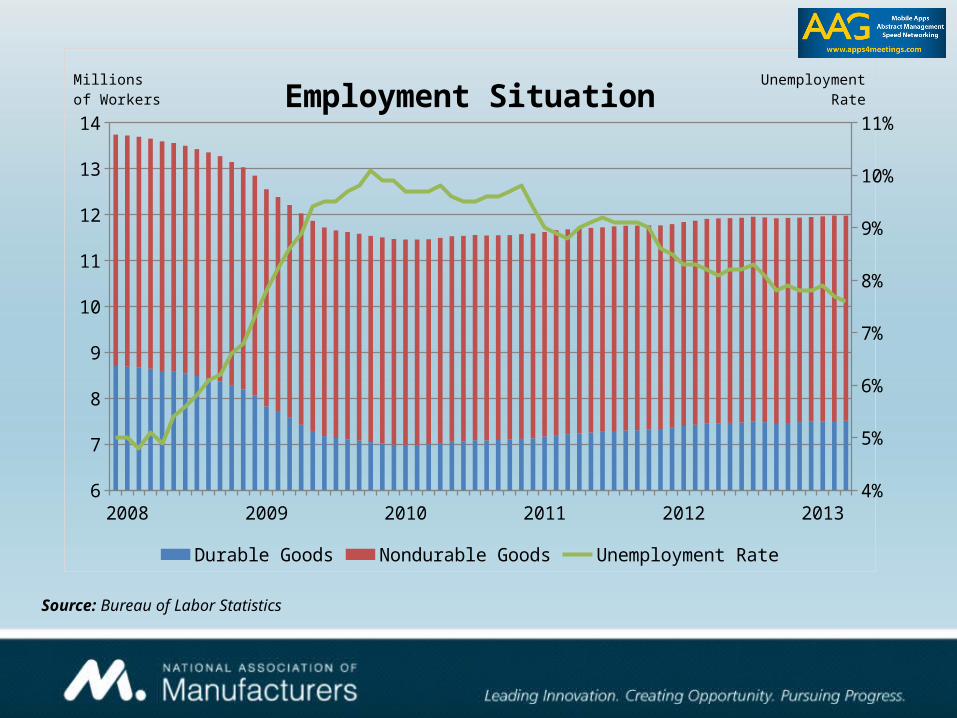
2008 2009 2010 2011 2012 20136
7
8
9
10
11
12
13
14
4%
5%
6%
7%
8%
9%
10%
11%Employment Situation
Durable Goods Nondurable Goods Unemployment Rate
Millionsof Workers
Unemployment Rate
Source: Bureau of Labor Statistics
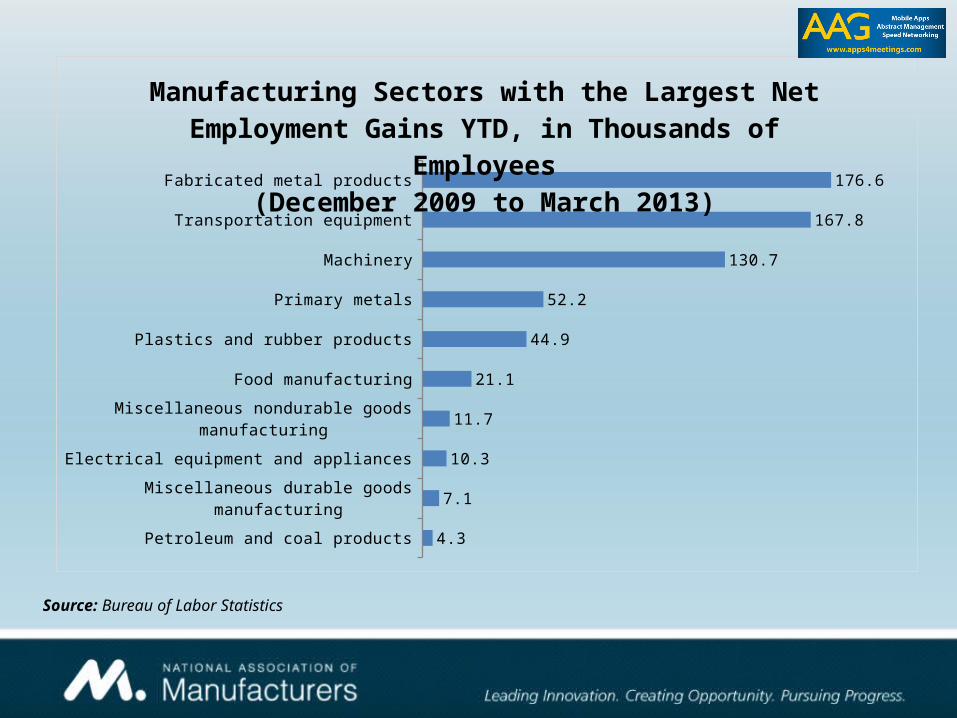
Petroleum and coal products
Miscellaneous durable goods manufacturing
Electrical equipment and appliances
Miscellaneous nondurable goods manufacturing
Food manufacturing
Plastics and rubber products
Primary metals
Machinery
Transportation equipment
Fabricated metal products
4.3
7.1
10.3
11.7
21.1
44.9
52.2
130.7
167.8
176.6
Manufacturing Sectors with the Largest Net Employment Gains YTD, in Thousands of
Employees(December 2009 to March 2013)
Source: Bureau of Labor Statistics

Kansas
Colorado
Oregon
Pennsylvania
South Carolina
Minnesota
Kentucky
Washington
Ohio
Texas
6.97.68.19.3
11.211.7
13.515.116.518.018.0
22.122.8
27.529.8
34.950.1
54.158.7
88.3
Top 20 States for Manufacturing Job Creation,
December 2009 to February 2013(in Thousands of Workers)
Source: Bureau of Labor Statistics

2008 2009 2010 2011 2012 201375
80
85
90
95
100
105
Manufacturing Employment Growth(December 2007 = 100)
Nonfarm Payrolls ManufacturingDurable Goods Nondurable Goods
Source: Bureau of Labor Statistics

Source: Bureau of Labor Statistics
2007 2008 2009 2010 2011 2012 201350
100
150
200
250
300
350
400
450
500
550
Manufacturing Job Hires & Sepa-rations
(January 2007 to February 2013)
Job Openings Hires Separations
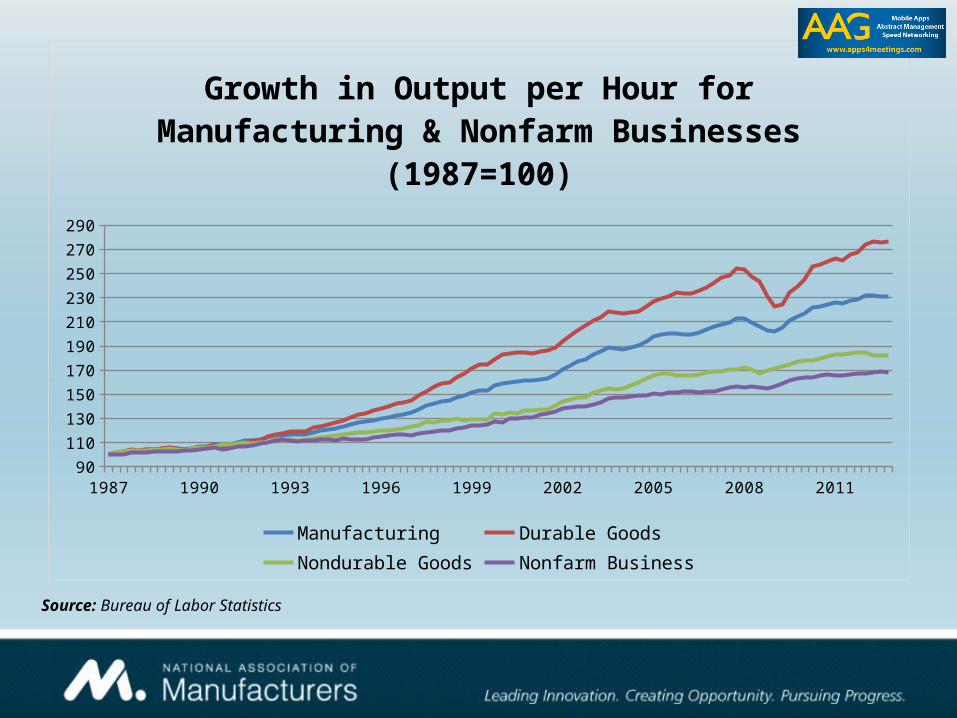
1987 1990 1993 1996 1999 2002 2005 2008 201190
110
130
150
170
190
210
230
250
270
290
Growth in Output per Hour for Man-ufacturing & Nonfarm Businesses
(1987=100)
Manufacturing Durable GoodsNondurable Goods Nonfarm Business
Source: Bureau of Labor Statistics
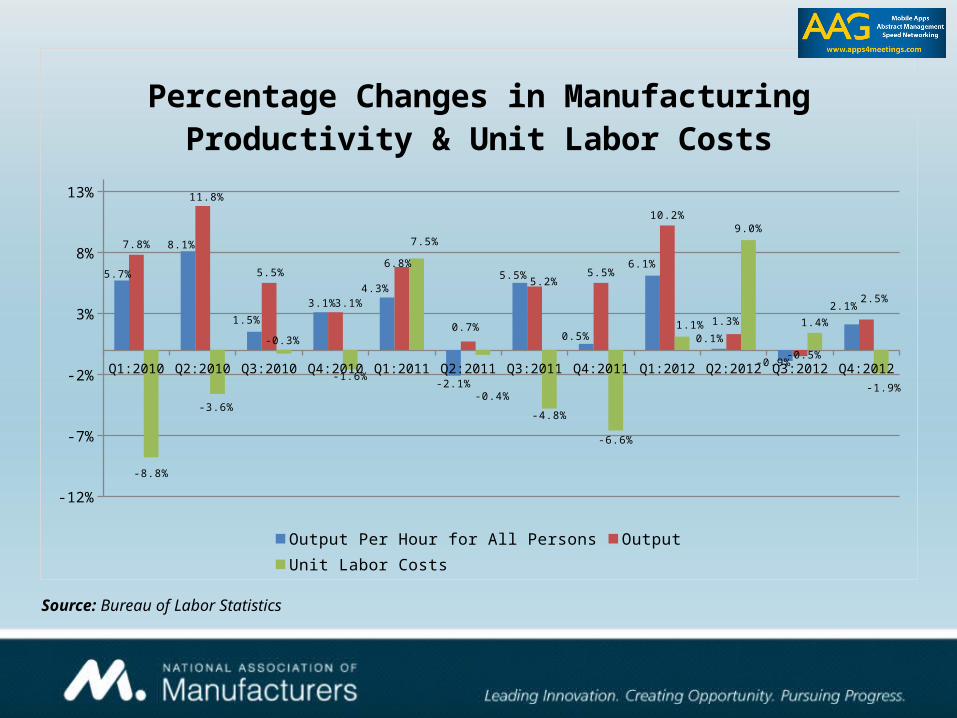
Q1:2010 Q2:2010 Q3:2010 Q4:2010 Q1:2011 Q2:2011 Q3:2011 Q4:2011 Q1:2012 Q2:2012 Q3:2012 Q4:2012
-12%
-7%
-2%
3%
8%
13%
5.7%
8.1%
1.5%
3.1%
4.3%
-2.1%
5.5%
0.5%
6.1%
0.1%
-0.9%
2.1%
7.8%
11.8%
5.5%
3.1%
6.8%
0.7%
5.2%5.5%
10.2%
1.3%
-0.5%
2.5%
-8.8%
-3.6%
-0.3%
-1.6%
7.5%
-0.4%
-4.8%
-6.6%
1.1%
9.0%
1.4%
-1.9%
Percentage Changes in Manufactur-ing Productivity & Unit Labor Costs
Output Per Hour for All Persons Output Unit Labor Costs
Source: Bureau of Labor Statistics

Some Ongoing Strengths in the Economy
A Recovering Housing Market
Historically Low Interest Rates
Modest Growth in Consumer Spending
Growth in Exports, Albeit at a Slower Pace
Lower Energy Costs, Aided by Shale Exploration
Increased Signs of Reshoring, Improved Global Competitiveness

2005 2006 2007 2008 2009 2010 2011 2012 20130
500
1,000
1,500
2,000
2,500
0
10
20
30
40
50
60
70
80
Housing Market Situation
Housing Starts Housing PermitsNAHB Housing Market Index
NAHB Housing Market Index
Housing Starts, Permits (in thou-sands of units)
Source: U.S. Census Bureau, National Association of Home Builders
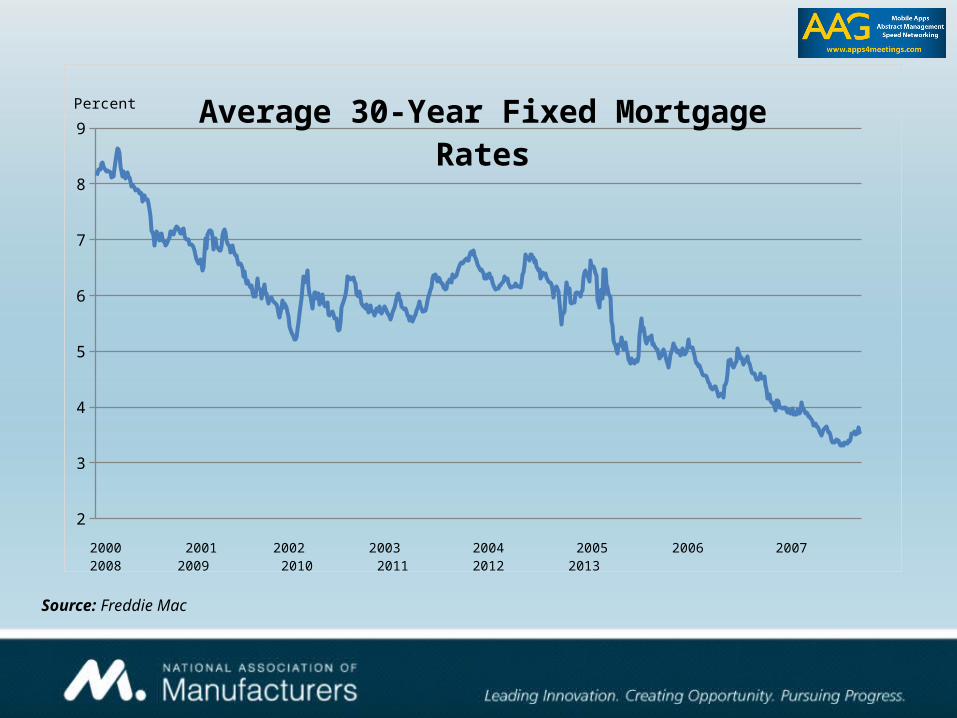
2
3
4
5
6
7
8
9Average 30-Year Fixed Mortgage
Rates
2000 2001 2002 2003 2004 2005 2006 2007 2008 2009 2010 2011 2012 2013
Percent
Source: Freddie Mac

2005 2006 2007 2008 2009 2010 2011 2012 2013$20
$30
$40
$50
$60
$70
New Manufacturing Construction Spending
(Value of Private Construction Put in Place, in Billions of Dollars)
Source: U.S. Census Bureau

2010 2011 2012 2013
-5
-4
-3
-2
-1
0
1
2
3
-10.0
-8.0
-6.0
-4.0
-2.0
0.0
2.0
4.0
6.0
8.0
Personal Income and Spending
Personal Income Personal Spending Savings Rate
Personal Income/Spending (% Change)
Savings RatePercentage
Source: Bureau of Economic Analysis
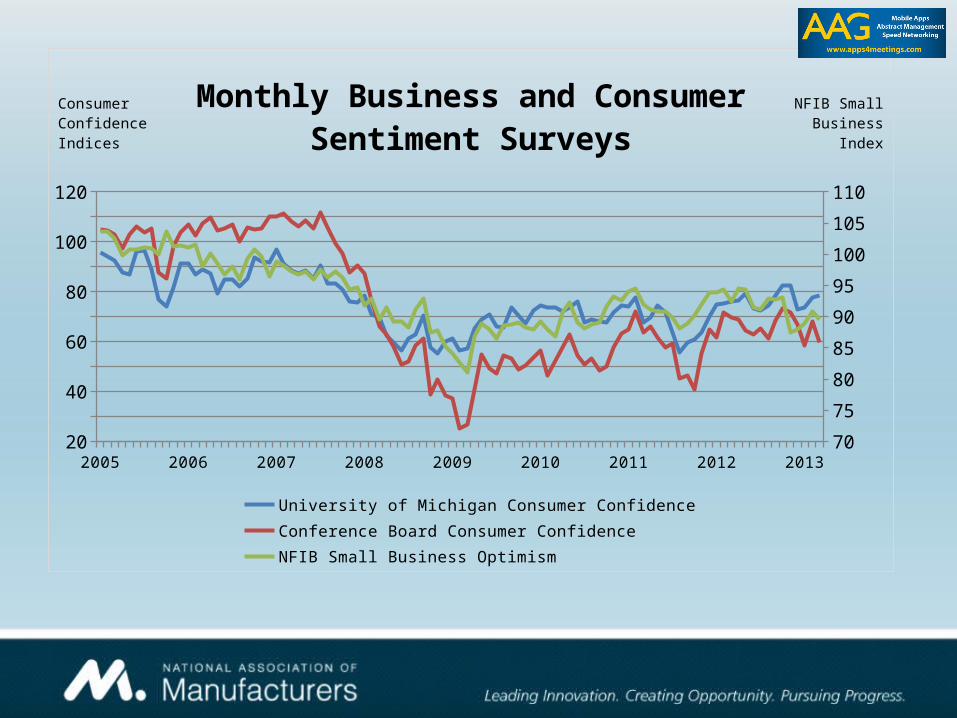
2005 2006 2007 2008 2009 2010 2011 2012 201320
30
40
50
60
70
80
90
100
110
120
70
75
80
85
90
95
100
105
110
Monthly Business and Consumer Sentiment Surveys
University of Michigan Consumer Confidence Conference Board Consumer ConfidenceNFIB Small Business Optimism
Consumer Confidence Indices
NFIB Small Business Index
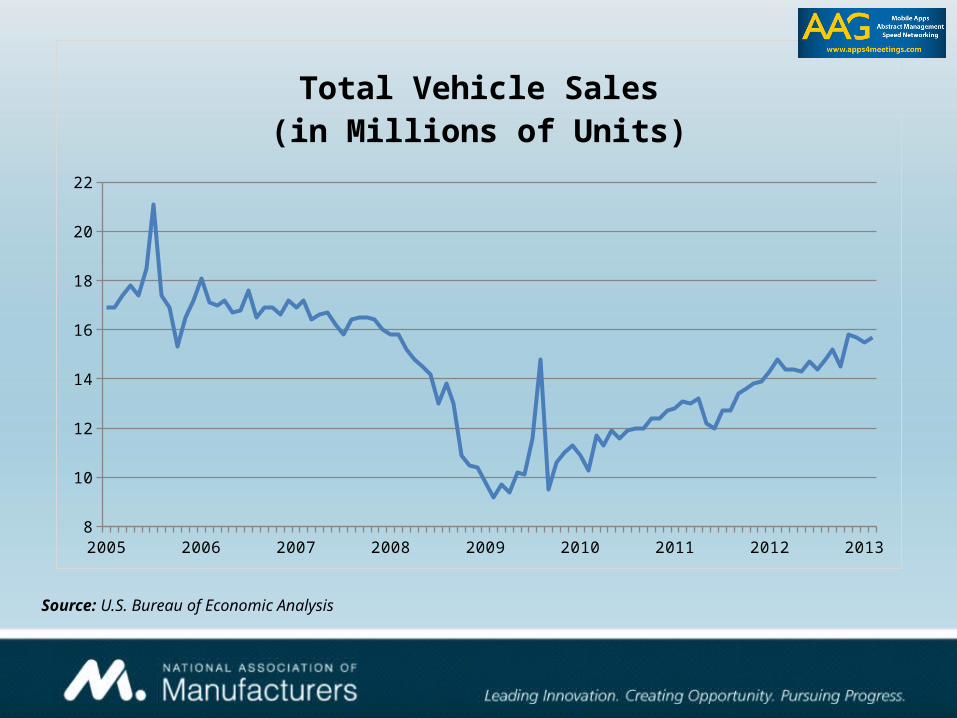
2005 2006 2007 2008 2009 2010 2011 2012 20138
10
12
14
16
18
20
22
Total Vehicle Sales(in Millions of Units)
Source: U.S. Bureau of Economic Analysis

Canada Mexico FTA Asia Europe South America
TOTAL0%
5%
10%
15%
20%
25%
13.0%
20.1%
16.9%
10.8%
17.2%
23.8%
15.9%
4.1%
10.1%
6.8%
2.6%
0.3%
13.3%
5.5%
% Growth of Manufactured Goods Exports, 2011-2012
2011 2012
Source: U.S. Department of Commerce
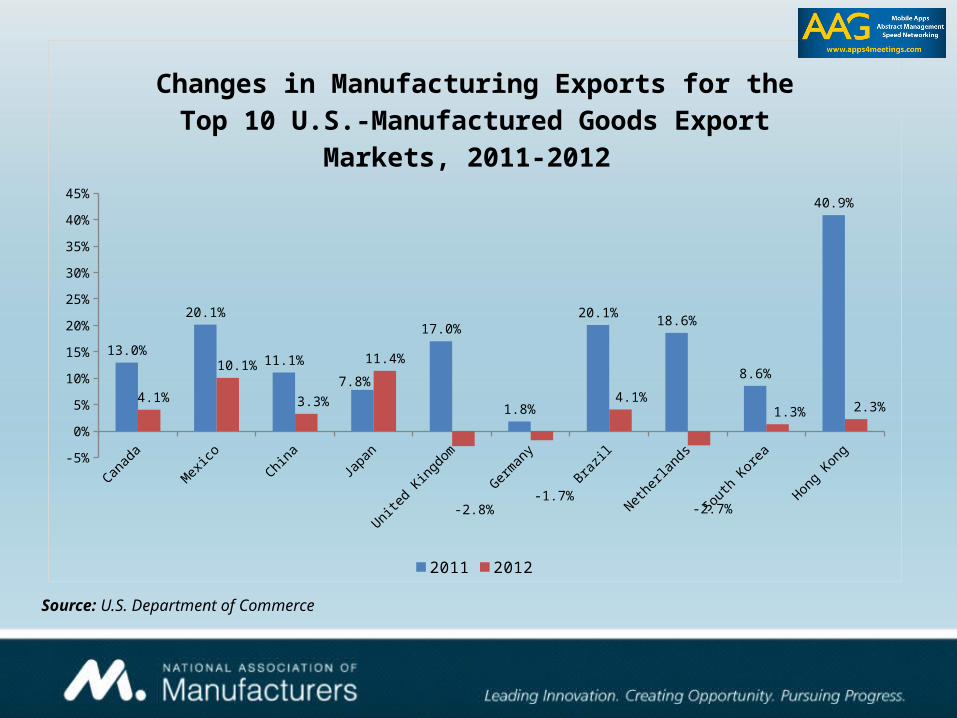
Canada Mexico China Japan United Kingdom
Germany Brazil Netherlands South Korea Hong Kong-5%
0%
5%
10%
15%
20%
25%
30%
35%
40%
45%
13.0%
20.1%
11.1%
7.8%
17.0%
1.8%
20.1%18.6%
8.6%
40.9%
4.1%
10.1%
3.3%
11.4%
-2.8%-1.7%
4.1%
-2.7%
1.3% 2.3%
Changes in Manufacturing Exports for the Top 10 U.S.-Manufactured Goods Export
Markets, 2011-2012
2011 2012
Source: U.S. Department of Commerce
Canada Mexico China Japan United Kingdom
Germany Brazil Netherlands South Korea Hong Kong45.0
46.0
47.0
48.0
49.0
50.0
51.0
52.0
53.0
49.3
52.2
51.6
50.4
48.3
48.9
51.8
48.0
52.0
50.5
Purchasing Managers’ Indices for the Top 10 Export Markets for U.S. Manufactured
Goods(March 2013) Notes:
Eurozone PMI: 46.8Global PMI: 51.2
Source: Markit
Tremendous Promise of Shale Gas
– PwC (December 2011) with the NAM: U.S. manufacturing companies could employ approximately one
million more workers by 2025 due to the benefits of affordable energy and demand for products used to extract the gas.
This same study found that, because of increased shale exploration, lower feedstock and energy costs could help U.S. manufacturers reduce natural gas expenses by as much as $11.6 billion annually through 2025.
– We have already seen how the shale gas revolution has transformed communities, helped to lift employment, and provide tremendous potential moving forward.
– Energy costs are a competitive advantage for U.S. manufacturers right now.

2010 2011 2012 20130%
1%
2%
3%
4%
5%
6%
7%
8%
Producer Price IndexYear-Over-Year Percentage Changes
for Each Month
PPI - Finished Goods PPI - Finished Goods Less Food & Energy
Percent
Source: Bureau of Labor Statistics

1947 50 55 60 65 70 75 80 85 90 95 2000 05 10 1210%
12%
14%
16%
18%
20%
22%
24%
26%
28%
Federal Government Receipts & Expen-ditures as a % of Gross Domestic Prod-
uct, 1947 to Present
Federal Receipts as a % of GDP Federal Expenditures as a % of GDP
23.8%
16.9%
Source: Bureau of Economic Analysis

2012 2013 2014 2015 2016 2017 2018 2019 2020 2021 2022 2023$0.0
$0.5
$1.0
$1.5
$2.0
$2.5
$3.0
$3.5
$4.0
Federal Mandatory Spending, 2012-2023(in Trillions of Dollars)
Social Security Medicare, Net of ReceiptsTotal Mandatory Spending Medicaid
Source: Congressional Budget Office, February 2013

The United States needs a comprehensive plan for economic growth and competitiveness.
GOAL 1The United States will be the best place in the world to manufacture and attract foreign direct investment.
Manufacturers have an array of attractive options around the world when deciding where to invest, conduct research, build new facilities and create jobs.
Create a pro-manufacturing tax policy.
Embrace an “all-of-the above” approach to energy production.
Modernize and invest in infrastructure.
Ensure that the benefits of regulations justify their costs to manufacturers in the United States.
Implement common-sense, fair legal reform.
Reduce health care costs for both patients and providers.

Manufacturers in the United States will be the world’s leading innovators.
Innovation propelled the United States to its global leadership position in manufacturing. But other nations are eager to take our place and are establishing more attractive R&D incentives than those offered by the United States.
Provide a strong, permanent and competitive R&D incentive.
Support federal research agencies and public- and private-sector research.
Recognize IP as the basis of America’s innovative economy.
Develop appropriate general and industry-specific best practices for improved cybersecurity.
Support the growth of a healthy information and communication technology ecosystem.
GOAL 2
The United States will expand access to global markets to enable manufacturers to reach the 95 percent of consumers who live outside our borders.
Promote a global trade policy that opens international markets, enhances competitiveness and reduces regulatory and tariff barriers.
Reduce trading costs, domestic export barriers and unnecessary red tape.
Boost exports through improved export promotion programs and export credit assistance for both small and large manufacturers.
Ensure a level playing field for manufacturers by enforcing trade laws and international agreements.
GOAL 3

Manufacturers in the United States will have access to the workforce that the 21st–century economy demands.
Address regulations and mandates that undermine employer flexibility and ultimately discourage the hiring of new employees.
Develop a more productive workforce and encourage innovation through education reforms and improvements.
Enact comprehensive immigration reform.
Attract the best and brightest to the United States.
GOAL 4

Questions?
Dr. Chad MoutrayChief Economist
National Association of Manufacturers
(202) 637-3148


