

7/27/2019 Natenberg _ Weithers RMC 2010 notes.pdf
http://slidepdf.com/reader/full/natenberg-weithers-rmc-2010-notespdf 1/50
Material prepared by
Sheldon Natenberg and Tim Weithers
Chicago Trading Co.
141 West Jackson Blvd.
Chicago, IL 60604
tel. 1 312 863 [email protected]
Equity-Related Volatility Skew
7/27/2019 Natenberg _ Weithers RMC 2010 notes.pdf
http://slidepdf.com/reader/full/natenberg-weithers-rmc-2010-notespdf 2/50
Equity-Related Volatility Skew
Option Models and the Real World
Modelling the Skew
Skew Risk and Changing Market Conditions
Skew Sensitive Trading Strategies

7/27/2019 Natenberg _ Weithers RMC 2010 notes.pdf
http://slidepdf.com/reader/full/natenberg-weithers-rmc-2010-notespdf 3/50
Skew: What is it?“Skew” means different things to different people:
To an Option Trader:
the directional bias (with respect to the underlyingasset’s price) reflected in option market prices
How measured (and relative to what baseline)?
Usually discussed in terms of “implied volatility”.

7/27/2019 Natenberg _ Weithers RMC 2010 notes.pdf
http://slidepdf.com/reader/full/natenberg-weithers-rmc-2010-notespdf 4/50
Theoretical Option Valuation
σ
Black-Scholes
European
Call OptionValuation
Model
Theoretical
ValuesC , P
S
X
rt

7/27/2019 Natenberg _ Weithers RMC 2010 notes.pdf
http://slidepdf.com/reader/full/natenberg-weithers-rmc-2010-notespdf 5/50
Implied (Market) Volatility
Black-Scholes
European
Call OptionValuation
Model
Option
Market
Prices
C , P
S
X
rtImplied σ

7/27/2019 Natenberg _ Weithers RMC 2010 notes.pdf
http://slidepdf.com/reader/full/natenberg-weithers-rmc-2010-notespdf 6/50
If Black-Scholes were “true”
(that is, if the real world aligned with the assumptions)
25%
Low X High XATM
Implied
Volatility
For all options with
the same expirationon the same underlying,
the implied volatility
would be a constant.

7/27/2019 Natenberg _ Weithers RMC 2010 notes.pdf
http://slidepdf.com/reader/full/natenberg-weithers-rmc-2010-notespdf 7/50
Implied Volatility
The CBOE has indicated that
“The average level of the implied volatility curvereflects the average volatility expected by the market.”
In this sense, implied volatility (to a certain expiration)can be thought of as the market’s expectation of
future volatility (between now and that expiration date).
But there are lots of options out there . . .
(obviously with options having different expirations,
there can be different implied volatilities, but . . . )

7/27/2019 Natenberg _ Weithers RMC 2010 notes.pdf
http://slidepdf.com/reader/full/natenberg-weithers-rmc-2010-notespdf 8/50
The Volatility “Smile”
Consider an underlying asset (like the S&P 500 or IBM stock). There are many options listed/traded.
The 3 month-expiration options trade on differentimplied volatilities depending on the strike price.
How can the market simultaneously have differentexpectations for how the S&P 500 or IBM stock will fluctuate over the next three months?
The plot of implied volatility versus strike priceis called the “Volatility Smile” or “Vol Skew”.
There is also a term structure of volatility.

7/27/2019 Natenberg _ Weithers RMC 2010 notes.pdf
http://slidepdf.com/reader/full/natenberg-weithers-rmc-2010-notespdf 9/50
Typical Volatility Smile in Indexes
25%
Low X High XATM
Implied
Volatility
28%
22%

7/27/2019 Natenberg _ Weithers RMC 2010 notes.pdf
http://slidepdf.com/reader/full/natenberg-weithers-rmc-2010-notespdf 10/50
Actual Volatility Smile in S&P 500

7/27/2019 Natenberg _ Weithers RMC 2010 notes.pdf
http://slidepdf.com/reader/full/natenberg-weithers-rmc-2010-notespdf 11/50
Actual Volatility Smile in IBM

7/27/2019 Natenberg _ Weithers RMC 2010 notes.pdf
http://slidepdf.com/reader/full/natenberg-weithers-rmc-2010-notespdf 12/50
Option Trader’s View of SkewWhy is there “skew”?
Demand and Supply
The world is “long stock”
so the world wants protection (buys OTM Puts)
and the world attempts to outperform the
competition (sells OTM Calls – yield enhancement,
an income strategy)
and sometimes does both simultaneously (Collars)

7/27/2019 Natenberg _ Weithers RMC 2010 notes.pdf
http://slidepdf.com/reader/full/natenberg-weithers-rmc-2010-notespdf 13/50
As a result of buying OTM Puts
and selling OTM Calls , . . .
25%
Low X High XATM
Implied
Volatility

7/27/2019 Natenberg _ Weithers RMC 2010 notes.pdf
http://slidepdf.com/reader/full/natenberg-weithers-rmc-2010-notespdf 14/50
The Market Is Not StupidThe market remembers:
Stocks tend to fall faster than they rise.
(This is an empirical statement.)
Even if this isn’t true (but people believe it), explains
the interest in purchasing Puts (relative to Calls).
Puts over Calls
(holding something constant: 20% OTM, 10Δ,…)

7/27/2019 Natenberg _ Weithers RMC 2010 notes.pdf
http://slidepdf.com/reader/full/natenberg-weithers-rmc-2010-notespdf 15/50
Why is there an Equity Skew?
(Low-Strike) Puts [Protective Put Strategy] are bid.
(High-Strike) Calls [Covered Calls, Over-Writes,
Buy-Writes Strategy] are offered.
Just the result of people buying and selling options.
What about other product areas?
Is the world long Yen?

7/27/2019 Natenberg _ Weithers RMC 2010 notes.pdf
http://slidepdf.com/reader/full/natenberg-weithers-rmc-2010-notespdf 16/50
Different Skews for Different Products
Equity Skews typically have negative slope:
Investment Skew
Commodities (which “crash” up) have positive skews:
Demand Skew
Foreign Exchange has a more symmetric skew:
Balanced Skew
σ
X
σ
X
σ
X

7/27/2019 Natenberg _ Weithers RMC 2010 notes.pdf
http://slidepdf.com/reader/full/natenberg-weithers-rmc-2010-notespdf 17/50
Actual Volatility Smiles in Commodities
Soybeans Coffee
Sugar Orange Juice

7/27/2019 Natenberg _ Weithers RMC 2010 notes.pdf
http://slidepdf.com/reader/full/natenberg-weithers-rmc-2010-notespdf 18/50
Actual Volatility Smile in FX (USD|JPY)
7/27/2019 Natenberg _ Weithers RMC 2010 notes.pdf
http://slidepdf.com/reader/full/natenberg-weithers-rmc-2010-notespdf 19/50
Skew: What is it?
“Skew” means different things to different people:
To a Financial Engineer:
the market phenomenon which results from using
a model which, like all models, is not correct.
In other words, the model assumes a probability
distribution (more precisely, a probability densityfunction) for the future price distribution of theunderlying (lognormal) – which is “wrong”!
7/27/2019 Natenberg _ Weithers RMC 2010 notes.pdf
http://slidepdf.com/reader/full/natenberg-weithers-rmc-2010-notespdf 20/50
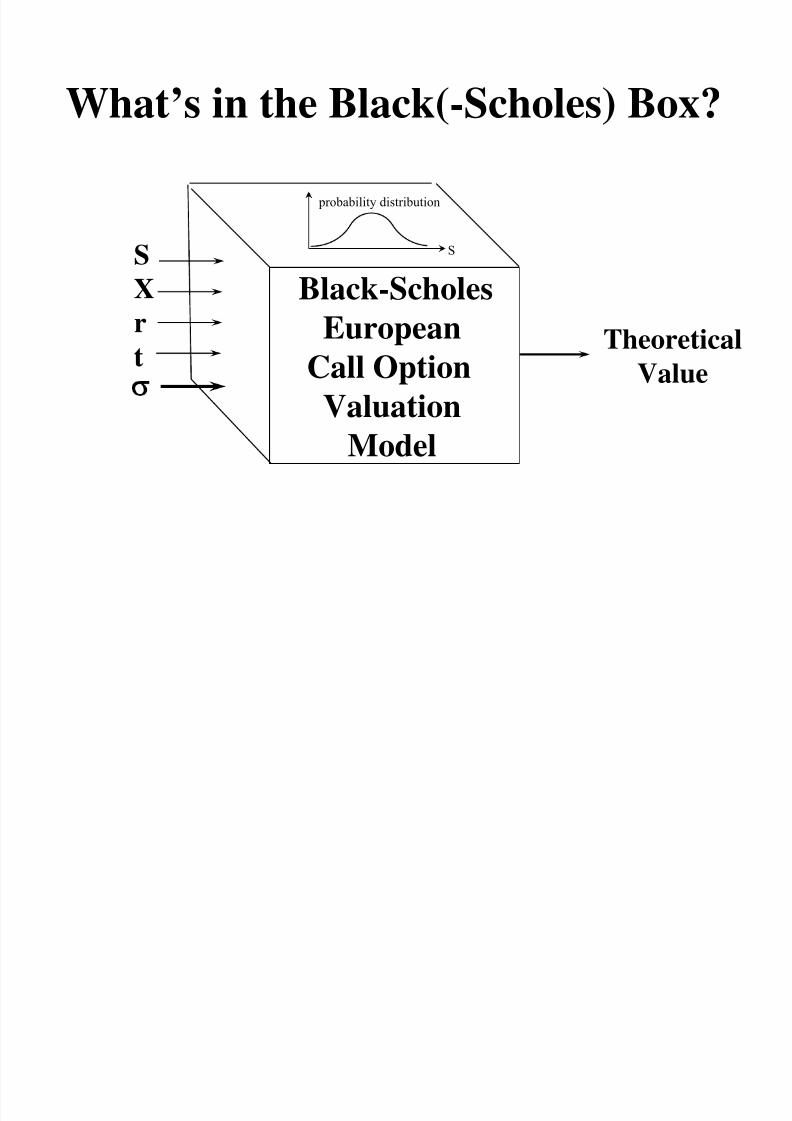
What’s in the Black(-Scholes) Box?
σ
Black-Scholes
European
Call Option
ValuationModel
Theoretical
Value
S
X
r
t
S
probability distribution

7/27/2019 Natenberg _ Weithers RMC 2010 notes.pdf
http://slidepdf.com/reader/full/natenberg-weithers-rmc-2010-notespdf 21/50
Baseline Distribution

7/27/2019 Natenberg _ Weithers RMC 2010 notes.pdf
http://slidepdf.com/reader/full/natenberg-weithers-rmc-2010-notespdf 22/50
Kurtosis

7/27/2019 Natenberg _ Weithers RMC 2010 notes.pdf
http://slidepdf.com/reader/full/natenberg-weithers-rmc-2010-notespdf 23/50
Skew
SPX Daily Price Changes: January 2000 - January 2010

7/27/2019 Natenberg _ Weithers RMC 2010 notes.pdf
http://slidepdf.com/reader/full/natenberg-weithers-rmc-2010-notespdf 24/50
SPX Daily Price Changes: January 2000 January 2010
0
50
100
150
200
250
300
350
-10% -8% -6% -4% -2% 0% 2% 4% 6% 8% 10% 12%
daily price change (nearest 1/4 percent)
n u m b e r
o f o c c u r r e n c e s
number of days: 2526
biggest up move: +11.58% (13 October 2008)
biggest down move: -9.03% (15 October 2008)
mean: +.0002%
standard deviation: 1.40%
volatility: 22.30%
skewness: +.0995kurtosis: +7.8376
7/27/2019 Natenberg _ Weithers RMC 2010 notes.pdf
http://slidepdf.com/reader/full/natenberg-weithers-rmc-2010-notespdf 25/50
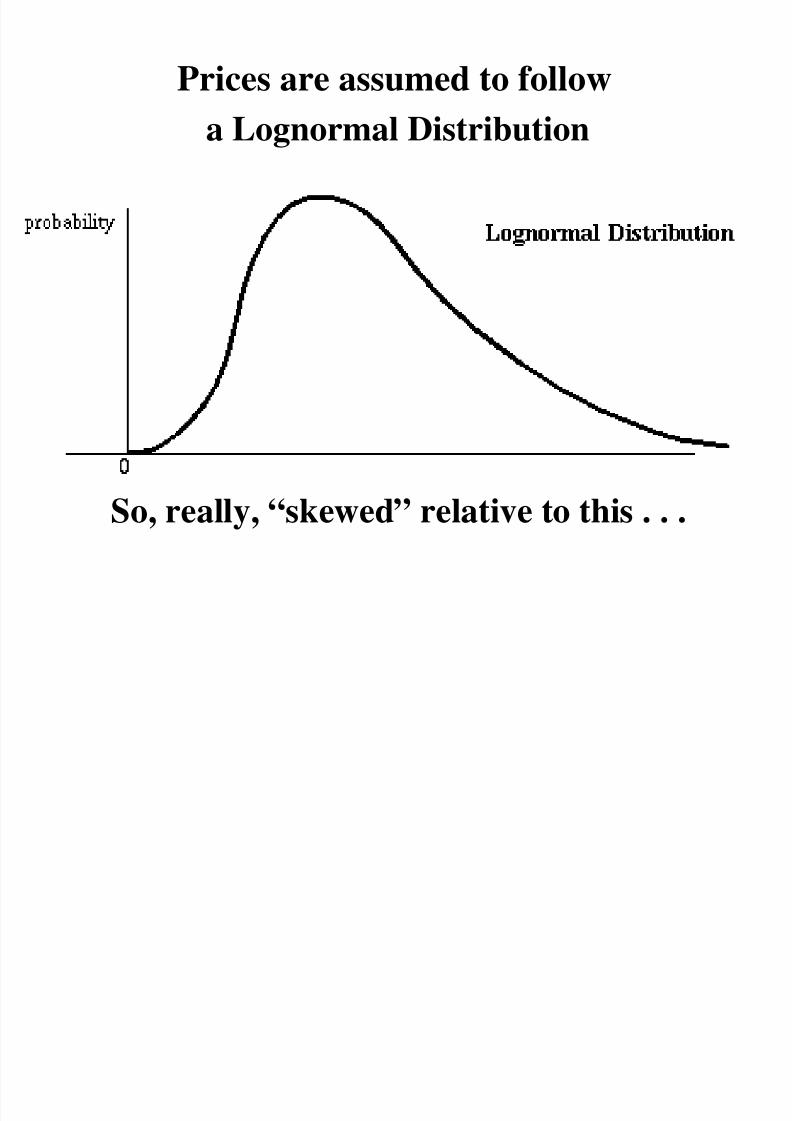
Prices are assumed to follow
a Lognormal Distribution
So, really, “skewed” relative to this . . .

7/27/2019 Natenberg _ Weithers RMC 2010 notes.pdf
http://slidepdf.com/reader/full/natenberg-weithers-rmc-2010-notespdf 26/50
Skew: What is it?
“Skew” means different things to different people:
To a Risk Manager:
the relationship between movements in the
underlying asset price and implied volatilitiesWhat will happen to implied volatility as the underlying
price goes down or goes up (and possibly goes down
or up slowly versus goes down or up quickly)?
Market implied volatility is a function of spot price:σ
(S)

7/27/2019 Natenberg _ Weithers RMC 2010 notes.pdf
http://slidepdf.com/reader/full/natenberg-weithers-rmc-2010-notespdf 27/50
Modelling the Skew: What Do You Believe?
Skew is “real” in that it impacts your mark-to-market.
What this means is that in order to “risk manage”a portfolio containing options, you have totake the skew into account . . . and, ultimately,
to be systematic, consistent, robust, . . .you will want to formally “model the skew.”
Volatility by Moneyness (ATM, 10% OTM vol constant)Volatility by Strike (Sticky Strike: vol by strike constant)
Volatility by Delta (Sticky Delta: vol by Delta constant)

7/27/2019 Natenberg _ Weithers RMC 2010 notes.pdf
http://slidepdf.com/reader/full/natenberg-weithers-rmc-2010-notespdf 28/50
And How Do You Manage It?
You can’t just ignore skew; you have to “model” it.
Skew can and will change.
Based on your view on skew,some trades may look attractive
(or more attractive than others).
Shelly: How to model skew?
What is a skew trade?

7/27/2019 Natenberg _ Weithers RMC 2010 notes.pdf
http://slidepdf.com/reader/full/natenberg-weithers-rmc-2010-notespdf 29/50
i m p l i e d v o l a t i l i t
y
exercise price
We need a method of describing
the shape of the skew.
f(x)

7/27/2019 Natenberg _ Weithers RMC 2010 notes.pdf
http://slidepdf.com/reader/full/natenberg-weithers-rmc-2010-notespdf 30/50
In order to model option values and
determine the risk of a position we
need to know how changes in market
conditions will affect…
the location of the skew
the shape of the skew
h ill h i h d l i i

7/27/2019 Natenberg _ Weithers RMC 2010 notes.pdf
http://slidepdf.com/reader/full/natenberg-weithers-rmc-2010-notespdf 31/50
i m p l i e d v o l a t i l i t y
90 exercise price
underlying
price
100 120
What will happen if the underlying price
changes?
105
Will the implied volatility at
at each exercise price remain unchanged?
sticky strike
Wh ill h if h d l i i

7/27/2019 Natenberg _ Weithers RMC 2010 notes.pdf
http://slidepdf.com/reader/full/natenberg-weithers-rmc-2010-notespdf 32/50
i m p l i e d v o l a t i l i t y
90 120
What will happen if the underlying price
changes?
underlying
price
105
Will the implied volatility at
at each exercise price remain unchanged?
sticky strike floating skew
Wh ill h if i li d

7/27/2019 Natenberg _ Weithers RMC 2010 notes.pdf
http://slidepdf.com/reader/full/natenberg-weithers-rmc-2010-notespdf 33/50
100
i m p l i e d v o l a t i l i t y
90
underlying
price
120
What will happen if implied
volatility changes?
floating skew

7/27/2019 Natenberg _ Weithers RMC 2010 notes.pdf
http://slidepdf.com/reader/full/natenberg-weithers-rmc-2010-notespdf 34/50

7/27/2019 Natenberg _ Weithers RMC 2010 notes.pdf
http://slidepdf.com/reader/full/natenberg-weithers-rmc-2010-notespdf 35/50
190
i m p l i e d v o l a t i l i t y
underlying
price
200180
What will happen if the
underlying price doubles?
210 220

7/27/2019 Natenberg _ Weithers RMC 2010 notes.pdf
http://slidepdf.com/reader/full/natenberg-weithers-rmc-2010-notespdf 36/50
ln (X / S)
i m p l i e d v o l a t i l i t y
underlying
price
What will happen if the
underlying price doubles?
How will the passage of time
7/27/2019 Natenberg _ Weithers RMC 2010 notes.pdf
http://slidepdf.com/reader/full/natenberg-weithers-rmc-2010-notespdf 37/50
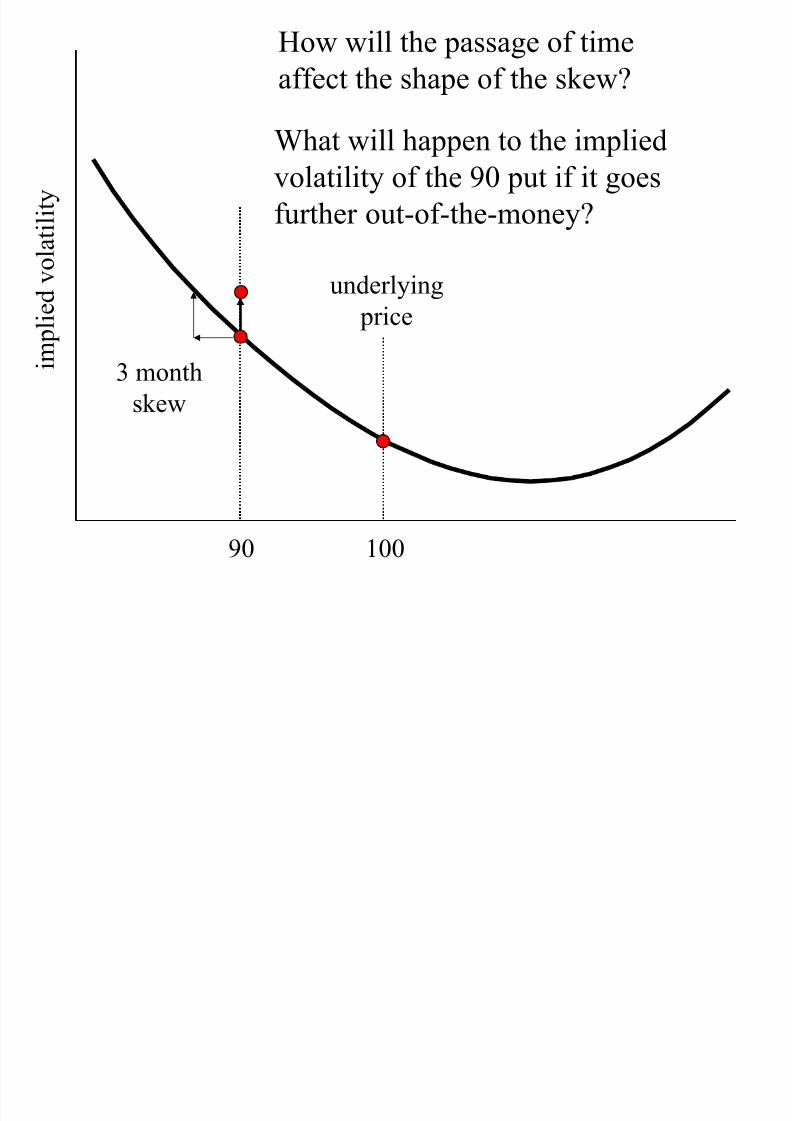
90
i m p l i e d v o l a t i l i t y
3 month
skew
100
underlying
price
What will happen to the implied
volatility of the 90 put if it goes
further out-of-the-money?
How will the passage of time
affect the shape of the skew?
How will the passage of time

7/27/2019 Natenberg _ Weithers RMC 2010 notes.pdf
http://slidepdf.com/reader/full/natenberg-weithers-rmc-2010-notespdf 38/50
90
i m p l i e d v o l a t i l i t y
3 month
skew
100
underlying
price
p g
affect the shape of the skew?
Is the 90 put further out-of-the-money
with three months to expiration or
one month to expiration?
1 monthskew
How will the passage of time

7/27/2019 Natenberg _ Weithers RMC 2010 notes.pdf
http://slidepdf.com/reader/full/natenberg-weithers-rmc-2010-notespdf 39/50
i m p l i e d v o l a t i l i
t y
exercise price
less time
to expiration
more time
to expiration
p g
affect the shape of the skew?
How will the passage of time

7/27/2019 Natenberg _ Weithers RMC 2010 notes.pdf
http://slidepdf.com/reader/full/natenberg-weithers-rmc-2010-notespdf 40/50
ln (X / S) / sqrt (t)
i m p l i e d v o l a t i l i
t y
less time
to expiration
more time
to expiration
p g
affect the shape of the skew?
55%
SPX Implied Volatility Skews – 29 January 2010

7/27/2019 Natenberg _ Weithers RMC 2010 notes.pdf
http://slidepdf.com/reader/full/natenberg-weithers-rmc-2010-notespdf 41/50
10%
15%
20%
25%
30%
35%
40%
45%
50%
55%
500 600 700 800 900 1000 1100 1200 1300 1400 1500
exercise price
i m
p l i e d v o l a t i l i t y
Feb
Mar
Jun
Dec
50%
SPX Implied Volatility Skews – 29 January 2010

7/27/2019 Natenberg _ Weithers RMC 2010 notes.pdf
http://slidepdf.com/reader/full/natenberg-weithers-rmc-2010-notespdf 42/50
10%
15%
20%
25%
30%
35%
40%
45%
-1.3 -1.2 -1.1 -1 -0.9 -0.8 -0.7 -0.6 -0.5 -0.4 -0.3 -0.2 -0.1 0 0.1 0.2 0.3 0.4 0.5
ln(X/S)/sqrt(t)
i m
p l i e d v o l a t i l i t y
Feb
Mar
Jun
Dec

7/27/2019 Natenberg _ Weithers RMC 2010 notes.pdf
http://slidepdf.com/reader/full/natenberg-weithers-rmc-2010-notespdf 43/50
i m
p l i e d v o l a t i l i t y
new implied
volatility
current implied
volatility
exercise price exercise price
How do changes in the
skew affect the “Greeks”?
The underlying price
moves up.
underlying price = 100.00

7/27/2019 Natenberg _ Weithers RMC 2010 notes.pdf
http://slidepdf.com/reader/full/natenberg-weithers-rmc-2010-notespdf 44/50
implied volatility = 26.0%95 put = 2.00
u de y g p ce 00.00
implied delta = -25
underlying price rises to 10195 put ≈ 2.00 - (.25 x 1.00) = 1.75
shifted implied volatility = 27.0%vega of 95 put = .07
95 put≈
1.75 + (1 x .07) = 1.82delta of 95 put = (1.82 - 2.00) / (101 - 100) = -.18
adjusted or skewed delta = -18
underlying price = 100.00

7/27/2019 Natenberg _ Weithers RMC 2010 notes.pdf
http://slidepdf.com/reader/full/natenberg-weithers-rmc-2010-notespdf 45/50
implied volatility = 21%105 call = 2.30
implied delta = 17
underlying price rises to 101105 call ≈ 2.30 + (.17 x 1.00) = 2.47
shifted implied volatility = 20.5%vega of 105 call = .16
105 call≈
2.47 - (.5 x .16) = 2.39delta of 105 call = (2.39 - 2.30) / (101 - 100) = .09
adjusted or skewed delta = 9
y g p

7/27/2019 Natenberg _ Weithers RMC 2010 notes.pdf
http://slidepdf.com/reader/full/natenberg-weithers-rmc-2010-notespdf 46/50
i m
p l i e d v o l a t i l i t y
current implied
volatility
exercise price
How do changes in the
skew affect the “Greeks”?
Time passesnew implied
volatility
underlying price = 100.00

7/27/2019 Natenberg _ Weithers RMC 2010 notes.pdf
http://slidepdf.com/reader/full/natenberg-weithers-rmc-2010-notespdf 47/50
implied volatility = 26.0%95 put = 2.00
y g p
implied theta = -.08
One day passes95 put ≈ 2.00 - .08 = 1.92
shifted implied volatility = 26.3%vega of 95 put = .07
95 put = 1.92 + (.3 x .07)≈
1.94theta of 95 put = (1.94 - 2.00) = -.06
adjusted or skewed theta = -.06
Theoretical Pricing Model

7/27/2019 Natenberg _ Weithers RMC 2010 notes.pdf
http://slidepdf.com/reader/full/natenberg-weithers-rmc-2010-notespdf 48/50
Theoretical Pricing Model
Exercise Price
Time to Expiration
Underlying Price
Interest Rate
Volatility
Skew
theta
delta
rho
gamma / vega
skew sensitivity
f(x) f(a,b,…,x)
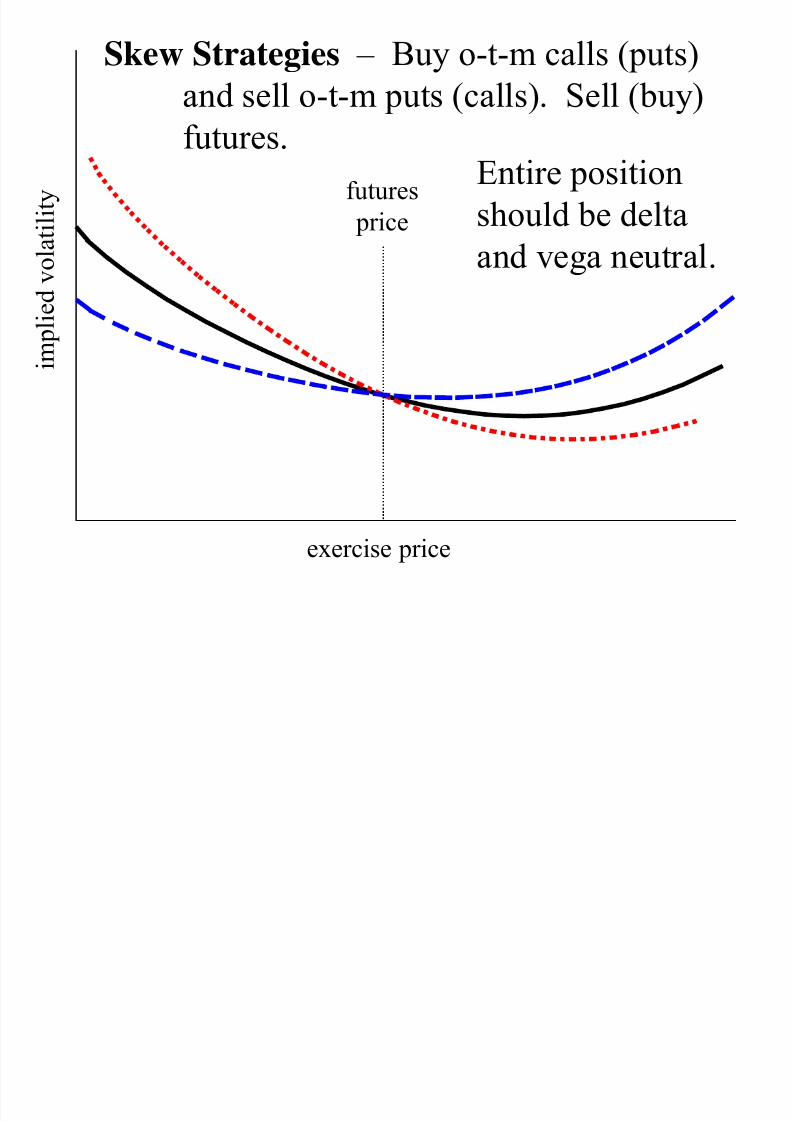
Skew Strategies – Buy o-t-m calls (puts)
7/27/2019 Natenberg _ Weithers RMC 2010 notes.pdf
http://slidepdf.com/reader/full/natenberg-weithers-rmc-2010-notespdf 49/50
g
i m p l i
e d v o l a t i l i t y
exercise price
futures
price
y (p )
and sell o-t-m puts (calls). Sell (buy)
futures.Entire position
should be deltaand vega neutral.
Kurtosis Strategies – Buy (sell) o-t-m calls

7/27/2019 Natenberg _ Weithers RMC 2010 notes.pdf
http://slidepdf.com/reader/full/natenberg-weithers-rmc-2010-notespdf 50/50
i m p l i
e d v o l a t i l i t y
exercise price
futures
price
g y ( )
and puts. Sell (buy) a-t-m calls and puts.
Entire position
should be deltaand vega neutral.


