

SOEPpaperson Multidisciplinary Panel Data Research
Natural Disaster, Policy Action, and Mental Well-Being: The Case of Fukushima
Jan Goebel, Christian Krekel, Tim Tiefenbach, Nicolas R. Ziebarth
599 201
3SOEP — The German Socio-Economic Panel Study at DIW Berlin 599-2013

SOEPpapers on Multidisciplinary Panel Data Research at DIW Berlin This series presents research findings based either directly on data from the German Socio-Economic Panel Study (SOEP) or using SOEP data as part of an internationally comparable data set (e.g. CNEF, ECHP, LIS, LWS, CHER/PACO). SOEP is a truly multidisciplinary household panel study covering a wide range of social and behavioral sciences: economics, sociology, psychology, survey methodology, econometrics and applied statistics, educational science, political science, public health, behavioral genetics, demography, geography, and sport science. The decision to publish a submission in SOEPpapers is made by a board of editors chosen by the DIW Berlin to represent the wide range of disciplines covered by SOEP. There is no external referee process and papers are either accepted or rejected without revision. Papers appear in this series as works in progress and may also appear elsewhere. They often represent preliminary studies and are circulated to encourage discussion. Citation of such a paper should account for its provisional character. A revised version may be requested from the author directly. Any opinions expressed in this series are those of the author(s) and not those of DIW Berlin. Research disseminated by DIW Berlin may include views on public policy issues, but the institute itself takes no institutional policy positions. The SOEPpapers are available at http://www.diw.de/soeppapers Editors: Jürgen Schupp (Sociology) Gert G. Wagner (Social Sciences, Vice Dean DIW Graduate Center) Conchita D’Ambrosio (Public Economics) Denis Gerstorf (Psychology, DIW Research Director) Elke Holst (Gender Studies, DIW Research Director) Frauke Kreuter (Survey Methodology, DIW Research Professor) Martin Kroh (Political Science and Survey Methodology) Frieder R. Lang (Psychology, DIW Research Professor) Henning Lohmann (Sociology, DIW Research Professor) Jörg-Peter Schräpler (Survey Methodology, DIW Research Professor) Thomas Siedler (Empirical Economics) C. Katharina Spieß (Empirical Economics and Educational Science)
ISSN: 1864-6689 (online)
German Socio-Economic Panel Study (SOEP) DIW Berlin Mohrenstrasse 58 10117 Berlin, Germany Contact: Uta Rahmann | [email protected]

1
Natural Disaster, Policy Action, and Mental Well‐Being: The Case of Fukushima
Jan Goebel** Christian Krekel*** Tim Tiefenbach**** Nicolas R. Ziebarth*****
July 2013
Abstract
We study the impact of the Fukushima disaster on people’s mental well‐being in another industrialized country, more than 5000 miles distant. The meltdown significantly increased environmental concerns by 20% among the German population. Subsequent drastic policy action permanently shut down the oldest nuclear reactors, implemented the phase‐out of the remaining ones, and proclaimed the transition to renewables. This energy policy turnaround is largely supported by the population and equalized the increase in mental distress. We estimate that during the 3 months after the meltdown, Fukushima triggered external monetized health costs worth €250 per distressed citizen—particularly among risk averse women.
Keywords: Fukushima, meltdown, nuclear phase‐out, mental health, environmental worries, SOEP
JEL codes: I18, I31, Z13, Q54
*We thank Silke Anger, Peter Eibich, Ronny Freier, Jan Marcus, Jürgen Schupp, Gert G. Wagner, Michael Weinhardt
and participants at the Cluster Seminar at DIW Berlin. A special thank goes to Adam Lederer for co‐editing this
paper. We take responsibility for all remaining errors in and shortcomings of the article.
**DIW Berlin (German Institute for Economic Research), Mohrenstrasse 58, 10117 Berlin, Germany, e‐mail: [email protected], ***DIW Berlin (German Institute for Economic Research), Graduate Center of Economic and Social Research, Mohrenstrasse 58, 10117 Berlin, Germany, e‐mail: [email protected] *****German Institute for Japanese Studies Tokyo (DIJ), Jochi Kioizaka Bldg, 2F, 7‐1 Kioicho, Chiyoda‐ku, Tokyo 102‐0094, Japan, e‐mail: [email protected] *****Corresponding author: Cornell University, Policy Analysis and Management (PAM), 106 Martha van Rensselaer Hall, Ithaca, NY 14853, DIW Berlin, and IZA Bonn, e‐mail: [email protected], Phone: +1‐(607) 255‐1180, Fax: +1‐(607) 255‐4071.

2
1. Introduction
Seemingly the worst‐case scenario, on March 11, 2011, a natural disaster triggered one of
the worst nuclear catastrophes in human history: the Fukushima Daiichi Nuclear Disaster. At
about 3pm JST, the Tohoku earthquake, magnitude 9.0, struck off the cost of Japan at an
underwater depth of about 30km (19mi). Never before had such a powerful earthquake hit
Japan. It triggered a gigantic tsunami with waves up to 40m (133ft). The tsunami’s dimensions
by far exceeded the safety measures of the Fukushima nuclear power plant whose 5.7m (19ft)
seawalls where easily topped by the up to 15m (49ft) high waves hitting the plant. Although the
safety measures met regulatory requirements, in total three of the six reactors fully melted
down, leading to the release of radioactive material.
In the subsequent days, the dimension of the catastrophe became apparent. Within two
days, up to 200,000 people were evacuated, an estimated 4.5 million were without electricity,
and 1.5 million without water. In September 2011, the Japanese Policy Agency concluded that
the entire disaster, inclusive of earthquake, tsunami, and nuclear meltdown, resulted in 16,000
deaths, thousands of injured or missing people, and 400,000 collapsed or partially collapsed
buildings (INPO, 2011). However, to date, no short‐term physical health damages from
radioactive radiation have been observed (WHO, 2013).
As a first main contribution, this paper estimates the impact of the Fukushima catastrophe
on people’s mental well‐being in another industrialized country more than 5000 miles away.
We find that concerns about environmental protection significantly increased among the
German population in the weeks after the meltdown. This finding demonstrates that disasters
not only have local impacts, but can also have negative external effects in other countries, even
if the country is presumably unaffected and far away. Metcalfe et al. (2011) show that this was
true for people living in the UK after the 9/11 terrorist attacks. This paper shows that these
global negative external effects may even exist when a disaster in country A objectively does
not increase the risk of a similar disaster in country B, which is the case for nuclear meltdowns
triggered by tsunamis.

3
Germany is a particularly interesting country to study in this context since the meltdown led
the conservative government, under the leadership of Chancellor Angela Merkel, to make a
sharp U‐turn in their energy policy. Fukushima “made [Angela Merkel] change her mind about
the risks of nuclear energy” (Bundesregierung, 2011a). In consensus with the liberal opposition,
the oldest German reactors were temporarily shut down—despite their reputation of being
among the safest reactors worldwide and despite the marginal tsunami risk in Germany. On
June 30, 2011, the German parliament (“Bundestag”) passed a law that permanently shut down
these 7 reactors. In addition, it implemented the staggered nuclear phase‐out of the remaining
reactors. This law will lead to a complete shut‐down of all German reactors by 2022. The
German Nuclear Phase Out (“Atomausstieg”) is globally unique. It represents a direct and
immediate response to the unexpected and exogenous Fukushima catastrophe.
Thus, as a second main contribution, this paper shows how policymakers can alleviate, even
reverse, mental concerns in the population through immediate policy action. A representative
survey conducted on March 14 2011, revealed that 70% of all German citizens believed that a
nuclear catastrophe similar to Fukushima could also happen in Germany. Accordingly, 71%
were in favor of a complete nuclear phase‐out, up from 62% in August 2010 (Infratest, 2010,
2011a). In line with these survey data, after the passing of the Nuclear Phase‐Out Bill, we find
that worries about environmental protection significantly decreased—by approximately the
same share that they had increased after Fukushima. Again, representative survey data from
June 2011 underlines these findings and shows that 54% of all Germans agree with the specific
phase‐out bill and also the quick political decision process (Infratest, 2011c). Subsequent to the
implementation of the Atomausstieg, we do not find any significant long‐term effects of
Fukushima on well‐being measures.
This paper contributes to the overall literature on mental well‐being (Frank, 1981; Oswald,
1997; Winkelmann and Winkelmann, 1998; Frijters et al. 2004; Frank and Koss, 2005; Frey et al.
2007; Senik, 2009; Kassenboehmer and Haisken‐DeNew, 2009; Lu et al., 2009; Glied and Frank,
2009; Clark et al., 2008, 2009, 2010; Ojeda et al., 2010; Luechinger et al., 2010; Knabe et al.,
2010; Clark and Senik, 2010; Clark and Etilé, 2011; Cahit et al., 2011; Oswald and Wu, 2011;

4
Deaton, 2012; Marcus, 2013). More specifically, it contributes to the literature that studies the
(mental health) effects of terrorism and natural disasters (Luechinger and Raschky, 2009;
Berger, 2010; Draca et al. 2011; Danzer and Danzer, 2011; Metcalfe et al., 2011; Schüller, 2012).
Since Fukushima, several papers have discussed the causes and consequences of the
catastrophe – however, the large majority focus on Japan (Glaser, 2011; Hippel, 2011;
Hommerich, 2012; Huenteler et al. 2012; Ishino et al. 2012; Kawashima and Takeda, 2012;
Thomas, 2012; Uchida et al., 2011; Vivoda, 2012; Yamamura, 2012; Aoki and Rothwell, 2013;
Csereklyei, 2013; Buesseler et al. 2013; Rieu, 2013; Rehdanz et al. 2013; Tiefenbach and
Kohlbacher, 2013; Wang et al., 2013).
The next section briefly describes the events around The Fukushima Disaster and the
political reactions in Germany. Section 3 describes the data, whilst Section 4 presents and
discusses our findings. Section 5 concludes.
2. Background
2.1 The Fukushima Daiichi Nuclear Disaster
On March 11, 2011, at 2:46pm local time, a giant earthquake shook the ocean bed about 72
kilometres off the Japanese east coast. Measuring 9.0 on the Richter scale, this earthquake was
the largest in Japan since the beginning of record keeping, even shaking skyscrapers in 370 km
(230mi) distant Tokyo. It triggered a giant tsunami with waves reaching up to 40m (133ft). The
waves hit the Japanese coast line just 30 minutes thereafter, wiping out cities, villages, and
property up to 10km (6.4mi) inland. The receding waters left behind massive destruction, killing
16,000 people (Stern, 2011; Zeit, 2011; INPO, 2011).
The Fukushima Daiichi nuclear power plant is located just 163km (101.5mi) southwest of
the epicentre of the earthquake. Shortly after the earthquake, the plant lost its electricity
supply and switched to emergency power supply through its diesel generators in order to
enable the emergency cooling of the three, out of six, reactors that were in operation at that
time, all of which were immediately scrammed. However, even after being scrammed, reactors

5
require constant cooling, sometimes for days, in order to keep down their decay heat. When
the tsunami flood waves hit the plant, with barriers for flood waves up to 5.7m (19ft), the diesel
generators were destroyed and the emergency cooling failed. The consequences were severe.
Without constant cooling, the fuel rods of the three reactors that were in operation overheated
and slowly began to melt. The vaporising water created immense pressure within the reactor
vessels, essentially turning them into giant steam cookers. To counteract, the operator was
given the permission to release radioactive steam from the reactors into the surrounding and to
feed sea water through the reactor cores (Spiegel, 2011). The traces of radioactive iodine were
later found in food and drinking water, even in distant Tokyo, which resulted in a ban on food
from certain regions that were considered to be contaminated. Ultimately, however, the
countermeasures proved to be ineffective. Hydrogen explosions destroyed the containments of
the three reactors that were in operation, damaging the reactor vessels and leaking radioactive
particles into the environment (IAEA, 2011a). Everybody within a radius of 10km (6.4mi) around
the plant was evacuated immediately on March 11, 2011; it was later extended, creating a
20km (12.8mi) radius permanent exclusion zone.
The Fukushima meltdown was the second largest accident in the history of the peaceful use
of nuclear power to date. It was classified 7 on the International Nuclear and Radiological Event
Scale (INES) of the International Atomic Energy Agency (IAEA), meaning that there was a major
release of radioactive material with widespread health and environmental effects that requires
implementation of planned and extended countermeasures (IAEA, 2011b). The scope of the
disaster was exceeded only by the 1986 Chernobyl meltdown, which released even more
radioactive material into the environment.
2.2 The Political Reactions in Germany: “Atomausstieg” and “Energiewende”
Shortly after the Fukushima meltdown, on March 14, 2011, a safety assessment of all 17
remaining operational nuclear power plants in Germany was announced by the government,
including a temporary shutdown of the 7 oldest plants.1 This policy reaction has become known
1 At that time, the “Krümmel” nuclear power plant was already off grid due to technical problems.
6
as the “Atom‐Moratorium” (Bundesregierung, 2011b). The safety assessment was conducted by
the Reactor Safety Commission (“Reaktorsicherheitskommission”). At the same time, an ethics
commission (“Ethikkommission für eine sichere Energieversorgung”) was appointed to discuss
the future of nuclear power in Germany in a broader societal context.
The safety assessment concluded that the 17 remaining operational nuclear power plants in
Germany were at least as safe as Fukushima Daiichi and that it was virtually impossible for the
accident scenario to occur in Germany. However, it also suggested certain improvements, in
particular for older plants, be made. The ethics commission, on the contrary, unequivocally
recommended exciting nuclear power within a decade (Reaktorsicherheitskommission, 2011;
Ethikkommission für eine sichere Energieversorgung, 2011).
Following the recommendation of the ethics commissions and taking into account the final
report of the Reactor Safety Commission, on May 30, 2011, the government announced that it
would introduce a Nuclear Phase Out Bill (“13. Gesetz zur Änderung des Atomgesetzes”), which
provides for the permanent shutdown of the oldest 7 nuclear power plants in Germany and a
reversal of the lifetime extension for the remainder (Bundesregierung, 2011c).
The reversal of the lifetime extension takes back a lifetime extension of 7 years for older
and 14 years for newer nuclear power plants in Germany. This extension was initially granted
on September 5, 2010, just shortly after the federal elections, which were won by the current
conservative government, consisting of a coalition between Christian‐Democrats (CDU) and
Free Market Liberals (FDP).
The new bill imposes a fixed date for a nuclear phase‐out for the first time in history. This
policy reaction has become known as the German Nuclear Phase Out (“Atomausstieg”). Still,
the decision to amend the law was largely perceived as a campaign move, influenced by the
upcoming elections in several German federal states.
The new bill passed the Bundestag on June 30, 2011, and the Federal Council of Germany
shortly thereafter, on July 8, 2011. It became effective, alongside a number of other bills that

7
promote a change in energy sources from fossils to renewables (“Energiewende”), on August 6,
2011 (Bundesregierung, 2011d; Bundesregierung, 2011e).
3. Data
3.1. Dataset
We make use of individual‐level data provided by the German Socio‐Economic Panel Study
(SOEP v28). The SOEP is a representative panel study of private households. Interviews have
been carried out annually since 1984. All respondents aged 17 and older answer one main
individual questionnaire, covering about 150 questions on different topics such as the labor
market and family situation, worries, attitudes and perceptions as well as health. Additionally, a
household questionnaire is completed by the head of the household. About 20,000 individuals
from more than 10,000 households are surveyed each year. For further details, see Wagner,
Frick and Schupp (2007).
For our main analyses and our preferred specifications, we exploit the panel dimension of
the SOEP and focus on respondents who were interviewed in both 2010 and 2011. In total, we
obtain 26,547 person‐year observations from 16,460 different individuals of which 10,087 were
interviewed in both years and have no missings on their observables. In 2011, roughly half of
those 10,087 individuals were interviewed before and after the Fukushima catastrophe,
respectively.
For extended analyses and to measure long‐term effects, we use SOEP waves Z (2009) to BC
(2012) and 58,039 person‐year observations.
3.2. Dependent Variables on Aspects of Mental Well‐Being
We exploit several well‐being measures that are routinely surveyed by the SOEP. Our
first and main dependent variable is based on the question: “What is your attitude toward
environmental protection? Are you concerned about it? (a) very concerned, (b) somewhat
concerned, (c) not concerned at all.”
8
We collapsed the answers to this questions into a binary measure, EnvWorriesLarge,
indicating the share of people who are “very concerned” about environmental protection. As
seen in the Appendix, on average, 28.6% of all respondents are “very concerned” about
environmental protection.
Analogously, we generate binary variables measuring the share of respondents who are
“very concerned” about climate change. Roughly 30% of all Germans are (see Appendix A).
In addition to these distress measures, we exploit the standard 11 categorical life
satisfaction measure. This measure has its mass point between values 5 and 9; 86% of all
respondents fall into these categories.
The SOEP also measures affective well‐being and asks respondents to rate how often they
felt happy or sad during the 4 weeks prior to the interview. Five answer categories range from
“very seldom” to “very often.” We collapse the two highest categories “often” and “very often”
and generate 3 dichotomous variables accordingly. Appendix A shows that, interestingly, (only)
a fifth of all Germans is “often” or “very often” happy while 45% are “often” or “very often”
sad.
Finally, we exploit the continuous physical and the mental health summary scales of the
SF12, a quasi‐objective health measure included in the 2010 and 2012 SOEP waves (Andersen
et al., 2007; Frick and Ziebarth, 2013).
The descriptive statistics for all dependent variables are in the Appendix. Note that these
well‐being measures represent contemporaneous measures—except for the general well‐being
measure, which asks about life satisfaction in general.
3.3. Covariates
The demographic factors that we use are age, age squared, a female gender dummy, a
dummy for being married, single, and disabled, respectively. In addition, we include a dummy
indicating those without German nationality. The Appendix shows that the average age is about

9
51 years and that slightly more than 50% are female. Two thirds of all respondents are married
and 5% are not German.
In terms of education and labor market characteristics, we control for the school degree as
well as whether respondents are full‐time employed (38%), part‐time employed (12%), out of
the labor force (43%), on maternity leave (2%) or unemployed (5%).
For extended heterogeneity analyses, as shown in Panel C of the Appendix, we make use of
people’s political opinions and self‐rated risk aversion. The dummy RedGreen indicates that
respondents strongly lean toward either the Green party or the Social Democrats, both of
which were in the opposition at the time of the disaster. Both parties were strongly in favor of a
complete nuclear phase‐out. 20% of all respondents self‐identify as strong supporter of one of
those parties.
RiskAverse indicates risk aversion and is the collapsed version of the 11 categorical risk
aversion measures (Dohmen et al. 2010), whereby we define categories 4 to 1 as risk averse.
According to this definition, 50% of all Germans are risk averse.
[Insert Figure 1 about here]
Finally, by using geo coordinates at the street block level, we exploit the distance from
respondents’ place of residences to the nearest nuclear power plant to exploit additional
variation and additionally stratify on this variable. Figure 1 shows different radii around the
German power plants. We generate a dummy variable that indicates whether respondents live
within 50km (31mi) distance to a nuclear power plant (second circle in Figure 1). Almost 30% of
all Germans live within 50km (31mi) a nuclear power plant.2 Moreover, in robustness checks to
take potential regional sorting into account, we also exploit the distance of the respondents’
place of birth to the next nuclear power plant.
2 Traditionally, (intergenerational) geographic mobility is very low in Germany. In a given year, in the final sample,
only about 1% of all SOEP respondents move.

10
4. Empirical Method and Results
4.1. Empirical Approach and Identification
We run the following econometric model. To the extent that we use binary dependent
variables, we run Linear Probability Models (LPM):
0 1 ,2011 2 ,2011
3 ,2011 4 ,2011
11 2011 30 2011
11 30 '
it i t i t
i i it t m i it
y PostMarch PostJune
PostMarch PostJune
(1)
where ity is a dependent variable that measures the individual’s mental well‐being.
2011,11iPostMarch is a dummy variable indicating whether a respondent’s 2011 interview
occurred before or March 11—the day of the Fukushima catastrophe. Note that this dummy is
time invariant, i.e., all 2011 respondents who were interviewed after March 11 always have a
one on this dummy, independent of when they were interviewed in the other years. In other
words, this variable nets out all potentially existing systematic differences between
respondents who were interviewed before and after March 11, 2011, respectively. Similarly
constructed is 2011,30 iPostJune , which represents the day when the German parliament
decided to permanently shut‐down the 7 oldest German nuclear reactors and to phase out the
remaining 8 ones before December 31, 2022.
The coefficients of the interaction terms between these two binary indicators and the year
2011, 1 and 2 , yield the impact of these two dates on respondents’ well‐being.
The main identifying assumption here is that, conditional on year and month fixed effects,
t m , the individual‐level covariates it , and conditional on netting out time‐invariant
individual unobservables, i , the interview date is random and unrelated to the Fukushima
catastrophe. This is very likely the case since:
11
(i) The nuclear meltdown happened on March 11, 2011. Most SOEP interviews are
carried out during the first six months of a year. Roughly half of all respondents in
2011, i.e. 5000, conducted their interview before and after this date, respectively. In
Table 1, we plot the mean values of all covariates along with the scale‐free
normalized difference. Imbens and Wooldridge (2009) suggest that a normalized
difference above 0.25 indicates covariate imbalance. This is not the case for any of
our covariates. Thus we conclude that the sample is well‐balanced on observables.
We do not find evidence for selection effects as a function of the March 11 cut‐off
interview date.
(ii) In around 50% of all cases, a trained interviewer is physically present when
interviews are carried out. Typically, interviews are scheduled at least several days in
advance. It is highly unlikely that the Fukushima accident itself had any impact on
interview dates. March 11, 2011 was a Friday; the accident happened at 7:45am CEST
(German) time. As a robustness check, we exclude all interviews where a trained
interviewer was not present.
[Insert Table 1 about here]
Since the Fukushima disaster is exogenous to the German SOEP interview dates, in principle, no
adjustment for pre‐post differences in sample compositions is necessary. Basically, in a totally
randomized setting, we could even rely on cross‐sections to estimate the Fukushima effects.
However, we are in the fortunate position to rely on panel data. This allows us to compare (i)
LMP treatment effects unadjusted for observables with (ii) LMP treatment effects adjusted for
observables as well as (iii) simple pooled LMP‐OLS estimates not exploiting the panel structure
with (iv) LMP‐Fixed Effects (FE) estimates that eliminate time‐invariant individual unobserved
heterogeneity. Since, in our preferred model specifications, we focus on a short time horizon
and compare survey responses in 2010 to those in 2011, it is unlikely that time‐varying
unobservables confound the FE estimates.

12
Comparing (i) to (iv) against one another also serves as a test for the plausibility of the
March 11 exogeneity assumption and yields information on potentially confounding impacts of
observables as well as unobservables.
4.2. Descriptive Findings
Figures 2 to 4 anticipate and nicely illustrate our main findings. Figure 2 represents graphically
our OLS model and Figures 3 and 4 represent our FE‐model. The x‐axis displays the interview
date in 2011. The first black vertical bar indicates the Fukushima catastrophe and the second
black bar the German Nuclear Phase‐Out Bill. The latter permanently shut down the 7 oldest
nuclear reactors and imposed a clear phase‐out timeline for the remaining eight reactors.
Figures 2 and 3 plot daily averages in responses for EnvWorriesLarge. The difference
between those two figures is the y‐axis. In Figure 2, we simply plot the share of respondents, on
a given day, who reported being very concerned about environmental protection. As seen, we
observe a distinct jump in that share after March 11. After the German parliament passed the
Nuclear Phase Out Bill, the share of environmentally concerned citizens went down again. Note
that the grey underlined confidence intervals widen toward the end of the year since only
about 1,100 interviews were carried out after August 1, roughly 10% of all interviews.
In Figure 3, the y‐axis makes use of the panel structure of the data and displays the
individual‐level difference in responses between the 2011 and 2010 interview. In other words,
in Figure 3, we plot the change in the average daily share of people who are very concerned
about the environment by their 2011 interview date, relative to their 2010 answers.
[Insert Figure 2 to 4 about here]
Figure 3 illustrates that, while there was zero change in environmental concerns before
Fukushima’s meltdown, after concerns significantly increased by 5 to 10 percentage points.
After the conservative government announced their Nuclear Phase‐Out Plan, thus making a U‐

13
turn with respect to their nuclear and climate change policies, environmental worries declined.3
Toward the end of the year, they leveled‐off around the zero line, which indicates no significant
changes in environmental concerns.
Figure 4 is set up analogously to Figure 3, but plots changes in general life satisfaction. It
is easy to see that the curve is almost flat around the zero x‐line. No changes in life satisfaction
that could be related to the meltdown or the change in German environmental policy are
identifiable.
4.3. Regression Results
4.3.1 Baseline Specifications
Table 2 gives the results of the baseline specifications as outlined in equation (1). In our
baseline specifications, we focus on the years 2010 and 2011. The first two columns of Table 2
estimate OLS‐LMP and the next two columns FE‐LPM models.4 Thus, the first two columns are
the (covariate‐adjusted) regression equivalent to Figure 2 and the next two columns the
equivalent to Figure 3. The dependent variable is always EnvWorriesLarge and indicates the
share of respondents who are “very concerned” about environmental protection. For the sake
of clarity and brevity, we suppress the coefficient estimates of those covariates that are not of
principle interest. As shown in the lower bottom of Table 2, in the even numbered columns,
additional sample adjusting covariates, it , are included in the regressions, whereas they are
excluded in the odd numbered columns.
[Insert Table 2 about here]
3 Note that, in this graph, we plot both relevant Nuclear Phase Out Bill dates: the announcement of the bill on May
30 as well as the formal passing of the bill in the German parliament on June 30. It is not clear which of these two
dates is the relevant one and was perceived as such by the citizens. It is likely that some parts of the population
were more responsive to the first whilst others were more responsive to the second. In our main specifications, we
decided to employ June 30 as the relevant date. However, the findings are largely robust to using May 30 as we
show in our robustness check section.
4 We routinely cluster standard errors at the household level. However, in our robustness checks, we show that
clustering at the sate‐level does not alter the findings (Bertrand et al., 2004).
14
We learn the following from Table 2: First, across all fours models, we consistently find that
environmental concerns significantly increased by 5‐6 ppt. immediately after the Fukushima
disaster. Relative to the pre‐Fukushima baseline concern level, this represents an increase of
about 20%.
Second, after the abrupt switch in German nuclear policies—the permanent shut‐down of
the oldest German power plants and the ultimate phase‐out of the remaining ones—concerns
about environmental protection decreased significantly by about 9 ppt. Relative to the mean
worry level between March 11 and June 30, which was 34%, the estimates represent decreases
in the share of environmentally distressed citizens by about 25%, i.e., a decrease that roughly
equals the increase immediately after Fukushima. Obviously, the German Nuclear Phase‐Out
Bill helped to counterbalance the mental distress triggered by Fukushima.
Third, overall, we find no evidence (i) that respondents differ in their observables pre vs.
post the March 11 and June 30 interview dates; (ii) that the correction for observables makes
any difference; or (iii) that the correction for unobservables matters. In all models, the
coefficients remain almost identical whether or not we include it . The OLS vs. FE estimates
are likewise almost identical. Note that the small variation between OLS vs. FE coefficients may
stem from the fact that the FE models are essentially identified by a two year balanced panel
and individual‐level changes in the variable of interest, whereas the OLS model is identified by a
two year unbalanced panel. Thus, the OLS and FE samples are not identical; the OLS sample
includes 6500 more observations from individuals who only participated in one of the two
surveys waves.5
As discussed in Section 2.2, immediately after Fukushima the German government
announced an “Atom‐Moratorium” for 3 month during which the oldest German reactors were
shut down and their safety rigorously inspected. One limitation of this study is that we cannot
disentangle the “clean” Fukushima scaring effect from this immediate policy action effect.
However, we do not believe that this hampers the interpretation of our findings for two
5 This holds despite the fact that the number of observations included in the sample, as indicated in the bottom of Table 2, is identical.
15
reasons: (1) In the aftermath of the disaster, most governments around the globe typically take
some action—at least announce action in political speeches. In general, this makes it impossible
to identify any natural disaster impact in a 100% clean way; and (2) if any, this particular
immediate policy action by the German government should downward bias the impact of
Fukushima on mental distress. In that case, we would obtain a lower bound estimate.
4.3.2. Robustness Checks
Table 3 provides a series of robustness checks, always employing our preferred fixed effects
model in the last column of Table 2.
[Insert Table 3 about here]
As already mentioned in footnote 3, in our standard specifications, we chose the date when the
Nuclear Phase Out Bill formally passed the parliament (June 30). In column (1), we employ an
alternative date, namely the date when the sharp turnaround in the government’s energy
policy was formally announced; May 30, 2011. As seen, our findings are robust to using the
announcement instead of the implementation date.
In column (2), we include a linear time trend. One concern with the identification of the
policy action effect may be that, after the sharp increase in concerns, concerns would have
decreased even without the Nuclear Phase Out Bill. Column (2) shows that the identification of
the effect is largely robust to the inclusion of a time trend.
Column (3) excludes people who moved recently and column (4) any postal interviews. The
latter interviews may include measurement error in the interview date. In addition,
respondents may have postponed the filling out of the questionnaire due to Fukushima. As
seen, both effects are robust to both robustness checks.
Column (5) clusters standard errors at the state level (Bertrand et al., 2004) and column (6)
balances the sample. Again, our findings are robust to these specifications.
16
Finally, we use the years 2009 and 2010, our standard specification, but employ a placebo
“After Meltdown” as well as a placebo “After Permanent Shutdown” date, namely March 11
and June 30, 2010. Both effects are close to zero in size and not statistically significant.
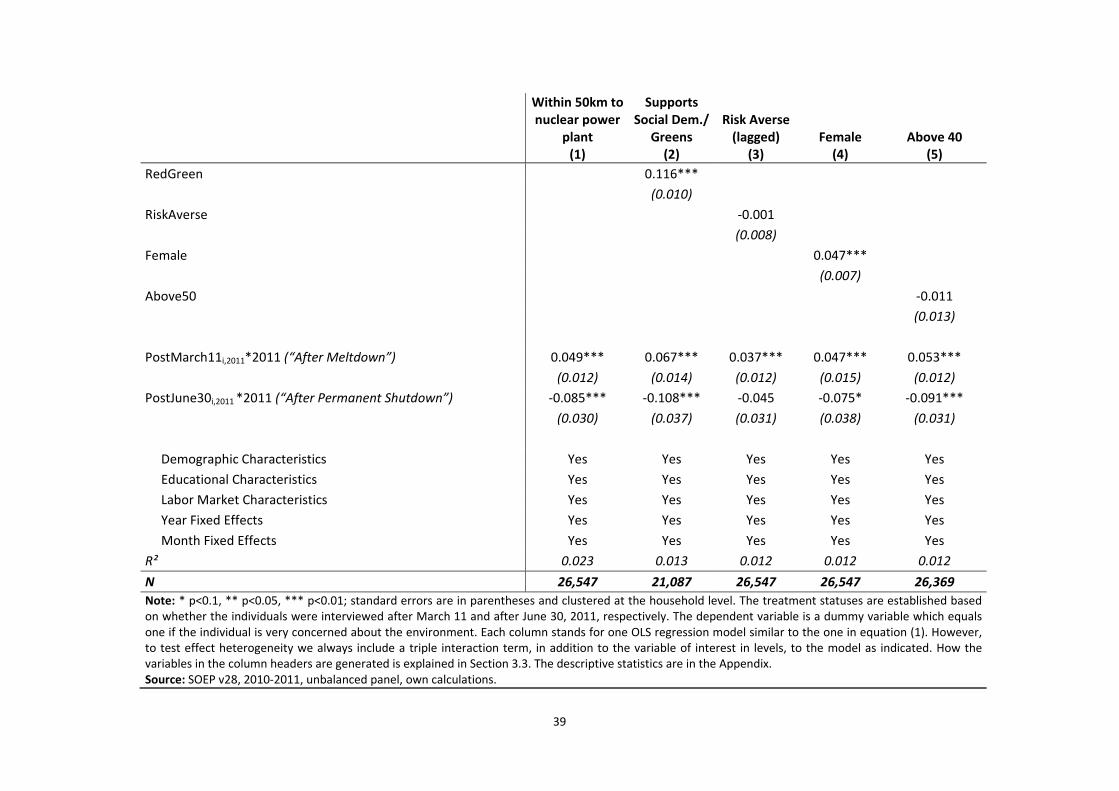
4.3.3. Effect Heterogeneity
Now we run more flexible specifications that investigate effect heterogeneity and yield
additional reinforcing evidence for the plausibility of the estimates. Technically, in Table 3, we
add the regressor we would like to stratify the sample on, both in levels and in interaction with
the tiPostMarch 201111 2011, and the tiPostJune 201130 2011, covariates of interest.6 As seen in
the column headers, we test effect heterogeneity with respect to: (a) distance to the next
nuclear power plant, (b) political opinions, (c) risk aversion, (d) gender, and (e) age.
Exploiting exogenous distances to nuclear reactors
Column (1) formalizes econometrically what we see in Figure 1. In our preferred “distance
to power plant” specification, we rely on a dummy that indicates if respondents live within
50km (31mi) distance to a nuclear power plant.7 As the Appendix shows, 27% of all Germans
do. This gives us enough statistical power and variation. Column (1) of Table 3 shows: First of
all, people living closer to power plants do not worry more or less about the environment, i.e.,
we do not find evidence for geographical sorting. Note that, even if we found sorting, we would
net out these systematic differences with this regressor. Especially in the short‐run, the
residential distance to the next nuclear power plant is exogenous with respect to Fukushima
and the change in environmental policies.8
6 We estimate these models by LMP and abstain from individual fixed effects. The reason is that all variables that we test are, by construction, very or totally time‐invariant. This does not allow us to separately identify the triple interaction term effects from the level effects.
7 The results are robust to alternate cut‐off radii and available upon request.
8 In a robustness check, we exclude people who moved since the last interview. In another robustness check, we
test whether the results hold when one measures the distance of the place of birth to the next nuclear power
plant. The results are stable and available upon request.
17
Second, the plain tiPostMarch 201111 2011, and tiPostJune 201130 2011, coefficients remain
robust in size and significance. Their triple interactions with “within50kmdistance” are small
and not significantly different from zero. This means that there is no differential scaring or
relieving effect of the meltdown and the phase out, depending on the respondents’ distance to
the next power plant. Obviously, all Germans were similarly affected by Fukushima and also
similarly relieved. This makes sense since a potential nuclear disaster would, due to the small
distances, certainly significantly affect all Germans, independent of where they live.
[Insert Table 4 about here]
In extended analyses not displayed, we stratify by the following three measures: (a) whether
the closest nuclear power plant had been shut down, (b) whether the closest nuclear power
plant will be shut down until 2020, (c) whether the closest nuclear power plant will not be shut
down (exploiting the fact that some Germans live in close distance to nuclear power plants in
France and Switzerland which have not been affected by German policy action). However, the
results confirm the finding above according to which distance to a power plant does not
matter.9
Political opinion and risk aversion
Column (2) makes use of SOEP questions about respondents’ political opinions and party
preferences. We group those together who indicate a strong preference for the Greens and the
Social Democrats; both parties formed a centre‐left coalition between 1998 and 2005 and were
largely in favor of a permanent nuclear phase‐out, long before Fukushima. It turns out that
people in favor of “Red‐Green” are 12ppt. more likely to be “very concerned” about
environmental protection. With regard to the Fukushima disaster, we do not find much
evidence that people who strongly sympathize with the political ideas of Red‐Green reacted
differently to the disaster.
9 The detailed results are available upon request.
18
In column (3), we test whether risk aversion matters. Standard economic theory would
clearly suggest that it does, since a nuclear accident is a small probalistic event with high social
costs. Indeed we do find evidence that risk aversion mattered for the evaluation of the phase‐
out decision; risk averse people seem to have incurred an additional 3% Fukushima scaring
“premium”, significant at the 5% level. Similarly, they seem to have been more relieved after
the permanent phase out had been decided, although the latter estimate is not statistically
significant.
Gender and age
Column (4) examines the role of gender. We find clear and strong evidence that women in
general are (i) 5ppt. more likely to be very concerned about environmental protection; (ii)
incurred a 3ppt. larger scaring effect after the meltdown; and (iii) a 8ppt. larger relieving effect
after the phase‐out as compared to men.
Finally, we look at age. The Greens were elected into the German parliament for the first
time in 1982. They are still seen as the democratic representation of the 1968er movement in
Germany, a left‐wing, student‐driven, intellectual movement. One of the Greens’ main political
goals was the (immediate) phase‐out of nuclear energy and the transition to renewables – this
objective became part of their identity after the Chernobyl nuclear disaster in 1986. We
generate an age dummy “above50” identifying respondents who were at least 25 in 1986, i.e.
who experienced Chernobyl, the (post) 1968 movement, and the intense debates about nuclear
energy in the 1980s. However, we do not find much evidence that respondents over 50 reacted
differently to the disaster than the younger generation.
One can summarize that the Fukushima scaring and phase‐out relieving effects are mostly
driven by risk averse women.

19
Alternative Mental Well‐Being Measures
General life satisfaction
The models in Table 4 make use of alternative mental well‐being measures. The first column
uses the standard 11 categorical life satisfaction measure as dependent variable. This model is
the regression equivalent to Figure 4. And as already suspected in Figure 4, we do not find any
evidence that Fukushima or the Phase‐Out Bill had an impact on citizens’ general life
satisfaction. Typically, studies consistently find that individual economic prospect or
unemployment have a strong impact on life satisfaction (Winkelmann and Winkelmann, 1998;
Frijters et al. 2004; Kassenboehmer and Haisken‐DeNew, 2009; Knabe et al., 2010). One may
interpret our finding as evidence that disasters (in other countries) may affect specific mental
well‐being measures even in locations geographically far away, but not life satisfaction in
general, at least as long as people are not directly personally affected.
Affective well‐being measures
The finding from column (1) is reinforced in column (2) where we make use of a collapsed
version of the “happy” affective well‐being measure (see Section 3.2). We do not find evidence
that the share of people who felt happy “very often” or “often” in the last 4 weeks varied
significantly.
[Insert Table 5 about here]
In contrast, immediately after Fukushima, the share of respondents who felt “sad” increased by
about 4ppt (column (3)). Part of the reason why Fukushima has been considered so disastrous
was the lack of or misleading catastrophe management by both politicians—officials
underestimated dangers and knowingly concealed information—and the operating Tokyo
Electric Power Company (TEPCO). Media reports about these failures made environmentally‐
concerned people around the globe very sad and angry. This is illustrated in column (3). We see
that the sadness‐level substantially shifted upward after Fukushima.

20
Concerns about climate change
The radical change in German conservative energy politics entailed a long‐term large‐scale plan
under which Germany would gradually replace nuclear energy with renewables. The
government of Angela Merkel generated its own term for this ambitious plan: “EnergyChange”
(Energiewende). Since the Energiewende is inherently linked to climate change politics and was
largely communicated to the public with that spin, we test whether Germans’ concerns about
climate change changed too.
Column (5) shows that concerns about climate change significantly increased after
Fukushima and decreased after the announcement of the new German energy politics and the
Energiewende.10
4.3.4. Long‐Run Effects
Table 6 tests long‐run effects. We intend to test whether concerns about environmental
protection increased significantly in the long‐run due to Fukushima. For this purpose, we
restrict the sample to the years 2009 and 2012 and, again, estimate (unbalanced) OLS and
(balanced) FE models. When estimating effects over a longer time horizon, we face a trade‐off
between considering unobservables through individual fixed effects and considering marginal
populations who did not participate at least once pre‐ and post‐Fukushima in the survey. For
example, for the two years 2009 and 2012, we have a total pool of 31,456 person‐year
observations from 22,942 different individuals, but only 8,761 of them participated in both
2009 and 2012. While the OLS model is identified by all 22,942 respondents, the FE model only
makes use of the 8,761 long‐term SOEP participants.
In all columns, we estimate a model as in equation (1). Column (1) uses an unbalanced
panel and estimates an OLS model while column (2) employs a fixed effect model using a
balanced panel. Columns (3) and (4) only makes use of the years 2009 and 2012 and basically
10 There are several explanations for why climate change concerns significantly increased after Fukushima: (1) It
could simply be that the environmental disaster raised people’s awareness about environmental issues; (2) In the
short run, shutting down nuclear power meant replacing the energy production largely with climate‐damaging coal
energy; and/or (3) People might confuse that nuclear power and emissions have not been linked to climate
change.

21
compares environmental concern level effects in 2009 to those in 2012. In all four models, the
2012 effect is identified by the year dummy 2012.
[Insert Table 6 about here]
We find that (i) in the first two columns, the standard Fukushima scaring and phase out
relieving effects are very close to our standard estimates in Table 2, which are only based on
2010 and 2011; (ii) that the OLS and FE estimates in the first two columns are almost identical;
and (iii) the 2012 effects is always small; for the unbalanced OLS models in columns (1) and (3)
that include marginal populations, we find a small, but significant, 1 ppt. increase in concerns
levels for 2012. However, this small significant effect vanishes once we net out individual
unobserved heterogeneity and run fixed effects regressions.
All four findings reinforce the credibility of our estimates. The last finding (iii) shows that
the policy action Phase‐Out Bill effect indeed offset, at least almost entirely offset, the
increased environmental concerns after Fukushima.
4.3.5. Comparison to Long‐Run Effects of the Chernobyl Disaster:
Next, as a last exercise, we run our standard model but estimate the effects of the Chernobyl
disaster on being mentally very concerned about environmental protection. More specifically,
we replicate Table 6 using the Chernobyl disaster in 1986 in order to assess its long‐term impact
on environmental worries in the German population. This serves as a robustness check for the
Nuclear Phase Out Effect that we identify above and which significantly reduced concerns
about environmental protection.
[Insert Table 7 about here]
In the first two columns of Table 7 we basically replicate the first two columns of Table 6, but
use SOEP data for the years 1984 to 1987 and April 28, 1986 as the “Chernobyl meltdown”
date.11 As seen, after Chernobyl, the share of SOEP respondents who were “very concerned
11 Although the Chernobyl disaster happened on the evening (EST) of April 26, it took until April 28 before the
media reported about the disaster.
22
about environmental protection” increased by a highly significant 11 ppt. Relative to the mean
worry level before Chernobyl12, this represents an increase of about 25 percent—almost exactly
the same increase in mental distress that we find after Fukushima. Thus, we argue that the two
events are comparable; particularly since we always focus on Germany and use the same
dataset as well as the same variables.
Besides the fact that the worries increased by the same share after Fukushima as
compared to Chernobyl, the coefficient for 1987 is of roughly the same size and highly
significant as well. This means that—in contrast to Fukushima—after Chernobyl we seem to
observe a persistent jump in mental distress due to environmental worries. We investigate this
hypothesis further in columns (3) and (4), where we add the years 1988 and 1989 to the model.
Column (3) estimates an OLS model using the pooled data and column (4) employs a
balanced fixed‐effects model. First, it is noteworthy that the identified coefficient
postApril28i,1986*1986 remains surprisingly robust across all four models in columns (1) to (4).
This reinforces the exogeneity assumption of the Chernobyl disaster. Second, we find that the
share of Germans who were very concerned about environmental protection indeed
persistently increased by a large share after Chernobyl. The coefficients for the three post‐
Chernobyl yearly dummies 1987, 1988, and 1989 are large and highly significant.
[Insert Figure 5 about here]
Finally, we non‐parametrically illustrate the persistent increase in environmental concerns in
Figure 5.13 In the visual analogue to the model in column (3) it is easy to see that concerns
substantially increased after Chernobyl and remained on this elevated level. This finding
reinforces one of the main findings of this paper suggesting that it was indeed the German
12 which was 40 percent and thus significantly higher than it is today.
13 Again, as in Figure 2, a report daily averages. However, since we plot the daily means over several years and
since most respondents are interviewed in the first months of a year, we observe some jumps in the graph. To
smooth them a little bit, we disregarded days with less than five respondents interviewed.

23
Nuclear Phase Out Bill of 2011 that significantly reduced environmental concerns after
Fukushima.
5. Discussion and Conclusion
This research shows that environmental disasters can have significant negative spillover
effects on the mental health of another country’s residents—even if the other country is on the
other side of the world and the disaster does not directly affect its residents, nor does it
increase the likelihood that a similar disaster occurs on the other country.
The Fukushima disaster in March 2011 and its subsequent related events significantly
increased concerns about environmental protection among the German population. The mental
scaring effects were reversed when the hitherto pro‐nuclear governing centre‐right coalition
fundamentally changed its position and energy policy. On June 30, the German parliament
voted almost unanimously for a law that permanently shut‐down the 7 oldest German nuclear
power plants and implemented a clear phase‐out plan for the remaining 8 by the end of 2022.
The Nuclear Phase‐Out Bill has been combined with a large scale government program
supporting the transition to renewables (“Energiewende”). With this bill, Germany became the
first nuclear energy generating country to completely phase‐out its use. We show that this
policy U‐turn—supported by a large majority of Germans—improved citizens’ mental well‐
being, particularly among risk‐averse women.
We find particularly strong effects on citizens’ concerns about the environment, but also
on affective well‐being measures such as sadness. Mental health is a multidimensional concept
that is complex to measure. Strong concerns or worries are integral part of overall mental
health. When we correlate our “very concerned about environmental protection” measure with
the mental health SF12 summary scale (RAND, 1995), which was surveyed in the SOEP in 2010,
we find that people who are very concerned about the environment have a highly significantly
1.8 ppt lower mental health status. Thus it is reasonable to assume that people who are
permanently very concerned about the environment lose 1% of a Quality Adjusted Life Year
(QALY). This assumption allows us to carry out the following rough back‐of‐the‐envelope

24
calculation: Fukushima increased the share of “very concerned” Germans by 6ppt. This equals
about 4 million German citizens.14 It took roughly 3 months for the German parliament to
implement measures that ameliorated environmental concerns. Thus one would obtain a
monetized mental health loss of 0.01*4/4=100,000 QALYs. The health economics literature
values one QALY with roughly 100,000€. Thus, this would yield a total monetized Fukushima‐
related mental health loss of €1bn or €250 per affected citizen, which equals about €20 per
week and affected citizen.
There is complementary evidence showing that people are actually willing to pay for
nuclear‐free energy production, most likely in return for a lower environmental concern level.
In polls, 70% of the German citizens say that they would be willing to pay higher energy prices
as a consequence of the transition to renewables (Infratest Dimap, 2011b). Actually, part of the
Energiewende policy is a fixed subsidy for every kilowatt hour (kWh) produced by renewables
(„Einspeisevergütung“). The total €18bn annual cost of this policy is paid by all electricity
consumers through a flexible absolute tax per kWh („EEG‐Umlage“).15 In 2013, this tax
amounted to 5.3 Eurocent per kWh (Bundesregierung, 2013). The average household consumes
about 3500 kWh per year and thus pays €185 or €15 per months for the transition to
renewables (EnergieAgentur NRW, 2012). While this represents a mandatory tax, which must
be paid by all citizens, a study by Check24 (2012) finds that, before Fukushima, 37% of
consumers switching their energy provider, chose renewable energy sourced electricity.
Immediately after Fukushima, this share doubled to 74% and was still 64% one year after the
disaster (Check24, 2013).
This illustrates that natural disasters and catastrophes may not only have external effects
on the mental well‐being of other country citizens, but may also impact people’s actual
economic behavior, which is in this case presumably driven by fear and mental concerns. How
14 According to the German Federal Statistical Office (2012), 68.6 million German citizens were about 18 in 2012.
Thus, 1ppt. equals 686,000 people and 6ppt. roughly 4 million.
15 Meanwhile, the German law being the role model, at least 65 states around the globe have copied this subsidy
for renewables (REN21, 2013).,

25
mental concerns translate into changes in actual economic behavior and individuals’ actions is a
promising future research field.
6. Literature
Andersen, H. H., Mühlbacher, A., Nübling, M., Schupp, J., and Wagner, G. G. (2007): “Computation of standard values for physical and mental health scale scores using the SOEP version of sf12v2.” Journal of Applied Social Science Studies (Schmollers Jahrbuch), 127, 171‐182.
Aoki, M.; Rothwell, G. (2013): “A comparative institutional analysis of the Fukushima nuclear disaster: Lessons and policy implications”, Energy Policy, 53(C): 240‐247.
Berger, E. M. (2010): “The Chernobyl Disaster, Concern about the Environment, and Life Satisfaction”, Kyklos, 63(1): 1‐8.
Bertrand, M.; Duflo, E.; Mullainathan, S. (2004): “How Much Should We Trust Differences‐in‐Differences Estimates?” The Quarterly Journal of Economics, 119(1): 249‐275.
Bundesregierung (2011a): Regierungserklärung von Bundeskanzlerin Angela Merkel (“State of the Union Address of Chancellor Angela Merkel”), June 9, 2011: http://www.youtube.com/watch?v=jFm1I_1Q3Ug, last accessed on July 2, 2013.
Bundesregierung (2011b): Bundesregierung setzt Laufzeitverlängerung für drei Monate aus: http://www.bundesregierung.de/Content/DE/Artikel/2011/03/2011‐03‐14‐moratorium‐kernkraft‐deutschland.html, last accessed on July 2, 2013.
Bundesregierung (2011c): Regierungspressekonferenz vom 1. Juni: http://www.bundesregierung.de/Content/DE/Mitschrift/Pressekonferenzen/2011/05/2011‐06‐01‐regpk.htmlx, last accessed on July 2, 2013.
Bundesregierung (2011d): Bundespräsident unterschreibt Änderung des Atomgesetzes: http://www.bundesregierung.de/Content/DE/Artikel/2011/06/2011‐06‐06‐Schrittweiser%20‐Atomausstieg.html, last accessed on July 2, 2013.
Bundesregierung (2011e): Pressekonferenz zum Energiekonzept der Bundesregierung mit Bundeskanzlerin Merkel, BM Rösler, BM Röttgen und BM Ramsauer: http://www.bundesregierung.de/Content/DE/Mitschrift/Pressekonferenzen/2011/05/2011‐05‐30‐pk‐bk‐bm‐energiekonzept.html, last accessed on July 2, 2013.
Bundesregierung (2013): Energiekonzept, http://www.bundesregierung.de/Content/DE/Artikel/2013/07/2013‐07‐08‐reform‐der‐photovoltaik‐foerderung‐erfolgreich.html, last accessed on July 10, 2013.
26
Buesseler, K. O.; Jayne, S. R., Fisher, N. S.; Rypina, I. I.; Baumann, H.; Baumann, Z.; Breier, C. F.; Douglass, E. M.; George, J.; Macdonald, A. M.; Miyamoto, H.; Nishikawa, J.; Pike, S. M.; Yoshida, S. (2013): “Fukushima‐derived radionuclides in the ocean and biota off Japan”, Proceedings of the National Academy of Sciences, forthcoming.
Cahit, G.; Senik, C.; Stichnoth, H. (2012): “You can’t be happier than your wife. Happiness gaps and divorce”, Journal of Economic Behavior & Organization, 82(1): 110‐130.
Check24 (2012): Ein Jahr nach Fukushima: 64 Prozent der Stromwechsler wählten im Februar 2012 Ökostrom‐Tarif, http://www.check24.de/files/p/2012/e/c/7/180_2012‐03‐12_check24_pm_oekostrom_entwicklung_nach_fukushima.pdf, last accessed on July 10, 2013.
Clark, A. E.; Senik, C. (2010): “Who Compares to Whom? The Anatomy of Income Comparisons in Europe”, Economic Journal, 120(544): 573‐594.
Clark, A. E.; Etilé, F. (2011): “Happy house: Spousal weight and individual well‐being”, Journal of Health Economics, 30(5): 1124‐1136.
Clark, A. E.; Frijters, P.; Shields, M. A. (2008): “Relative Income, Happiness, and Utility: An Explanation for the Easterlin Paradox and Other Puzzles”, Journal of Economic Literature, 46(1): 95‐144.
Clark, A. E.; Kristensen, N.; Westergård‐Nielsen, N. (2009): “Job Satisfaction and Co‐worker Wages: Status or Signal?”, Economic Journal, 119(536): 430‐447.
Clark, A. E.; Knabe, A.; Rätzel, S. (2010): “Boon or bane? Others' unemployment, well‐being and job insecurity”, Labour Economics, 17(1): 52‐61.
Csereklyei, Z. (2013) Measuring the Impacts of Nuclear Accidents on Energy Policy. Department of Economics Working Paper Series, 151. WU Vienna University of Economics and Business, Vienna.
Danzer, A. M.; Danzer, N. (2011): “The Long‐Term Effects of the Chernobyl Catastrophe on Subjective Well‐Being and Mental Health”, IZA Discussion Papers 5906.
Deaton, A. (2012): “The financial crisis and the well‐being of Americans”, Oxford Economic Papers, 64(1): 1‐26.
Dohmen, T.; Falk, A.; Huffman, D.; Sunde, U.; Schupp, J.; Wagner, G. G. (2010): “Individual Risk Attitudes: New Evidence from a Large, Representative, Experimentally‐Validated Survey”, Journal of the European Economic Association, 9(3): 225‐250
Draca, M.; Machin, S.; Witt, R. (2011): “Panic on the Streets of London: Police, Crime, and the July 2005 Terror Attacks,” American Economic Review, 101(5): 2157‐2181.
27
EnergieAgentur NRW (2012): Erhebung „Wo im Haushalt bleibt der Strom? Anteile, Verbrauchswerte und Kosten von 12 Verbrauchsbereichen in 1‐ bis 6‐Personen‐Haushalten,“ http://www.energieagentur.nrw.de/_database/_data/datainfopool/erhebung_wo_bleibt_der_strom.pdf, last accessed on July 10, 2013.
Ethikkommission (2011): Deutschlands Energiewende – Ein Gemeinschaftswerk für die Zukunft: http://www.bundesregierung.de/Content/DE/_Anlagen/2011/07/2011‐07‐28‐abschlussbericht‐ethikkommission.pdf, last accessed on July 2, 2013.
Frank, R.G. (1981): “Cost Benefit Analysis in Mental Health: A Review of the Literature”, Administration in Mental Health, 8(3):161‐176, 1981
Frank, R.G.; Koss C. (2005): “Mental Health and Labor Markets Productivity Loss and Restoration, in Disease Control Priorities Project.” Geneva, Switzerland: World Health Organization
Frey, B. S.; Luechinger, S.; Stutzer, A. (2007): “Calculating Tragedy: Assessing The Costs Of Terrorism”, Journal of Economic Surveys, 21(1): 1‐24, 02.
Frick, J. R., Ziebarth, N.R. (2013): “Welfare‐Related Health Inequality: Does the Choice of Measure Matter?” The European Journal of Health Economics, 14(3): 431‐442.
Frijters, P.; Haisken‐DeNew, J. P.; Shields, M. A. (2004): “Money Does Matter! Evidence from Increasing Real Income and Life Satisfaction in East Germany Following Reunification”, American Economic Review, 94(3): 730‐740.
Gesundheitsberichterstattung des Bundes (2012), www.gbe‐bund.de, last accessed on June 20, 2012.
German Federal Statistical Office (2012): Statistisches Jahrbuch 2012, Statistisches Bundesamt, https://www.destatis.de/DE/Publikationen/StatistischesJahrbuch/StatistischesJahrbuch.html, last accessed on July 10, 2013.
Glaser, Alexander (2011): “After Fukushima: Preparing for a More Uncertain Future of Nuclear Power”, The Electricity Journal, 24(6): 27‐35.
Glied, S. A.; Frank, R.G. (2009): “Better But Not Best: Recent Trends in the Well Being of the Mentally Ill”, Health Affairs, 28(3): 637‐648.
Hippel, Frank N. (2011): “The radiological and psychological consequences of the Fukushima Daiichi accident”, Bulletin of the Atomic Scientists, 67(5): 27.
Hommerich, C. (2012). “Trust and Subjective Well‐being after the Great East Japan Earthquake,
Tsunami and Nuclear Meltdown: Preliminary Results.” International Journal of Japanese
Sociology, 21(1): 46‐64.

28
Huenteler, J.; Schmidt, T. S.; Kanie, N. (2012): “Japan's post‐Fukushima challenge – implications from the German experience on renewable energy policy”, Energy Policy, 45(C): 6‐11.
IAEA (2011a): Fukushima Nuclear Accident Update Log: http://www.iaea.org/newscenter/news/2011/fukushima110311.html, last accessed on July 2, 2013.
IAEA (2011b): International Nuclear and Radiological Event Scale (INES): www.iaea.org/Publications/Factsheets/English/ines.pdf, last accessed on July 2, 2013.
Imbens, Guido W.; Wooldridge, Jeffrey M. (2009): “Recent Developments in the Econometrics of Program Evaluation”, Journal of Economic Literature, 47(1): 5‐86.
Infratest Dimap (2010): Bundesweite Umfragen, August 2010, http://www.infratest‐dimap.de/umfragen‐analysen/bundesweit/ard‐deutschlandtrend/2010/august/, last accessed on July 2, 2013.
Infratest Dimap (2011a): Bundesweite Umfragen, Deutschlandtrend Juni 2011, http://www.infratest‐dimap.de/umfragen‐analysen/bundesweit/ard‐deutschlandtrend/2011/juni/, last accessed on July 2, 2013.
Infratest Dimap (2011b): Bundesweite Umfragen, ARD DeutschlandTREND, März 2011 extra: Atom‐Katastrophe in Japan: http://www.infratest‐dimap.de/umfragen‐analysen/bundesweit/ard‐deutschlandtrend/2011/maerz‐extra/, last accessed on July 2, 2013.
Infratest Dimap (2011c): Bundesweite Umfragen, March 15‐16, 2011, http://www.infratest‐dimap.de/umfragen‐analysen/bundesweit/umfragen/aktuell/aussetzung‐der‐laufzeitverlaengerung‐gilt‐nicht‐als‐glaubwuerdiger‐kurswechsel/, last accessed on July 2, 2013.
Institute of Nuclear Power Operations (INPO) (2011): Special Report on the Nuclear Accident at the Fukushima Daiichi Nuclear Power Station, http://www.nei.org/filefolder/11_005_Special_Report_on_Fukushima_Daiichi_MASTER_11_08_11_1.pdf, last accessed May 27, 2013.
Ishino, T.; Ogaki, M.; Kamesaka, A.; Murai, S. (2012): “Higashi Nihon Daishinsai no Kôfukukan he
no Eikyô (The Impact of the Great East Japan Earthquake on Happiness).” In M. Seko, H.
Teruyama, I. Yamamoto, & Y. Higuchi (Eds.), “Nihon no Kakeikoudou no Dainamizumu: Higashi‐
Daishinsai ga Kakei ni ataeta Eikyo [Dynamism of Household Bevior in Japan: The Effects of the
Great East Japan Earthquake on the Households]”; pp. 255–272, Vol. 8. Tokyo: Keio University
Press.
Kassenboehmer, S. C.; Haisken‐DeNew, J. P. (2009): “You're Fired! The Causal Negative Effect of Entry Unemployment on Life Satisfaction”, Economic Journal, 119(536): 448‐462.
29
Kawashima, S.; Takeda, F. (2012): “The effect of the Fukushima nuclear accident on stock prices of electric power utilities in Japan”, Energy Economics, 34(6): 2029‐2038.
Knabe, A.; Rätzel, S.; Schöb, R.; Weimann, J. (2010): “Dissatisfied with Life but Having a Good Day: Time‐use and Well‐being of the Unemployed”, Economic Journal, 120(547): 867‐889.
Knabe, A.; Rätzel, S. (2011): “Scarring or Scaring? The Psychological Impact of Past Unemployment and Future Unemployment Risk”, Economica, 78(310): 283‐293.
Lu, C.; Frank, R.G.; Liu, Y.; Shen. J. (2009): “The impact of mental health on labour market outcomes in China”, Journal of Mental Health Policy and Economics, 12(3): 157‐166.
Luechinger, S.; Raschky, P. A. (2009): “Valuing flood disasters using the life satisfaction approach”, Journal of Public Economics, 93(3‐4): 620‐633.
Luechinger, S.; Meier, S.; Stutzer, A. (2010): “Why Does Unemployment Hurt the Employed?: Evidence from the Life Satisfaction Gap Between the Public and the Private Sector”, Journal of Human Resources, 45(4): 998‐1045.
Metcalfe, R.; Powdthavee, N.; Dolan, P. (2011): “Destruction and Distress: Using a Quasi‐Experiment to Show the Effects of the September 11 Attacks on Mental Well‐Being in the United Kingdom”, Economic Journal, 121(550): F81‐F103.
REN21: Renewable Energy Policy Network for the 21st Century (2013): Renewables 2013: Global Status Report, http://www.ren21.net/REN21Activities/GlobalStatusReport.aspx, last accessed on July 10, 2013.
Ojeda, V.D.; Frank, R.G.; McGuire, T.G.; Gilmer, T.P. (2010): “Mental Illness, Nativity, Gender and Labor Supply”, Health Economics, 19(4): 396‐421.
Oswald, A. J. (1997): “Happiness and Economic Performance”, Economic Journal, 107(445): 1815‐1831.
Oswald, A. J.; Wu, S. (2011): “Well‐Being across America”, The Review of Economics and Statistics, 93(4): 1118‐1134.
RAND (1995): “User's Manual for the Medical Outcomes Study (MOS) Core Measures of Health‐Related Quality of Life (by Hays, R. D., Sherbourne, C. D, Mazel, R.).” RAND Monograph Report, Santa Monica, RAND Corporation. http://www.rand.org/pubs/monograph_reports/MR162.html, last accessed on February 2, 2013.
Reaktorsicherheitskommission (2011): Anlagenspezifische Sicherheitsüberprüfung (RSK‐SÜ) deutscher Kernkraftwerke unter Berücksichtigung der Ereignisse in Fukushima‐I (Japan): http://www.rskonline.de/downloads/rsk_sn_sicherheitsueberpruefung_20110516_hp.pdf, last accessed on July 2, 2013.

30
Rehdanz, K.; Welsch, H.; Narita, D.; Okubo, T. (2013): “Well‐being effects of a major negative externality: the case of Fukushima”, Kiel Working Papers 1855.
Rieu, A.‐M. (2013): “Thinking after Fukushima. Epistemic shift in social sciences”, Asia Europe Journal, 11(1): 65‐78.
Schüller, S. (2012): “The Effects of 9/11 on Attitudes Toward Immigration and the Moderating Role of Education”, IZA Discussion Papers 7052.
Senik, C. (2009): “Direct evidence on income comparisons and their welfare effects”, Journal of Economic Behavior & Organization, 72(1): 408‐424.
Socio‐Economic Panel (SOEP): Data for years 1984‐2011, version 28, SOEP, 2012, doi: 10.5684/soep.v28.
Spiegel (2011): Chronologie der Katastrophe in Fukushima I (Daiichi): http://www.spiegel.de/flash/flash‐25484.html, last accessed on July 2, 2013.
Stern (2011): Super‐GAU in Fukushima: Chronologie der Atomkatastrophe: http://www.stern.de/panorama/super‐gau‐in‐fukushima‐chronologie‐der‐atomkatastrophe‐1797583.html, last accessed on July 2, 2013.
Tiefenbach, T.; Kohlbacher, F. (2013): “Happiness from the Viewpoint of Economics: Findings from Recent Survey Data in Japan”, German Institute for Japanese Studies, Working Paper 13/1.
Thomas, S. (2012): “What will the Fukushima disaster change?” Energy Policy, 45(C): 12‐17.
Uchida, Y.; Takahashi, Y.; Kawahara, K. (2011): “Higashi Nihon Daishinsai chokugo no Jakunensô
no Seikatsukôdô oyobi Kôfukudo ni taisuru Eikyo (The Impact of the Great East Japan
Earthquake on the Behavior and Happiness of Young People)”; New ESRI Working Paper 24.
Vivoda, V. (2012): “Japan’s energy security predicament post‐Fukushima”, Energy Policy, Elsevier, 46(C): 135‐143.
Wagner, G. G., Frick, J. R., Schupp, J. (2007): “The German Socio‐Economic Panel Study (SOEP) Evolution, Scope and Enhancements.” Journal of Applied Social Science Studies (Schmollers Jahrbuch), 127(1): 139‐169.
Wang, Q.; Xi, C.; Xu, Y.‐C. (2013): “Accident like the Fukushima unlikely in a country with effective nuclear regulation: Literature review and proposed guidelines”, Renewable and Sustainable Energy Reviews, 17(C): 126‐146.
WHO (2013): Health risk assessment from the nuclear accident after the 2011 Great East Japan earthquake and tsunami, based on a preliminary dose estimation, Report http://www.who.int/ionizing_radiation/pub_meet/fukushima_risk_assessment_2013/en/index.html, last accessed on May 17, 2013.

31
Winkelmann, L.; Winkelmann, R. (1998): “Why Are the Unemployed So Unhappy? Evidence from Panel Data”, Economica, 65(257): 1‐15.
Yamamura, E. (2012): “Experience of technological and natural disasters and their impact on the perceived risk of nuclear accidents after the Fukushima nuclear disaster in Japan 2011: A cross‐country analysis”, The Journal of Socio‐Economics, 41(4): 360‐363.
Zeit (2011): Fukushima: Chronik des Versagens, http://www.zeit.de/2012/10/Fukushima, last accessed on July 2, 2013.

32
Figures and Tables
Figure 1: Nuclear Power Plants and (Temporary) Nuclear Waste Sites: Distances to SOEP Respondents
Notes: Circles indicate 25, 50, and 100 km radii. Dots indicate nuclear power plants;
crosses indicate (temporary) nuclear waste sites.

33
Figure 2: Share of SOEP Respondents Who Are Very Concerned About Environmental Protection
Figure 3: SOEP Respondents Who Are Very Concerned About Environmental Protection (first difference, 2011 vs. 2010)

34
Figure 4: Reported Life Satisfaction of SOEP Respondents (first difference, 2011 vs. 2010)
Figure 5: Comparison to the Chernobyl Disaster: Share of SOEP Respondents Who Are Very Concerned About Environmental Protection

35
Table 1: Balancing Properties Between Treatment and Control Group, 2010‐2011
Interview after March 11, 2011
(treatment group)
Interview before March 11, 2011 (control group)
Norm. Difference
Demographic Characteristics
Age 49.319 52.567 0.080
Age Squared 2722.730 3092.054 0.087
Female 0.520 0.528 0.007
Married 0.628 0.612 0.008
Single 0.240 0.225 0.021
Disabled 0.123 0.154 0.042
No German Nationality 0.052 0.043 0.018
Educational Characteristics
In School 0.018 0.012 0.014
Lower Than Secondary Degree 0.122 0.154 0.038
Secondary Degree 0.534 0.538 0.001
Tertiary Degree 0.326 0.296 0.026
Labor Market Characteristics
Full‐Time Employed 0.417 0.350 0.073
Part‐Time Employed 0.126 0.103 0.038
Out of the Labor Force 0.380 0.477 0.097
On Maternity Leave 0.019 0.017 0.001
Unemployed 0.049 0.054 0.038
N 17,290 16,763 ‐ Note: The last column shows the normalized difference which has been calculated according to
Δs = 20
21
_
0
_
1 /)( ss , with _
1s and _
0s denoting average covariate values for treatment and control group,
respectively. denotes the variance. As a rule of thumb, normalized differences exceeding 0.25 indicate non‐balanced observables that might lead to sensitive results (Imbens and Wooldridge, 2009). Source: SOEP v28, 2010‐2011, own calculations.

36
Table 2: Standard Effects of the Fukushima Meltdown and the Permanent Shutdown of Nuclear Power Plants in Germany on Environmental Concerns: Short‐Term Homogeneous Impacts (2010‐2011)
Very Concerned About the Environment
OLS OLS FE FE
PostMarch11i,2011*2011 (“After Meltdown”) 0.050*** 0.051*** 0.062*** 0.062***
(0.011) (0.011) (0.012) (0.012)
PostJune30i,2011 *2011 (“After Permanent Shutdown”) ‐0.084*** ‐0.087*** ‐0.094*** ‐0.095***
(0.027) (0.027) (0.029) (0.030)
PostMarch11i,2011 0.013 0.013
(0.010) (0.010)
PostJune30i,2011 ‐0.036 ‐0.036
(0.025) (0.025)
Controls
Demographic Characteristics No Yes No Yes
Educational Characteristics No Yes No Yes
Labor Market Characteristics No Yes No Yes
Year Fixed Effects Yes Yes Yes Yes
Month Fixed Effects Yes Yes Yes Yes
R² 0.003 0.012 0.005 0.006
N 26,547 26,547 26,547 26,547
Note: * p<0.1, ** p<0.05, *** p<0.01; standard errors are in parentheses and clustered at the household level. The treatment statuses are established based on whether the individuals were interviewed after March 11 and after June 30, 2011, respectively. The dependent variable is a dummy variable which equals one if the individual is very concerned about the environment. Source: SOEP v28, 2010‐2011, unbalanced panel, own calculations.

37
Table 3: Robustness Effects of the Fukushima Meltdown and the Permanent Shutdown of Nuclear Power Plants in Germany on Environmental Concerns: Robustness of Short‐Term Homogeneous Impacts (2010‐2011)
Very Concerned About the Environment
Alternative date for
Phase Out Bill(1)
Includes linear time
trend (2)
Movers excluded
(3)
Postal interviews excluded
(4)
Std. Err. Clustered at state level
(5)
Balanced Sample (6)
Placebo Treatment Date (2010)
(7)
PostMarch11i,2011*2011 0.072*** 0.062*** 0.064*** 0.065*** 0.062*** 0.062*** 0.013***
(“After Meltdown”) (0.012) (0.012) (0.012) (0.019) (0.012) (0.012) (0.011)
PostJune30i,2011 *2011 ‐0.095*** ‐0.109*** ‐0.139*** ‐0.095* ‐0.095*** ‐0.011***
(“After Permanent Shutdown”) (0.030) (0.031) (0.043) (0.048) (0.030) (0.024)
PostMay30i,2011*2011 ‐0.100***
(“After Permanent Shutdown II”) (0.021)
Controls
Demographic Characteristics Yes Yes Yes Yes Yes Yes Yes
Educational Characteristics Yes Yes Yes Yes Yes Yes Yes
Labor Market Characteristics Yes Yes Yes Yes Yes Yes Yes
Year Fixed Effects Yes Yes Yes Yes Yes Yes Yes
Month Fixed Effects Yes Yes Yes Yes Yes Yes Yes
R² 0.008 0.004 0.006 0.007 0.013 0.006 0.006
N 26,547 26,547 26,150 13,446 26,547 20,317 31,221
Note: * p<0.1, ** p<0.05, *** p<0.01; standard errors are in parentheses and clustered at the household level. The treatment statuses are established based on whether the individuals were interviewed after March 11 and after June 30, 2011, respectively. Column (1), as indicated, uses May 30 as the relevant Phase Out Bill date since the policy action was officially announced on that date. The final bill was passed by the German parliament on June 30, which is the standard Phase Out Bill date in our other specifications. The dependent variable is a dummy variable which equals one if the individual is very concerned about the environment. Column (2) includes a linear time trend. Column (3) excludes movers and shuts down post‐Fukushima residential sorting. Column (4) excludes postal interviews and eliminates potential measurement error in the interview date. Column (5) clusters standard errors at the state level. Column (6) balances the sample and column (7) uses March 11, 2010 and June 30, 2010 as treatment dates. Source: SOEP v28, 2010‐2011, unbalanced panel, own calculations.

38
Table 4: Effect Heterogeneity Effects of the Fukushima Meltdown and the Permanent Shutdown of Nuclear Power Plants in Germany on Environmental Concerns: Short‐Term Heterogeneous Impacts (2010‐2011)
Very Concerned About the Environment
Within 50km to nuclear power
plant (1)
Supports Social Dem./
Greens (2)
Risk Averse (lagged)
(3)
Female (4)
Above 40 (5)
PostMarch11i,2011*2011*Within50kmRadius ‐0.010
(0.015)
PostJune30i,2011 *2011*Within50kmRadius 0.011
(0.042)
PostMarch11i,2011*2011*RedGreen 0.013
(0.016)
PostJune30i,2011 *2011 * RedGreen 0.010
(0.047)
PostMarch11i,2011*2011*RiskAverse ‐0.032**
(0.015)
PostJune30i,2011 *2011*RiskAverse 0.036
(0.048)
PostMarch11i,2011*2011*Female 0.027**
(0.011)
PostJune30i,2011 *2011*Female ‐0.081***
(0.030)
PostMarch11i,2011*2011*Above50 0.001
(0.013)
PostJune30i,2011 *2011*Above50 ‐0.034
(0.038)
Within50kmRadius 0.006
(0.010)
39
Within 50km to nuclear power
plant (1)
Supports Social Dem./
Greens (2)
Risk Averse (lagged)
(3)
Female (4)
Above 40 (5)
RedGreen 0.116***
(0.010)
RiskAverse ‐0.001
(0.008)
Female 0.047***
(0.007)
Above50 ‐0.011
(0.013)
PostMarch11i,2011*2011 (“After Meltdown”) 0.049*** 0.067*** 0.037*** 0.047*** 0.053***
(0.012) (0.014) (0.012) (0.015) (0.012)
PostJune30i,2011 *2011 (“After Permanent Shutdown”) ‐0.085*** ‐0.108*** ‐0.045 ‐0.075* ‐0.091***
(0.030) (0.037) (0.031) (0.038) (0.031)
Demographic Characteristics Yes Yes Yes Yes Yes
Educational Characteristics Yes Yes Yes Yes Yes
Labor Market Characteristics Yes Yes Yes Yes Yes
Year Fixed Effects Yes Yes Yes Yes Yes
Month Fixed Effects Yes Yes Yes Yes Yes
R² 0.023 0.013 0.012 0.012 0.012
N 26,547 21,087 26,547 26,547 26,369
Note: * p<0.1, ** p<0.05, *** p<0.01; standard errors are in parentheses and clustered at the household level. The treatment statuses are established based on whether the individuals were interviewed after March 11 and after June 30, 2011, respectively. The dependent variable is a dummy variable which equals one if the individual is very concerned about the environment. Each column stands for one OLS regression model similar to the one in equation (1). However, to test effect heterogeneity we always include a triple interaction term, in addition to the variable of interest in levels, to the model as indicated. How the variables in the column headers are generated is explained in Section 3.3. The descriptive statistics are in the Appendix. Source: SOEP v28, 2010‐2011, unbalanced panel, own calculations.

40
Table 5: Alternative Well‐Being Measures Effects of the Fukushima Meltdown and the Permanent Shutdown of Nuclear Power Plants in Germany on Alternative Well‐Being Measures: Short‐Term Homogeneous Impacts (2010‐2011)
Life Satisfaction
(1) Happy (2)
Sad (3)
Concerned about climate change
(4)
PostMarch11i,2011*2011 0.016 ‐0.000 0.042*** 0.049***
(“After Meltdown”) (0.024) (0.009) (0.012) (0.011)
PostJune30i,2011*2011 ‐0.077 ‐0.009 ‐0.015 ‐0.046
(“After Permanent Shutdown”) (0.065) (0.025) (0.036) (0.030)
Controls
Demographic Characteristics Yes Yes Yes Yes
Educational Characteristics Yes Yes Yes Yes
Labor Market Characteristics Yes Yes Yes Yes
Year Fixed Effects Yes Yes Yes Yes
Month Fixed Effects Yes Yes Yes Yes
R² 0.018 0.009 0.007 0.005
N 26,547 26,547 26,547 26,547
Note: * p<0.1, ** p<0.05, *** p<0.01; standard errors are in parentheses and clustered at the household level. The treatment statuses are established based on whether the individuals were interviewed after March 11 and after June 30, 2011, respectively. The dependent variables are dummy variables which equal one if the individual is (1) satisfied with life, (2) happy, (3) sad, (4) and worried about climate change. Each column stands for one FE regression model, except for the first, which is an ordered probit model. Source: SOEP v28, 2010‐2011, unbalanced panel, own calculations.

41
Table 6: Long‐Term Impact Effects of the Fukushima Meltdown and the Permanent Shutdown of Nuclear Power Plants in Germany on Environmental Concerns: Long‐Term Homogeneous Impacts (2009‐2012)
Very Concerned About the Environment
Unbalanced OLS 2009‐2012
(1)
Balanced FE 2009‐2012
(2)
2009 vs. 2012 Unbalanced OLS
(3)
2009 vs. 2012 Balanced FE
(4)
PostMarch11i,2011*2011 0.064*** 0.069***
(“After Meltdown”) (0.008) (0.010)
PostJune30i,2011*2011 ‐0.097*** ‐0.100***
(“After Permanent Shutdown”) (0.019) (0.026)
2012 0.011** ‐0.007 0.010** ‐0.007
(0.005) (0.006) (0.005) (0.006)
Controls
Demographic Characteristics Yes Yes Yes Yes
Educational Characteristics Yes Yes Yes Yes
Labor Market Characteristics Yes Yes Yes Yes
Year Fixed Effects Yes Yes Yes Yes
Month Fixed Effects Yes Yes Yes Yes
R² 0.012 0.008 0.010 0.005
N 58,039 31,456 58,039 31,456
Note: * p<0.1, ** p<0.05, *** p<0.01; standard errors are in parentheses and clustered at the household level. The treatment statuses are established based on whether the individuals were interviewed after March 11 and after June 30, 2011, respectively. The dependent variable is a dummy variable which equals one if the individual is very concerned about the environment. Columns (1) and (3) estimate unbalanced OLS, and columns (2) and (4) balanced FE regression models. The first two columns use the years 2009‐2012, whereas the last two columns solely compare 2009 with 2012. Source: SOEP v28, 2009‐2012, own calculations.
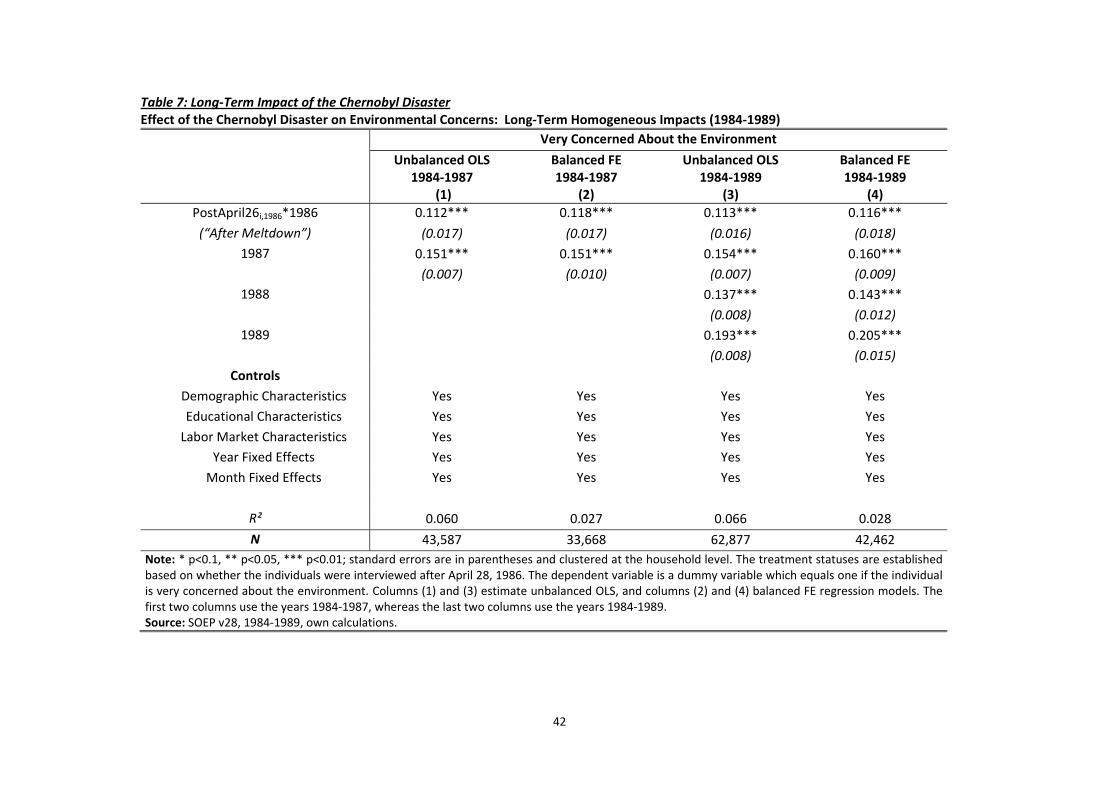
42
Table 7: Long‐Term Impact of the Chernobyl Disaster Effect of the Chernobyl Disaster on Environmental Concerns: Long‐Term Homogeneous Impacts (1984‐1989)
Very Concerned About the Environment
Unbalanced OLS 1984‐1987
(1)
Balanced FE 1984‐1987
(2)
Unbalanced OLS 1984‐1989
(3)
Balanced FE 1984‐1989
(4)
PostApril26i,1986*1986 0.112*** 0.118*** 0.113*** 0.116***
(“After Meltdown”) (0.017) (0.017) (0.016) (0.018)
1987 0.151*** 0.151*** 0.154*** 0.160***
(0.007) (0.010) (0.007) (0.009)
1988 0.137*** 0.143***
(0.008) (0.012)
1989 0.193*** 0.205***
(0.008) (0.015)
Controls
Demographic Characteristics Yes Yes Yes Yes
Educational Characteristics Yes Yes Yes Yes
Labor Market Characteristics Yes Yes Yes Yes
Year Fixed Effects Yes Yes Yes Yes
Month Fixed Effects Yes Yes Yes Yes
R² 0.060 0.027 0.066 0.028
N 43,587 33,668 62,877 42,462
Note: * p<0.1, ** p<0.05, *** p<0.01; standard errors are in parentheses and clustered at the household level. The treatment statuses are established based on whether the individuals were interviewed after April 28, 1986. The dependent variable is a dummy variable which equals one if the individual is very concerned about the environment. Columns (1) and (3) estimate unbalanced OLS, and columns (2) and (4) balanced FE regression models. The first two columns use the years 1984‐1987, whereas the last two columns use the years 1984‐1989. Source: SOEP v28, 1984‐1989, own calculations.

43
Appendix: Descriptive Statistics
Mean Std. Dev. Min. Max. Obs.
Dependent Variables Very Concerned About the Environment 0.302 0.459 0 1 26,547 Very Concerned About Climate Change 0.294 0.455 0 1 26,547 Satisfaction With Life 7.000 1.732 0 10 26,547 Feeling Happy 0.135 0.342 0 1 26,547 Feeling Sad 0.208 0.406 0 1 26,547 Demographic Characteristics Age 51.217 17.398 18 101 26,547 Age Squared 2925.892 1809.200 324 10,201 26,547 Female 0.524 0.499 0 1 26,547 Married 0.629 0.483 0 1 26,547 Single 0.222 0.416 0 1 26,547 Disabled 0.139 0.346 0 1 26,547 No German Nationality 0.046 0.210 0 1 26,547 Educational Characteristics In School 0.015 0.122 0 1 26,547 Lower Than Secondary Degree 0.137 0.343 0 1 26,547 Secondary Degree 0.536 0.499 0 1 26,547 Tertiary Degree 0.312 0.463 0 1 26,547 Labor Market Characteristics Full‐Time Employed 0.391 0.488 0 1 26,547 Part‐Time Employed 0.116 0.320 0 1 26,547 Out of the Labor Force 0.423 0.494 0 1 26,547 On Maternity Leave 0.018 0.134 0 1 26,547 Unemployed 0.051 0.219 0 1 26,547 Heterogeneity Social Democrats/Greens Supporter 0.214 0.410 0 1 26,547 Christian Democrats/Free Market Party Supporter 0.208 0.406 0 1 26,547 Within 50km Radius of Nuclear Power Plant 0.273 0.445 0 1 26,369 Risk Averse (Lagged) 0.546 0.498 0 1 21,087 Above 50 0.514 0.500 0 1 26,547 Source: SOEP v28, respondents aged 17 and older, 2010‐2011, own calculations.


