

Naval Meteorology and Oceanography Professional Development Center
Fundamentals of Weather
Contents • Air Masses• Fronts (cold, warm, occluded, stationary)• Pressure Systems• Clouds• Winds
Air Masses
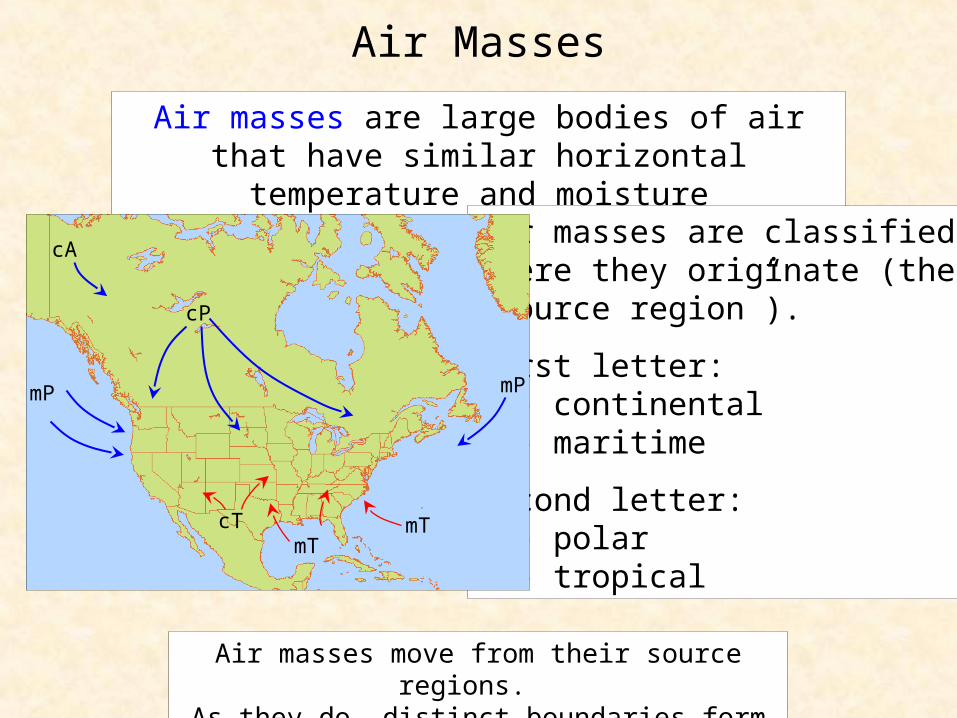
Air masses are large bodies of air that have similar horizontal temperature and moisture characteristics.
Air masses are classified bywhere they originate (their“source region”).
First letter: c - continentalm - maritime
Second letter:P - polarT - tropical
cP
cA
cT
mP
mT
mP
mT
Air masses move from their source regions. As they do, distinct boundaries form between them.

Fronts
A “front” is defined as the boundary between two air masses.
Frontal intensity is defined by the the temperature and moisture
differences on either side.
Air mass characteristics on either side of a frontal boundary can be
very different (point “A”) or more similar (point “B”).
LCold air mass(e.g, cP)
Warm air mass(e.g, mT)
Cool air mass
A
LCold
Warm
Cool
B
The stronger the differences on either side of the front, the more
potential for severe weather.

Fronts
LWarm
Cold
Occluded
Stationary
• Cold
• Warm
• Occluded
• Stationary
There are four types of fronts.

Cold fronts are associated with:• Sharp temperature changes over relatively short distances• Changes in air moisture content
(moist before, dry after)• Reduced visibility in showers• Wind shifts with frontal
passage• Pressure changes with
frontal passage• Unstable cumuliform clouds and showery
precipitation patterns
Cold Front
A cold front defines the boundary between an advancing cold air mass and a warm air mass.
Cool
Cold Warm
Cold Front

Cold Front
Cold fronts are further characterized by their speed of movement - which defines their slopes.
Slow moving cold fronts:• Most clouds and weather are at and
behind the advancing cold front• Longer periods of rain/snow, less
thunderstorm activity
Fast moving cold fronts (steeper slope):• Most clouds and weather are near and
ahead of the advancing cold front• Rain/show showers (sometimes heavy),
more thunderstorm activity• Thunderstorms often form ahead of front
Fast-moving cold front
Slow-moving cold front
cold
cold

Warm Front
Cool
Cold Warm
Warm Front
Warm fronts are associated with:• Extensive cloud activity ahead of the front.• Temperature rises with frontal passage.• Wind shifts with frontal passage.• Poor visibility at and ahead
of the frontal boundary.• Thick, stratiform clouds
and steady precipitationpatterns.
• Overall improvementin weather conditionswith frontal passage.
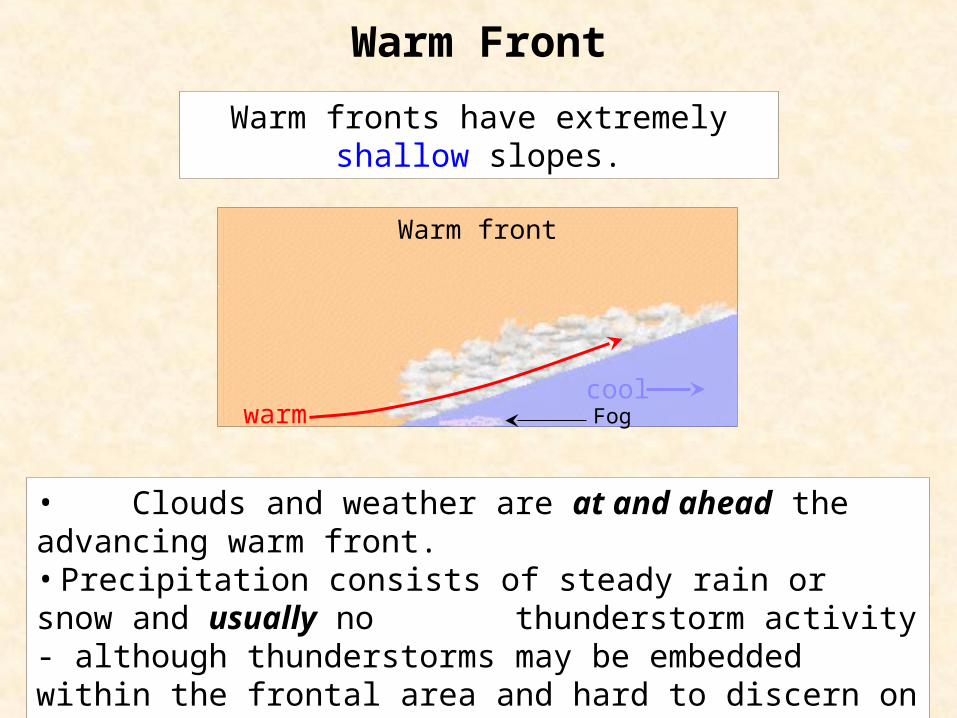
A warm front defines the boundary between a retreating cool air mass and an overriding warm air mass.
Warm Front
• Clouds and weather are at and ahead the advancing warm front.• Precipitation consists of steady rain or snow and usually no
thunderstorm activity - although thunderstorms may be embedded within the frontal area and hard to discern on satellite pictures.
• Fog is frequently found in the cooler air ahead of the warm front.
Warm fronts have extremely shallow slopes.
Warm front
Fogwarmcool
Occluded Front
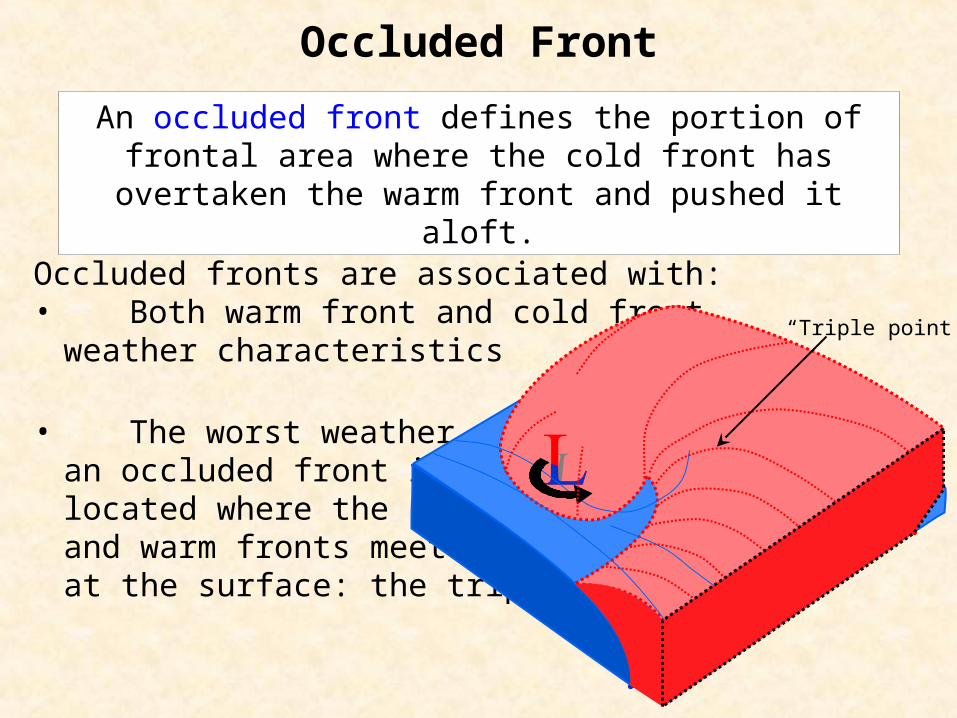
Occluded fronts are associated with:• Both warm front and cold front
weather characteristics
• The worst weather withan occluded front islocated where the coldand warm fronts meetat the surface: the triple point.
An occluded front defines the portion of frontal area where the cold front has overtaken the warm front and pushed it aloft.
“Triple point”

Occluded Front
There are two types of occluded fronts: warm, and cold.
Warm occlusions:• Milder maritime polar (mP) air overtakes
colder continental polar (cP) air.• Warm occlusion weather is similar to
that of a warm front.• More steady, less showery precipitation.
Cold occlusions:• Colder cP air overtaking milder mP air.• Cold occlusion weather resembles warm
frontal weather before the front passage,and cold frontal weather during and afterpassage.
Cold occlusion
Warm occlusion
cool
cold
cold
cool
warm
warm

Stationary Front
A stationary front has essentially no movement (the advancing cold front has “stalled out”).
Cool Warm
North
Stationary fronts are associated with:• East-west orientation.• Normally clear to partly
cloudy skies.• Normally little or no
precipitation.

Stationary Front
Stationary fronts:• Normally have “good” weather
associated with them.
Exceptions:• If a new pulse of cold air moves in from
the north, the cold front can begin to advance and a new low can form on the frontal boundary.
• If warm, moist air overruns the frontal boundary, widespread cloudiness and light precipitation can cover a vast area.
Stationary Front
Warmmoist
Overrunning

Pressure Systems
There are two types of pressure systems: Highs and Lows
A “high,”or anticyclone, is an area of high pressure around which the winds blow clockwise in the northern hemisphere (counterclockwise in the southern hemisphere.) High pressure is associated with sinking, more dense air.
A “low,”or cyclone, is an area of low pressure around which the winds blow counterclockwise in the northern hemisphere (clockwise in the southern hemisphere.) Low pressure is associated with rising, less dense air.
H
L

Pressure Measurements
The amount of force exerted by air molecules over a given area of the earth’s surface is called atmospheric pressure (or “air pressure.”)When the density of the air increases, pressure goes up. When density decreases, pressure goes down.
Barometers are used to measure pressure in different units:
• Hectopascals (hPa) - Measured to the 1/10 (ex. 1018.8 hPa) (1 Hectopascal = 1 millibar)
• Inches of mercury - measured to the 1/100 (ex. 29.92 ins)
The most common type of barometer is called an “aneroid barometer.”

Pressure Systems
High pressure is normally associated with “good” weather:
• Clear or clearing skies, no precipitation, light winds (away from terrain effects).
Low pressure is normally associated with “unsettled” weather:
• Cloudy skies, precipitation, gusty winds.
Barometers are used to measure pressure in different units:
• Hectopascals (hPa) - Measured to the 1/10 (ex. 1018.8 hPa) (1 Hectopascal = 1 millibar)
• Inches of mercury - measured to the 1/100 (ex. 29.92 ins)
Pressure Systems: Isobars
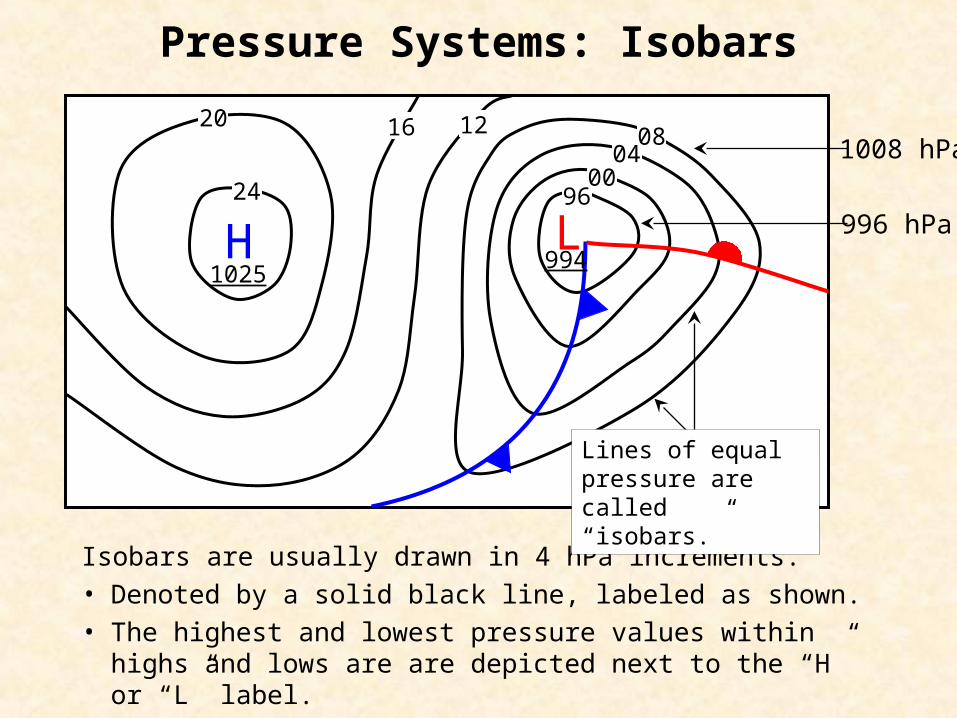
Isobars are usually drawn in 4 hPa increments.
• Denoted by a solid black line, labeled as shown.
• The highest and lowest pressure values within highs and lows are are depicted next to the “H” or “L” label.
H L96
0004
081220
24
16
9941025
Lines of equal pressure are called “isobars.”
1008 hPa
996 hPa

Pressure Systems and Fronts
Pressure systems and fronts have a direct relationship
(time)
L
(Cold)
(Warm)
(Cool)
As the system develops, the position of the low moves away from the cold
and warm fronts.
H
LCold
air mass(e.g, cP) Warm
air mass(e.g, mT)
Cool air mass
A low pressure area forms where the cold and warm front meet.
H
High pressure defined by the air mass “moving in”
Pressure Systems
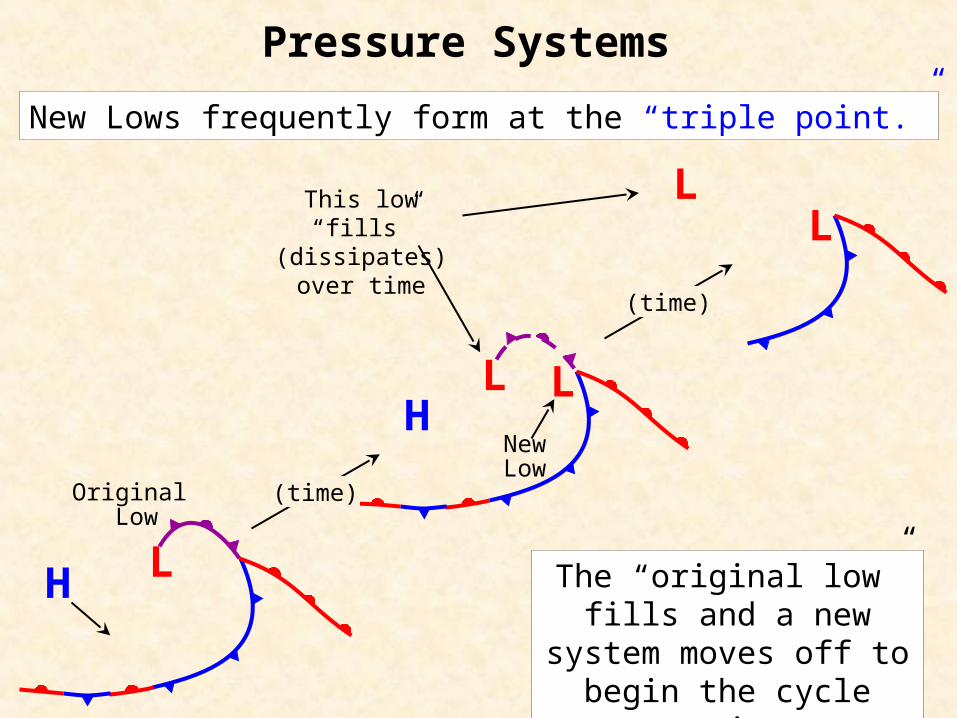
New Lows frequently form at the “triple point.”
LL
The “original low” fills and a new system moves off to
begin the cycle again.
L LNewLow
This low “fills” (dissipates) over time
(time)
H
L
Original Low
(time)
H
Wind
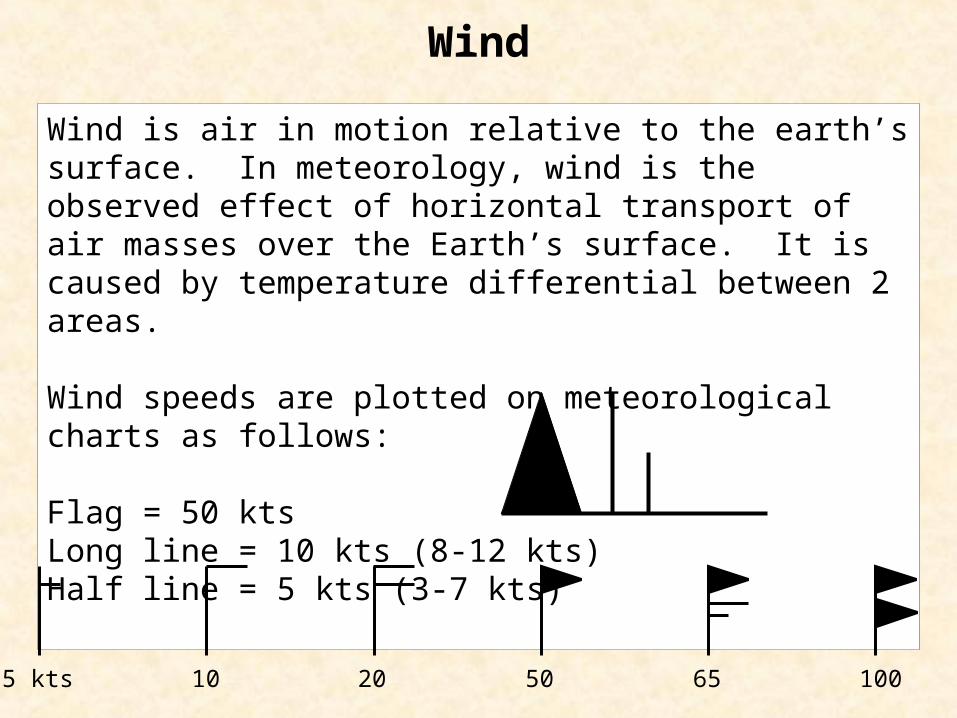
Wind is air in motion relative to the earth’s surface. In meteorology, wind is the observed effect of horizontal transport of air masses over the Earth’s surface. It is caused by temperature differential between 2 areas.
Wind speeds are plotted on meteorological charts as follows:
Flag = 50 ktsLong line = 10 kts (8-12 kts)Half line = 5 kts (3-7 kts)
5 kts 10 20 50 65 100

Wind Speed Scales - Beaufort ScaleSEAS
WIND AND SEA SCALE FOR FULLY ARISEN SEA WIND Wave Height (feet)
Sea
Sta
te
Notes: 1 – For hurricane winds (and often whole gale and storm winds) Required durations and fetches are rarely attained. Seas are therefore not fully arisen. 2 – For such high winds, the seas are confused. The wave crests blow aft and the water and air mix.
SEA – GENERAL CONDITION
Bea
ufor
t Win
d Fo
rce
Des
crip
tion
Ran
ge (
kts)
Win
d V
eloc
ity (
kts)
Ave
rage
Sig
nifi
cant
Ave
rage
1/1
0 H
ighe
st
Sig
nifi
cant
Ran
ge o
fP
erio
ds (
Seco
nds)
(Per
iod
of M
axim
umE
nerg
y of
Spe
ctru
m)
Ave
rage
Per
iod
(Sec
onds
)
Ave
rage
Wav
e L
engt
h(F
eet)
Min
imum
Fet
ch(N
auti
cal M
iles)
Min
imum
Dur
atio
n(H
ours
)
0 Sea like a mirror U Calm < 1 0 0 0 0 --- --- --- --- --- ---Ripples with appearance of scales formed; without foam crests 1 Light Airs 1 – 3 2 0.05 0.08 0.10 1.2 0.7 0.5 .83 5 18 minSmall wavelets, short but more pronounced; crests have glassy appearance, 2 Light 4 – 6 5 0.18 0.29 0.37 0.4 – 2.8 2 1.4 6.7 8 39 min
1 do not break. BreezeLarge wavelets, crests begin to break. Foam of glassy appearance. Perhaps 3 Gentle 7 – 10 8.5 0.6 1.0 1.2 0.8 – 5.0 3.4 2.4 20 9.8 1.7 hrsscattered white horses. Breeze 10 0.88 1.4 1.8 1.0 – 6.0 4 2.9 27 10 2.4
12 1.4 2.2 2.8 1.0 – 7.0 4.8 3.4 40 18 3.82 Small waves, becoming larger; fairly frequent white horses. 4 Moderate 11 – 16 13.5 1.8 2.9 3.7 1.4 – 7.6 5.4 3.9 52 24 4.8
Breeze 14 2.0 3.3 4.2 1.5 – 7.8 5.6 4 59 28 5.23 16 2.9 4.6 5.8 2.0 – 8.8 6.5 4.6 71 40 6.6
18 3.8 6.1 7.8 2.5 – 10 7.2 5.1 90 55 8.34 Moderate waves, becoming larger; fairly frequent white horses. 5 Fresh 17 – 21 19 4.3 6.9 8.7 2.8 – 10.6 7.7 5.4 99 65 9.2
Breeze 20 5.0 8.0 10 3 – 11.1 8.1 5.7 111 75 105 22 6.4 10 13 3.4 – 12.2 8.9 6.3 134 100 12
Large waves begin to form; white foam crests more extensive everywhere, 6 Strong 22 – 27 24 7.9 12 16 3.7 – 13.5 9.7 6.8 160 130 14probably some spray. Breeze 24.5 8.2 13 17 3.8 – 13.6 9.9 7 164 140 15
6 26 9.6 15 20 4 – 14.5 10.5 7.4 188 180 1728 11 18 23 4.5 – 15.5 11.3 7.9 212 230 20
Sea heaps up and white foam from streaking waves begins to be blown 7 Moderate 28 – 33 30 14 22 26 4.7 – 16.7 12.1 8.6 250 280 23in streaks along the direction of the wind (spindrift begins to be seen). Gale 30.5 14 23 29 4.8 – 17 12.4 8.7 258 290 24
32 16 26 33 5 – 17.5 12.9 9.1 285 340 2734 19 30 38 5.5 – 18.5 13.6 9.7 322 420 30
7 Moderately high waves of greater length; edges of crests break into spindrift. Foam 8 Fresh 34 – 40 36 21 35 44 5.8 – 19.7 14.5 10.3 363 500 34blown in well marked streaks along direction of wind. Spray affects visibility. Gale 37 23 37 46.7 6 – 20.5 14.9 10.5 376 530 37
38 25 40 50 6.2 – 20.8 15.4 10.7 392 600 3840 28 45 58 6.5 – 21.7 16.1 11.4 444 710 42
High waves. Dense streaks of foam along direction of the wind. Sea begins to roll, 9 Strong 41 – 47 42 31 50 64 7 – 23 17 12.0 492 830 478 visibility affected. Gale 44 36 58 73 7 – 24.2 17.7 12.5 534 960 52
46 40 64 81 7 – 25 18.6 13.1 590 1100 5748 44 71 90 7.5 – 26 19.4 13.8 650 1250 63
Very high waves with long overhanging crests. Resulting foam in great patches and 10 Whole 48 – 55 50 49 78 99 7.5 – 27 20.2 14.3 700 1420 69is blown in dense white streaks along direction of wind. Sea surface takes on white Gale1 51.5 52 83 106 8 – 28.2 20.8 14.7 736 1560 73appearance. Rolling of sea becomes heavy and shock-like. Visibility affected. 52 54 87 110 8 – 28.5 21 14.8 750 1610 75
9 54 59 95 121 8 – 29.5 21.8 15.4 810 1800 81Exceptionally high waves (small and medium-sized ships may become lost to view 56 64 103 130 8.5 - 31 22.6 16.3 910 2100 88behind waves). Sea completely covered with long white patches of foam lying along 11 Storm1 56 – 63 59.5 73 116 148 10 – 32 24 17 985 2500 101direction of wind. Edges of wave crests are blown into froth. Visibility affected.Air filled with foam and spray. Sea completely white with driven spray. Visibility 12 Hurricane1 64 – 71 > 64 > 802 > 1282 > 1642 (35) (26) (18) --- --- ---very seriously affected.
<
The Beaufort Scale defines seas (and sea state) according to wind speeds
The Beaufort Scale defines seas (and sea state) according to wind speeds

Wind Speed Scales
Wind speeds not associated with tropical systems (World Meteorological Organization).
4 - 27 kts = breeze (light, gentle, moderate, fresh, strong). 28 - 33 kts = near gale.34 - 47 kts = gale (gale, strong).48 - 63 kts = storm (storm, violent).64 kts and greater = hurricane force.
Wind speeds associated with tropical systems.Less than 34 kts = Tropical Depression. 34 - 63 kts = Tropical Storm.64 - 129 kts = Hurricane.Greater than 130 kts = Super Hurricane.

Pressure Systems: Isobars
H L96
0004
081220
24
16
9941025
Wind barbs define wind direction and speed on a synoptic chart...
…and also help define frontal boundaries
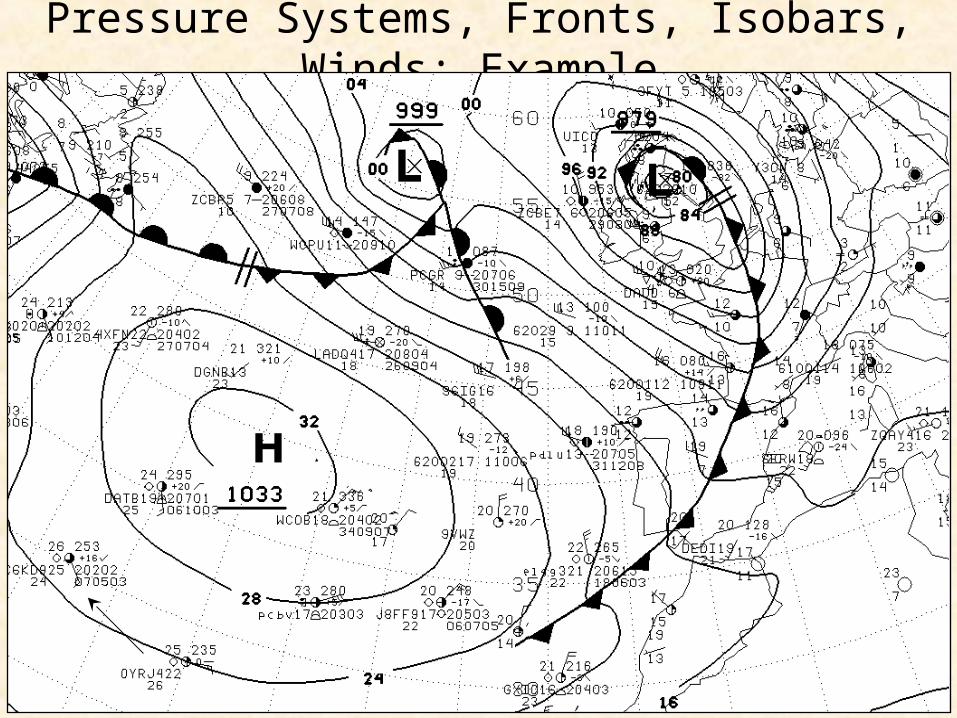
Pressure Systems, Fronts, Isobars, Winds: Example
Clouds
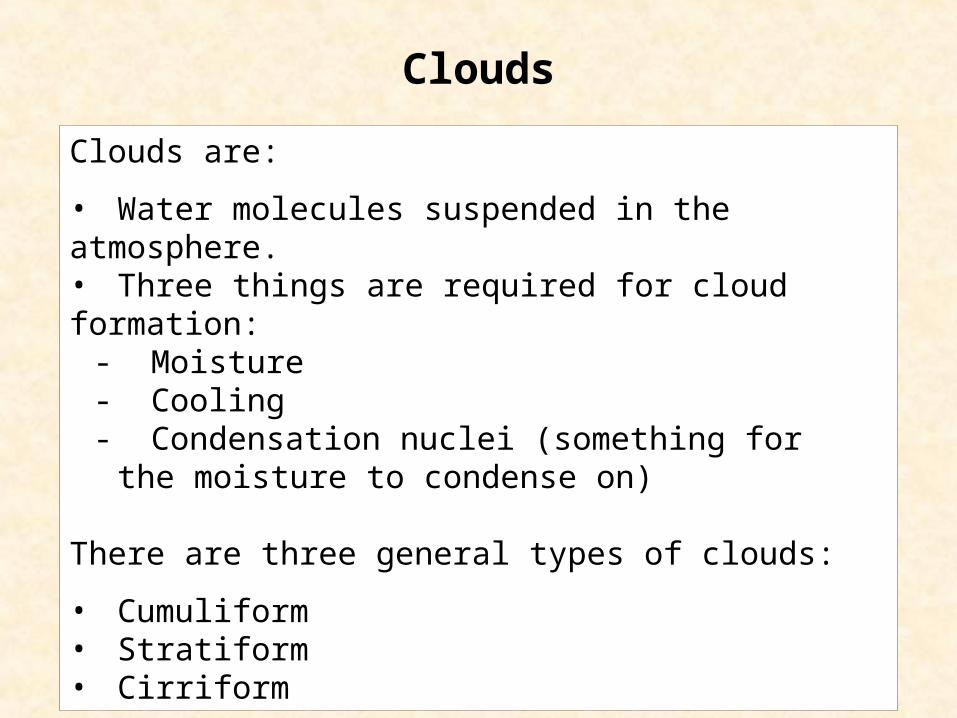
Clouds are:
• Water molecules suspended in the atmosphere. • Three things are required for cloud formation:
- Moisture- Cooling- Condensation nuclei (something for
the moisture to condense on)
There are three general types of clouds:
• Cumuliform• Stratiform• Cirriform

Cumuliform Clouds
Cumuliform clouds are unstable, vertically developed, and have generally distinct edges. They are formed either by convective action (daytime heating) or mechanical lifting (cold front). Showery precipitation is associated with cumuliform clouds. Cumulonimbus clouds are clouds with extreme vertical extent and are associated with heavy precipitation and thunderstorms.
Stratiform clouds are stable and form indistinct layers. Steady, light precipitation is associated with stratiform clouds. A particular form of stratiform clouds, nimbostratus, is associated with heavy, steady precipitation. Fog is nothing more than a form of straitiform clouds (stratus) that has reached the ground.
Cirriform clouds are located at higher altitudes and are composed completely of ice crystals.
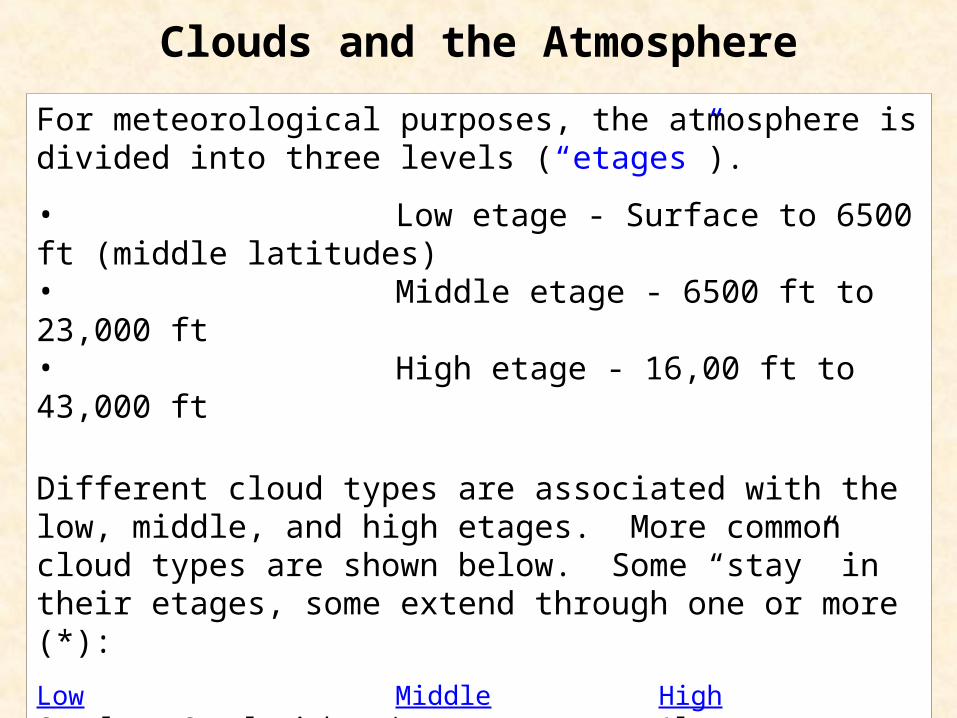
For meteorological purposes, the atmosphere is divided into three levels (“etages”).
• Low etage - Surface to 6500 ft (middle latitudes)• Middle etage - 6500 ft to 23,000 ft• High etage - 16,00 ft to 43,000 ft
Different cloud types are associated with the low, middle, and high etages. More common cloud types are shown below. Some “stay” in their etages, some extend through one or more (*):
Low Middle HighCumulus, Cumulonimbus * Altostratus CirrusStratocumulus Altocumulus CirrocumulusStratus Nimbostratus * Cirrostratus
(Cumulonimbus begins in the low etage and builds into the mid and high etages)(Nimbostratus frequently begins as a “mid” cloud and descends into the low etage)
Clouds and the Atmosphere
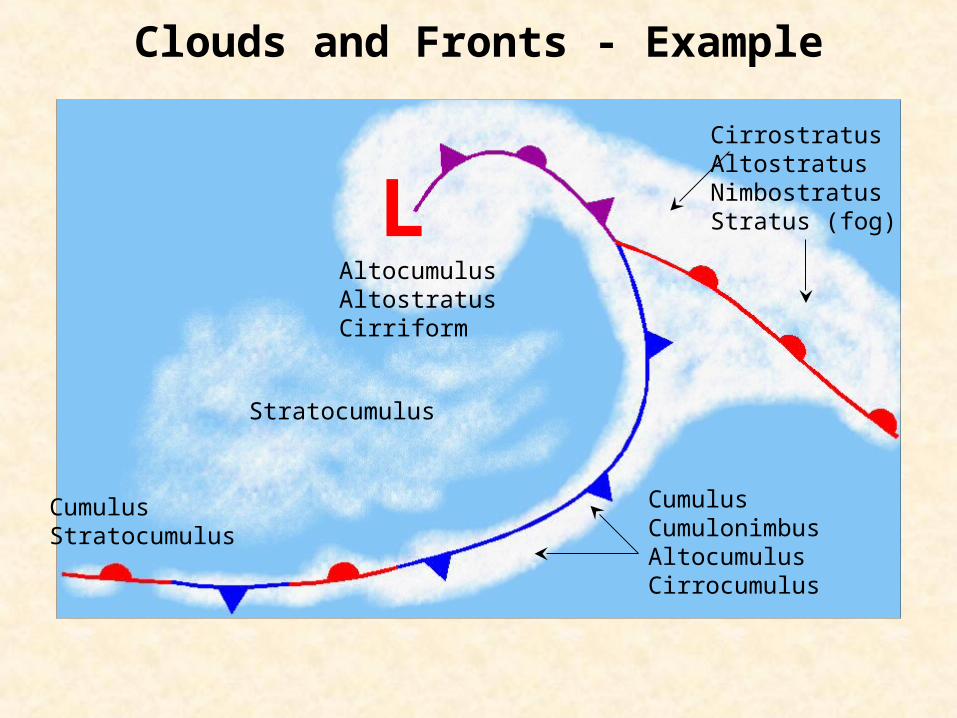
Clouds and Fronts - Example
LCirrostratusAltostratusNimbostratusStratus (fog)
AltocumulusAltostratusCirriform
Stratocumulus
CumulusStratocumulus
CumulusCumulonimbusAltocumulusCirrocumulus

The End…


