

Near Earth Asteroids Long Term Impact Monitoring: Difficult but Necessary
F. Bernardi1,2, A. Milani², G. B. Valsecchi¹, S. R. Chesley³, M. E. Sansaturio4, O. Arratia4
¹IASF-Roma, INAF, Italy²University of Pisa, Italy
³Jet Propulsion Laboratory, U.S.A.4University of Valladolid, Spain

Current impact monitoring
It is about 15 years since NASA and the astronomical community are involved into the search and monitoring of Near Earth Asteroids (NEA) and comets that can potentially hit the Earth
In all world there are two independent impact monitoring systems: CLOMON2 of NEODyS in Pisa and a duplicate in Spain Sentry of JPL in Pasadena, CA, USA
The two systems monitor the impact hazard for our planet for the next 80-90 years, determining the Impact Probability (IP) for each NEA
http://newton.dm.unipi.it/neodys
http://neo.jpl.nasa.gov/risk/

Current impact monitoring:direct hits
Direct hits, i.e. collisions taking place without intervening planetary approaches, are easier to spot than resonant and non-resonant returns
Probabilities are comparatively higher
Deflections are more expensive in terms of Δv
Deflection decisions are comparatively easier to take (if time allows)

Current impact monitoring:resonant returns
Resonant and non-resonant returns are less easy to spot than direct hits
Probabilities are comparatively lower
Deflections are (generally) less expensive in terms of Δv
Deflection decisions are less easy to take, as much better orbital information is needed (see Apophis), but more time may be available
Current impact monitoring:resonant returns
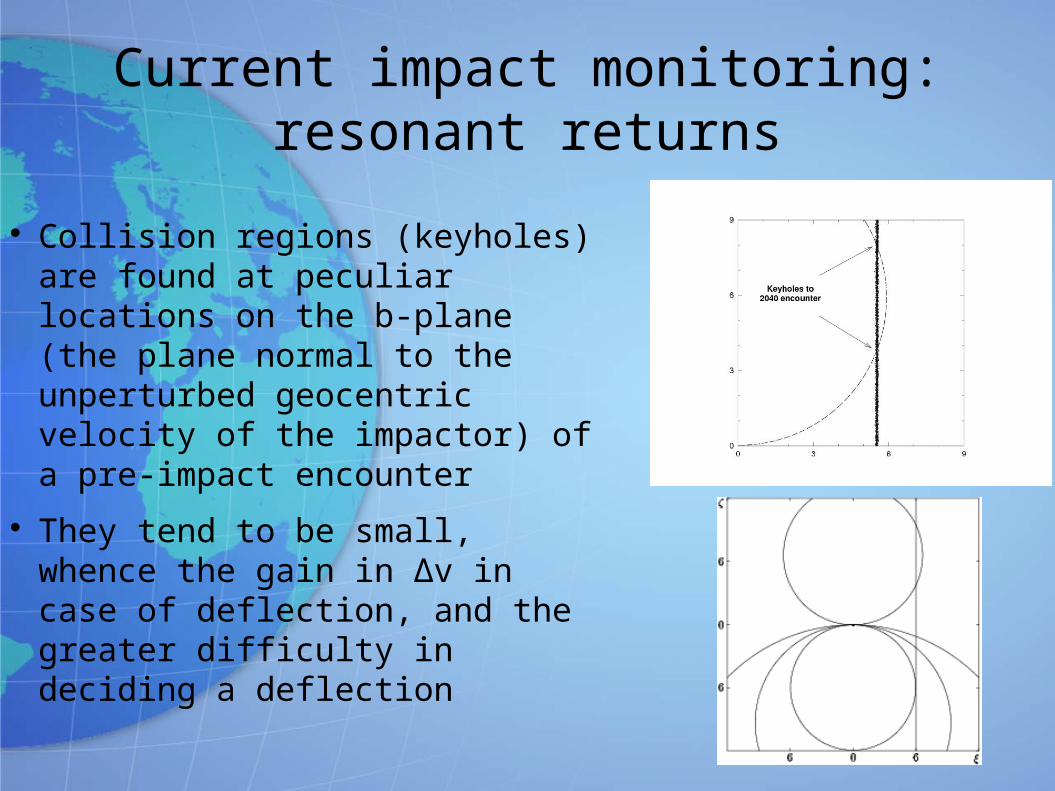
Collision regions (keyholes) are found at peculiar locations on the b-plane (the plane normal to the unperturbed geocentric velocity of the impactor) of a pre-impact encounter
They tend to be small, whence the gain in Δv in case of deflection, and the greater difficulty in deciding a deflection

Future impact monitoring
For large impactors, current impact monitoring may not give sufficient advance time for deflection
If Δt is the number of years between deflection and collision, Ahrens and Harris (1992, 1994) estimate that, to avoid a direct hit, the needed Δv in m/s is 0.07/Δt
So, the longer our predictability horizon, the easier the deflections
How far could/should we push the predictability horizon?

The problems
We have basically two problems: chaos and dynamical model
Chaos: encounter sequences lead to multiplicative accumulation of the along-track separation from each encounter (i.e., to exponential divergence and chaos) with maximum Lyapounov exponent proportional to encounter frequency
So, no matter how precisely determined is a NEA orbit, after sufficient time we are led to a situation resembling that of a newly discovered NEA, with all the uncertainty concentrated along-track

The problems
Dynamical model: given the sensitivity of encounter outcomes to small changes in the initial conditions, the possibility to extend the predictability horizon for a NEA, beyond a certain date, depends from the accurate modelling of so-far neglected non-gravitational perturbations like the Yarkovsky effect
We have selected (101955) 1999 RQ36
, a NEA with a very
well determined orbit, to test the possibility of extending the predictability horizon (see Milani et al. 2009 for details)

The problems
Note: The non-gravitational effect called Yarkovsky effect is due to the solar radiation that is re-emitted through thermal radiation in a different direction, because the object is rotating and because the material has thermal inertia

(101955) 1999 RQ36
(101955) 1999 RQ36
has the lowest formal uncertainty in
semimajor axis at epoch of any asteroid: 5 m
The Yarkovsky effect causes a change of the semimajor axis of the order of 200 m/y for this asteroid
Orbits determined accounting for the Yarkovsky effect differ from the purely gravitational solution by about 40 times more than the formal uncertainty
Very long propagations could be within the predictability horizon in a purely gravitational model, but non-gravitational effects make this horizon closer

(101955) 1999 RQ36
Time evolution of the Minimum Orbit Intersection Distance (MOID) for (101955) 1999 RQ
36
The MOID is less than the effective radius of the Earth (horizontal lines) many times, between about 2100 and 2230

Monte Carlo runs We have run Monte Carlo (MC) simulations with the method
of Chodas & Yeomans (1999): 500000 MC samples drawn from a 7-dimensional space of initial conditions (6 elements and the Yarkovsky-induced da/dt), and followed until 2200
All MC samples remain close together up to a pair of Earth encounters in 2060 and 2080, after which they become widely scattered
461 MC samples collide with the Earth, giving an Impact Probability (IP) of about 0.00092
272 MC samples collide in 2182; of these, 268 have similar dynamical histories: thus, there is a dynamical route leading to impact in 2182 with an IP of about 0.00054

The 2182 impact
In 2182, the IP is high because the LoV portion close to the Earth is folding, crossing our planet twice close to the fold tip
This means that the along-track separation is very small: something in the previous evolution has refocused the impactors

The 2162 b-plane
The double keyhole for impact in 2182 seen on the b-plane of the 2162 encounter
The fold tip is marked in red
The green circle shows the size of the lunar orbit
The along-track size of the two keyholes are 187 and 118 Earth radii: the keyhole is larger than the door!

The 2182 impact
Time evolution of the stretching (essentially, the along-track separation) for a typical 2182 impactor
In 2182 the stretching has come back near the value it had almost a century before
Consequence: an along-track deflection would have to be attempted no later than 2080

Conclusions
Long-term impact monitoring is doable, provided we determine the Yarkovsky drift in individual cases
NEAs whose MOIDs are small and decreasing in the next few centuries have to be carefully monitored
Question: how typical is 1999 RQ36
?
....2001WN5....
see “Long term impact risk for (101955) 1999 RQ36
”
Milani et al. 2009, submitted to Icarus

Extra slides

Yarkovsky parameters
The χ2 of the least squares fit to the value of da/dt
The quadratic approximation for the χ2 is obtained by a parabola fit to 5 data points (the asterisks)
The horizontal line corresponds to a 90% confidence level for the fit

Monte Carlo runs
Above: a subset of our MC samples plotted in the plane da/dt in AU/Myr vs a-1.1 AU at epoch 2081-Jan-01.0
Below: the orbits leading to an impact
The star represents the purely gravitational solution

The folds of the 2162 encounter
The relevant LoV portion 5 months after the September 2162 encounter with Earth (blue sphere)
The yellow sphere marks the LoV segment where the 2182 impactors are located
The nearby fold reaches the yellow sphere exactly in time for the 2182 impact


