
1
THIS REPORT CONTAINS ASSESSMENTS OF COMMODITY AND TRADE ISSUES MADE BY
USDA STAFF AND NOT NECESSARILY STATEMENTS OF OFFICIAL U.S. GOVERNMENT
POLICY
Date:
GAIN Report Number:
Approved By:
Prepared By:
Report Highlights:
New Zealand’s imports of consumer-oriented food products have trended upward over the past several
years. Australia is the leading supplier with a 35 percent market share, followed by the United States at
14 percent, and China at 4.6 percent. In 2015, U.S. consumer-oriented food exports reached US$340
million, up from US$193 million in 2010. The top U.S. exports included: food preparations, pet food,
almonds, fresh grapes, fresh oranges, walnuts, sauces, and tomato paste. High quality, price
competitive products with innovative packaging and unique features tend to do well in the New Zealand
market.
Vinita Sharma, Marketing Specialist
Sarah Hanson, Agricultural Counselor
2016
Exporter Guide
New Zealand
NZ1606
12/19/2016
Required Report - public distribution

2
SECTION I: MARKET OVERVIEW
New Zealand lies in the southwest Pacific Ocean, consisting of two main islands and several smaller
islands. It is comparable in size to Japan and has a population of 4.65 million people. It is a largely
urbanized society with over half of the population residing in the four largest cities of Auckland,
Wellington, Christchurch and Hamilton. According to Statistics New Zealand, approximately one-third
of New Zealanders live in Auckland. The majority of New Zealanders are of European descent, but the
country has an increasingly multi-cultural population.
Economic Indicators
2012 2013 2014 2015
Population 4.45million 4.50 million 4.55 million 4.65 million
Per Capita GDP (US$) 32,352 33,287 34,211 33,934
GDP Growth (%) 1.9 2.3 3.2 3.6
Unemployment Rate (%) 6.8 5.9 5.7 5.3
Consumer Price Inflation (%) 0.9 1.6 0.8 0.1
Food Price Inflation (%) -1.0 1.5 1.0 -1.3
Note: The New Zealand financial year begins in April.
Source: Stats New Zealand, Reserve Bank of New Zealand and Global Trade Atlas.
New Zealand is a prosperous country that is heavily reliant on trade. It is highly dependent on the
primary sector with agricultural products accounting for approximately 55% of total exports. The figure
increases to 65% when forestry and seafood are included. An estimated 80-90% of New Zealand’s
primary production is exported.
New Zealand culture values fairness, ingenuity, practicality, modesty, restraint and informality. English
is the everyday language, but Māori and sign language are also recognized as official languages. New
Zealand is consistently rated in the top four for freedom from corruption by Transparency International,
as reported in the Chapman Tripp Guide for Investors, September 2016 report. New Zealand has a
common legal system based on the British model with an independent judiciary. It has a stable
parliamentary democracy with a proportional voting system which tends to produce coalition
governments. The two major parties, which would generally lead a coalition government, are National
at the conservative end of the spectrum and Labour at the liberal end.
New Zealand is generally regarded as a safe place to invest and do business. It is currently ranked first
of 189 countries by the World Bank for ease of starting a new business and for protecting minority
investors and second for ease of doing business. The publication ‘Doing Business in New Zealand’
gives a useful broad overview on business practices in New Zealand (source, Chapman Tripp Guide for
Investors, Sept. 2016).
US and New Zealand: Bilateral Total Agricultural Exports
(US Dollars)
2010 2011 2012 2013 2014 2015
US Exports to NZ (millions) $252.4 $298.2 $385.3 $424.3 $481.5 $428.3

3
NZ Exports to US (millions) $1,671.6 $2,008.3 $2,243.8 $2,151.9 $2,685.9 $2,809.6
Note: Year ending December
Source: Global Trade Atlas
China is New Zealand’s top destination for agricultural, forestry and fishery exports followed by the
United States and Australia. Leading exports include beef meat, dairy products (milk protein
concentrate, casein, and caseinates), wine, sheep meat, lumber, fresh apples, and kiwifruit. By contrast,
New Zealand ranks as the 46th
largest market for U.S. agricultural exports. Leading U.S. agricultural
exports to the New Zealand market include food preparations, lactose products, pet food, frozen pork,
almonds, animal feed, fresh grapes, fresh oranges, whey and milk products, nuts, citrus fruits and stone
fruit.
New Zealand is the largest market for U.S. lactose products, sixth largest market for U.S. pet food, the
seventh largest for U.S. fresh stone fruits (peaches, plums and nectarines) and the twelfth largest
market for fresh oranges.
Consumer-Oriented Food Product Trade
As shown in the graph below, New Zealand’s imports of consumer-oriented agricultural products have
trended upward over the past several years. In 2015, U.S. exports of consumer-oriented food products
to New Zealand were US$340 million, in comparison US$193 million in 2010. Australia is the leading
supplier of consumer-oriented food products with a 35 percent market share, followed by the United
States at 14 percent and China at 4.6 percent.
Leading consumer-oriented imports from Australia include: food preparations, bread/pastry products,
wine, cocoa products, non-alcoholic beverages, cereal products, sauces, pet food, chocolate and frozen
meat. Leading imports from the United States include lactose, food preparations, pet food, almonds,
fresh grapes, fresh oranges, walnuts, and prepared foods (sauces/tomato paste). Top imports from
China include sugar confectionery products, bread/pastry products, food preparations, vegetable oil,
wood products, shrimp and peanuts (Source: Global Trade Atlas).

4
Source: Global Trade Atlas
Advantages and Challenges for U.S. Consumer Food Exporters
Advantages
Challenges
Familiar business and cultural
environment and no language barriers
New Zealand labeling laws are different from those in the
U.S.
U.S. products tend to enjoy a quality
reputation along with novelty status
Growing competition from Malaysia and China in the
consumer-oriented food category
Minimum barriers to trade including low
tariffs ranging between zero and 5%
Strict phytosanitary/sanitary regulations with regard to fresh
produce and meats
Opportunities to market U.S. fresh
products during New Zealand’s off-
season due to the counter seasonal nature
of the markets
Consumer foods imported from Australia are duty free,
while U.S. products are assessed tariffs between zero and
5%. Some Canadian products have preferential tariff
treatment. Some supermarkets make individual
buying decisions
Ease of doing business and size of
market make it a good fit for new-to-
export and small to medium U.S.
companies
New Zealand retail market is highly consolidated and
dominated by two supermarket chains
NZ practices a science-based approach to
trade
Distance from United States results in high transportation
costs

5

6
SECTION II: EXPORTER BUSINESS TIPS
New Zealand is a well-developed market. Establishing good working relationships with
importers/distributors is the key to entering the New Zealand marketplace. Approximately 90
percent of all imported food products are purchased and distributed within New Zealand by
importers/distributors.
New Zealand supermarkets mainly purchase imported products from importers and distributors
rather than importing directly. In the case of Foodstuffs (NZ) Limited, interested U.S. exporters
should contact each of the regional offices directly as they can make buying decisions
independently (See Section V for contact information).
Tariffs assessed on U.S. food products range from zero to 5 percent. Tariff rates can be checked
at on the New Zealand Customs website: New Zealand Working Tariff Document
The cost of international freight can be a fairly significant percentage of the final cost of a
product. U.S. exporters can contact freight forwarders in the United States to determine
transportation cost. New Zealand importers and distributors can arrange shipment with the help
of customs brokers in New Zealand.
For complete guide on import duties and charges, please check this link: New Zealand Customs
duties and charges.
High quality products with innovative packaging and unique features that are price competitive
tend to do well in the New Zealand market.
Fresh U.S. produce is an especially welcome addition to New Zealand retail shelves during
winter in the Southern Hemisphere.
Innovative, environmentally-friendly packaging has an advantage in retail food products.
New Zealand has very strict biosecurity rules to protect New Zealand agriculture and forestry
industry. Unprocessed products cannot be imported into New Zealand unless an import health
standard has been developed for that product. Import Health Standards specify the biosecurity
requirements that must be met for trade to occur. Import Health Standard database can be seen
at https://www.mpi.govt.nz/law-and-policy/requirements/import-health-standards/.
All imported foods must comply with all aspects of Food Act and Food Standards Code at the
point of entry into New Zealand. The Ministry of Agriculture performs random inspections on
any food imported. High-risk foods can be targeted for inspection at a higher frequency.
Food Standards and Regulations

7
New Zealand has strict food standards and labeling requirements that are set out in the Food Standards
Australia New Zealand Code. U.S. exporters are encouraged to review the Food and Agriculture Import
Regulations and Standards (FAIRS) report and FAIRS Export Certificate Report for New Zealand,
which contains detailed information on New Zealand’s food standards, labeling requirements, and
import regulations. This report can be viewed at the following site:
http://www.fas.usda.gov/scriptsw/attacherep/default.htm.
Trade Shows in New Zealand
There is one major international food show in New Zealand:
Fine Food Show (June 24-26, 2018, Auckland)
The Fine Food New Zealand show was first organized in 2010. It followed the same format as Fine
Food Australia, which has been running successfully for many years in the alternating locations of
Sydney and Melbourne. Fine Food New Zealand is an international event and attracts companies from
Europe, Australia, Asia and New Zealand. This show focuses on food and beverage, as well as
hospitality products. It is a trade-only event and is restricted to persons in the food, drink, equipment
and hotel and supermarket trades. It is a biennial trade show; the next trade show will take place from
June 24-26, 2018.
Contact:
Fine Food Show New Zealand
1 Redmond Street, Ponsonby
Auckland, 1011, New Zealand.
Attention: Lorraine Smith, Exhibition Sales Manager
Tel: +64-9-555-1141; Email: [email protected]
SECTION III: MARKET STRUCTURE AND TRENDS
MARKET STRUCTURE
Retail Grocery Sector
The retail grocery market in New Zealand is well-developed with supermarkets, small-scale grocery
stores, fresh food specialty stores and convenience stores in all of the major population centers. Two
supermarket chains, Foodstuffs (NZ) Limited (Ltd) and Progressive Enterprises Limited, dominate the
New Zealand retail sector. Foodstuffs (NZ) Ltd has an estimated 55 percent share of the New Zealand
grocery market and Progressive Enterprises has an estimated 43 percent share. Progressive Enterprises
Limited, a subsidiary of the Australian company Woolworths Limited, has a 43 percent share of the
New Zealand grocery market.
Progressive Enterprises has: 171 Countdown, 22 Woolworths Micro, and Quickstop convenience stores.
Foodstuffs (NZ) Limited has 722 stores including 139 New World, 50 Pak N Save, 282 Four Square,

8
147 On the Spot, three Write Price, two Shoprite, 78 Liquorland, three Reward Fresh Food, and 18
Henry’s Beer and Wine stores. The organization is comprised of two cooperatives: Foodstuffs North
Island Limited, and Foodstuffs South Island Limited. Interested U.S. exporters should contact each of
the regional Foodstuffs offices as they make some buying decisions independently of each other.
(Please see Section V for contact information.)
New Zealand Retail Market Distribution
Supermarket
Group
Ownership Market
Share
Store Names
Foodstuffs (NZ)
Limited
New Zealand owned; made up
of three independently owned
co-operatives
55%
New World- Full service
supermarkets
Pak’n’Save-
Foodbarn/retail food
warehouses
Write Price-
Foodbarn/retail food
warehouses
Four Square-
Convenience grocery
stores
On the Spot- Convenience
stores
Progressive
Enterprises
Limited
Owned by Woolworths Limited
(Australia)
43%
Woolworth- Full service
supermarkets
Woolworth Quick &
Micro- Convenience
stores
Independent
Grocery Stores
New Zealand Owned 2% Ethnic Shops
Asian Grocery stores
Independent Green
Grocers
U.S. exporters interested in supplying the New Zealand market can work with importers, distributors or
import brokers that target food category/merchandise managers at major wholesalers and supermarket
chains. Indicative gross margins (as a guide only) for New Zealand importers/distributors are as
follows:
Importers: 5-20% gross margin of wholesale value
Distributors 10-30% gross margin of the wholesale value (at higher end if distributor is funding
promotional activities)
Supermarkets 15-20% of the wholesale value (depending on the category)
Independent
Grocers
30-40% gross margin of the wholesale value
9
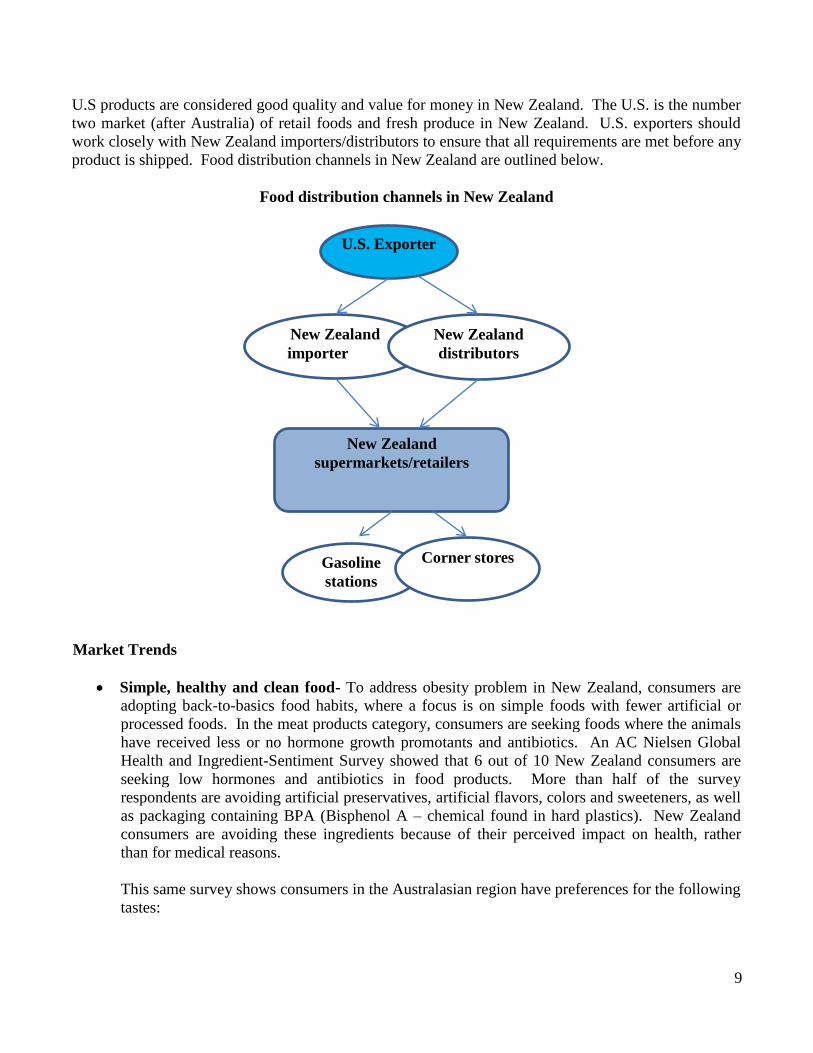
U.S products are considered good quality and value for money in New Zealand. The U.S. is the number
two market (after Australia) of retail foods and fresh produce in New Zealand. U.S. exporters should
work closely with New Zealand importers/distributors to ensure that all requirements are met before any
product is shipped. Food distribution channels in New Zealand are outlined below.
Food distribution channels in New Zealand
Market Trends
Simple, healthy and clean food- To address obesity problem in New Zealand, consumers are
adopting back-to-basics food habits, where a focus is on simple foods with fewer artificial or
processed foods. In the meat products category, consumers are seeking foods where the animals
have received less or no hormone growth promotants and antibiotics. An AC Nielsen Global
Health and Ingredient-Sentiment Survey showed that 6 out of 10 New Zealand consumers are
seeking low hormones and antibiotics in food products. More than half of the survey
respondents are avoiding artificial preservatives, artificial flavors, colors and sweeteners, as well
as packaging containing BPA (Bisphenol A – chemical found in hard plastics). New Zealand
consumers are avoiding these ingredients because of their perceived impact on health, rather
than for medical reasons.
This same survey shows consumers in the Australasian region have preferences for the following
tastes:
U.S. Exporter
New Zealand
importer
New Zealand
distributors
Gasoline
stations
Corner stores
New Zealand
supermarkets/retailers
10
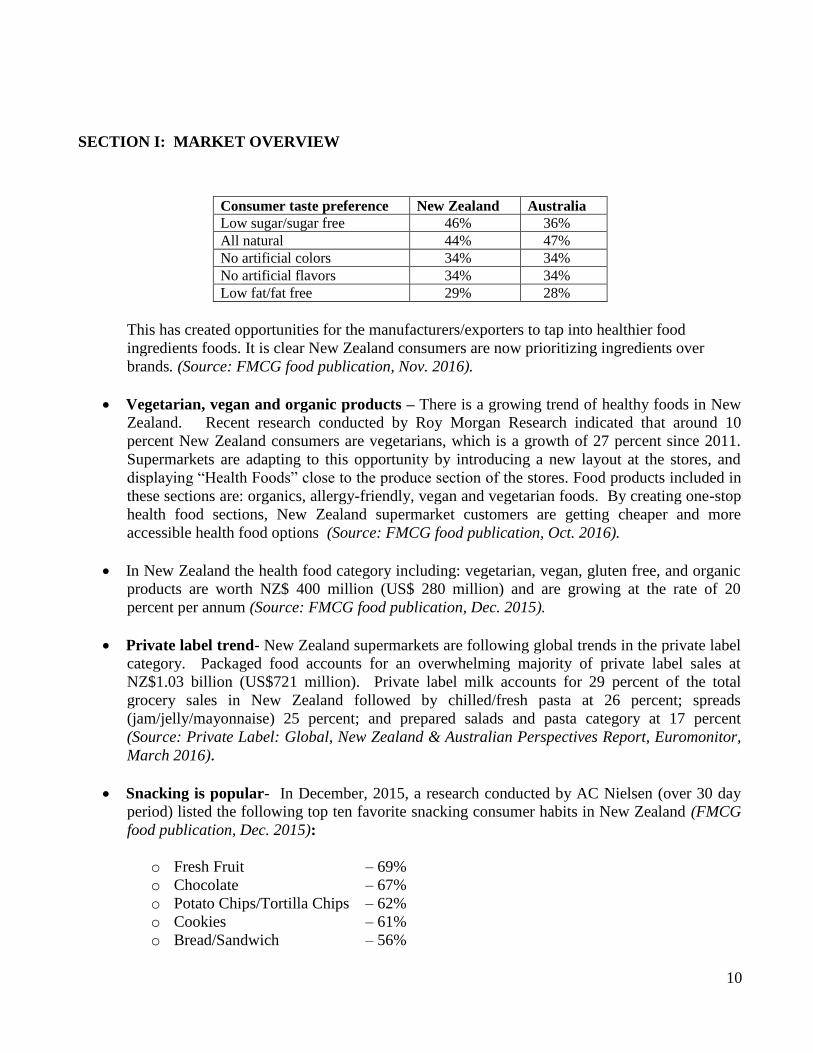
SECTION I: MARKET OVERVIEW
Consumer taste preference New Zealand Australia
Low sugar/sugar free 46% 36%
All natural 44% 47%
No artificial colors 34% 34%
No artificial flavors 34% 34%
Low fat/fat free 29% 28%
This has created opportunities for the manufacturers/exporters to tap into healthier food
ingredients foods. It is clear New Zealand consumers are now prioritizing ingredients over
brands. (Source: FMCG food publication, Nov. 2016).
Vegetarian, vegan and organic products – There is a growing trend of healthy foods in New
Zealand. Recent research conducted by Roy Morgan Research indicated that around 10
percent New Zealand consumers are vegetarians, which is a growth of 27 percent since 2011.
Supermarkets are adapting to this opportunity by introducing a new layout at the stores, and
displaying “Health Foods” close to the produce section of the stores. Food products included in
these sections are: organics, allergy-friendly, vegan and vegetarian foods. By creating one-stop
health food sections, New Zealand supermarket customers are getting cheaper and more
accessible health food options (Source: FMCG food publication, Oct. 2016).
In New Zealand the health food category including: vegetarian, vegan, gluten free, and organic
products are worth NZ$ 400 million (US$ 280 million) and are growing at the rate of 20
percent per annum (Source: FMCG food publication, Dec. 2015).
Private label trend- New Zealand supermarkets are following global trends in the private label
category. Packaged food accounts for an overwhelming majority of private label sales at
NZ$1.03 billion (US$721 million). Private label milk accounts for 29 percent of the total
grocery sales in New Zealand followed by chilled/fresh pasta at 26 percent; spreads
(jam/jelly/mayonnaise) 25 percent; and prepared salads and pasta category at 17 percent
(Source: Private Label: Global, New Zealand & Australian Perspectives Report, Euromonitor,
March 2016).
Snacking is popular- In December, 2015, a research conducted by AC Nielsen (over 30 day
period) listed the following top ten favorite snacking consumer habits in New Zealand (FMCG
food publication, Dec. 2015):
o Fresh Fruit – 69%
o Chocolate – 67%
o Potato Chips/Tortilla Chips – 62%
o Cookies – 61%
o Bread/Sandwich – 56%

11
o Cheese – 56%
o Crackers – 50%
o Nuts/Seeds – 46%
o Vegetable – 44%
o Yogurt – 42%
This research shows an untapped opportunity to gain market share in the nutritious, ready-to-go,
easy-to-eat snacks and meal alternatives.
Pet food market- New Zealand is the sixth largest market for U.S. pet food. In 2015, total pet
food imports were valued at US$162 million in New Zealand. Of this total, Australia held a 44
percent market share, followed by United States at 26 percent, and Chile 9 percent.

12
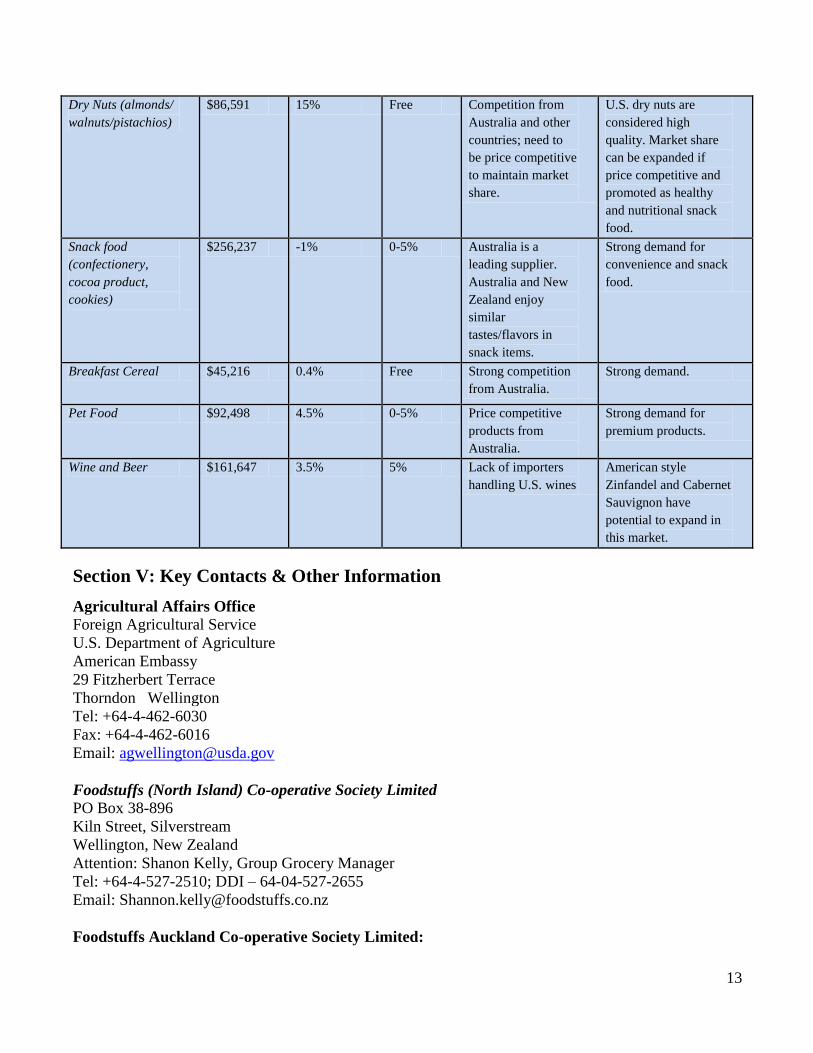
SECTION IV: BEST CONSUMER ORIENTED PRODUCT PROSPECTS FOR U.S.
EXPORTERS
Product
Category
Total
Imports
from
world
2015
5 Year
Average
Annual
Import
Growth
Import
Tariff
Rate
Key
Constraints
over Market
Development
Market
Attractiveness for
U.S.
(US $’000)
Fresh Grapes $28,450 4% Free NZ is a small
market; competition
from Chilean and
Australian grapes.
High growth potential.
Consumers want fruits
to be available year
round.
Fresh Fruits
(apricots, cherries,
peaches, plums)
$2,598 -10% Free Some consumers
have a slightly
negative quality
perception of
imported fresh
fruits.
U.S. can supply
counter-seasonal fruit.
Consumers want fruits
to be available year
round.
Pears $4,542 0.5% Free Consumer
resistance to
unfamiliar varieties.
NZ is one of the first
markets to get the fresh
pear crop.
Citrus Fruit $24,128 1.5% Free Small market New Zealand
consumers appreciate
quality of U.S. citrus.
Fruit and vegetable
Juice
$39,433 -2.54% 0-5% U.S. products are
expensive compared
to products from
some competitor
countries.
Value-added juices/
concentrates with
health and nutritional
benefits have potential
to grow.
Processed Fruits &
Vegetables
$15,842 -3% 0-5% U.S. products are
not always price
competitive with
product from China
and other
competitors.
U.S. has a reputation of
supplying good quality
product. To be
successful, product
must be price
competitive.
Dry Fruit (dates,
figs, raisins)
$27,389 1% Free U.S. is price
competitive in
raisins; faces tough
competition in
dates/figs category.
Expanding demand for
good quality and
healthy foods.
13
Dry Nuts (almonds/
walnuts/pistachios)
$86,591 15% Free Competition from
Australia and other
countries; need to
be price competitive
to maintain market
share.
U.S. dry nuts are
considered high
quality. Market share
can be expanded if
price competitive and
promoted as healthy
and nutritional snack
food.
Snack food
(confectionery,
cocoa product,
cookies)
$256,237 -1% 0-5% Australia is a
leading supplier.
Australia and New
Zealand enjoy
similar
tastes/flavors in
snack items.
Strong demand for
convenience and snack
food.
Breakfast Cereal $45,216 0.4% Free Strong competition
from Australia.
Strong demand.
Pet Food $92,498 4.5% 0-5% Price competitive
products from
Australia.
Strong demand for
premium products.
Wine and Beer $161,647 3.5% 5% Lack of importers
handling U.S. wines
American style
Zinfandel and Cabernet
Sauvignon have
potential to expand in
this market.
Section V: Key Contacts & Other Information
Agricultural Affairs Office Foreign Agricultural Service
U.S. Department of Agriculture
American Embassy
29 Fitzherbert Terrace
Thorndon Wellington
Tel: +64-4-462-6030
Fax: +64-4-462-6016
Email: [email protected]
Foodstuffs (North Island) Co-operative Society Limited
PO Box 38-896
Kiln Street, Silverstream
Wellington, New Zealand
Attention: Shanon Kelly, Group Grocery Manager
Tel: +64-4-527-2510; DDI – 64-04-527-2655
Email: [email protected]
Foodstuffs Auckland Co-operative Society Limited:

14
PO Box CX12021
Auckland, New Zealand
Attention: Bruce Robertson, Import Grocery Buyer and Ashley Miranda, Import Grocery Buyer
Tel: +64-9-621-0286; 021 512 948
Email: [email protected]; [email protected];
Foodstuffs (South Island) Co-operative Society Limited 167 Main North Road, Papanui
Christchurch, New Zealand
Attention: John Greenwood, Import Grocery Buyer; Tim Donaldson –Retail brands manager (email-
Tel: +64-3-353-8648; Email: [email protected]
Progressive Enterprises Private Bag 93306
Otahuhu, Auckland, New Zealand
Attention: Graham Walker, Business Manager (Home brand); Steve Donahue, General Manager, Tel:
09-255-2268 Dave Chambers, Managing Director Tel: 09-255-2269
Tel: +64-9-275-2621 Tel: 09-275-2788
Email: [email protected]
Food Standards Australia New Zealand (FSANZ) 108 The Terrace
Wellington 6036
New Zealand
Tel: 64-4-978-5631
Fax: 64-4-473-9855
Internet Homepage: www.foodstandards.govt.nz
Ministry of Primary Industries (MPI) PO Box 2526
Wellington
New Zealand
Tel: 64-4-474-4100
Fax: 64-4-474-4111
Internet Homepage: www.maf.govt.nz
Restaurant Association of New Zealand P.O. Box 47 244
Ponsonby
Auckland, New Zealand
Phone: 64-9- 378-8403
Fax: 64-9- 378-8585
Internet Homepage: www.restaurantnz.co.nz
15
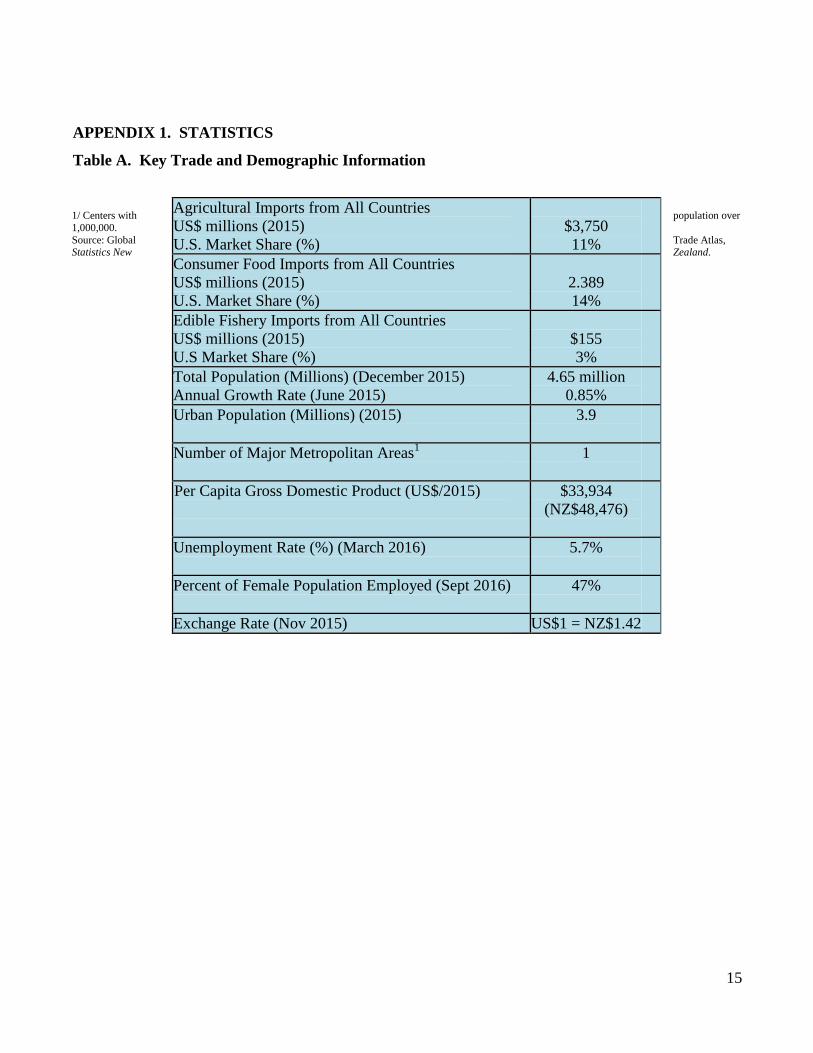
APPENDIX 1. STATISTICS
Table A. Key Trade and Demographic Information
1/ Centers with population over
1,000,000.
Source: Global Trade Atlas, Statistics New Zealand.
Agricultural Imports from All Countries
US$ millions (2015)
U.S. Market Share (%)
$3,750
11%
Consumer Food Imports from All Countries
US$ millions (2015)
U.S. Market Share (%)
2.389
14%
Edible Fishery Imports from All Countries
US$ millions (2015)
U.S Market Share (%)
$155
3%
Total Population (Millions) (December 2015)
Annual Growth Rate (June 2015)
4.65 million
0.85%
Urban Population (Millions) (2015) 3.9
Number of Major Metropolitan Areas1 1
Per Capita Gross Domestic Product (US$/2015)
$33,934
(NZ$48,476)
Unemployment Rate (%) (March 2016) 5.7%
Percent of Female Population Employed (Sept 2016) 47%
Exchange Rate (Nov 2015) US$1 = NZ$1.42

16
Table B. and C - New Zealand Consumer-Oriented Food Product Imports and
New Zealand Fish & Seafood Product Imports to New Zealand
CONSUMER-ORIENTED AGRICULTURAL
IMPORTS
FISH & SEAFOOD PRODUCTS
IMPORTS
(US$000) 2013 2014 2015 (US$00
0) 2013 2014 2015
Australia $962,265 $919,10
0 844,247 Thailand
$48,40
5
$46,48
3
37,94
8
United
States $363,612
$392,30
3 340,598 China
$25,13
4
$31,83
0
27,65
8
China $104,766 $108,79
0 110,420 Vietnam
$17,64
0
$21,62
0
20,99
6
Singapore $97,228 $96,418 82,959
New
Zealand
$12,66
7
$15,31
9
15,31
8
Netherland
s $69,817 $74,125 79,317
Australi
a $7,838 $7,609 8,808
Thailand $67,531 $77,315 70,974 United
States $7,211 $5,946 5,687
France $61,056 $65,515 78,162 Canada $5,553 $7,101 5,639
Philippine
s $55,204 $44,490 34,974
Malaysi
a $2,516 $4,498 4,512
Canada $51,647 $57,028 55,227 Japan $1,909 $1,321 1,254
Germany $46,865 $79,673 58,599 Fiji $1,745 $1,503 1,659
Denmark $42,516 $48,156 40,179 India $1,650 $3,542 2,942
Italy $36,126 $41,566 41,976 Korea
South $1,614 $2,086 1,911
Indonesia $33,351 $34,555 30,130 Philippi
nes $1,419 $4,748 1,980
United
Kingdom $30,812 $30,654 31,623 Peru $948 $1,185 224
Finland $28,464 $27,440 24,172 Argentin
a $860 $329 355
Other $405,019 $464,27
8 466,138 Other $5,539 $1,832
18,45
4
World $2,456,27
8
2,561,40
7
2,389,69
5 World
$142,6
48
$173,4
37
155,3
45 Source: Global Trade Atlas

17
Table D. New Zealand Imports of Agriculture, Fish & Forestry Products
New Zealand Imports Imports from the World Imports from the U.S. U.S Market Share
(Millions of U.S. Dollars) 2013 2014 2015 2013 2014 2015 2013 2014 2015
CONSUMER-ORIENTED
AGRICULTURAL TOTAL 2,456 2,561 2,389 364 392 340 15 15 14
Snack Foods (Excl. Nuts) 286 281 256 8 9 9 3 3 3
Breakfast Cereals & Pancake
Mix 60 54 45 6 11 11 1 2 2
Red Meats,
Fresh/Chilled/Frozen 158 198 172 22 21 12 14 11 7
Red Meats, Prepared/Preserved 35 38 36 4 4 5 11 11 13
Dairy Products (Excl. Cheese) 141 138 152 46 55 25 32 40 17
Cheese 34 42 42 5 7 7 16 17 17
Eggs & Products 5 4 3 2 1 1 47 20 9
Fresh Fruit 148 151 142 35 39 33 24 26 23
Fresh Vegetables 15 18 16 1 1 1 7 8 8
Processed Fruit & Vegetables 240 254 245 38 41 44 16 16 18
Fruit & Vegetable Juices 36 39 35 3 3 2 8 8 6
Tree Nuts 64 75 86 18 25 28 29 34 32
Wine & Beer 176 178 162 2 3 3 1 1 2
Nursery Products & Cut
Flowers 7 9 8 04 03 02 4 3 3
Pet Foods (Dog & Cat Food) 94 102 92 34 37 36 37 37 39
Other Consumer-Oriented
Products 955 980 893 143 143 133 15 15 15
FISH & SEAFOOD
PRODUCTS 143 173 155 7 6 6 5 3 4
Salmon 7 14 10 3 3 2 41 18 23
Crustaceans 47 57 47 02 04 09 0 0 0
Groundfish & Flatfish 1 2 2 0 0 0 0 1 0
Molluscs 13 13 12 1 01 01 8 4 4
Other Fishery Products 75 87 83 3 3 3 4 3 3
AGRICULTURAL
PRODUCTS TOTAL 3,864 4,172 3,750 424 481 428 11 12 11
AGRICULTURAL, FISH &
FORESTRY TOTAL 4,181 4,552 4,116 443 503 449 11 11 11
Source: Global Trade Atlas


