

ORNL/TM-2015/625 CRADA/NFE-12-04007
Next Generation Rooftop Unit (RTU) Development – Final Report
Bo Shen C. Keith Rice October 15, 2015
OFFICIAL USE ONLY May be exempt from public release under the Freedom of Information Act (5 U.S.C. 552), exemption number and category: 4, Commercial/Proprietary Department of Energy Review required before public release Name/Org: Leesa Laymance / ORNL Date: 10/21/2015
Protected CRADA Information This report contains protected CRADA information which was produced on October, 2015, under CRADA No. NFE-12-04007 and is not to be further disclosed for a period of three years from the date it was produced except as expressly provided for in the CRADA.
OFFICIAL USE ONLY

DOCUMENT AVAILABILITY Reports produced after January 1, 1996, are generally available free via US Department of Energy (DOE) SciTech Connect. Website http://www.osti.gov/scitech/ Reports produced before January 1, 1996, may be purchased by members of the public from the following source: National Technical Information Service 5285 Port Royal Road Springfield, VA 22161 Telephone 703-605-6000 (1-800-553-6847) TDD 703-487-4639 Fax 703-605-6900 E-mail [email protected] Website http://www.ntis.gov/help/ordermethods.aspx Reports are available to DOE employees, DOE contractors, Energy Technology Data Exchange representatives, and International Nuclear Information System representatives from the following source: Office of Scientific and Technical Information PO Box 62 Oak Ridge, TN 37831 Telephone 865-576-8401 Fax 865-576-5728 E-mail [email protected] Website http://www.osti.gov/contact.html
This report was prepared as an account of work sponsored by an agency of the United States Government. Neither the United States Government nor any agency thereof, nor any of their employees, makes any warranty, express or implied, or assumes any legal liability or responsibility for the accuracy, completeness, or usefulness of any information, apparatus, product, or process disclosed, or represents that its use would not infringe privately owned rights. Reference herein to any specific commercial product, process, or service by trade name, trademark, manufacturer, or otherwise, does not necessarily constitute or imply its endorsement, recommendation, or favoring by the United States Government or any agency thereof. The views and opinions of authors expressed herein do not necessarily state or reflect those of the United States Government or any agency thereof.
OFFICIAL USE ONLY

Trane CRADA final report, October 15, 2015
Page 3 of 54
ORNL/TM-2015/625
CRADA/ NFE-12-04007
Energy and Transportation Science Division
Next Generation Rooftop Unit (RTU) Development
– Final Report
Bo Shen
C. Keith Rice
Date Published: October 15, 2015
Prepared by
OAK RIDGE NATIONAL LABORATORY
Oak Ridge, Tennessee 37831-6283
managed by
UT-BATTELLE, LLC
for the
US DEPARTMENT OF ENERGY
under contract DE-AC05-00OR22725
Protected CRADA Information
This report contains protected CRADA information which was produced on October,
2015, under CRADA No. NFE-12-04007 and is not to be further disclosed for a period
of three years from the date it was produced except as expressly provided for in the
CRADA.
OFFICIAL USE ONLY

Trane CRADA final report, October 15, 2015
Page 4 of 54
CRADA NFE-12-04007
with
Trane Commercial Systems, Ingersoll Rand Inc.
Next Generation Rooftop Unit (RTU) Development
– Final Report
Executive Summary Between September 2012 and September 2015, Oak Ridge National Laboratory (ORNL)
and Trane Commercial Systems, Ingersoll Rand Inc. engaged in a Cooperative Research
and Development Agreement (CRADA) to develop a high efficiency, unitary rooftop air
conditioning system (RTU) for the US commercial market. We went through an
exhaustive technologies survey to select energy efficient and cost-effective components.
We conducted in-depth engineering design and optimization, based on the ORNL Heat
Pump Design Model (HPDM), by which we located the final choices. Starting from a
Trane baseline unit, having a rated cooling capacity of 13 tons and a 17.9 integrated
energy efficiency ratio (IEER), we made major modifications to improve the efficiency.
We re-configured the vapor compression system by combining two refrigerant circuits
into one; innovatively applied a combination of two Copeland UltraTech 2-stage
compressors and single-speed compressor, which was proved to be the most efficient
compressor combination in the targeted capacity range. The original indoor blower and
condenser fans were replaced using high efficiency fans from the Ebm-Papst company.
We also replaced the original one indoor blower with three parallel indoor blowers. This
strategy facilitated blower power reduction and improved indoor air flow distribution. We
also added a submerged subcooler to recover free cooling capacity from the condensate
water without adding power consumption. The submerged subcooler also serves as a
charge buffer to prevent two-phase refrigerant exiting the condenser at part-load
conditions. Furthermore, a low GWP refrigerant (DR-55) as a drop-in replacement of R-
410A was evaluated in the RTU prototype.
Via all the research activities and collaborations, we’ve achieved the project goal, i.e. a
measured IEER of 22.0 in a lab prototype advanced RTU. The lab prototype, using
R410A, achieved a measured IEER of 21.6 at the rated cooling capacity of 13-ton. If de-
rated to a nominal capacity of 10-ton the lab-demonstrated IEER increases to 22.7. Using
the low GWP alternative refrigerant, DR-55, led to better performance; a lab-
demonstrated IEER of 22.6 at the rated capacity of 13.5-ton and 24.0 IEER at the rated
capacity of 10-ton.
Performance curves for the system were developed using the latest research version of
HPDM, (Shen et al 2012) as calibrated against the lab test data. These maps were the
input to EnergyPlus to predict annual performance relative to a baseline RTU meeting
minimum efficiency standards in effect in 2006, i.e. a single-speed RTU having 11.0
IEER. Predicted total annual energy savings, while providing space cooling for a small
office building at 16 U.S. locations, ranged from 44 to 48%, averaging 47%, relative to
the baseline system.
OFFICIAL USE ONLY

Trane CRADA final report, October 15, 2015
Page 5 of 54
Having achieved the performance goal, we installed the lab prototype in one of the
ORNL flexible research platform (FRP) buildings for field testing in the next cooling
season. The FRP is one-story, and has a single-zone, variable air flow volume (VAV)
control. It has a footprint of 40’x60’ (12.1 m x 18.3 m) and characteristics of a typical 20-
year-old metal building.
Trane Commercial Systems, Ingersoll Rand Inc is actively pursuing plans to introduce
high efficiency RTUs that implement the features developed in this project. The major
development need remaining is to finalize the controls and control software and convert
the lab prototype control system to a solid-state hardware design (pc board, etc.) more
suitable for production line use. Trane is assessing the high efficiency RTU product
introduction against other new product priorities, and the market acceptance for the ultra-
high efficiency RTUs with cost increment. Since the DR-55 refrigerant is slightly
flammable, modifications to existing refrigeration system safety standards and building
codes are needed before it can be used in RTU systems.
1. Introduction According to the 2012 Commercial Buildings Energy Consumption survey (CBECS)
(EIA 2015), more than half of U.S. commercial building space is cooled by Rooftop Air
Conditioning Units (RTU). Existing rooftop HVAC units consume more than 1.3% of
total US energy annually (1.0 Quad source energy). If built to meet the target
specification > 22 IEER, these units would reduce energy use by as much as 50% over
current standards. Nationwide, if all 10 to 20-ton RTUs met the IEER goal, businesses
would save over $1 billion each year in energy costs, helping American companies better
compete on a global scale.
Recently, the US Department of Energy released a new high-efficiency design
specification for commercial RTUs with 10-ton (35.2 kW) to 20-ton (70.4 kW) capacity.
It targets a high-performance IEER rating of 18.0 (Btu/h/W) (Reference: High
Performance Rooftop Unit Challenge). ANSI/AHRI 340/360 gives the standard for
rating IEER. It puts significant weighting on part-load performances as shown in
Equation 1, i.e. A - 2% weight from EER at 100% capacity and 95 °F (35 °C) ambient
temperature, B - 61.7% weight for EER at 75% capacity and 81.5 °F (27.5 °C), C -
23.8% weight for EER at 50% capacity and 68 °F (20.0 °C), D – 12.5% weight for EER
at 25% capacity and 65 °F (18.3 °C). This requires smooth capacity modulation with
varying air and refrigerant flow rates to reduce cyclic loss, and sufficient utilization of all
the heat exchanger surface areas at part-load conditions. Advanced components need to
be used to meet the design targets, like micro-channel heat exchangers, high efficiency
fans and compressors, etc.
IEER = 0.020*A + 0.617*B + 0.238*C + 0.125*D (1)
where,
A = EER at 100% capacity and 95.0°F (35.0°C) ambient temperature
B = EER for 75% capacity and 81.5°F (27.5°C) ambient temperature
C = EER at 50% capacity and 68.0°F (20.0°C) ambient temperature
OFFICIAL USE ONLY

Trane CRADA final report, October 15, 2015
Page 6 of 54
D = EER at 25% capacity and 65.0°F (18.3°C) ambient temperature
In order to reach the next generation efficiency level, i.e. going beyond the 18 IEER, and
maximizing energy efficiency to 22 IEER, we launched a collaborative research and
development project between ORNL and the Trane Company, a business of Ingersoll
Rand, INC. Trane is a leading U.S. commercial HVAC manufacturer. Trane will provide
high efficiency RTUs with a large market share. To reach this goal, we went through
extensive equipment modeling studies to select promising concepts. At the end, we
designed and fabricated a lab prototype. Lab testing results demonstrated that the lab
prototype achieved 21.6 IEER at a rated capacity of 13-ton, using R-410A. This
successfully met the project goal, and is 12% more efficient than the Max Tech on the
market. In addition, using the same lab unit, we collaborated with Trane to evaluate a low
GWP refrigerant, i.e. DR-55, as a drop-in replacement of R-410A. The drop-in
replacement results in 5% higher IEER, 70% reduction in GWP, and superior
performance under high ambients. For the next step, the lab prototype is being installed in
one flexible research building of ORNL, where field testing and demonstration of the
high efficiency RTU will be conducted.
2. Technology Survey We conducted an extensive technology survey to cover energy saving techniques for
rooftop units. We selected effective and practical solutions, as most of them have already
existed in the market and been proved successful.
Compressors
Scroll compressors are the mostly commonly used vapor compression devices in RTUs,
having high efficiency. The scroll compressor capacities can range from 1 to 60 HP. One
example is Copeland UltraTech, which has SEER of 15.0. By grouping multiple
compressors together, the largest RTUs using scroll compressors have rated cooling
capacities of ~200 tons.
High IEER RTUs need compressors with good part load performance. Usually the
capacity adjustments fall into the categories as below,
1. Multiple compressors: This is the most common design, which groups compressors
about two to five; the compressors can feed to individual systems or several
compressors feed to one system (need special oil return strategy). When grouping
several compressors, there could be one variable speed compressor while the others
are single-speed. The single-speed compressors provide capacities at varied levels,
and the variable speed compressor provides fine tuning. The example of using
multiple compressors in multiple circuits of one unit can be seen from the Lennox
Strategos, and Trane iPak rooftop product families.
2. Modulated compressor: Modulated compressors vary compression volume to achieve
capacity modulation by PWM (pulse-width-modulation) controlled bypass valves.
The compressor uses a single-speed motor. One example is the Copeland digital
OFFICIAL USE ONLY

Trane CRADA final report, October 15, 2015
Page 7 of 54
scroll, whose capacity ranges from 10%–100% and Copeland UltraTech staging from
67% to 100%.
3. Variable speed compressor: These compressors usually use an inverter-driven motor
to vary the compressor speed, so as to vary the mass flow rate. Variable-speed
compressors have better part-load performance than modulated compressors and
single-speed compressors. But, variable-speed compressors are costly, and have an
extra efficiency loss caused by the inverter.
Discussion:
Variable speed compressors have a smoother transition between speed levels and
maintain relatively high efficiencies at the part load. In comparison to the RTUs using
single-speed compressors, the expected annual energy saving by using variable speed
compressors can be up to 20%. On the other hand, grouping multiple compressors
together, including one variable speed compressor (small capacity), can reach comparable
part load performance as using a single variable speed compressor (large capacity);
however, this will lead to different system configurations, e.g. multiple refrigeration
systems and using interlaced heat exchangers. At part load, multiple compressors with
interlaced heat exchangers can utilize the entire air side heat transfer but not refrigerant
side; from this point, it is less efficient than using a single variable speed compressor in
one system. In order to fully utilize the heat exchanger surface area, grouping multiple
compressors in one refrigeration system is a preferred choice, however, oil return and
balance among the compressors have to be confirmed in particular.
Heat Exchangers
1. Micro-channel heat exchangers: Micro-channel heat exchangers use flat tube, which
significantly reduce air side flow resistance and refrigerant charge. The micro
channels promote annular flow and thus effective refrigerant side heat transfer. The
manufacturers of micro-channel heat exchangers can be seen as Modine, Delphi, etc.
Via these advantages, a micro-channel heat exchanger can achieve 10% better heat
transfer performance than a fin-tube coil heat exchanger, given the same coil frontal
area, coil volume and fan power. Nevertheless, the flat tubes impede water drainage,
which negatively impacts defrosting and dehumidification performance. Furthermore,
since the micro-channel heat exchangers have discontinuous fins, they cannot be
interlaced.
2. Interlaced-heat exchangers: interlaced fin-tube heat exchangers are used widely in the
current RTUs, for example, Trane’s InteliPak and Voyager product families. For a
typical design, one slab of the heat exchanger coil is connected to multiple
refrigeration systems, and the tubes of each system are uniformly distributed
throughout the fin surface. During part-load operation, only part of the tubes have
refrigerant flow, and the entire air-side fin surface can be utilized. The interlaced coils
have better part load performance than separate coils. On the other hand, the
interlaced-coils don’t have good dehumidification performance at part load, since not
OFFICIAL USE ONLY

Trane CRADA final report, October 15, 2015
Page 8 of 54
all the air flow gets contact with the refrigerant tubes. It might need to be coupled
with other dehumidification means like desiccant wheel.
Discussion:
Since micro-channel heat exchangers can’t be interlaced, it shall be connected with
variable capacity compressor(s) for better part-load performance. We are optimistic about
using a micro-channel heat exchanger as the condenser, but suspicious about using it as
the evaporator due to its problematic dehumidification performance. At this point, it
might be better to use a common fin-tube heat exchanger as the evaporator.
Indoor Blower
In most cases, the indoor blower in a RTU is also used to circulate indoor air, even when
the compressor(s) is off. So, the indoor blower runs the longest time year-round, which
might consume up to 50% of total annual energy for a RTU.
1. Two speed blower: Two speed blowers run at high speed when the compressor is on,
but at low speed during other times to maintain indoor air circulation. Two-speed
operation can provide the majority of the energy savings benefit of variable air
volume (VAV) system with less initial cost. Using two speed blowers can achieve
20% annual energy saving, in comparison to single-speed blowers.
2. Variable speed blower: The high energy savings for VAV are attributable to the
significant reduction of blower power input during many hours operating at part load.
The variable speed blower application can reduce about 40% annual energy
consumption, compared to a single-speed system. Although variable speed blowers
(or multiple speed blowers) are more expensive, their applications are not uncommon,
for example, the Lennox Strategos product series.
Discussion:
In comparison to compressors, variable speed blowers are less expensive, but can result
in significant energy saving. For some large capacity RTUs, they are worthwhile
according to payback period.
Outdoor Fan
The energy consumption of outdoor fan is much less than the compressor and indoor
blower (about 10% to the compressor power). The energy saving techniques for outdoor
fans can be seen as secondary importance.
1. Two-speed: The reduced-flow mode would be used when just part of the compressors
are operating.
2. Fan staging: It usually involves parallel fans boosting air flow to outdoor coils. The
reduced-flow mode would be used when just part of the compressors are operating.
Discussion:
Using two-speed fan or several parallel fans depend on the required air flow rate and coil
frontal surface. If the frontal surface is too large, a single two-speed fan can’t provide
uniform air flow distribution, and thus, using parallel fans could be a better choice.
Nevertheless, at part-load condition, the parallel fans might have problem with air
recirculation through the openings of the inactive fans.
OFFICIAL USE ONLY

Trane CRADA final report, October 15, 2015
Page 9 of 54
Condenser Evaporative Cooling
Evaporative cooling is to utilize heat&mass transfer to enhance heat exchanger
performance. In the RTU applications, they can be categorized to condenser evaporative
pre-cooling and evaporative condenser.
1. Condenser evaporative pre-cooling: a wetted pad is placed in front of the condenser
coil and the air stream is cooled down by evaporating water. The technique is good
for retrofit applications and easy for maintenance. The representative manufacturers
are Munters and EvapCool. In desert conditions like Phoenix, AZ, for R-410A
equipment, the annual energy saving can be up to 20%, and peak power reduction can
be up to 30%. But, the application range is limited to desert conditions; for cooler and
more humid climates, the benefit of condenser evaporative pre-cooling is much less.
2. Evaporative Condenser: this technique directly sprays water on the surface of
condenser coil, to change the thermal driving potential from the outdoor dry bulb
temperature difference to the wet bulb difference. Compared to evaporative
precooling, it is less sensitive to climate zones. The most successful RTUs using
evaporative condensers are Trane IntelliPak product family, by which the
manufacturer claims 29% in annual energy saving and 40% in peak power reduction.
However, the fouling on the coil surface is significant, special water treatment has to
be applied.
Discussion:
Although the evaporative condenser can result in higher efficiency, it totally changes the
system configuration by adding the refrigerant-water-air heat exchanger. The fouling
problem leads to high failure rate to evaporative condenser. On the other hand, the
condenser evaporative pre-cooling is more a plug-in choice. It is less demanding in
maintenance, while getting majority of the energy saving benefit from the evaporative
condenser.
Dehumidification
In hot and humid climate zones, the latent load can reach 50% of the total cooling
capacity; therefore, dehumidification process is important for equipment efficiency.
Desiccant wheels are usually used to enhance the dehumidification performance.
1. Desiccant wheel without regeneration: The wheel is configured in series with the coil
such that the “regeneration” side of the wheel is located in the returning air path
upstream the evaporating coil, and the “process” side of the wheel is located in the
supply air path downstream of the cooling coil. The wheel circulates the water vapor
trapped downstream of the cooling coil back into the air upstream of the coil, where
the coil removes it through condensation. Since the humidity level entering the coil is
higher, it would need higher evaporating pressure for the dehumidification, and thus
reduce compressor power consumption. The representative product is Trane CDQ,
which can lead to 10~30% annual energy saving, to meet the same dehumidification
need.
OFFICIAL USE ONLY

Trane CRADA final report, October 15, 2015
Page 10 of 54
2. Desiccant wheel with gas heat regeneration: For this concept, gas heat is used to
warm up outdoor air and regenerate the desiccant wheel after absorbing the moisture,
and the air used for the regeneration is exhausted to outdoor. This design can
certainly control the indoor humidity to a very low level, and downsize the indoor
coil significantly, since the desiccant wheel can take the entire latent load. An
example product of this is SEMCO Revolution, by which the manufacturer claim that
they can downsize the indoor coil up to 50%.
Discussion:
Desiccant wheel with gas heat regeneration is more capable of lowering indoor humidity
level and downsize the evaporator, but it requires an extra air circulation path and must
be connected to a natural gas or propane source. It would lead to less reliable but more
expensive product. From the perspective of maintaining indoor comfort and high energy
efficiency, this measure is not necessary. Desiccant wheel without regeneration, being
coupled with a properly sized indoor coil, is a more robust option.
Economizer
Air side economizer lets in outdoor air for cooling down indoor, in the case that the
outdoor dry bulb or wet bulb temperature is lower than indoor. The failure rate of the
economizer could be high, which was 64% during a RTU survey in Pacific Northwest
and California, so economizer might work with fault diagnosis device. Economizer shall
only allow suitable air in, without introducing sensible or latent load to indoor; it is better
to sense both the outdoor door dry bulb and dew point (dry bulb control and enthalpy
control).
Energy Recovery Wheel
Energy wheels normally recover 70-75% of both sensible and latent energy from exhaust
ventilation air streams; resultant annual energy saving can be up to 35%.
High Efficiency RTUs on the market:
The first RTU that reached the 18.0 IEER target was the Daikin, Rebel, 10-ton unit, as
illustrated in Figure 1. It uses two high efficiency condenser fans with ECM motors, and
an indoor blower with backward-curved impeller and ECM motor, made by the Ebm-
Papst Company. It has two separate refrigerant systems; one using a single-speed
compressor, and the other using a variable-speed compressor to provide fine capacity
modulation.
OFFICIAL USE ONLY

Trane CRADA final report, October 15, 2015
Page 11 of 54
Figure 1. Daikin Rebel 10-Ton RTU
The Max Tech of high efficiency RTUs on the market is the Carrier, WeatherExpert, 10-
ton unit, which reached 21 IEER, as shown in Figure 2. The Carrier RTU uses an ECM
indoor blower and condenser fans, as well as variable-speed compressors. The indoor
heat exchanger is a fin-&-tube coil, and the outdoor heat exchanger is a micro-channel
heat exchanger.
Figure 2. Carrier WeatherExpert 10-Ton RTU
Discussion:
The high efficiency RTUs, cited above have in common the use of ECM blowers and
fans, and variable-speed compressors for capacity modulation. The backward-curved
impeller design of Ebm-past indoor blowers provides better aerodynamic performance
than typical centrifugal blowers having forward-curved impeller. For RTUs having
relatively large indoor coils, the indoor air flow distribution can be a problem, which
OFFICIAL USE ONLY

Trane CRADA final report, October 15, 2015
Page 12 of 54
reduces effective heat transfer surface area. It can be seen that both the manufacturers had
the fan air inlet opening of the indoor blower facing the indoor coil, which results in
better air flow distribution.
3. Equipment Models
The DOE/ORNL Heat Pump Design Model (HPDM) is a hardware-based equipment
design and modeling tool. HPDM is used as the major base of our design work, to
compare system configurations, select components and size heat exchangers.
The ORNL Building Equipment Research team has over thirty years’ experience in
thermal system and component modeling. We have developed in-house steady-state
simulation models covering most categories of residential and light commercial space
cooling, space heating and water heating components, like compressors, heat exchangers,
pumps, fans, etc. These models have been extensively used and validated through our
research projects. Being different from the performance curves used in EnergyPlus and
other building energy simulation software, our models are fundamentally based, can
simulate detailed heat exchanger geometry and circuitry, and accept real air side and
refrigerant side boundary conditions. These models are actually equipment design tools,
which can do performance prediction, component sizing, and system optimization at
specified efficiency levels and cost.
Our in-house heat exchanger models have different complexity levels, falling under three
categories, i.e. bulk models, phase-to-phase models, and discretized models. The bulk
models are usually based on Effectiveness-NTU or UA-LMTD approach, to simulate the
component as a whole. The phase-to-phase models separate the refrigerant side to vapor,
two-phase and liquid regions, and each region has individual air side and refrigerant side
entering states. The discretized models use segment-to-segment modeling approach,
which divide a heat exchanger into to numerous mini-segments; each segment has
individual refrigerant and air entering parameters, and considers possible phase
separation; the mini segments are basic building blocks, which are used to build up heat
exchangers having arbitrary circuitry, geometry, and represent any boundary conditions.
All our phase-to-phase and segment-to-segment heat exchanger models are able to
calculate refrigerant charge inventory. For the high efficiency RTU development project,
we particularly enhanced our segment-to-segment heat exchanger modeling capacity, so
as to serve the needs for modeling large complicated heat exchangers like interlaced fin-
tube coils and micro-channel heat exchangers. Some component models and features in
the HPDM library, related with the RTU development, are introduced as below:
Compressors:
Single-speed Compressor: We use AHRI 10-coefficient compressor maps (ANSI/AHRI
540-99, 2010) to calculate mass flow rate and power consumption, and enable calculation
of the refrigerant-side vs. air-side energy balance from inlet to outlet. We also consider
the actual suction state to correct the map mass flow prediction using the method of
Dabiri and Rice (1981) as given in Equation (2).
OFFICIAL USE ONLY

Trane CRADA final report, October 15, 2015
Page 13 of 54
Variable-speed compressor: The model accepts multiple sets of mass flow and power
curves, and does linear interpolation between speed levels.
mapARIref
act
mapARI
massactualref mv
vFm
,, )]1(1[ (2)
where massF is an empirical correction factor assigned a value of 0.75, mapARIrefm , and actualrefm ,
are the mass flow rates at the standard (compressor map) and actual suction superheat,
and mapARIv and actv are the specific volumes at the standard and actual superheat.
Heat Exchangers:
Segment-to-segment fin-&-tube condenser: It uses a segment-to-segment modeling
approach; Each tube segment has individual air side and refrigerant side entering states,
and considers possible phase transition; An -NTU approach is used for heat transfer
calculations within each segment. Air-side fin is simplified as an equivalent annular fin.
Both refrigerant and air-side heat transfer and pressure drop are considered; the coil
model can simulate arbitrary tube and fin geometries and circuitries, any refrigerant side
entering and exit states, misdistribution, and accept two-dimensional air side temperature,
humidity and velocity local inputs; the tube circuitry and 2-D boundary conditions are
provided by an input file.
Segment-to-segment fin-&-tube evaporator: In addition to the functionalities of the
segment-to-segment fin-tube condenser, the evaporator model is capable of simulating
dehumidification process. The method of Braun et al. (1989) is used to simulate cases of
water condensing on an evaporating coil, where the driving potential for heat and mass
transfer is the difference between enthalpies of the inlet air and saturated air at the
refrigerant temperature.
Segment-to-segment micro-channel condenser: The model uses a segment-to-segment
modeling approach; Each micro-channel port segment has individual air-side and
refrigerant-side entering states, and considers possible phase transition; the coil model
can simulate arbitrary port shapes (round, triangle, etc.), fin geometries and circuitries
(serpentine, slab, etc.), any refrigerant side entering and exit states, misdistribution, and
accept two-dimensional air side temperature, humidity and velocity local inputs.
Segment-to-segment micro-channel evaporator: In addition to the functionalities of the
segment-to-segment micro-channel condenser, the evaporator model is capable of
simulating dehumidification process.
Expansion Devices:
Idealized TXV: The compressor suction superheat degree is explicitly specified.
Fans and Blowers:
Single-speed fan: Given airflow rate, the model uses a fan curve to simulate static head,
power consumption, and calculate air-side temperature increment from inlet to outlet.
Variable-speed fan: The model accepts multiple sets of fan curves, and does linear
interpolation between speed levels.
OFFICIAL USE ONLY
Trane CRADA final report, October 15, 2015
Page 14 of 54
Accessories:
Desiccant wheel: Analogy between heat and mass transfer is used to simulate process
side and regeneration side energy transfer based on given effectiveness; the effectiveness
shall be determined from manufacturer’s data; the model can simulate any entering air
temperature and humidity levels, and predict temperature and humidity change at the
process side and the regeneration side; this is the same model used in TRNSYS.
Evaporative cooler: The models uses heat & mass analogy method and Effective-NTU
formulas, assuming the evaporative pad at a uniform surface temperature; it uses enthalpy
difference as driving potential for energy transfer; empirical parameters shall be reduced
from a manufacturers’ data according to the pad media type; it calculates temperature,
humidity change through the evaporative pad.
Refrigerant Properties:
Interface to Refprop 9.0: We programmed interface functions to call Refprop 9.0 directly;
our models accept all the refrigerant types in the Refprop 9.0 database, and also we can
simulate new refrigerant by making the refrigerant definition file according to the
Refprop 9.0 format.
Hybrid look-up tables with Refprop 9.0: Refprop 9.0 can be fairly slow, to speed up the
calculation, we have an option to generate property look-up tables, based on Refprop
9.0; our program uses 1-D and 2-D cubic spline algorithms to calculate refrigerant
properties via reading the look-up tables, this would greatly boost the calculation speed,
given the same accuracy; however, the cubic spline algorithms are less accurate when
approaching to the critical region, in the case, we switch back to the Refprop 9.0
functions.
Optimization:
HPDM has embedded optimization capability, which uses GenOpt, an open source
optimization program published by Wetter (2009). A wrapper program was developed to
communicate between GenOpt and HPDM by exchanging text input and output files. The
GenOpt optimization wrapper is shown in Figure 3. GenOpt automatically generates
input files for the simulation program based on predefined templates that include
keywords describing the problem variables.
As shown in Figure 3, the problem domain is defined in two parts, One part defines
required inputs for the GenOpt program (in the GenOpt command file), which selects the
optimization algorithm and regulates design spaces for the iterative variables; the other
part (in the wrapper template file) defines attributes and design spaces for the selected
objectives. The wrapper program accepts three kinds (attributes) of objectives:
optimization objectives, target objectives (equality constraints), and bound objectives
(inequality constraints). An optimization objective is to maximize or minimize an output
variable, a target objective intends to match the output variable to a given value, and a
bound objective is to define upper and lower bounds for an output variable.
OFFICIAL USE ONLY

Trane CRADA final report, October 15, 2015
Page 15 of 54
GenOpt produces guess values for the iterative variables through a text file to the wrapper
program. The wrapper program interprets the input file to provide the required inputs for
the vapor compression system model, and then executes the model to get performance
outputs. Then, the wrapper program provides the outputs in the form shown in Equation
(3).
2
2
])(*[
])(*[)*()(
kkk
jjjii
BoundBndObjP
GoalTgtObjTOptObjWxf
(3)
where )(xf is the integrated function to be minimized by the GenOpt algorithm, x is a
vector of the model variables to be iterated , and Wi is the weighting factor for an
optimization objective. OptObji is a variable for optimization, it will be maximized by
giving a negative weighting factor, and minimized by giving a positive weighting factor.
TgtObjj is a variable intended to match a given target value, and Tj is a weighting factor
to be multiplied with the residual. Goalj is a given target value. BndObjk is an output
variable having either upper or lower bound. Boundk is a given boundary value. Pk is a
penalty factor, which is zero when the output variable is within the given bounds; on the
other hand, it becomes a quite large multiplier when the output variable goes beyond the
bounds.
Next, GenOpt evaluates the result of the output function, and updates the guesses for the
iterative variables. The interaction process between GenOpt and the wrapper program is
repeated until the minimum of the output function is found. For the analyses below, the
optimization algorithm applied was Generalized Pattern Search algorithm (Hooke-Jeeves
and Coordinate Search algorithm).
Figure 3. GenOpt Optimization Wrapper to a Vapor Compression System Model
OFFICIAL USE ONLY

Trane CRADA final report, October 15, 2015
Page 16 of 54
4. Design and Optimization The advanced RTU design and optimization process started from a baseline existing
Trane RTU product. Our CRADA partner tested their baseline RTU (rated 220 kBtu/hr
cooling capacity at 100% output) in 2013. Based on their lab tests, the baseline unit
achieved an IEER of 16.7. The baseline RTU has two parallel vapor compression
systems, as shown in Figure 4, with one system running a tandem (TD), scroll
compressor pair and the other system running a variable speed (VS) compressor.
Figure 4. Configuration of Trane Baseline RTU (Two Parallel Systems)
Using HPDM, we modeled the Trane baseline RTU and calibrated the component models
according to the Trane lab data. This was to match the measured performance at
individual capacity levels and to obtain heat exchanger heat transfer multipliers and
adjustment factors for compressor map-predicted mass flow rates and power
consumptions, line losses and cabinet losses, etc. Based on these, we predicted system
refrigerant charges of the two systems at 100% capacity and then fixed the charges to
predict performances at the other capacity levels. The predicted IEER with the calibrated
HPDM is 16.5 (vs. the measured 16.7) and integrated sensible heat ratio (ISHR) is 76% .
ISHR is calculated using Equation 3, which has the same form as the standard IEER
calculation.
Equation (3)
Improvement opportunities identified from testing and modeling the baseline RTU:
The baseline RTU uses a four-row indoor fin-and-tube (FTC) coil, and a one-row
microchannel outdoor heat exchanger (MHX) coil. The MHX coil has a much smaller
inner volume than the FTC coil. At part-load conditions, more refrigerant charge
migrates to the evaporators, due to the reduced refrigerant flow rates and increased
OFFICIAL USE ONLY
Trane CRADA final report, October 15, 2015
Page 17 of 54
evaporating pressures. Our model predicts two-phase refrigerant exiting the
condensers, and a wide temperature separation at the condenser exits at part-load
conditions. Considering these, we suggested using dedicated subcoolers, i.e. adding a
liquid receiver to separate the condenser and subcooler, and store extra charge.
At present, the Trane baseline RTU uses variable speed air management systems at
both the outdoor and indoor sides. Replacing the current indoor air system with an
Enhanced Air Management System (EAMS) would improve the blower operation
efficiency and indoor air flow distribution.
The air flow distribution in the indoor FTC coil is problematic, because the indoor
FTC coil is very large and a conventional, centrifugal, indoor blower cannot provide a
uniform air face velocity. That is why we had to use rather small heat transfer
multipliers (around 0.4) for the evaporator model, for adjusting the evaporator model
to match the measured suction saturation temperature. Trane suggested that the
EAMS is able to improve air flow distribution as well, and result in better heat
transfer, in this case a heat transfer multiplier closer to 1.0 could be adopted.
Compared to other manufacturers’ products, the Trane baseline condenser surface
area is very restrictive; for example, it is 50% smaller than that of the Lennox
Strategos 20-ton unit. Trane suggested adding another row to the current MHX
condenser coil, at the expense of increasing the condenser fan power consumption by
20%.
Big deviations were observed between the suction and discharge saturation
temperatures between the TD and VS systems at 75% and 50% capacity levels. It
indicates that the current heat exchanger surface area split ratios are not optimal for
the part load conditions. We need to re-allocate the surface areas between the TD and
VS systems, for an optimum IEER.
Because the heat exchangers were only partly used at 25% capacity, the EER was
observed to be lower than that at 50% capacity, although the ambient temperature at
25% capacity is lower than at 50% capacity. So, another strategy to improve the IEER
is to have three parallel compressors in a single compression system (Trio), which
effectively utilizes all the heat exchanger surface area at all the capacity levels.
Certainly, combining three compressors in a Trio system would introduce technical
concerns with respect to oil management – however, this is accomplished today in
many conventional commercial systems.
A VS compressor is able to provide smooth capacity modulation, which facilitates
flexible dehumidification and outdoor air treatment. It is suggested to investigate the
VS compressor in a separate system as in the baseline RTU.
Based on the above, we recommended two equipment configurations for evaluation:
a) One is to combine three compressors in one Trio system as shown in Figure 5;
b) The other is similar to the baseline RTU, having two parallel systems, as shown in
Figure 4.
OFFICIAL USE ONLY

Trane CRADA final report, October 15, 2015
Page 18 of 54
The former option uses all the heat exchanger surface area most effectively, the latter
option aims to provide flexible dehumidification and outdoor air treatment capabilities,
using the VS system.
Figure 5. Configuration of Trio System
Compressor Selection
We compared two different variable-speed compressors. Figure 6 below shows cross-
comparisons between the compressors from Manufacturer A and Manufacturer B
(directly comparing the compressor maps from the manufacturers), in terms of EER ratio
as a function of discharge saturation temperature and cooling capacity, with 15 °R
subcooling degree and 20 °R superheat degree, at suction saturation temperatures of 50
°F and 55 °F, respectively. It can be seen that the compressor from Manufacturer A is
more efficient when the discharge saturation temperature is higher than 105 °F; however,
the compressor from Manufacturer B is more efficient at part load conditions when the
discharge temperature is below 100 °F. Since the part load performances are more
important for the IEER rating, the VS compressor from Manufacturer B is the preferred
option.
OFFICIAL USE ONLY

Trane CRADA final report, October 15, 2015
Page 19 of 54
EER Ratio (Manufacturer A/B) at 50 F Tsuc_sat
1.06
1.04
1.021.000.980.960.94
0.92
0.90
Discharge Saturation Temp [F]
80 85 90 95 100 105 110 115 120
Co
oli
ng
Cap
acit
y [
Btu
/h]
50000
60000
70000
80000
90000
EER Ratio (Manufacturer A/B) at 55 F Tsuc_sat
1.04
1.02
1.000.980.960.94
0.92
0.92
0.900.88
Discharge Saturation Temp [F]
80 85 90 95 100 105 110 115 120
Co
oli
ng
Cap
acit
y [
Btu
/h]
50000
60000
70000
80000
90000
Figure 6. Comparing EERs between Two VS Compressors
In order to optimize the system efficiency levels, several compressor combinations were
evaluated in an attempt to define a more efficient combination. We searched the
manufacturer’s compressor database extensively, for compressors with displacement
volume ranging from 2.4 to 4.5 cubic inches/Rev. Table 1 below lists the compressor
displacement volumes and EERs at different combinations of suction and discharge
saturation temperatures, including one single-speed and one dual-capacity product series.
The Copeland, UltraTech series are dual-capacity compressors, with the low capacity (L)
using 67% displacement volume of the full capacity value (H).
Table 1: Compressor Displacement Volumes and EERs
Model No Displacement volume
[in3/Rev]
EER at 50 °F/80 °F EER at 50 °F/95 °F
Single-Speed
ZP67KCE (baseline) 3.84 28.3 22.5
ZP76KCE 4.32 26.3 21.9
ZP54K5E 3.12 31.8 24.0
ZP61KCE 3.55 29.2 23.1
ZP72KCE 4.10 28.0 22.1
UltraTech Dual-Capacity
ZPS60K5E (H) 3.39 32.9 24.5
ZPS60K5E (L) 3.39×67% 31.8 23.3
ZPS49K5E (H) 2.82 30.0 23.7
ZPS49K5E (L) 2.82×67% 34.2 23.7
ZPS40K5E (H) 2.39 30.1 23.1
ZPS40K5E (L) 2.39×67% 33.7 23.5
Figure 7 below compares the UltraTech dual-capacity compressors with the single-speed
compressor series, in terms of compressor EER as a function of displacement volume.
We can see that efficiency of the single-speed compressor series decreases with
increasing displacement volume; on the other hand, the UltraTech dual-capacity
OFFICIAL USE ONLY

Trane CRADA final report, October 15, 2015
Page 20 of 54
compressors have somewhat higher efficiencies and are less sensitive to the variation of
displacement volume. This feature facilitates adding up different capacity levels of two
parallel UltraTech compressors to reach a required total capacity with a better EER, than
running a single-speed compressor with the same total displacement volume.
0
5
10
15
20
25
30
35
40
0.00 1.00 2.00 3.00 4.00 5.00
EER
Compressor Displacement Volume [in^3/Rev]
EER vs Displacement Volume in Single-Speed and Dual-Capacity Compressor Series
EER@50F/80F, ZP-single speed
EER@50F/95F, ZP-single speed
EER@50F/80F, UltraTech 2-Capacity
EER@50F/95F, UltraTech 2-Capacity
Figure 7. Comparing EERs between Single-Speed and UltraTech Dual-Capacity Compressors
Another significant advantage of combining two UltraTech compressors with a single-
speed compressor in a single vapor compression system is that it is able to provide
numerous capacity modulation levels without need for an expensive VS compressor,
leading to a potentially lower cost system design. Figure 8 below illustrates all 17
individual capacity levels achievable from combinations of the three unbalanced
compressors, i.e. ZP67KCE (single-speed) + ZPS60K5E (UltraTech 2-caapacity) +
ZPS49K5E (UltraTech 2-capacity), and almost a smooth straight line of capacity
modulation. The combinations for matching 100% (220K Btu/hr), 75%, 50% and 25%
capacity levels, at the AHRI 340/360 standard ambient temperatures, are pointed out in
the figure.
OFFICIAL USE ONLY

Trane CRADA final report, October 15, 2015
Page 21 of 54
0
2
4
6
8
10
12
Dis
plac
emen
t Vol
ume
[in^
3/Re
v]
Displacment Vol
25%
100%
75%
50%
Figure 8. Displacement Volumes of ZP67KCE (Single-Speed) + ZPS60K5E (UltraTech Dual
capacity) + ZPS49K5E (UltraTech Dual capacity)
Recommended Design I - Trio System with Three Compressors
The recommended component options for the Trio system are listed below:
Use a liquid receiver between the condenser and subcooler (dedicated subcooler) to
mitigate the charge imbalance between the MHX condenser and the FTC evaporator.
Use a two-row MHX coil to enlarge the high-side heat transfer surface area, i.e.
double the condenser surface area vs. the baseline, which requires 20% more outdoor
fan power consumption.
Keep the same indoor heat exchanger dimension as the baseline.
Use a high performance air management system (EAMS) to replace the baseline
indoor blower, in order to reduce the fan power consumption by 30%, and improve
the indoor air flow distribution, i.e. elevate the evaporator model heat transfer
multiplier.
Use a compressor combination of ZP67KCE (single-speed) + ZPS60K5E (UltraTech)
+ ZPS49K5E (UltraTech), since they provide the closest matches to 100%, 75%, 50%
and 25% capacity levels in the displacement volume range, as illustrated in Figure 7.
The two UltraTech compressors enable operations at uniformly high compressor
efficiency and provide numerous capacity modulation levels without use of the more
expensive variable-speed compressor system.
The predicted performance at the four capacity levels of the Trio system are listed in
Table 2.
OFFICIAL USE ONLY
Trane CRADA final report, October 15, 2015
Page 22 of 54
Table 2: Performance of Trio System
Parameters Units 100% 75% 50% 25%
Total Net Cooling Capacity [Btu/h] 215530 161402 116073 60061
Total Equipment Power [W] 17106 9405 4755 2208
EER [Btu/h/W] 12.60 17.16 24.41 27.20
Total SHR (include blower heat) [%] 82% 80% 75% 91%
IEER [Btu/h/W] 20.0
ISHR [-] 80%
The design combination listed in Table 2 is a factory fabricated option (mechanical
system), capable of reaching an IEER of 20. If a more efficient RTU (IEER above 22) is
desired, one can choose a customized add-on option at increased cost. The add-on option
suggested here was condenser evaporative pre-cooling with an 8-inch pad. The 8-inch
pad was recommended by a manufacturer, i.e. Munters, for commercial application, and
its wet bulb efficiency is 0.84. Condenser pre-cooling reduces air temperature entering
the condenser coil. AHRI 340/360 defines ambient wet bulb temperature for evaluating
the evaporative pre-cooling effect at individual capacity levels. The conditions as well as
the reduced air dry bulb temperatures entering the condenser coil are listed in Table 3.
The added pre-cooling pad increases the condenser air side flow resistance; consequently,
it increases the condenser fan power consumption by 30%. The predicted performance of
the Trio system with the evaporative precooling pad is listed in Table 4; the resultant
IEER is 22.3
Table 3: Condenser Entering Dry Bulb Temperatures by Applying 8 Inch Evaporative Precooling
Pad
Capacity Level 100% 75% 50% 25%
Ambient Air Dry Bulb [°F] 95.0 81.5 68.0 65.0
Ambient Air Wet Bulb [°F] 75.0 66.3 57.5 52.8
Condenser Entering Air Dry Bulb [°F] 78.2 68.7 59.2 54.8
Table 4: Performance of Trio System with Adding Evaporative-Precooling Pad
Parameters Units 100% 75% 50% 25%
Total Net Cooling Capacity [Btu/h] 234246 170104 120364 63921
Total Equipment Power [W] 15193 8910 4422 2116
EER [Btu/h/W] 15.42 19.09 27.22 30.21
Total SHR (include blower heat) [%] 79% 77% 74% 88%
IEER [Btu/h/W] 22.3
ISHR [-] 78%
Recommended Design II - Two Parallel Systems (TD System + VS System)
The configuration having two parallel systems has the same heat exchanger dimensions
as the Trio system, and uses the same condenser fan and indoor blower. The VS system
uses the same compressor as the Trane baseline RTU; but the tandem pair is changed to
be ZPS60K5E + ZP67KCE. The RTU runs the high capacity stage of the UltraTech
compressor, i.e. ZPS60K5E, at 75% capacity, and the low capacity at 50% capacity,
OFFICIAL USE ONLY

Trane CRADA final report, October 15, 2015
Page 23 of 54
while the VS compressor is adjusted to match the remaining capacity. At the 25% system
capacity level, only the VS compressor runs, and all the compressors run at 100%
capacity. Coupling the ZPS60K5E with the VS compressor, at 75% and 50% capacity
levels, facilitates high efficiency operations, and prevents the VS compressor from
running below 2000 RPM, where its efficiency degrades drastically.
For optimizing the two parallel vapor compression systems, we have two variables, i.e.
the evaporator and condenser surface area split ratios between the two systems. Figure 9
below illustrates the IEER as a function of evaporator and condenser surface area ratios
in the VS system, relative to the total system heat exchanger area. The optimizations are
related to two design scenarios, i.e. “DSC+EAMS” means using dedicated subcoolers and
the enhanced indoor air management system, and “DSC+EAMS+EC” means adding the
condenser evaporative pre-cooling pad. A maximum IEER is found when splitting the
evaporator and condenser surface areas equally, between the VS system and TD system.
Since both the VS system and TD system provide similar capacities at 75% and 50%
capacity levels (which account for 85.5% weight of the IEER calculation in total), the
equal heat exchanger split result makes sense. In addition, the optimum heat exchanger
allocations stay consistent whether the evaporative precooling pad is used or not.
IEER (DSC+EAMS)
19.6
19.819.8
19.7
19.919.7
19.6
19.6
19.419.319.219.1
19.5
19.5
19.0
19.0
Ratio of VS Condenser Surface Area
0.30 0.35 0.40 0.45 0.50 0.55 0.60
Rati
o o
f V
S E
vap
ora
tor
Su
rface A
rea
0.38
0.40
0.42
0.44
0.46
0.48
0.50
0.52
0.54
IEER (DSC+EAMS+EC)
22.4
22.4
22.4
22.2
22.2
22.2
21.821.6
21.4
22.0
Ratio of VS Condenser Surface Area
0.30 0.35 0.40 0.45 0.50 0.55 0.60
Rati
o o
f V
S E
vap
ora
tor
Su
rface A
rea
0.38
0.40
0.42
0.44
0.46
0.48
0.50
0.52
0.54
Figure 9. IEER for the two parallel system design as a Function of Heat Exchanger Area Split Ratios
for Two Design Scenarios
The optimized system performances of the two parallel system design option are given in
Tables 5 and 6. The design combination listed in Table 5 includes dedicated subcoolers,
the indoor EAMS, a two-row MHX condenser coil, with ZPS60K5E + ZP67KCE in the
TD system and the baseline VS compressor in the VS system, which reaches an IEER of
19.9. The design combination listed in Table 6 includes the evaporative pre-cooling pad
and reaches an IEER of 22.5.
OFFICIAL USE ONLY

Trane CRADA final report, October 15, 2015
Page 24 of 54
Table 5: Performance of Combining TD System and VS System
Parameters Units 100% 75% 50% 25%
Rated Outdoor Air Temperature [F] 95.0 81.5 68.0 65.0
Ta
nd
em Gross Cooling Capacity [Btu/h] 152637 86064 64687 Off
Compressor Power [W] 10792 3506 2076 Off
SHR (without blower heat) [%] 70% 77% 71% Off
EER [Btu/h/W] 11.8 17.9 23.1 Off
Va
ria
ble
-Sp
eed
Compressor Speed [RPM] 3959 4313 2227 2359
Gross Cooling Capacity [Btu/h] 78062 83907 47349 54898
Compressor Power [W] 3851 3611 1168 1188
SHR (without blower heat) [%] 93% 75% 80% 95%
EER [Btu/h/W] 13.6 17.9 27.2 24
Over
all
Total Net Cooling Capacity [Btu/h] 220015 164746 109804 54906
Total Equipment Power [W] 18306 9366 4487 2280
EER [Btu/h/W] 12.0 17.6 24.5 24.1
Total SHR (include blower heat) [%] 81% 79% 77% 95%
IEER [Btu/h/W] 19.9
ISHR [-] 80%
Table 6: Performance of Combining TD System and VS System with Evaporative Precooling Pad
Parameters Units 100% 75% 50% 25%
Rated Outdoor Air Temperature [F] 95.0 81.5 68.0 65.0
Tan
dem
Gross Cooling Capacity [Btu/h] 164190 91086 66553 Off
Compressor Power [W] 9053 2948 1806 Off
SHR (without blower heat) [%] 68% 75% 71% Off
EER [Btu/h/W] 14.3 20.5 25.3 Off
Vari
ab
le-S
pee
d
Compressor Speed [RPM] 3581 3994 2741 2492
Gross Cooling Capacity [Btu/h] 75926 84970 55209 59933
Compressor Power [W] 2515 2800 1194 1039
SHR (without blower heat) [%] 94% 75% 74% 90%
EER [Btu/h/W] 16.4 21.0 29.8 26
Ov
era
ll
Total Net Cooling Capacity [Btu/h] 229431 170831 119529 59942
Total Equipment Power [W] 15752 8388 4442 2330
EER [Btu/h/W] 14.6 20.4 26.9 25.7
Total SHR (include blower heat) [%] 80% 77% 74% 90%
IEER [Btu/h/W] 22.5
ISHR [-] 78%
Step-by-Step Design Improvements
Figure 10 shows the step-by-step design improvements, respectively for the Trio system
and two parallel systems approaches. In Figure 7, “Baseline Fixed Charge” means the
Trane baseline unit. “Opt Config + Fixed Charge” means, in the two-system
configuration, using the compressor combination of ZPS60K5E + ZP67KCE and the VS
OFFICIAL USE ONLY

Trane CRADA final report, October 15, 2015
Page 25 of 54
compressor from Manufacturer B, equal heat exchanger allocations between the two
systems, and the system charges are fixed, without using dedicated subcoolers; in the
one-system (i.e. Trio) configuration, the compressor combination of ZP67KCE +
ZPS60K5E + ZPS49K5E is chosen. “Opt Config + DSC” means using dedicated
subcoolers without specifying the system charge balances. “+EAMS” means using the
indoor EAMS to reduce the indoor blower power consumption and improve the indoor
air flow distribution. “+2RCond” means using a 2-row MHX condenser coil to replace
the 1-row MHX. “+EC” means using the evaporative precooling pad. We can see the
options of “Opt Config”, “+EAMS” make the most significant contributions for reaching
20 IEER; the add-on option of “EC” has a major effect to enhance the IEER above 22.
Using dedicated subcoolers, i.e. “+DSC”, increases the IEER only by 1%, since a
dedicated subcooler maintains subcooling, which increases cooling capacity at the
expense of elevating condensing pressure. Using a 2-row MHX outdoor coil also leads to
small effect in the IEER, because, for a highly modulated system, enhancing heat transfer
would only lead to minor benefits; on the other hand, it increases the condenser fan
power due to the added air side pressure drop. However, to reach the 22 IEER RTU
design target, the marginal benefits provided by the dedicated subcooler and 2-row MHX
condenser options are still needed.
16.0
16.5
17.0
17.5
18.0
18.5
19.0
19.5
20.0
20.5
21.0
21.5
22.0
22.5
23.0
IEERs of Multiple Design Options
Two-circuit
Single-circuit
Figure 10. Step-by-Step Design Improvements
Discussion:
OFFICIAL USE ONLY

Trane CRADA final report, October 15, 2015
Page 26 of 54
We recommended two system configurations for a near 20-ton RTU to reach 20 IEER.
By adding an evaporative precooling pad to these configurations, the IEER can be
enhanced above 22. This basically reaches our project goal, i.e. designing a 22 IEER
RTU. One configuration is to combine three compressors in a Trio system, which uses all
the heat exchanger surface area effectively at part-load conditions. For the Trio system
design, we introduced an innovative concept of combining two UltraTech compressors
(different sizes) with one single-speed compressor, i.e. an unbalanced Trio. This enables
operations at uniformly high compressor efficiency and provides numerous capacity
modulation levels without use of an expensive variable-speed compressor. The other
configuration is to combine two parallel vapor compression systems, using one TD
system and one VS system. The TD system has an un-balanced compressor pair, using an
UltraTech compressor and a single-speed compressor. The VS system is intended to
provide flexible dehumidification and outdoor air treatment.
Building Energy Simulations
In order to estimate energy saving potentials of the high IEER RTUs, whole building
simulations using EnergyPlus 7.2 were conducted. HPDM models of the recommended
Trio system with and without using the evaporative precooling pad, i.e. IEER = 22.3 and
IEER = 20.0, were used to generate performance curves over a wide range of operating
conditions for the simulations, i.e. various compressor speeds, indoor and outdoor
temperatures. The performance curves cover temperature range of 57 °F to 72 °F of
indoor wet bulb temperature, and 55 °F to 125 °F of outdoor dry bulb temperature.
For a minimum efficiency RTU baseline, we obtained normalized performance curves of
a single-speed RTU having an IEER of 11.0. EnergyPlus uses a part load performance
curve to account for cyclic losses, which is the function of a RTU’s degradation
coefficient. For the single speed unit, the degradation coefficient is assumed to be 0.1.
For the high IEER RTUs, cyclic losses are ignored, because a special capacity
modulation strategy will be developed to minimize cyclic operations.
We used the EnergyPlus Example File Generator (U.S. National Renewable Energy
Laboratory) to produce input files for the small size office building used in the
simulations. The building is in a rectangular shape, with a length of 131.2 feet and width
of 65.6 feet, and it has one story and five zones. For cooling season, the zone temperature
is controlled at 75 °F during occupied hours, and allowed to float to 86 °F during
unoccupied hours. As the building energy simulations are conducted in sixteen US cities,
the building envelope characteristics, for example, wall thickness, window sizing, etc.,
are chosen specifically for each climate zone, according to ASHRAE 90.1, 2007. A
HVAC equipment sizing parameter of 1.2 is suggested by the EnergyPlus Example File
Generator, which means multiplying the building design cooling load by 120% to size a
HVAC unit (i.e., 20% oversizing of the RTU is assumed).
OFFICIAL USE ONLY

Trane CRADA final report, October 15, 2015
Page 27 of 54
Figure 11 shows seasonal energy saving percentages, of the two high IEER RTUs in
comparison to the minimum efficiency RTU, in sixteen U.S. cities. One can see that the
20 IEER RTU consistently saves about 40% energy in the sixteen cities. The effect of
adding the condenser evaporative precooling, i.e. 22.3 IEER RTU, varies by locations.
Energy savings at desert conditions, e.g. Phoenix, Las Vegas and Albuquerque can be up
to 60%; however, the evaporative precooling has a minor effect on energy savings in
humid climate zones, for example, Los Angeles and Houston.
0%
10%
20%
30%
40%
50%
60%
Co
olin
g Se
aso
nal
En
erg
y R
ed
uct
ion
s R
ela
tive
to
M
inim
um
Eff
icie
ncy
(1
1 IE
ER)
RTU
20 IEER + EC 20 IEER RTU
Figure 11. Seasonal Cooling Energy Savings in Sixteen US Cities, of High IEER RTUs, in
Comparison to Minimum Efficiency, Single-Speed RTU (11 IEER)
5. Lab Prototype From the analyses above, it can be seen, to achieve the 22 IEER goal at a 220 kBtu/h
rated cooling capacity, a two-row micro-channel heat exchanger condenser, an
evaporative pre-cooling pad, and an unbalanced tandem compressor set or trio
compressors have to be applied. On the other hand, an alternative measure to boost the
efficiency is to downsize the RTU to a smaller rated capacity, i.e. using the same indoor
coil and single-row micro-channel heat exchanger condenser with a smaller compressor
capacity. In October 2013, Trane shipped a baseline lab test unit to ORNL, as shown
below. It uses the same heat exchangers as the RTU having 220 kBtu/h rated capacity,
having two parallel vapor compression systems, with one using a variable-speed
compressor and the other using a tandem compressor pair. The derated air side rated
cooling capacity is 13-ton at 95°F ambient temperature (the measured refrigerant side
capacity is near 15-ton, and the air side capacity is less due to the cabinet heat loss) and
its IEER is 17.9, as tested by Trane. The 15-ton size (rather than 20-ton) was chosen by
Trane because Trane considered that RTUs in this capacity range have a larger market
share. Successful development in this capacity range can be easily extended to the 10-ton
and 20-ton units.
OFFICIAL USE ONLY

Trane CRADA final report, October 15, 2015
Page 28 of 54
Starting with this baseline unit, ORNL modified its indoor air handling system and
selected more efficient compressors, following the optimized design as noted above to
hopefully achieve a 22 IEER.
Figure 12. Trane Breadboard Lab Unit (Voyager II-180)
The lab test prototype system configuration after modifications and instrumentation is
illustrated in Figure 13. We combined the original two parallel vapor compression
systems into one, to more fully utilize the heat exchangers at part-load conditions, as
single system design is considered more promising to make the 22.0 IEER target. In
addition, we added a micro-channel submerged subcooler, placed in the condensate
collection pan of the evaporator. The design intent here was to recover “free” cooling
energy before the condensate water flows away. In addition, this leads to a similar effect
as a “dedicated subcooler” and also serves as a refrigerant charge buffer to prevent two-
phase refrigerant exiting the condenser at part-load conditions.
OFFICIAL USE ONLY

Trane CRADA final report, October 15, 2015
Page 29 of 54
PT
P T
T
T
PT M
T
T
Submerged Subcooler
Trio UltraTech Compressors
Three parallel back-curved Ebm-papst indoor blowers
PT
WW W
WW
M – Refrigerant Mass Flow Meter – Number: 1W – Power transducer -Number: 5T – Insertion probe thermo-couple – Number: 8P – pressure transducer- Number: 4
Two Ebm
-papst condenser axial fans
Figure 13. Lab prototype RTU system schematic.
Blowers and Fans
We replaced the centrifugal, forward-curved, baseline indoor blower with three
centrifugal, backward-curved blowers, i.e. K3G355-AX56-90 from the Ebm-papst
Company. The three parallel blowers run with the same RPM. This modification will
bring three benefits:
1. Fan power saving: the blower power savings can be seen in the table below:
Table 7. Blower power savings using three Ebm-papst indoor blowers vs. baseline blower.
Fan Used K3G355-AX56-90
(Three)
Baseline blower (One)
Total Power at:
5250 CFM @ 0.53 inH2O Total
SP (TSP)
816 W 1277 W
3938 CFM @ 0.30 inH2O TSP 417 W 650 W
2625 CFM @ 0.13 inH2O TSP 167 W 246 W
1313 CFM @ 0.03 inH2O TSP 34.2 W Unable to run at such a low CFM
2. Larger air flow modulation range: the original indoor blower can only control the
indoor air flow rate down to 50% at a standard external static head (AHRI standard
340/360), on the other hand, the three Ebm-papst blowers are able to modulate the air
flow rate from 100% to 10%. This gives us more flexibility to optimize the indoor air
flow rate to maximize the IEER and better control the sensible heat ratio.
3. Better air flow distribution: Arrangement of the three Ebm-papst indoor blowers is
shown in Figures 14 and 15. Orientation of the Trane baseline blower can be seen in
OFFICIAL USE ONLY

Trane CRADA final report, October 15, 2015
Page 30 of 54
Figure 16. The new blower placement facilitates one more fan air inlet, and changes
the air intake direction from vertical to horizontal. In addition, moving the original
blower housing out of the flow path, clears a large portion of the indoor coil frontal
area. Consequently, the new fan arrangement results in much more uniform air flow
distribution entering the indoor coil, which was verified by Fluent CFD simulations,
as shown in Figure 17 and 18.
Figure 14. Three fan holes of Ebm-paspt indoor blowers
Figure 15. Backward-curved fan blades of Ebm-papst indoor blowers
OFFICIAL USE ONLY

Trane CRADA final report, October 15, 2015
Page 31 of 54
Figure 16. Arrangement of Baseline Centrifugal Blower
Figure 17. Air velocity entering the indoor coil with Trane baseline blower, at 3300 CFM flow rate
OFFICIAL USE ONLY

Trane CRADA final report, October 15, 2015
Page 32 of 54
Figure 18. Air velocity entering the indoor coil with three Ebm-papst blowers, at 3300 CFM flow rate
We also replaced the original condenser fans with two ECM, axial fans from Ebm-papst
(model W3G710-GU). The new fans facilitate a larger air flow modulation range, in
comparison to the original condenser fans, as shown in Table 8. It can be seen that the
Ebm-papst condenser fans only lead to minor reductions in power consumption, and thus,
it might be OK to keep the baseline condenser fans as a more cost effective design.
Table 8. Condenser fan power savings using two Ebm-papst ECM fans vs. baseline fans.
Fan Used W3G710 (Two) – ORNL data Baseline Fans (Two) – Trane data
Total Power at: [W] [W]
100% capacity 951 (45% fan flow) 786
75% capacity 481 (35% fan flow) 549
50% capacity 210 (25% fan flow) 265
25% capacity 210 (25% fan flow) 410
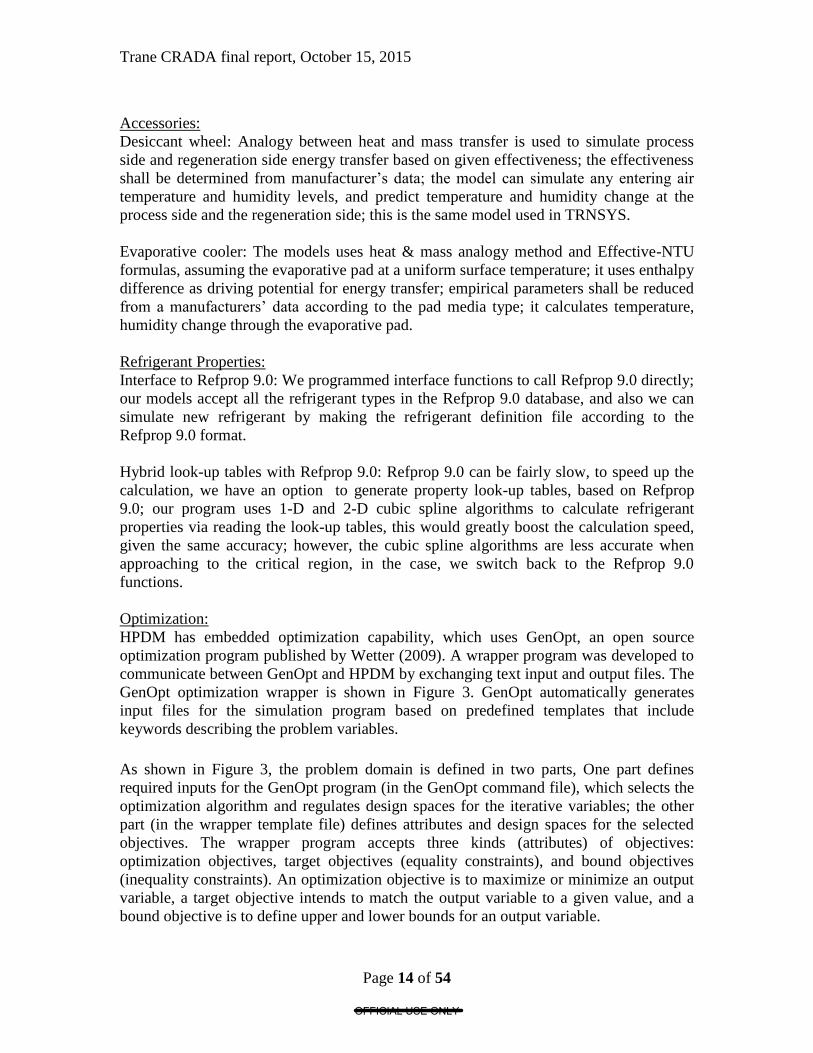
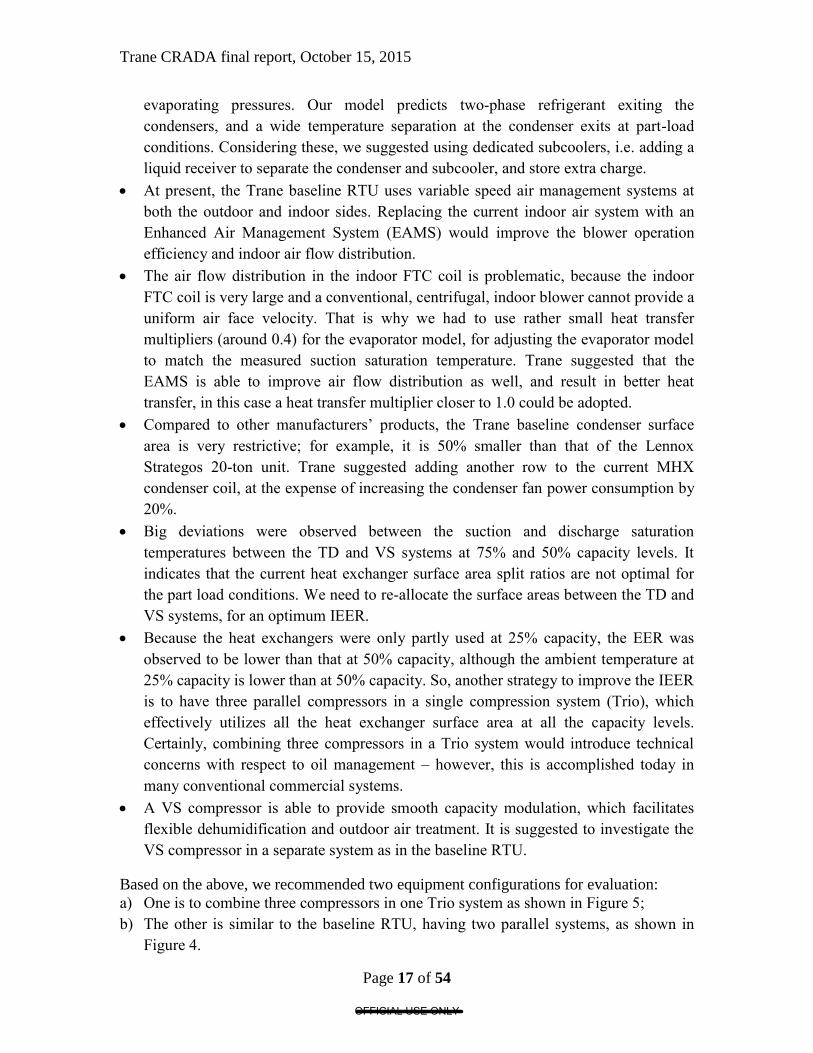
Per Trane’s request, we evaluated three condenser fan configurations, using W3G710.
The first is an “extruded” version, with condenser fans placed at the top of the outdoor
unit, recommended by Ebm-papst, as shown in Figure 18. To dock multiple RTUs
together during transportation, Trane required Ebm-papst to make a special “flat top”
version, shown in Figure 20, i.e. having the fans sunk beneath the top of the outdoor unit.
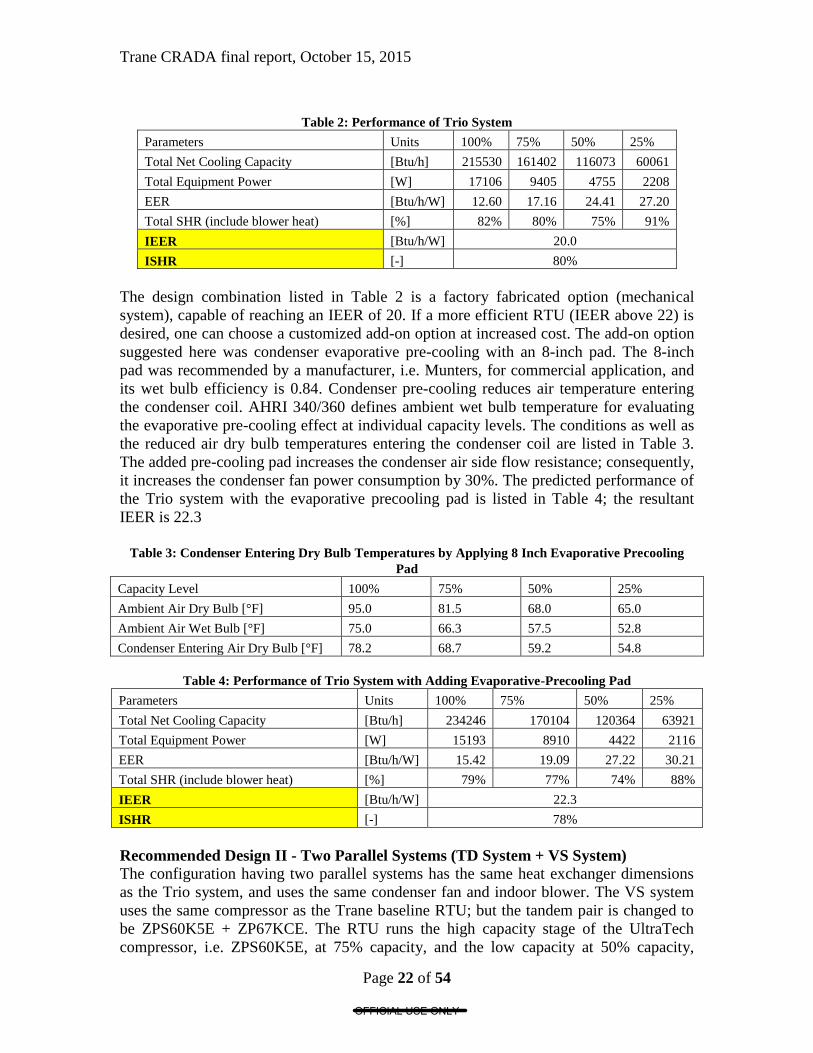
We conducted fan only performance tests to compare the energy consumptions of the two
configurations, as shown in Figure 21 and Table 9. In Figure 21, the condenser flow
percentage is defined as (operating RPM/Max fan RPM), and both condenser fans run
with the same RPM. It can be seen that the “Flat-top” design led to smaller fan power
consumption at the same RPM, except the lowest 20% RPM. In any case, the effect on
the system performance, due to the condenser fan arrangement, was observed to be
negligible.
OFFICIAL USE ONLY
Trane CRADA final report, October 15, 2015
Page 33 of 54
Figure 19. “Extruded” condenser fans
Figure 20. “Flat top” condenser fans
Figure 21. Comparing condenser fan powers between the “Extruded” and “Flat-top” designs, as a
function of the condenser fan flow fraction
OFFICIAL USE ONLY

Trane CRADA final report, October 15, 2015
Page 34 of 54
Table 9. Condenser fan power consumptions of the “Extruded” and “Flat-top” designs
Percentage
of RPM Flat-top Extruded Dev_w Dev_%
% [W] [W] [W] %
20 183.3 140.3 -43.0 -30.7%
23 176.5 184.4 7.9 4.3%
25 210.6 221.5 10.9 4.9%
28 272.2 288.2 16.0 5.5%
30 321.4 342.0 20.6 6.0%
33 407.9 436.8 28.9 6.6%
35 475.0 510.6 35.6 7.0%
38 590.3 637.3 46.9 7.4%
40 678.1 733.4 55.3 7.5%
43 822.2 895.8 73.6 8.2%
45 931.0 1010.2 79.1 7.8%
48 1111.5 1206.5 95.0 7.9%
50 1243.9 1352.0 108.1 8.0%
55 1609.6 1752.1 142.5 8.1%
Figure 22. Ebm-Papst AxiTop Diffuser
As shown in Figure 22, the Ebm-Papst company suggested putting two AxiTop diffusers
on the “Flat-top” condenser fans could boost the fan efficiency by converting the exit air
velocity to static head. We evaluated the effect of adding the AxiTop diffusers, but found
no noticeable benefits at all, for both the condenser fan power consumption and system
efficiency.
Compressors
We selected the most efficiency compressor combinations in the interested capacity
levels, i.e. having 100% capacity from 13-to to 15-ton. They are ZP49K5E (single speed
compressor) +2×ZPS49K5E (two-speed, UltraTech compressors). This combination will
facilitate most efficient operations at 100%, 75%, 50% and 25% capacity levels for the
OFFICIAL USE ONLY

Trane CRADA final report, October 15, 2015
Page 35 of 54
IEER rating. Per our request, Copeland Company made a special combination of three
scroll compressors (not available on the market).
To justify the selection, Figure 23 compares part-load isentropic efficiencies of the
Copeland UltraTech ZPS49K at the low stage, and variable-speed compressor of ZPV063
at 1800 RPM speed level. It can be seen that the part-load efficiencies of ZPV063 drop
significantly in the targeted operation range (i.e. condensing temperature (Tc) from 80°F
to 100°F, and the evaporating temperature (Te) from 50°F to 60°F). The combination
including ZPS49K has a better chance leading to higher EERs at part-load conditions.
-10 0 10 20 30 40 50 60 700.2
0.3
0.4
0.5
0.6
0.7
0.8
Te [F]
his
n
150 F140 F
130 F
120 F
110 F
100 F
90 F
80 F
Isentropic Efficiency of Copeland Scroll ZPV063
Tc
1800 rpm
Figure 23. Part-load efficiencies of ZPS49K and ZPV063
Table 10. Predicted system performance indices with using Trio (ZP49K5E +2*ZPS49K5E) and
2*ZPV63
Parameters Units
100%
Capacity
75%
capacity
50%
Capacity
25%
Capacity
IEER
Rated Outdoor Air
Temperature [F] 95.0 81.5 68.0 65.0
Weight Ratio in IEER
Equation [%] 2.0% 61.7% 23.8% 12.5%
Suction Saturation
Temperature [F] 51.23 52.98 50.90 56.77
Discharge Saturation
Temperature [F] 117.59 100.88 85.94 75.38
Trio (ZP49K5E
+2*ZPS49K5E ) EER 13.21 18.35 24.95 33.15
21.7
Trio (ZP49K5E
+2*ZPS49K5E ) SHR 77% 78% 72% 91%
2*ZPV63 (same speed, run
one at 25% capacity) EER 12.39 17.99 24.60 27.61 20.7
Speed (2*ZPV63) RPM 6300 (Two) 4300 (Two) 2700 (Two) 2500 (One)
Table 10 lists predicted system performance indices calculated with the HPDM for 1) the
Trio combination of (ZP49K5E +2*ZPS49K5E) and 2) two variable-speed compressors
OFFICIAL USE ONLY

Trane CRADA final report, October 15, 2015
Page 36 of 54
of 2*ZPV63 in the lab prototype RTU. Both the compressor combinations were
modulated to reach the same capacities from 25% to 100%. It can be seen that the trio
compressor combination achieves a unit higher IEER than the combination of two
identical variable-speed compressors.
Figure 24 shows the trio compressor combination installed in the lab prototype. Each of
the compressors has an oil level sight tube to visualize the oil level. They are also
connected with oil equalization lines to balance the oil levels, and suction equalization
lines to balance the shell side pressures. A suction line assembly collects and distributes
the refrigerant flow to the three compressors, and a discharge line assembly gathers the
refrigerant discharge gas out of the three compressors.
Figure 24. Trio Compressors (ZP49K5E +2×ZPS49K5E)
6. Test Facilities and Instrumentations Tests of the prototype RTU system were carried out in ORNL’s environmental chambers.
These chambers consist of two temperature and humidity controlled insulated rooms to
maintain the desired operating conditions for the tests. The indoor air flow rate is
measured using a Fan-Evaluator (i.e. Pitot-traverse air flow meter), which has ±2%
certified measurement accuracy. The Fan-Evaluator was placed at the return duct of the
RTU, as shown in Figure 25. A variable-speed blower was installed at the supply exit of
the ductwork to adjust the external static pressure, as shown in Figure 26. A VELTRON
DPT 2500-plus differential pressure transducer was used to monitor the external static
pressure (ESP), as shown in Figure 27, having an accuracy of ±0.25% to the natural span
of 1 in WC. The pressure taps of the differential pressure transducer were placed at the
return and supply ports of the RTU. A drawing of the supply and return ductwork, the
OFFICIAL USE ONLY

Trane CRADA final report, October 15, 2015
Page 37 of 54
Fan-Evaluator and the variable-speed booster blower and the pressure taps are shown in
Figure 28.
Figure 25. Fan-Evaluator to measure indoor air flow rate
Figure 26. Variable-speed booster fan to control external static head
OFFICIAL USE ONLY

Trane CRADA final report, October 15, 2015
Page 38 of 54
Figure 27. Ductwork and differential pressure sensor to measure the external static pressure
Figure 28. Plan view of RTU Lab Setup.
All air side temperature measurements were performed with Type T (copper-constantan),
wire thermocouples. A grid of nine (3×3) thermocouples was installed at the inlet and
exit ports of the indoor air flow path in the RTU, respectively, to indicate the return and
supply air temperatures. A grid of sixteen thermocouples was installed at the condenser
coil face to measure the inlet ambient air temperature. The indoor and outdoor air
temperatures were recorded by averaging the readings of the thermocouple grids. Two
HC2S3-L temperature and RH sensors, from the Campbell Scientific Company, were
used to measure the return and supply air relative humidity, and the accuracy of the RH
sensors is ±0.8% RH.
OFFICIAL USE ONLY

Trane CRADA final report, October 15, 2015
Page 39 of 54
GW5 watt transducers from Ohio Semitronics, INC were used to measure the power
draw, with an accuracy of 0.2% to the reading. Three watt transducers were used to
measure the power draws of individual compressors, one watt transducer was used to
measure the total power draw of the three indoor blowers, and one watt transducer was
used for the two condenser fans.
7. Final Lab Measured IEER Using R410A
As illustrated in Equation 1, the IEER rating is calculated based on tests conducted at
four standard rating conditions, i.e. Condition A - at 100% capacity and 95 °F ambient
temperature, Condition B - at 75% capacity and 81.5 °F, Condition C - at 50% capacity
and 68 °F, Condition D –at 25% capacity and 65 °F. For the RTU with the three parallel
compressors, i.e. two two-speed compressors and one single-speed compressor, the
required tests needed to match the four capacity levels are listed below.
1. The performance results at Condition A were obtained by running three compressors
at full speed.
2. The performance results at Condition B were obtained by interpolating the results of
two steady-state, tested scenarios to match the 75% capacity. One scenario used the
single-speed compressor and one two-speed compressor operating at the high speed
(B2 Test), and the other scenario used a single-speed compressor (B1 Test).
3. The performance results at Condition C were obtained by interpolating the results of
two steady-state tests scenarios to match the 50% capacity. One scenario used the two
two-speed compressors operating at low speed (C2 Test), and the other used the
single-speed compressor (C1 Test).
4. The performance results at Condition D were obtained by testing a single two-speed
compressor at the low speed. Since the tested steady-state capacity was higher than
the required 25% capacity, cyclic losses per AHRI 340/360 were included to match
the 25% capacity exactly.
It should be mentioned that, at the part-load conditions, the ESP is controlled (by
adjusting the speed of a booster fan) to decrease approximately with the air flow rate ratio
squared as would be the case in an actual application. The indoor air flow rates were
measured at the return side at 80°F Dry Bulb/67°F Wet Bulb. The air flow rates were
adjusted to maintain an approximately constant supply air temperature of 60°F at part-
load conditions. If it is needed to convert the air flow rate from the return side to the
supply side, one may apply a constant multiplier of 0.96, i.e. the ratio of the air density at
80°F/67°F to the density at 60°F Dry Bulb/90% Relative Humidity. That means the full
air flow rate of 5500 CFM at the return side is equivalent to 5280 CFM at the supply side.
The final laboratory RTU prototype, using R410A, reached a measured 21.6 IEER, at the
rated cooling capacity of 13-ton. The measured performance indices at the four IEER
rating capacity levels are listed in Table 11. Table 11. Measured IEER of Lab Prototype with R-410A at 13-ton Nominal Capacity
Parameters Units
A-100%
Capacity
B-75%
Capacity
C-50%
Capacity
D-25%
Capacity
Rated Outdoor Air Temperature [F] 95.0 81.5 68.0 65.0
OFFICIAL USE ONLY

Trane CRADA final report, October 15, 2015
Page 40 of 54
Rated Indoor Air Temperature [F] 80.0 80.0 80.0 80.0
Rated Indoor Air Wet Bulb [F] 67.0 67.0 67.0 67.0
Weighting in IEER Equation [%] 2.0% 61.7% 23.8% 12.5%
Suction Saturation Temperature [F] 49.3 N/A N/A 53.4
Discharge Saturation Temperature [F] 115.5 N/A N/A 76.3
Total Indoor Air Flow at Return Side [cfm] 5531 N/A N/A 2332
Blower External Resistance [in WC] 0.35 N/A N/A 0.08
Total Blower Power [W] 867 N/A N/A 150
Total Condenser Fan Power [W] 945 N/A N/A 210
Total Compressor Power [W] 11545 N/A N/A 1421
Condenser Exit Subcooling [R] 16.5 N/A N/A 9.8
Submerged Subcooler Temp Drop [R] 4.0 N/A N/A 1.9
Compressor Suction Superheat Degree [R] 11.6 N/A N/A 7.3
Total Net Cooling Capacity (Air Side) [Btu/h] 155413 116560 77707 56132
Total Equipment Power [W] 13357 6391 2979 1780
Energy Balance (Air side capacity –
Refr side capacity)/Air side capacity [%] -15% N/A N/A 4%
EER [Btu/h/W] 11.6 18.5 26.1
29.4 (with
cyclic loss)
Total SHR (including blower heat) [%] 75% 77% 78% 82%
IEER [Btu/h/W] 21.6
ISHR (Integrated SHR) [-] 77%
It should be noted that the energy balance between the air side and refrigerant side
capacities was calculated at each capacity level. The refrigerant side capacity was
obtained by multiplying the compressor-map-predicted mass flow rate, at the measured
suction and discharge saturation temperatures, with the refrigerant enthalpy difference
measured across the evaporator. It can be seen that, at 95°F ambient temperature, the air
side capacity is 15% less than the refrigerant side, due to the RTU cabinet heat loss, i.e.
heat transfer between the 95°F ambient and 60°F supply air, through the RTU cabinet.
The measured performance results for the B2, B1, C2, and C1 tests are listed in Table 12.
The performance results at Condition B were obtained by interpolating the B2 and B1
results. The performance results at Condition C were obtained by interpolating the C2
and C1 results. Table 12 also includes one more steady-state test, i.e. C1_Low, which ran
the low stage of a single ZPS49K compressor at 68°F ambient temperature.
Table 12. Test data at B2, B1, C2, C1 and C1_Low conditions, used for interpolation
Parameters Units B2 B1 C2 C1 C1_Low
Rated Outdoor Air Temperature [F] 81.23 81.26 67.79 67.86 68.21
Rated Indoor Air Temperature [F] 80.29 80.21 80.45 80.06 80.50
Rated Indoor Air Wet Bulb [F] 67.0 67.0 67.0 67.0 67.0
Suction Saturation Temperature [F] 52.3 53.8 52.7 53.3 54.6
Discharge Saturation Temperature [F] 99.3 93.7 86.2 82.0 79.2
Total Indoor Air Flow at Return Side [cfm] 4659 2363 3979 2767 2281
Blower External Resistance [in WC] 0.25 0.07 0.19 0.09 0.08
Total Blower Power [W] 553 147 402 193 149
OFFICIAL USE ONLY

Trane CRADA final report, October 15, 2015
Page 41 of 54
Total Condenser Fan Power [W] 494 257 325 212 207
Total Compressor Power [W] 6236 2910 3528 2504 1489
Condenser Exit Subcooling [R] 10.6 7.4 15.6 7.1 9.8
Submerged Subcooler Temp Drop [R] 3.8 4.9 1.2 4.2 0.7
Compressor Suction Superheat Degree [R] 11.0 9.4 9.5 9.2 7.9
Total Net Cooling Capacity (Air Side) [Btu/h] 130526 68389 103087 76328 55078
Total Equipment Power [W] 7283 3314 4254 2910 1845
Energy Balance (Air side capacity –
Refr side capacity)/Air side capacity [%] -6% -4% -1% 2% 2%
EER [Btu/h/W] 17.9 20.6 24.2 26.2 29.9
Total SHR (including blower heat) [%] 77% 75% 80% 78% 83%
Ratio to rated capacity [%] 84% 44% 66% 49% 35%
Two US manufacturers offer high efficiency RTUs with advertised IEERs higher than
20.0 - Carrier, with a 21.0 IEER model, and Lennox, with a 22.0 IEER model. However,
their high IEERs were obtained only at low rating capacities. For example, the Carrier
21.0 IEER unit has a 10-ton rated cooling capacity, and the Lennox 22 IEER unit is their
7.5-ton model. The IEER will drop as the rated cooling capacity increases within in the
same product series. For the rated capacity of 13-ton, the most efficient (e.g., Max Tech)
RTU on the market is the 19.1 IEER Carrier WeatherExpert. Thus, the ORNL prototype
has a 12% better IEER than the current best available. On the other hand, if we de-rate
the prototype’s nominal cooling capacity to 10 tons, i.e. define the RTU’s rated capacity
to be 10 tons and allow the system to run with lower refrigerant mass flow rates at the
IEER rating conditions, it’s IEER rating increases to 22.7. The figure below compares the
measured IEERs of the ORNL prototype, using R410A, with rated IEERs of the Max
Tech on the market at similar rated capacity levels. It can be seen ORNL’s advanced
RTU using R-410A, is 12% to 16% more efficient than the current Max Tech.
18.00
19.00
20.00
21.00
22.00
23.00
10 11 12 13 14 15
IEER
Rated Cooling Capacity [Ton]
ORNL Prototype
Carrier WeatherExpert
Figure 29. IEER vs. rated cooling capacity for the prototype RTU and current Max Tech
unit on the market
OFFICIAL USE ONLY

Trane CRADA final report, October 15, 2015
Page 42 of 54
We also conducted building energy simulations, using performance data of the lab
prototype having 21.6 IEER, and the same small office building type over sixteen US
cities. The energy saving results are given in Figure 30. The seasonal energy saving
potentials vary from 44% to 50%, in comparison to a minimum efficiency, single-speed
RTU having 11.0 IEER.
0%
5%
10%
15%
20%
25%
30%
35%
40%
45%
50%C
oo
ling
Seas
on
al E
ne
rgy
Re
du
ctio
ns
Re
lati
ve t
o
Min
imu
m E
ffic
ien
cy (
11
IEER
) R
TU
21.6 IEER RTU
Figure 30. Seasonal Cooling Energy Savings in Sixteen US Cities, of 22 IEER RTU, in Comparison to
Minimum Efficiency, Single-Speed RTU (11 IEER)
Oil Return Tests
In order to maintain reliable compressor lubrication, we assessed the oil return
performance at various capacity levels for extensive running periods, i.e. running the
RTU at each capacity level continuously for 3 hours. The oil returns were observed to be
reliable, except at the lowest capacity. When only running the low stage of one UltraTech
ZPS49K compressor, the vapor velocity was too small to carry the lubricant back from
the evaporator and the suction lines. A special control strategy will be used to secure the
oil return. If the RTU runs at the lowest stage for a long period of time, for example,
more than one hour, the compressor capacity will be ramped up, i.e. running more than
one compressor, for three to five minutes to return the oil to the compressors. This
control strategy has been adopted widely for variable-speed compressors on the market.
Evaluation of a Fan-Driven Evaporative Subcooler
In order to fully recover the free latent cooling energy from the condensate water, we
investigated a fan driven subcooler as illustrated below. The fan assembly pumps the
condensate water from a collection barrel, and sprays a very thin mist on a subcooler coil.
The evaporative subcooler was installed in the RTU to evaluate its effect on the IEER.
The subcooler’s fan assembly consumed 100 Watts, the evaporative subcooler increased
the subcooling degree by 10°R and resulted in decreased condensing pressure and
compressor power. The evaporative subcooler consumed about 0.5 gallons of water per
hour as measured, much less than the condensate water produced by the RTU under the
IEER testing conditions (1.5 to 3.9 gallon/hour). At test Conditions A and B, compressor
power savings exceeded the extra subcooler fan power. However, at the part load
conditions of C and D, the added subcooler fan power offset the reduction of the
compressor power. With the evaporative subcooler, we were able to achieve an IEER
OFFICIAL USE ONLY
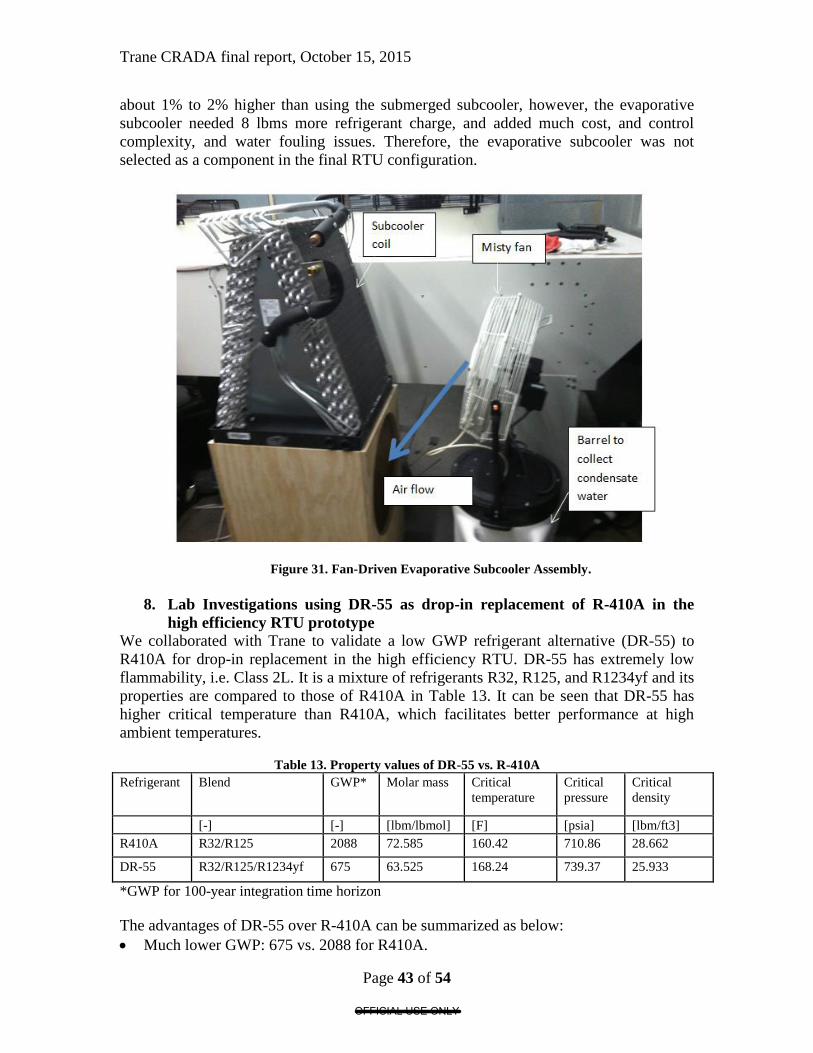
Trane CRADA final report, October 15, 2015
Page 43 of 54
about 1% to 2% higher than using the submerged subcooler, however, the evaporative
subcooler needed 8 lbms more refrigerant charge, and added much cost, and control
complexity, and water fouling issues. Therefore, the evaporative subcooler was not
selected as a component in the final RTU configuration.
Figure 31. Fan-Driven Evaporative Subcooler Assembly.
8. Lab Investigations using DR-55 as drop-in replacement of R-410A in the
high efficiency RTU prototype
We collaborated with Trane to validate a low GWP refrigerant alternative (DR-55) to
R410A for drop-in replacement in the high efficiency RTU. DR-55 has extremely low
flammability, i.e. Class 2L. It is a mixture of refrigerants R32, R125, and R1234yf and its
properties are compared to those of R410A in Table 13. It can be seen that DR-55 has
higher critical temperature than R410A, which facilitates better performance at high
ambient temperatures.
Table 13. Property values of DR-55 vs. R-410A
Refrigerant Blend GWP* Molar mass Critical
temperature
Critical
pressure
Critical
density
[-] [-] [lbm/lbmol] [F] [psia] [lbm/ft3]
R410A R32/R125 2088 72.585 160.42 710.86 28.662
DR-55 R32/R125/R1234yf 675 63.525 168.24 739.37 25.933
*GWP for 100-year integration time horizon
The advantages of DR-55 over R-410A can be summarized as below:
Much lower GWP: 675 vs. 2088 for R410A.
OFFICIAL USE ONLY

Trane CRADA final report, October 15, 2015
Page 44 of 54
Better system efficiency and larger capacity: ~5% higher at IEER conditions.
10% less charge required than R410A to achieve the same subcooling degree.
Direct design-compatible replacement for R410A: Lower pressure refrigerant,
comparable discharge temperature, same lubricant, tubing, valves… only needs minor
adjustments for expansion devices.
We can re-purpose the R410A by adding R32 and R1234yf to the recovered 410A.
Significantly better high-ambient performance: 12% to 27% better than R410A from
95°F to 125°F
As shown below, Figure 32 overlays the pressure-enthalpy diagrams of DR-55 vs.
R410A. The DR-55 has a wider dome, i.e. bigger latent capacity per unit mass flow, and
higher critical temperature. Figure 33 shows the temperature-density diagrams, which
indicates that DR-55 has a smaller vapor density at the same suction saturation
temperature, and thus, results in a smaller refrigerant mass flow rate and power
consumption. Figure 34 compares the pressure-temperature diagrams, which shows that
DR-55 has negligible temperature glide, around 2 R, and lower pressure at the same
saturation temperature.
Figure 32. P-H diagram of DR-55 vs. R410A
Figure 33. Temperature-density diagram of DR-55 vs. R410A
OFFICIAL USE ONLY

Trane CRADA final report, October 15, 2015
Page 45 of 54
Figure 34. P-T diagram of DR-55 vs. R410A
From our laboratory testing, the RTU prototype with the low GWP refrigerant showed
better performance with increases in both cooling capacity and efficiency. The new
refrigerant led to 22.6 IEER at the rated capacity of 13.5-ton and 24.0 IEER at the rated
capacity of 10-ton. The system required a DR-55 charge of 25.25 lbs to match the same
subcooling degree at the R-410A system. The performance testing results of DR-55 at
25.25 lbs charge are given in Table 14 and 15.
Table 14. Measured IEER of 13.5-ton Lab Prototype using 25.25 lbs of DR-55
Parameters Units
A-100%
Capacity
B-75%
Capacity
C-50%
Capacity
D-25%
Capacity
Rated Outdoor Air Temperature [F] 94.58 81.35 67.64 65.01
Rated Indoor Air Temperature [F] 80.46 80.42 80.12 80.19
Rated Indoor Air Wet Bulb [F] 67 67 67 67
Suction Saturation Temperature [F] 51.7 N/A N/A 55.7
Discharge Saturation Temperature [F] 116.9 N/A N/A 77.0
Total Indoor Air Flow at Return Side [cfm] 5514 N/A N/A 2235
Blower External Resistance [in WC] 0.34 N/A N/A 0.08
Total Blower Power [W] 817 N/A N/A 140
Total Condenser Fan Power [W] 947 N/A N/A 205
Total Compressor Power [W] 11012 N/A N/A 1305
Condenser Exit Subcooling [R] 16.9 N/A N/A 8.6
Submerged Subcooler Temp Drop [R] 4.5 N/A N/A 1.6
Compressor Suction Superheat Degree [R] 11.5 N/A N/A 5.8
Total Net Cooling Capacity (Air Side) [Btu/h] 165273 123955 82637 55641
Total Equipment Power [W] 12775 N/A N/A 1649
EER [Btu/h/W] 12.9 19.4 26.6
31.8 (w
cyclic loss)
Total SHR (including blower heat) [%] 74% 76% 80% 81%
IEER [Btu/h/W] 22.55
ISHR (Integrated SHR) [-] 78%
OFFICIAL USE ONLY

Trane CRADA final report, October 15, 2015
Page 46 of 54
Table 15. Test data at B2, B1, C2, C1 and C1_Low conditions, used for interpolation, with 25.25 lbs
of DR-55
Parameters Units B2 B1 C2 C1 C1_Low
Rated Outdoor Air Temperature [F] 81.4 81.2 68.0 67.5 68.2
Rated Indoor Air Temperature [F] 80.4 80.6 80.4 80.0 80.2
Rated Indoor Air Wet Bulb [F] 67.0 67.0 67.0 67.0 67.0
Suction Saturation Temperature [F] 54.7 54.5 55.5 54.5 56.2
Discharge Saturation Temperature [F] 100.8 96.2 86.6 83.8 80.6
Total Indoor Air Flow at Return Side [cfm] 4730 2271 4183 2754 2251
Blower External Resistance [in WC] 0.23 0.07 0.19 0.09 0.08
Total Blower Power [W] 544 139 430 186 140
Total Condenser Fan Power [W] 477 250 315 207 206
Total Compressor Power [W] 5949 2778 3230 2399 1391
Condenser Exit Subcooling [R] 14.3 10.7 14.4 12.1 9.1
Submerged Subcooler Temp Drop [R] 3.2 4.8 1.9 0.5 3.0
Compressor Suction Superheat Degree [R] 10.5 8.8 9.5 8.1 6.1
Total Net Cooling Capacity (Air Side) [Btu/h] 132789 68280 102091 75381 55041
Total Equipment Power [W] 6970 3167 3974 2791 1736
EER [Btu/h/W] 19.1 21.6 25.7 27.0 31.7
Total SHR (including blower heat) [%] 77% 73% 84% 79% 81%
Ratio to rated capacity [%] 80% 41% 62% 46% 33%
Figure 35 shows ratios of EERs of DR-55 versus R410A at the four IEER ambient
conditions and capacity levels. These results indicate that, with DR-55, the prototype
IEER increases by 5%.
0.85
0.90
0.95
1.00
1.05
1.10
1.15
A-100% capacity at95F
B-75% capacity at81.5F
C-50% capacity at68F
D-25% capacity at65F
IEER
Ratio
of E
ER
Ratios of EERs at IEER Conditions and Capacity Levels, DR-55 vs. R410A
Figure 35. Ratios of EErs at four IEER conditions, DR-55 vs. R410A.
High Ambient Performance Tests
A RTU using R410A is known to have noticeable performance degradation at high
ambient temperatures, when its discharge pressure approaches critical point. The selected
low GWP, drop-in refrigerant, i.e. DR-55, is slightly flammable, and thus, is subject to a
OFFICIAL USE ONLY

Trane CRADA final report, October 15, 2015
Page 47 of 54
high discharge temperature limitation. To identify these issues, high ambient tests were
conducted according to the test matrix in Table 16, by increasing the ambient temperature
from 95°F to 125°F, having one charge level for R410A and three charge levels for DR-
55.
Table 16. Test Matrix at High Ambient Temperatures
Refrigerant Charge Ambient Temperatures Measured IEER at 13-ton rated capacity
R410A 28 lbs. 95°F, 105°F, 115°F, 125°F 21.6
DR-55 24.0 lbs. 95°F, 105°F, 115°F, 125°F 22.3
DR-55 24.75 lbs. 95°F, 105°F, 115°F, 125°F N/A
DR-55 25.25 lbs. 95°F, 105°F, 115°F, 120°F* 22.7
*Note: At the DR-55 charge of 25.25 lbs, we didn’t run 125°F, as a safety precaution to prevent
the compressors from being inadvertently overheated.
Figure 36 illustrates compressor discharge temperature vs. ambient temperature for both
R410A and DR-55. One can see that, at the highest tested ambient temperatures (115°F
and 120°F) with a DR-55 charge of 25.25 lbs. the prototype has 12°R higher discharge
temperatures than with the original R410A charge of 28 lbs. Assuming this difference
also holds true for the 125°F ambient condition, the discharge temperature for the 25.25
lbs. DR-55 charge should still be below the acceptable discharge temperature of 235°F.
140
150
160
170
180
190
200
210
220
230
240
90 100 110 120 130
Co
mp
ress
or
Dis
char
ge T
em
pe
ratu
re [
F]
Ambient Temperature [F]
Discharge Temperatures at High Ambient Temperatures
DR-55, 25.25lb
DR-55, 24.75lb
DR-55, 24lb
R410A, 28lb
Figure 36. Compressor discharge temperature vs. ambient temperature for R410A and DR-
55.
Figures 37 and 38 show the cooling capacity and EER vs. ambient temperature. Figure 39
shows ratios of the performance indices between DR-55 and R410A. It can be seen that
DR-55’s cooling performance degrades less than R410A at high ambient temperatures.
Its capacity ratio over R410A increases from 1.05 to 1.20, and efficiency ratio increases
from 1.12 to 1.26, when changing the ambient temperature from 95°F to 125°F.
OFFICIAL USE ONLY

Trane CRADA final report, October 15, 2015
Page 48 of 54
100000
110000
120000
130000
140000
150000
160000
170000
90 100 110 120 130
Co
olin
g C
apai
cty
[Btu
/hr]
Ambient Temperature [F]
Capacities at High Ambient Temperatures
DR-55, 25.25lb
DR-55, 24.75lb
DR-55, 24lb
R410A, 28lb
Figure 37. Full cooling capacity vs. ambient temperature
5
6
7
8
9
10
11
12
13
14
90 100 110 120 130
EER
Ambient Temperature [F]
EERs at High Ambient Temperatures
DR-55, 24lb
DR-55, 24.75lb
DR-55, 25.25lb
R410A, 28lb
Figure 38. EER vs. ambient temperature
OFFICIAL USE ONLY

Trane CRADA final report, October 15, 2015
Page 49 of 54
0.90
0.95
1.00
1.05
1.10
1.15
1.20
1.25
1.30
90 95 100 105 110 115 120 125 130
Rat
io (
DR
-55
/R4
10
A)
Ambient Temperature [F]
Ratios of Performance Indices at High Ambient Temperatures
Ratio of EER, DR-55-24.75lb/R410A-28lb
Ratio of EER, DR-55-25.25lb/R410A
Ratio of Capacity, DR-55-25.25lb/R410A
Ratio of Capacity, DR-55-24.75lb/R410A-28lb
Ratio of Compressor Power, DR-55-25.25lb/R410A
Ratio of Total Compressor Power,DR-55-24.75lb/R410A-28lb
Figure 39. Ratios of performance indices between DR-55 and R410A under high ambient
temperatures
9. Next Step – Field Testing in ORNL’s Flexible Research Buildings We installed the lab prototype in one of the ORNL flexible research platform (FRP)
buildings, shown in Figure 40, for field testing in the next cooling season. The FRP is
one-story, and has a footprint of 40’x60’ (12.1 m x 18.3 m), shown in Figure 41. The
single story test building is designed to approximate early 1990s typical construction with
an open floorplan. The envelope performance was selected accordingly from ASHRAE
90.1-1989. Interior lighting was selected to be conventional T-12 fluorescent fixtures
that were to be suspended from the roof structure. The lighting density was chosen to be
typical for open office usage in the early 1990s. Electrical power provisions were made
to accommodate research equipment that would be used to simulate the electrical
consumption (and resulting heat generation) typical of office occupancy. Domestic water
was designed to serve humidifiers to be located within the test building.
The indoor side of the one-story FRP is shown in Figure 42. It has a single zone and one
thermal stat to sense the zone temperature and humidity. We will apply a single-zone
VAV control strategy for the RTU field testing. It has been mentioned that the FRP has a
design cooling load of 8.5-ton, and thus, the 13-ton RTU prototype is oversized for the
building. In addition, the existing ductwork is too restrictive to run the required air flow
rate for 13-ton cooling capacity. To deal with these issues, we will use electric heaters to
augment the cooling load, and install a booster fan in the ductwork to maintain a
reasonable external static pressure.
OFFICIAL USE ONLY

Trane CRADA final report, October 15, 2015
Page 50 of 54
Figure 40. Field installation of the RTU prototype
Figure 41. ORNL’s one-story flexible research platform building
Figure 42. Indoor side of the one story FRP
RTU Control Strategy
OFFICIAL USE ONLY

Trane CRADA final report, October 15, 2015
Page 51 of 54
Compressor Capacity Modulation:
The high efficiency RTU uses a trio of compressors, including two identical two-speed
compressors (ZPS49K) and one single-speed compressor (ZP49K). When running more
than one stage, we intend the compressors to draw equal mass flow rates, to facilitate
balanced oil returns among the running compressors. As thus, the three compressors will
provide five capacity levels, as below:
Lowest capacity - ZPS49K at low speed
Second stage - ZPS49K at high speed
Third stage - 2×ZPS49K at low speed
Fourth stage - 2×ZPS49K at high speed
Full capacity - ZP49K+ZPS49K×2 at high speed
The compressors will be modulated responding to the difference between the thermostat
setting and the measured zone temperature, i.e. Delta-T. A dead band of 2 R will be used
to turn on/off the RTU. The proposed control sequence is listed below:
When the zone temperature is between 2.0 R to 3.0 R, higher than the temperature
setting, the fourth stage will be turned on.
When the Delta-T is higher than 3.0 R, the full capacity will run.
When the Delta-T is between 1.0 R to 2.0 R, the third stage will run.
When the Delta-T is between 0 R to 1.0 R, the second stage will run.
When the Delta-T is between -2.0 R to 0 R, the first stage will run.
Two cases will activate the oil return mode (shift to third stage operation for 10
minutes). The first case is when the first stage (lowest capacity) continuously runs for
half hour. The second case is that the cycling time of the lowest stage adds up to half
hour in a three-hour period without running the third stage for 10 minutes.
The time interval for sensing the zone temperature is 6 minutes, i.e. the RTU will run
at least 6 minutes before shut off.
The three variable speed indoor blowers will run at the same speed to control a target
supply air temperature. However, the supply air temperature setting will vary for the two
principal cooling modes, i.e. normal cooling and enhanced dehumidification. If it is in the
normal mode, the supply air temperature will be controlled around 60°F. The enhanced
dehumidification mode will be activated, if the humidity sensor senses the zone humidity
level above a threshold. During the enhanced dehumidification mode, the supply
temperature will be controlled to a lower value, for example, 58°F, to increase the
moisture removal of the cooling coil.
The high efficiency RTU has two identical, variable-speed condenser fans. They will run
at the same speed. And the fan RPM will be altered as a function of the compressor
capacity, which was determined during the lab testing.
RTU Control Hardware and Software
We will use control devices from National Instruments (NI), because they are easy to
program and have extensive sensing and control capabilities. A NI cDAQ-9138 (NI
CompactDAQ) device will be used as the main controller, to implement Proportional and
Integral (PI) control on the indoor air flow rate. The controller will also adjust the
OFFICIAL USE ONLY

Trane CRADA final report, October 15, 2015
Page 52 of 54
compressor staging to respond to the Delta-T. Other necessary Input and Output (IO)
devices will be obtained to 1) measure temperatures, pressures, humidities, and air flow
rates, etc. and 2) to produce direct current (DC) control signals and drive relays to operate
the indoor blowers, condenser fans and compressors. In addition, the NI cDAQ device
will be used for data acquisition to collect and store the field-testing data. The control
algorithm will be implemented using LabVIEW, LabVIEW Real-Time Module, and PID
Toolkit.
10. Conclusion Development and lab testing of a high efficiency RTU prototype was finalized. We went
through an exhaustive technologies survey to select energy efficiency and cost-effective
components. We conducted in-depth engineering design and optimization, based on the
ORNL Heat Pump Design Model, by which we determined the final prototype design
choices. Starting from a Trane baseline unit, having a rated capacity of 13-ton and 17.9
IEER, we made major modifications to improve the efficiency, as introduced below.
• We revised the original refrigerant circuit (two separate refrigerant systems) to be
one, to fully utilize heat exchanger surface area at part-load conditions.
• We innovatively applied a combination of 2 Copeland UltraTech compressors
(ZPS49K) + 1 single-speed (ZP49K) compressor providing multiple levels of cooling
capacity with good cost-effectiveness – it was proved to be the most efficient
compressor combination in the capacity range.
• We also replaced the original one indoor blower with three parallel indoor blowers,
with ECM motor and backward-curved impeller (made by Ebm-Papst Company
(Model No: K3G355-AX56-90). In addition, the fans were arranged so that their air
inlets faced the indoor coil; this strategy greatly reduced the blower power and
improved the indoor air flow distribution.
• We replaced the two condenser fans, with ECM fans made by Ebm-Papst Company
(Model No: W3G710-GU21-09F). We evaluated three configurations of the
condenser fans, i.e. “Extruded” vs. “Flat-top”, and placing the Ebm-papst AxiTop
diffusers on the “Flat-top” configuration.
• We kept the original heat exchangers from the Trane baseline unit, i.e. a four-row
indoor fin-tube evaporator and a micro-channel condenser.
• We added a submerged subcooler in an evaporator condensate collection pan to to
passively recover free cooling capacity from the condensate water without adding
power consumption. The submerged subcooler also served as a charge buffer to
inhibit the possibility of two-phase refrigerant exiting the condenser at part-load
conditions. A fan-driven evaporative subcooler was evaluated in the lab and was
found able to increase the efficiency further. However it would add significant cost,
controls complication (e.g. requiring an extra subcooler fan), and potential
operation/reliability issues (heat exchanger fouling due to the water spray). So it was
not included in the final prototype design.
• In collaboration with Trane, we also investigated a low GWP refrigerant (DR-55) as a
drop-in replacement of R410A in the RTU prototype.
The lab prototype, using R410A, achieved a measured integrated energy efficiency ratio
(IEER) of 21.6 at the rated cooling capacity of 13-ton. If de-rated to a nominal capacity
OFFICIAL USE ONLY

Trane CRADA final report, October 15, 2015
Page 53 of 54
of 10-ton the lab-demonstrated IEER increases to 22.7. The low GWP refrigerant of DR-
55 led to better performance; a lab-demonstrated IEER of 22.6 at the rated capacity of
13.5-ton and 24.0 IEER at the rated capacity of 10-ton. Having achieved the performance
goal, we installed the lab prototype in the ORNL flexible research platform (FRP)
buildings for field testing in the next cooling season.
ACKNOWLEDGEMENTS
The authors thank the members of the Trane Commercial Systems, Ingersoll Rand Inc.
project team for their considerable contributions to the CRADA project and to this report.
The authors also thank Mr. Antonio Bouza of the DOE Building Technology Office
(DOE/BTO) for supporting ORNL’s CRADA efforts under Contract No. DE-AC05-
00OR22725 with UT-Battelle, LLC.
REFERENCES
ANSI/AHRI Standard 540-99, 2010, “Positive Displacement Refrigerant Compressors
and Compressor Units”, Air-Conditioning and Refrigeration Institute, Arlington, VA
ANSI/AHRI Standard 340/360, 2010, “Performance Rating of Commercial and Industrial
Unitary Air-Conditioning and Heat Pump Equipment”, Air-Conditioning, Heating, and
Refrigeration Institute, Arlington, VA
ANSI/ASHRAE/IES Standard 90.1-2007, “Energy Standard for Buildings Except Low-
Rise Residential Buildings”
Braun. J.E., Klein. S.A, and Mitchell, J.W., 1989, “Effectiveness models for cooling
towers and cooling coils”, ASHRAE Transactions, Vol. 95, Pt. 2, pp. 164-174.Charles, J.,
B. Shen, O. Abdelaziz, and C. K. Rice 2012. "Auto-Calibration and Control Strategy
Determination for a Variable-Speed Heat Pump Water Heater Using Optimization",
International Journal of HVAC&R, Vol. 18, No. 5, October.
B. Shen, and C. K. Rice 2014. " HVAC System Optimization with a Component Based
System Model – New Version of ORNL Heat Pump Design Model ", Short-course
presentation at 2014 International Refrigeration and Compressor Conferences at Purdue.
B. Shen, and C. K. Rice 2013, “Development of 20 IEER Rooftop Units – System
Modeling and Building Energy Simulations”, International Journal of HVAC&R, Vol.
19, No. 7, September, 2013.
Cromer, “Cromer Cycle Air Conditioner: A Unique Air Conditioner Desiccant Cycle to
Enhance Dehumidification and Save Energy”, Proceedings of 12th Symposium on
Improving Building Systems in Hot and Humid Climates, San Antonio, TX, May 15-17,
2000
OFFICIAL USE ONLY

Trane CRADA final report, October 15, 2015
Page 54 of 54
Dabiri, A. E. and C.K. Rice, 1981. "A Compressor Simulation Model with Corrections
for the Level of Suction Gas Superheat," ASHRAE Transactions, Vol. 87, Part 2, pp.771-
782.
EIA (US Energy Information Administration), 2015. 2012 Commercial Buildings
Energy Consumption Survey (CBECS), Tables B1 and B2.
http://www.eia.gov/consumption/commercial/data/2012/#summary (accessed September
2015).
EnergyPlus Engineering Reference, Version 7.2,
http://apps1.eere.energy.gov/buildings/energyplus/energyplus_documentation.cfm
EnergyPlus Example File Generator, US National Renewable Laboraties, 2012,
http://apps1.eere.energy.gov/buildings/energyplus/cfm/inputs/
High Performance Rooftop Unit Challenge,
Fluent CFD program, ANSYS Fluent,
http://www.ansys.com/Products/Simulation+Technology/Fluid+Dynamics/Fluid+Dynami
cs+Products/ANSYS+Fluent
High efficiency RTU challenge,
http://apps1.eere.energy.gov/buildings/publications/pdfs/alliances/cbea_rtu_spec_long.pd
f
REFPROP, “RefProp 9.1 User Guide”, NIST Reference Fluid Thermodynamic and
Transport Properties Database (REFPROP): Version 9.
S. A, Klein. 2010, “TRNSYS 16.0 User Manual”.
Wetter, M. 2009. GenOpt® Generic Optimization Program User Manual Version 3.0.0,
Lawrence Berkeley National Laboratory Technical Report LBNL-2077E, May 11
OFFICIAL USE ONLY


