
No-Till
• Sections 8.9 through 8.12 in Blanco and Lal were used as reference
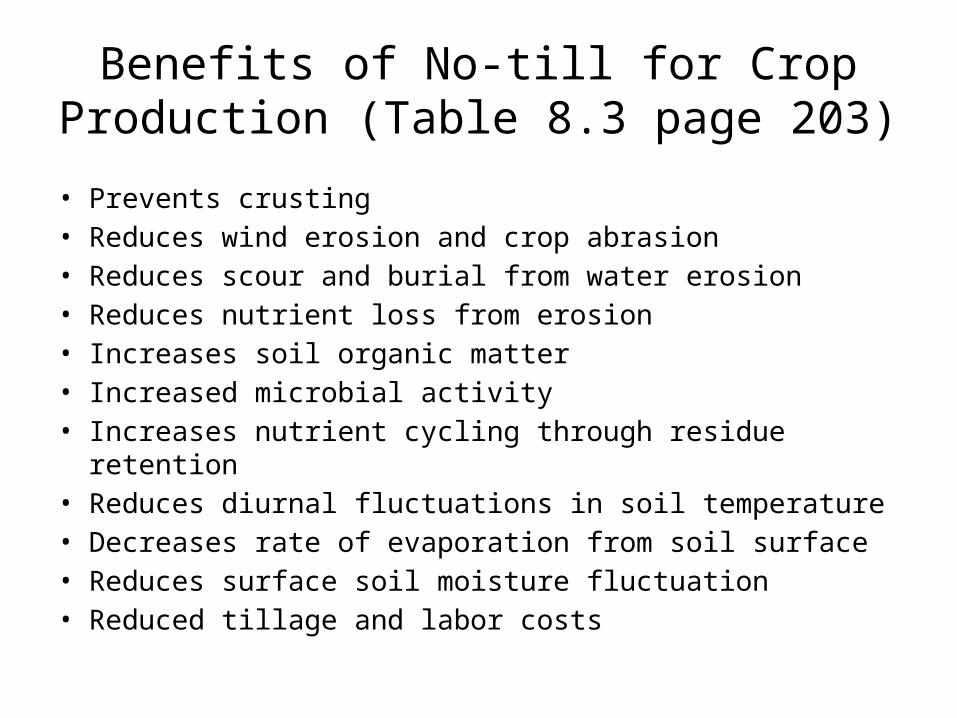
Benefits of No-till for Crop Production (Table 8.3 page 203)
• Prevents crusting • Reduces wind erosion and crop abrasion• Reduces scour and burial from water erosion• Reduces nutrient loss from erosion• Increases soil organic matter • Increased microbial activity• Increases nutrient cycling through residue retention• Reduces diurnal fluctuations in soil temperature• Decreases rate of evaporation from soil surface• Reduces surface soil moisture fluctuation• Reduced tillage and labor costs
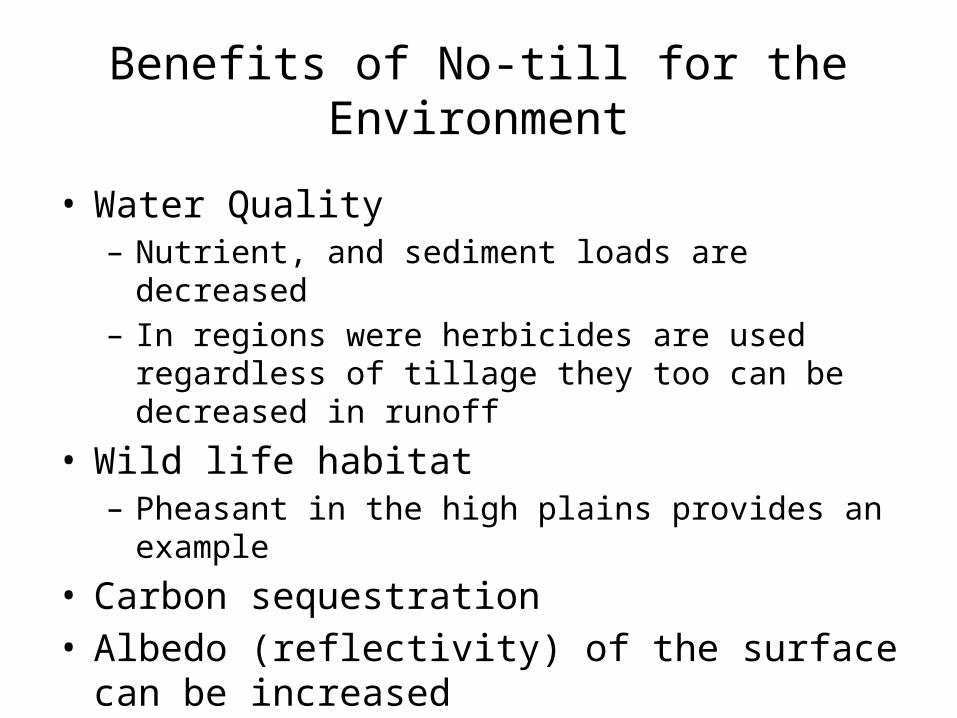
Benefits of No-till for the Environment
• Water Quality– Nutrient, and sediment loads are decreased– In regions were herbicides are used regardless of tillage
they too can be decreased in runoff
• Wild life habitat– Pheasant in the high plains provides an example
• Carbon sequestration• Albedo (reflectivity) of the surface can be increased
– MAY contribute to mitigation of climate change

Environmental Challenges in using No-till
• Increased herbicide use• Stratification of nutrients resulting in increased risk
of dissolved nutrient runoff.• Improvements in macroporosity and water
infiltration can cause increased leaching– Particularly concerning in systems with subsurface drainage
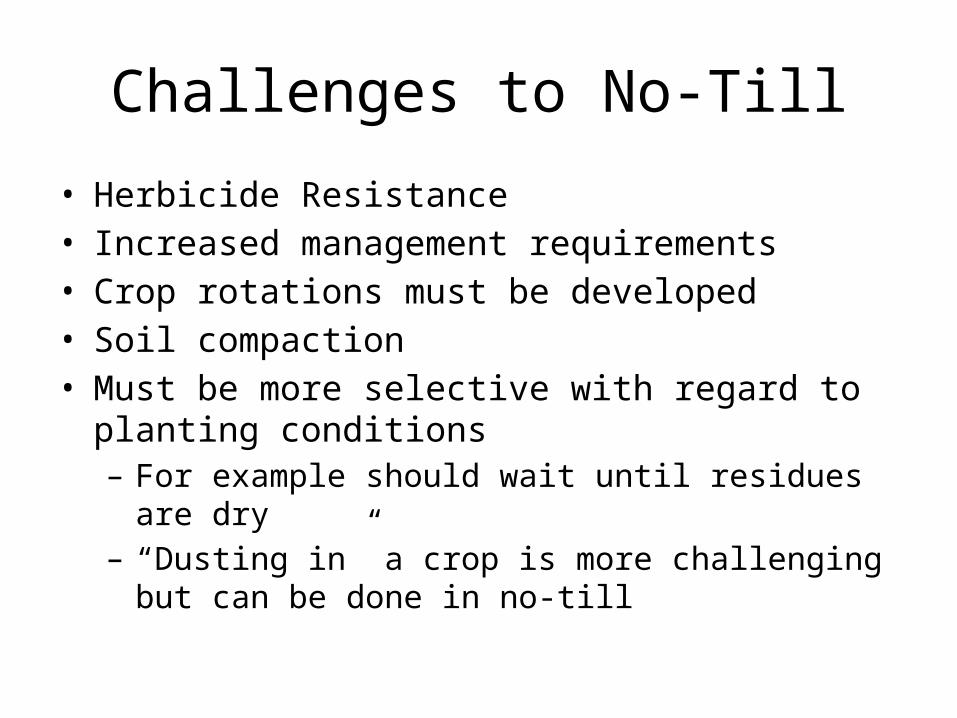
Challenges to No-Till
• Herbicide Resistance• Increased management requirements• Crop rotations must be developed• Soil compaction • Must be more selective with regard to planting
conditions– For example should wait until residues are dry – “Dusting in” a crop is more challenging but can be done in
no-till
Challenges to No-Till
• Grazing No-Till– Recent studies have shown that grazing can improve
microbial activity and nutrient cycling– Dual purpose no-till has been shown to be equally
successful as tillage systems– Fall forage production can be lower however, weight gains
are generally similar because cattle don’t bog down during wet conditions
– Earlier planting may also overcome cooler soil temps• However, this must be weighted against pest pressure that
can occur in early planted wheat
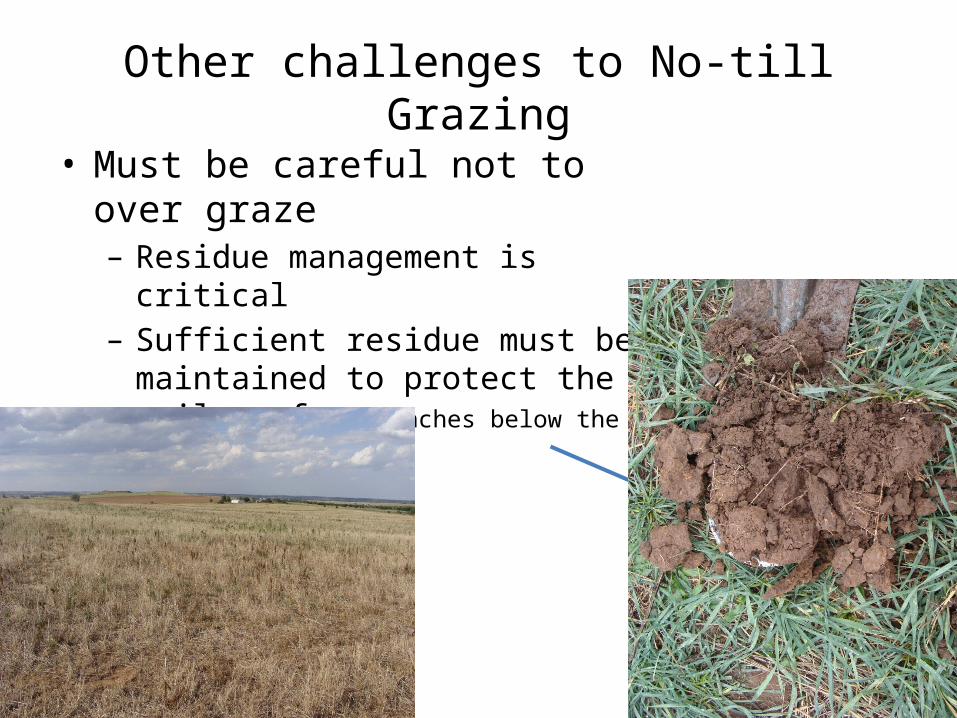
Other challenges to No-till Grazing• Must be careful not to over graze
– Residue management is critical– Sufficient residue must be maintained
to protect the soil surface
2 inches below the surface
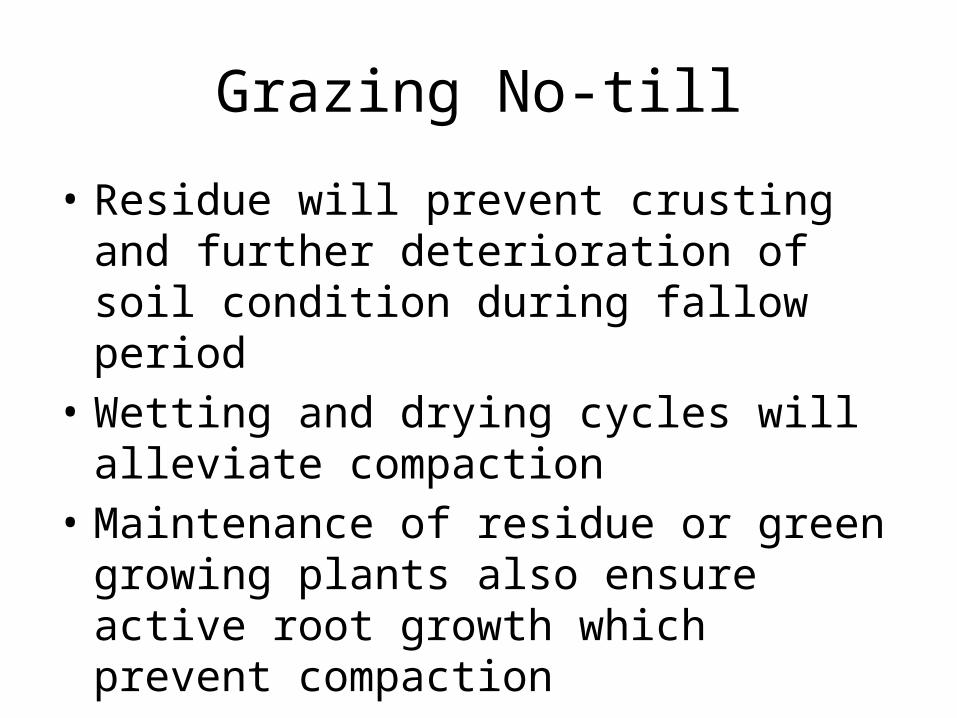
Grazing No-till
• Residue will prevent crusting and further deterioration of soil condition during fallow period
• Wetting and drying cycles will alleviate compaction
• Maintenance of residue or green growing plants also ensure active root growth which prevent compaction
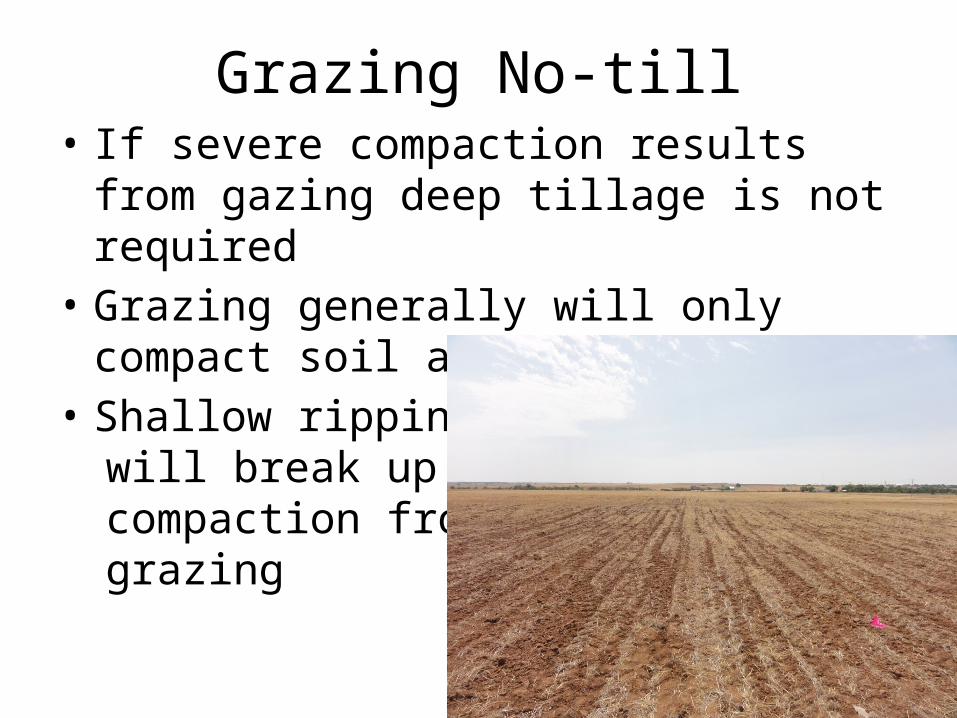
Grazing No-till• If severe compaction results from gazing deep
tillage is not required• Grazing generally will only compact soil at 0-4
inches• Shallow ripping
will break up compaction fromgrazing
Soil Structural Improvements
• Removal of tillage from the system allows soil structure to improve
• Macropores formed from shrink/swell, root growth, and worm borrowing can be maintained
• Surface residues are critical for maintaining this structure– Protect surface from crusting– Provide organic matter for biological activity and
aggregate stability

Soil Structural Improvements• Bare surface of a 15 year old no-till soil after
cotton followed by sesame
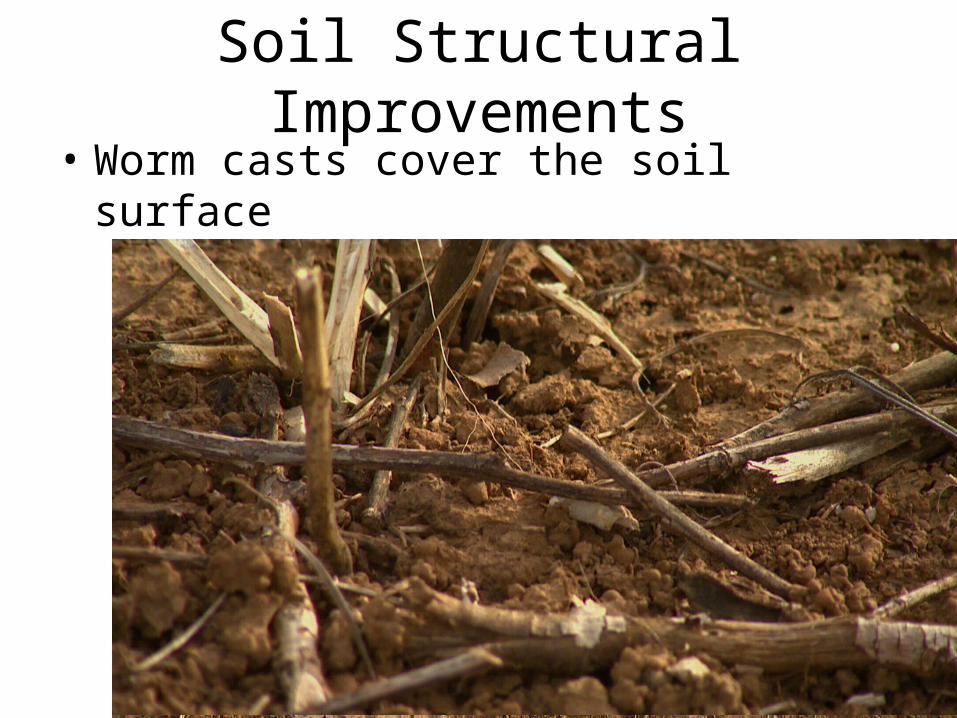
Soil Structural Improvements• Worm casts cover the soil surface
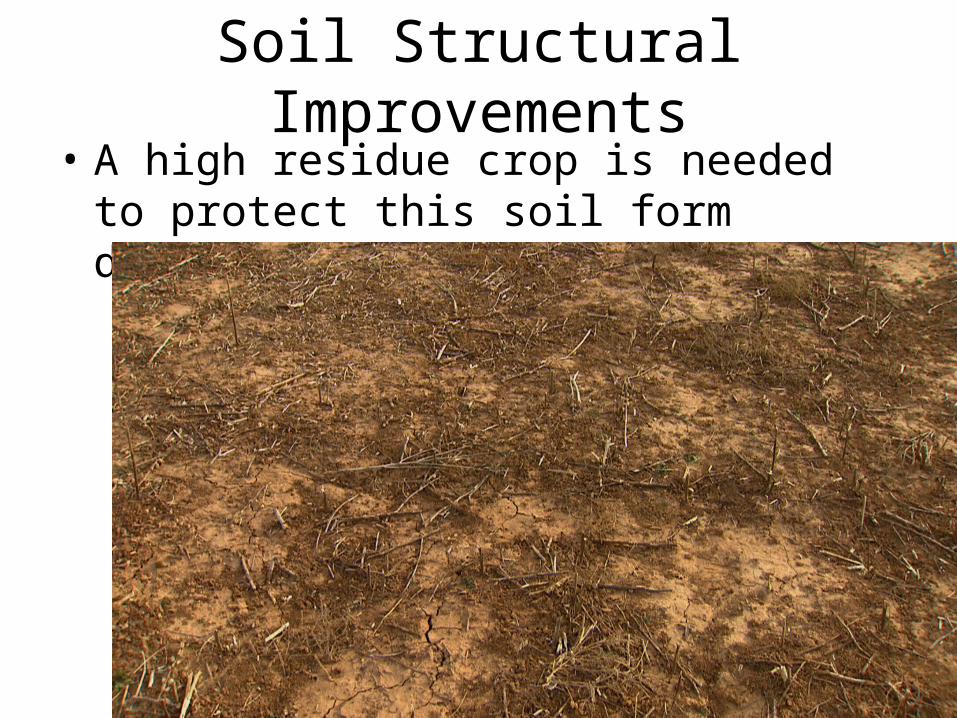
Soil Structural Improvements• A high residue crop is needed to protect this
soil form degradation

Surface Evidence of Soil Structure
• Worm casts under residue
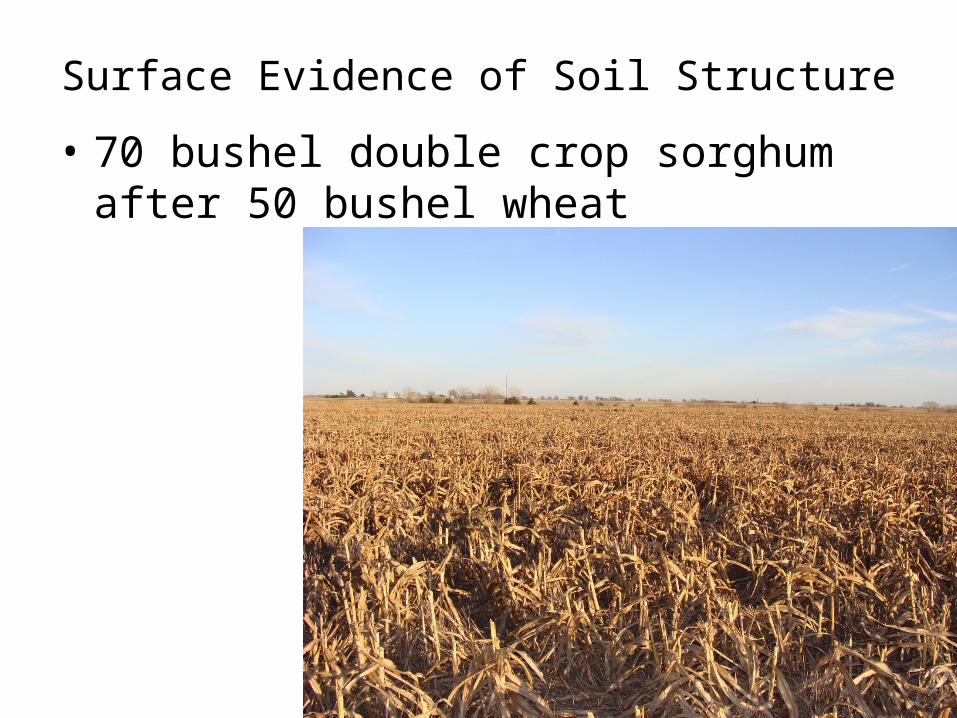
Surface Evidence of Soil Structure• 70 bushel double crop sorghum after 50
bushel wheat
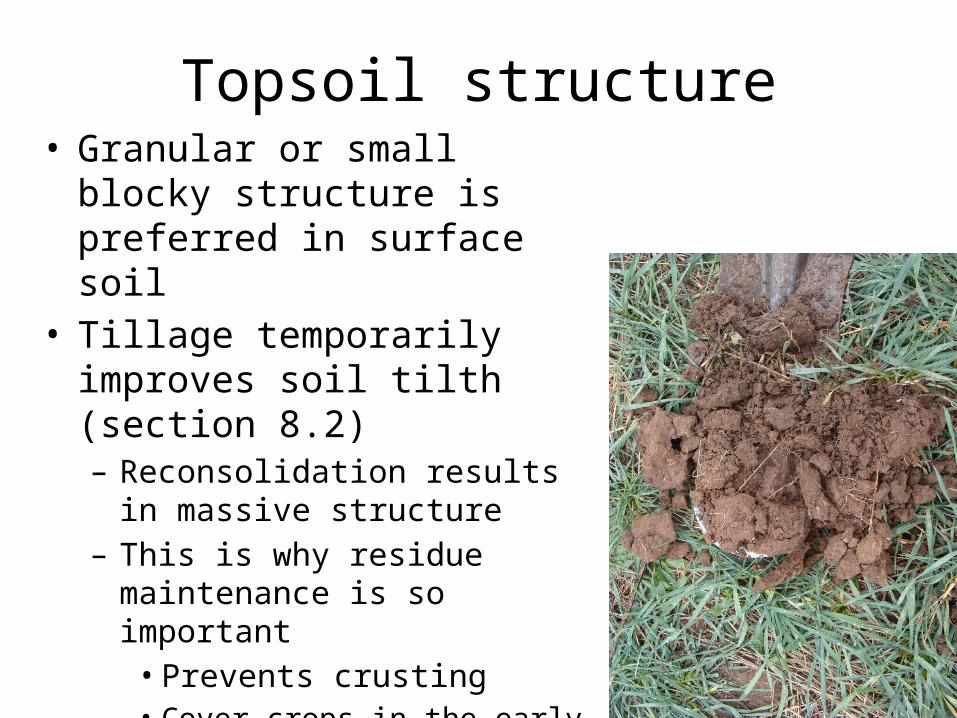
Topsoil structure• Granular or small blocky structure
is preferred in surface soil• Tillage temporarily improves soil
tilth (section 8.2)– Reconsolidation results in massive
structure – This is why residue maintenance is so
important• Prevents crusting• Cover crops in the early years of
adoption may also help by providing root growth during fallow period
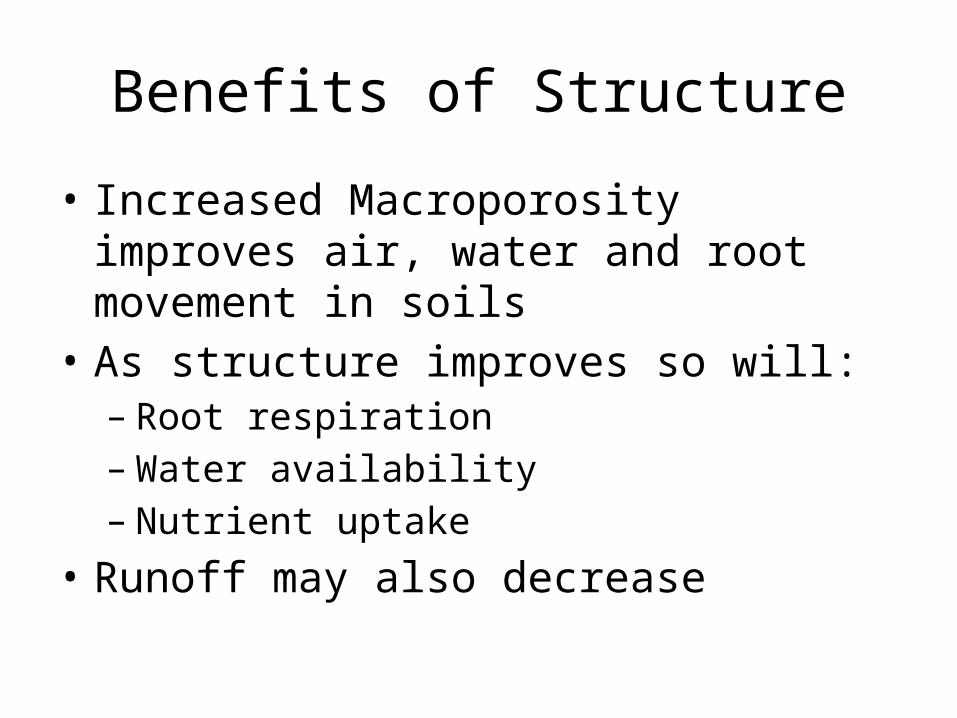
Benefits of Structure
• Increased Macroporosity improves air, water and root movement in soils
• As structure improves so will:– Root respiration– Water availability– Nutrient uptake
• Runoff may also decrease

Influence of No-Till on Evaporation
• Maintenance of crop residues decreases the rate of evaporation– It does not eliminate it
• In environments like Oklahoma evaporation represents the largest loss of water from a summer fallow system
• No-till can decrease this loss and make double crops and summer more successful
•
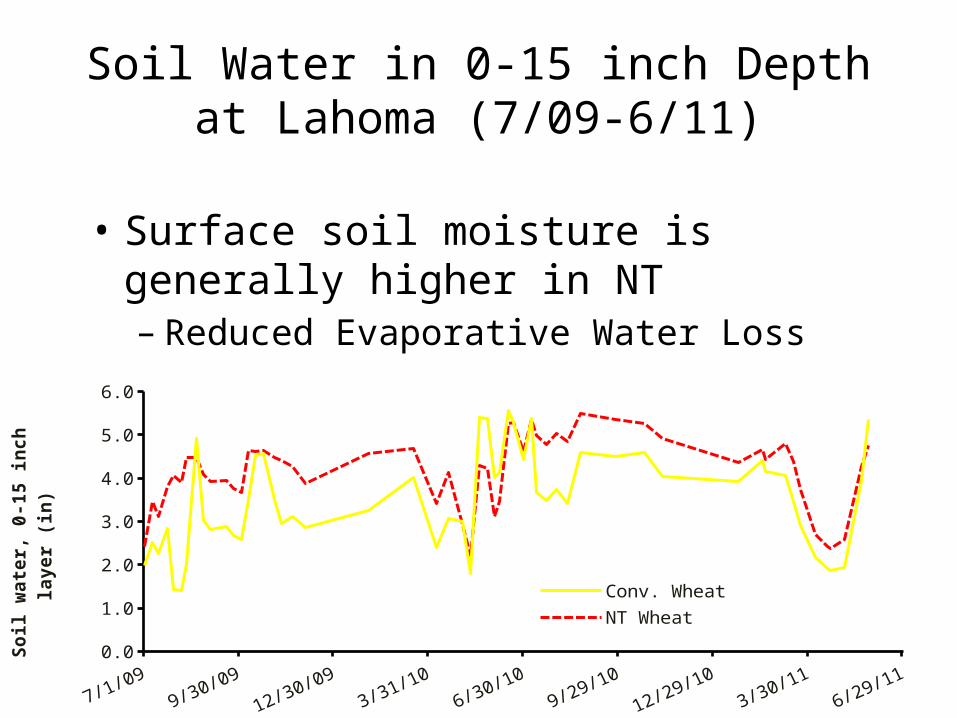
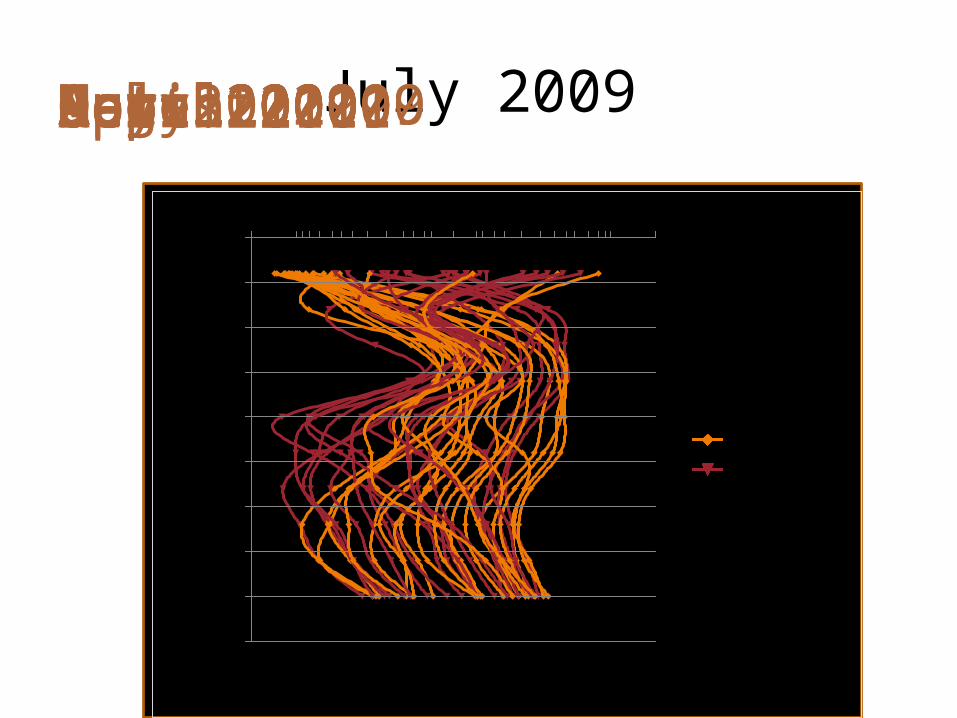
Soil Water in 0-15 inch Depth at Lahoma (7/09-6/11)
• Surface soil moisture is generally higher in NT– Reduced Evaporative Water Loss
0.0
1.0
2.0
3.0
4.0
5.0
6.0
Conv. WheatNT Wheat
Soil
wate
r, 0
-15 i
nch
la
ye
r (i
n)
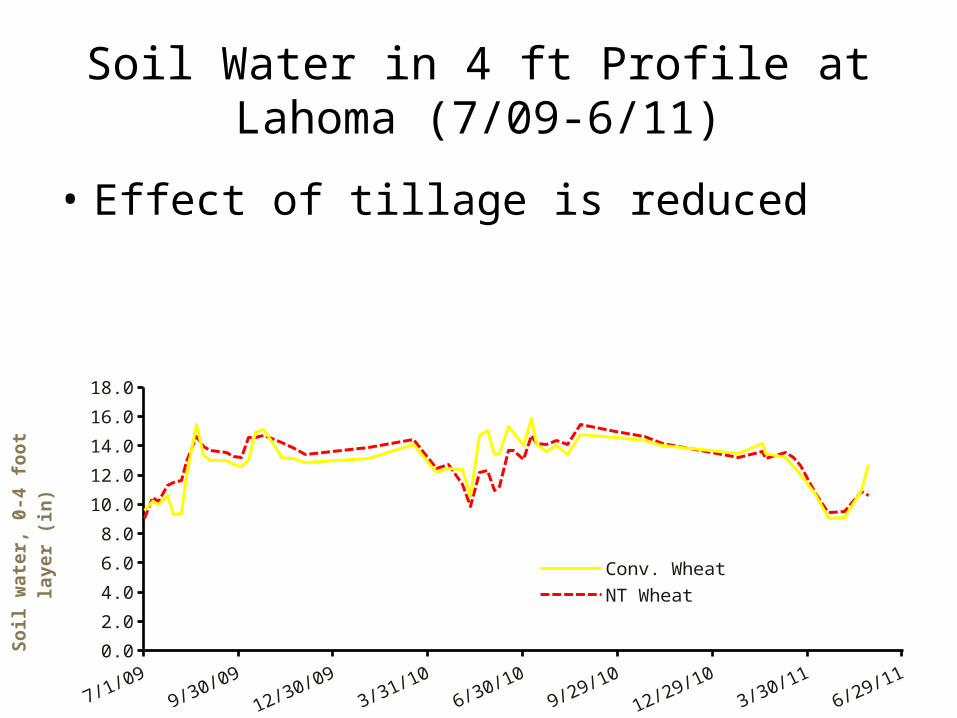
Soil Water in 4 ft Profile at Lahoma (7/09-6/11)
• Effect of tillage is reduced
0.0
2.0
4.0
6.0
8.0
10.0
12.0
14.0
16.0
18.0
Conv. WheatNT Wheat
So
il w
ate
r, 0
-4 f
oo
t la
ye
r (i
n)
0.05 0.1 0.15 0.2 0.25 0.3 0.35 0.40
10
20
30
40
50
60
70
80
90
Conv. WheatNT Wheat
Water Content (Inches H2O/Inch soil)
So
il D
ep
th (
inch
es)
0.1 0.15 0.2 0.25 0.3 0.35 0.40
10
20
30
40
50
60
70
80
90
Conv. WheatNT Wheat
Water Content (Inches H2O/Inch soil)
So
il D
ep
th (
Inch
es)
0.05 0.1 0.15 0.2 0.25 0.3 0.35 0.40
10
20
30
40
50
60
70
80
90
Conv. WheatNT Wheat
Water Content (Inches H2O/Inch soil)
So
il D
ep
th (
inch
es)
0.1 0.15 0.2 0.25 0.3 0.35 0.40
10
20
30
40
50
60
70
80
90
Conv. WheatNT Wheat
Water Content (Inches H2O/Inch soil)
So
il D
ep
th (
inch
es)
0.15 0.2 0.25 0.3 0.35 0.40
10
20
30
40
50
60
70
80
90
Conv. WheatNT Wheat
Water Content (Inches H2O/Inch soil)
So
il D
ep
th (
inch
es)
0.2
0.22
0.24
0.26
0.28
0.3
0.32
0.34
0.36
0.38
0.4
0
10
20
30
40
50
60
70
80
90
Conv. WheatNT Wheat
Water Content (Inches H2O/Inch soil)
So
il D
ep
th (
inch
es)
0.15 0.2 0.25 0.3 0.35 0.40
10
20
30
40
50
60
70
80
90
Conv. WheatNT Wheat
Water Content (Inches H2O/Inch soil)
So
il D
ep
th (
inch
es)
0.05 0.1 0.15 0.2 0.25 0.3 0.35 0.40
10
20
30
40
50
60
70
80
90
Conv. WheatNT Wheat
Water Content (Inches H2O/Inch soil)
So
il D
ep
th (
inch
es)
0 0.05 0.1 0.15 0.2 0.25 0.3 0.35 0.40
10
20
30
40
50
60
70
80
90
Conv. WheatNT Wheat
Water Content (Inches H2O/Inch soil)
So
il D
ep
th (
inch
es)
July 2009August 2009Sept. 2009Oct. 2009Nov. 2009Dec. 2009Feb. 2010March 2010April 2010
0.2
0.22
0.24
0.26
0.28
0.3
0.32
0.34
0.36
0.38
0.4
0
10
20
30
40
50
60
70
80
90
Conv. WheatNT Wheat
Water Content (Inches H2O/Inch soil)
So
il D
ep
th (
inch
es)
May 2010
0.2
0.22
0.24
0.26
0.28
0.3
0.32
0.34
0.36
0.38
0.4
0
10
20
30
40
50
60
70
80
90
Conv. WheatNT Wheat
Water Content (Inches H2O/Inch soil)
So
il D
ep
th (
inch
es)
June 2010
0.15 0.2 0.25 0.3 0.35 0.40
10
20
30
40
50
60
70
80
90
Conv. WheatNT Wheat
Water Content (Inches H2O/Inch soil)
So
il D
ep
th (
inch
es)
July 2010
0.26 0.28 0.3 0.32 0.34 0.36 0.38 0.40
10
20
30
40
50
60
70
80
90
Conv. WheatNT Wheat
Water Content (Inches H2O/Inch soil)
So
il D
ep
th (
inch
es)
August 2010
0.24 0.26 0.28 0.3 0.32 0.34 0.36 0.38 0.40
10
20
30
40
50
60
70
80
90
Conv. WheatNT Wheat
Water Content (Inches H2O/Inch soil)
So
il D
ep
th (
inch
es)
Sept. 2010
0.24 0.26 0.28 0.3 0.32 0.34 0.36 0.38 0.40
10
20
30
40
50
60
70
80
90
Conv. WheatNT Wheat
Water Content (Inches H2O/Inch soil)
So
il D
ep
th (
inch
es)
Oct. 2010
0.22 0.24 0.26 0.28 0.3 0.32 0.34 0.36 0.38 0.40
10
20
30
40
50
60
70
80
90
Conv. WheatNT Wheat
Water Content (Inches H2O/Inch soil)
So
il D
ep
th (
inch
es)
Nov. 2010
0.2
0.22
0.24
0.26
0.28
0.3
0.32
0.34
0.36
0.38
0.4
0
10
20
30
40
50
60
70
80
90
Conv. WheatNT Wheat
Water Content (Inches H2O/Inch soil)
So
il D
ep
th (
inch
es)
Jan. 2011
0.22 0.24 0.26 0.28 0.3 0.32 0.34 0.36 0.38 0.40
10
20
30
40
50
60
70
80
90
Conv. WheatNT Wheat
Water Content (Inches H2O/Inch soil)
So
il D
ep
th (
inch
es)
Feb. 2011March 2011
0.15 0.2 0.25 0.3 0.35 0.40
10
20
30
40
50
60
70
80
90
Conv. WheatNT Wheat
Water Content (Inches H2O/Inch soil)
So
il D
ep
th (
inch
es)
0.05 0.1 0.15 0.2 0.25 0.3 0.35 0.40
10
20
30
40
50
60
70
80
90
Conv. WheatNT Wheat
Water Content (Inches H2O/Inch soil)
So
il D
ep
th (
inch
es)
April 2011
0.1 0.15 0.2 0.25 0.3 0.35 0.40
10
20
30
40
50
60
70
80
90
Conv. WheatNT Wheat
Water Content (Inches H2O/Inch soil)
So
il D
ep
th (
inch
es)
May 2011

Wheat Yields at LahomaCropping System Yield
2008 Bu/acreConv. Wheat 36NT Wheat 38NT Wheat After Canola 41 2009Conv. Wheat 43NT Wheat 44NT Wheat After Summer Crops 50 2010Conv. Wheat 37NT Wheat 31NT Wheat Second Year After Summer Crops 34 2011CT Wheat 64NT Wheat 65NT Wheat After Canola 74NT Wheat After Summer Crops 53
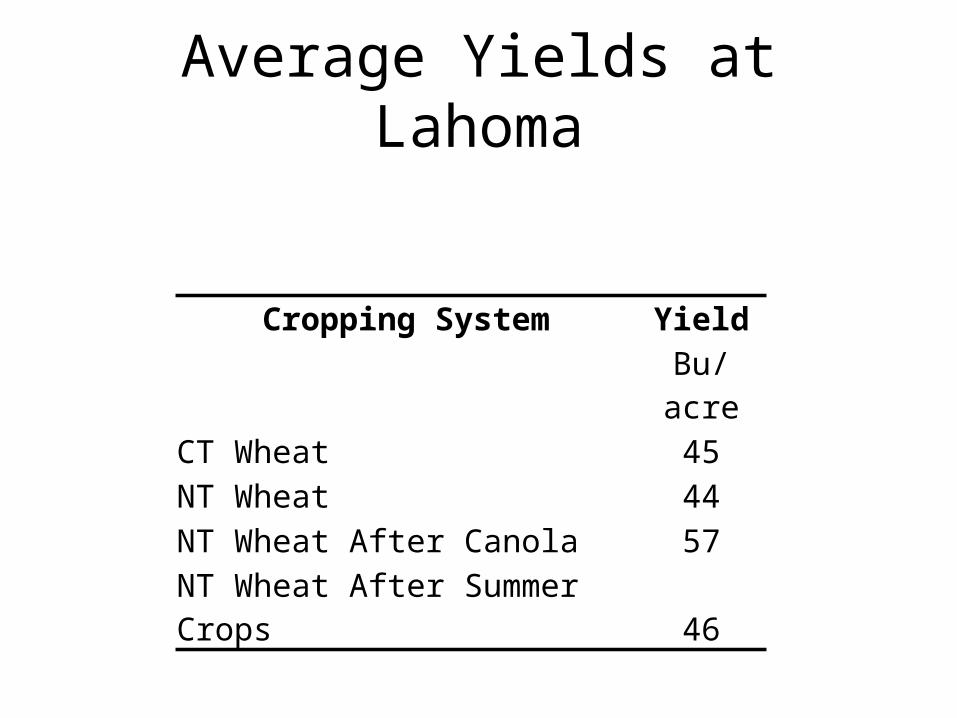
Average Yields at Lahoma
Cropping System YieldBu/acre
CT Wheat 45NT Wheat 44NT Wheat After Canola 57NT Wheat After Summer Crops 46
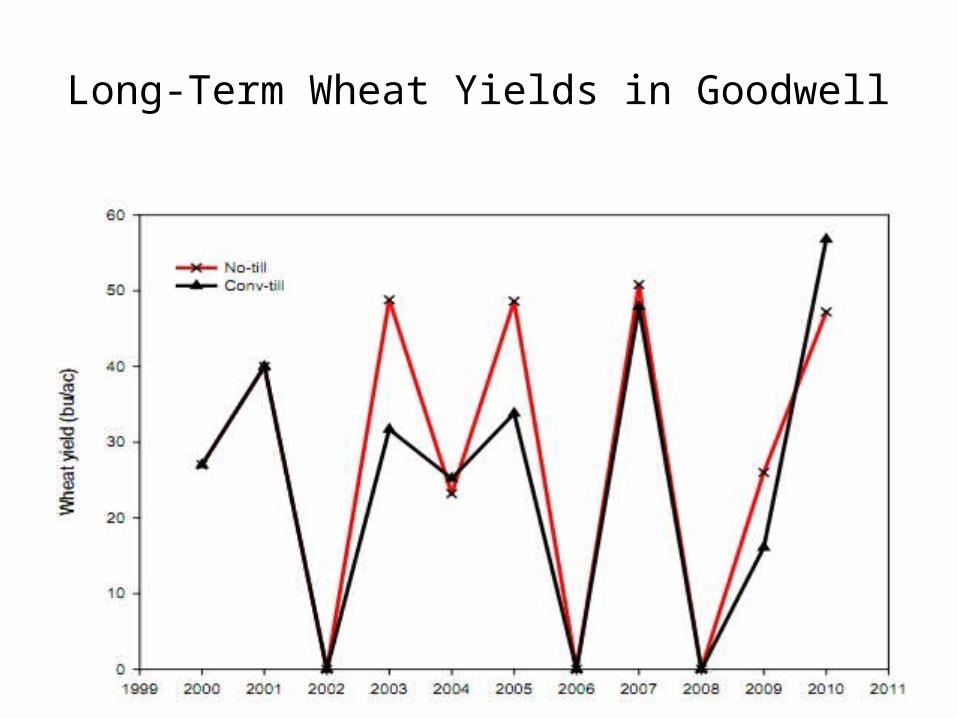
Long-Term Wheat Yields in Goodwell
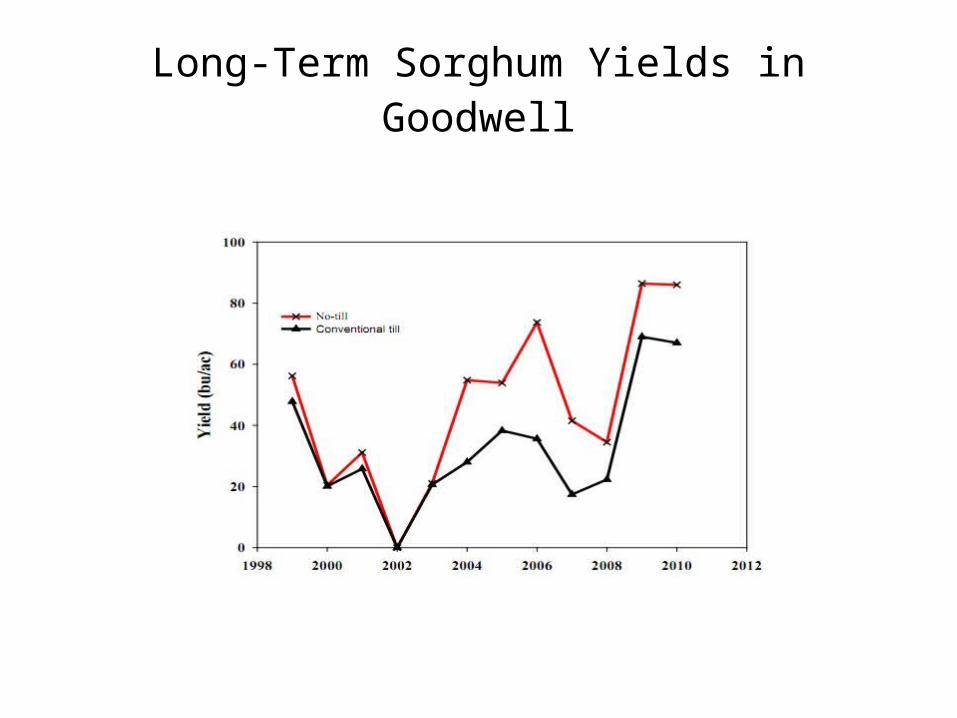
Long-Term Sorghum Yields in Goodwell
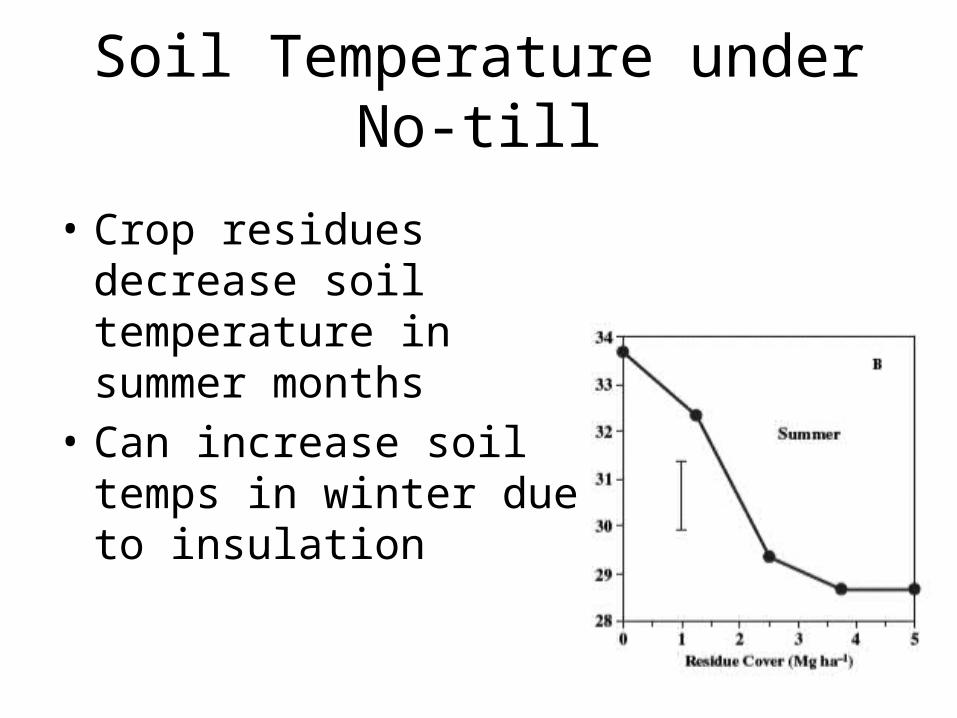
Soil Temperature under No-till
• Crop residues decrease soil temperature in summer months
• Can increase soil temps in winter due to insulation
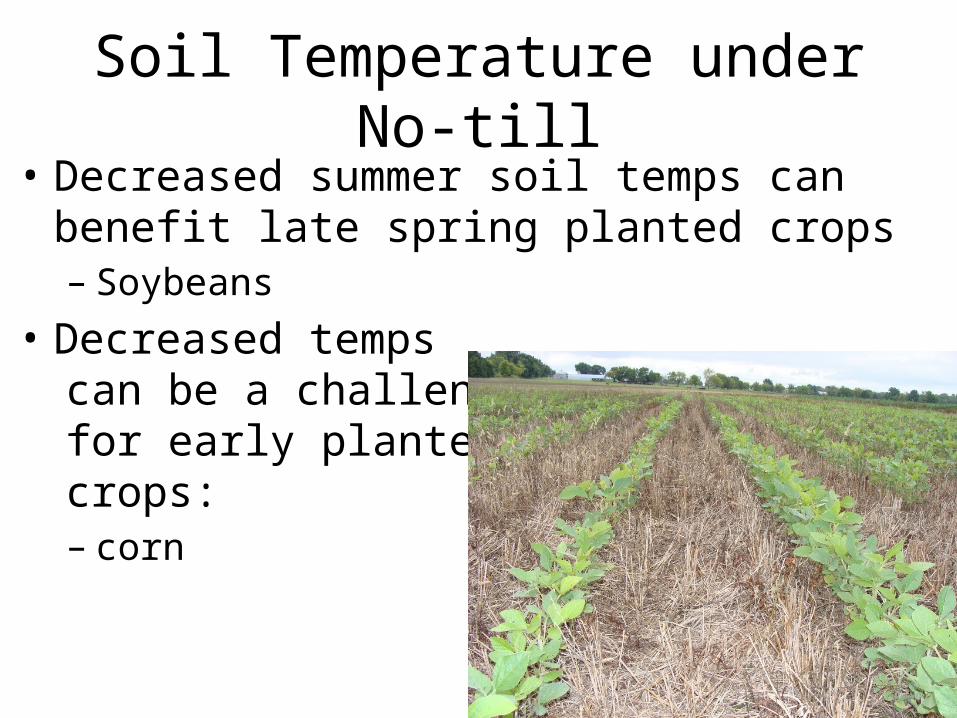
Soil Temperature under No-till• Decreased summer soil temps can benefit late
spring planted crops– Soybeans
• Decreased temps can be a challenge for early planted crops:– corn
Soil Compaction
• All soils managed using modern mechanical agricultural practices are compact
• The extent of compaction and its impact on productivity is dependent on soil type and management
• Surface compaction is of specific concern for no-till soils– Cannot be tilled away
Soil Compaction
• Greater efforts to limit traffic during wet periods are needed in No-till
• Controlled traffic becomes a more attractive management option for no-till systems– Prevents whole field compaction– Compacted traffic lanes allow for more rapid entry
into field after rainfall events
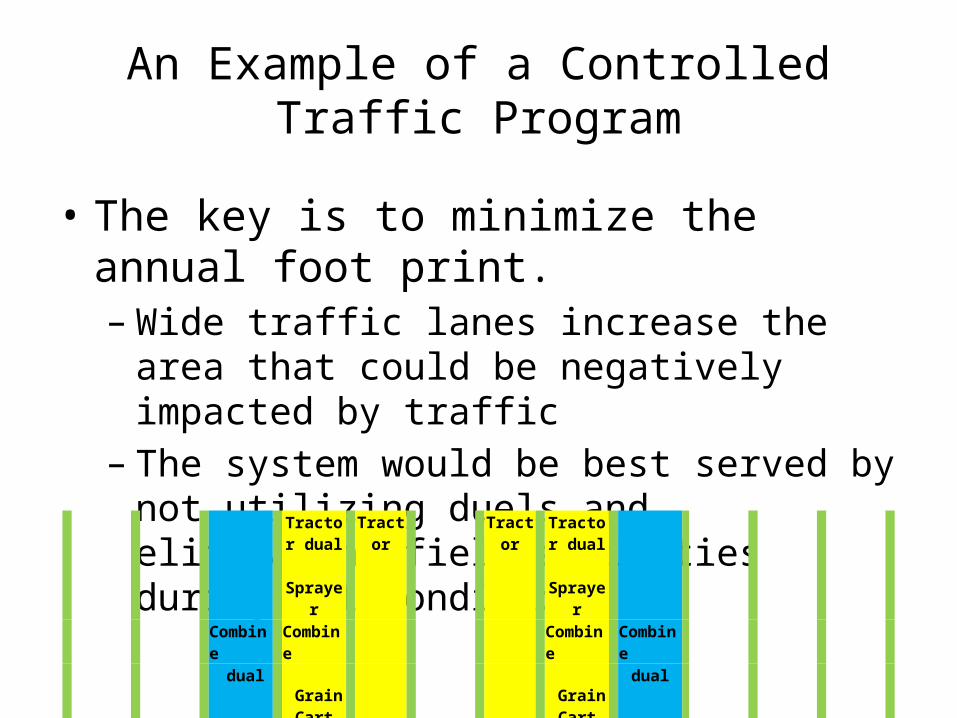
An Example of a Controlled Traffic Program
• The key is to minimize the annual foot print. – Wide traffic lanes increase the area that could be
negatively impacted by traffic– The system would be best served by not utilizing
duels and eliminating field activities during wet conditions.
Tractor dual
Sprayer
Tractor
Tractor
Tractor dual
Sprayer
Combine Combine Combine Combine
dual
Grain Cart
Grain Cart
dual

An Example of a Controlled Traffic Program
• Precision driving would help in row crops.– Will keep tracks in the inter-row space– Would not be as effective in the wheat crop
• Tram lines would provide for precision driving in a wheat system
Tractor dual
Sprayer
Tractor
Tractor
Tractor dual
Sprayer
Combine Combine Combine Combine
dual
Grain Cart
Grain Cart
dual
A Brief History of No-Till
• The Earliest forms of No-till were adopted during the 1960 in the U.S.
• No-till adoption was made possible by:– Development of Herbicides – Demonstration sites – Introduction of fluted coulter planters
• However, adoption was limited to a small portion of cropland until the 1990s
• 30 years for a significant change in cultural practices!!!

No-Till Adoption
1988 1990 1992 1994 1996 1998 2000 2002 20040%
4%
8%
12%
16%
20%
24%
OK
US
Pe
rce
nt
of
Ac
res
Conservation Technology Information Center, 2004
An OSU Extension Survey found that No-till practices were implemented on 28% of Oklahoma Cropland in 2008

No-Till in South America
• South America has experienced the most impressive rate of no-till adoption
• Increased from 0.7 to 40.6 Mha between 1987 to 2004
• Paraguay has the larges percentage of No-till cropland in the world, – Nearly 70% of the cropland is in no-till
No-Till in Europe
• Efforts to establish no-till were initiated in the 1950
• Adoption was limited because of problems with weed control
• Similar story to the U.S.– The first experience producers had were negative.– This appears to have delayed adoption even after
technologies were improved
No-till in Africa
• In general, adoption is very limited• In Africa, adoption is limited by
– Cost of mechanized no-till equipment– Land tenure– Harsh climate conditions????????– Lack of knowledge– Lack of crop residues (cultural practices associated
with animal production and fuel)

No-Till in Asia
• Generally represents a small faction of total cropland management
• India provides for some optimism: – No till wheat acres increased from 400 ha in 1998
to 2.2 Mha in 2005.

No-till in Australia
• No-till is expanding rapidly• In Western Australia 85% of cropland is no-till• Nationally only 40% of cropland is under no-
till

My thoughts on Why No-Till Adoption has been Slow
• Reinvestment costs for older producers– 65 year old farmers are generally not interested in
borrowing money and changing their business model
• Knowledge gaps must be filled– This takes time and effort
• Early efforts had limited success– We have better equipment and technologies
• Perception that no-till can not be grazed– It can be successfully grazed but changes are required


