

SUPPLY & DEMAND
AP Economics

Non Sequitur by Wiley Miller

MARKETS⦿ Institution that brings together buyers (DEMAND) ⦿and sellers (SUPPLY) of resources, goods and
services

DEMAND IS⦿Amount of a good or service consumers are
willing and able to buy⦿Major determinant of demand is PRICE⦿Amount of demand at each price is quantity
demanded⦿Quantity of demand at each price is shown in
a “Demand Schedule”

DEMAND SCHEDULEPRICE QTY DEMANDED
$ 1.75 3
$ 1.50 5
$ 1.25 7
$ 1.00 10
$ 0.75 15
$ 0.50 20
$ 0.25 25
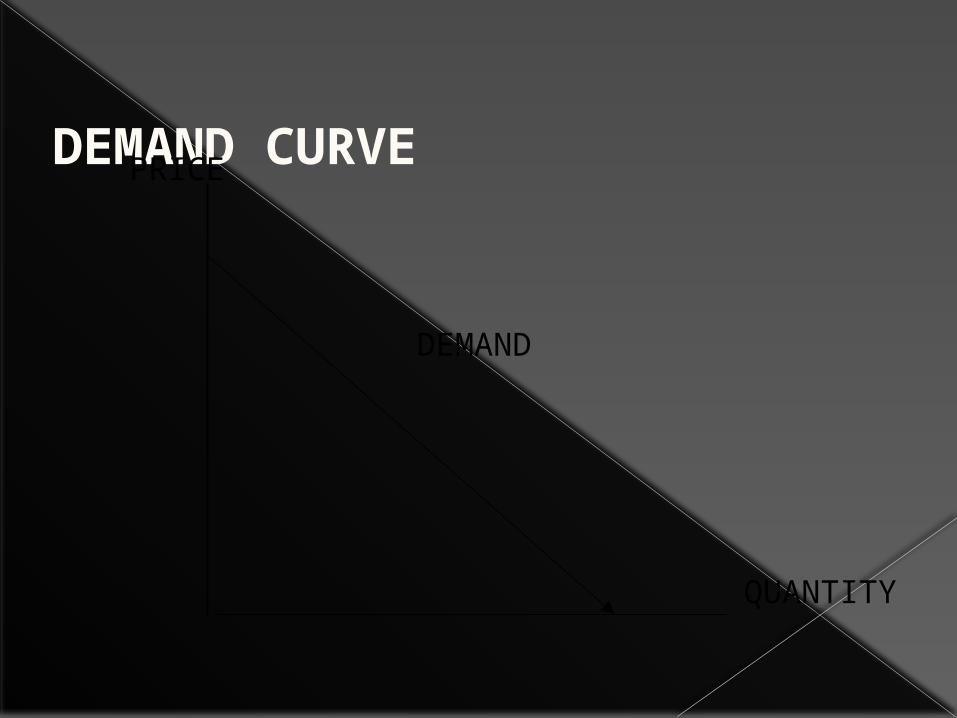
DEMAND CURVEPRICE
QUANTITY
DEMAND

DEMAND CURVE⦿Price is the vertical axis⦿Qty of demand is the horizontal axis⦿Demand Curve is downward sloping
because:◼Common sense (lower price = buy more)◼Diminishing marginal utility (the more
consumers buy, the less satisfaction they receive)
◼ Income & Substitution Effects

INCOME & SUBSTITUTION⦿ Income Effect – the lower price increases the
purchasing power of consumer’s⦿Substitution Effect – lower price gives
incentive to “substitute” this item for those that are relatively more expensive

NON-PRICE DETERMINANTS
⦿PREFERENCES – based on popularity or trends by consumers⦿INCOME EFFECT – how much money
consumers have available to spend⦿POPULATION CHANGES – how many
consumers are in this market⦿EXPECTATIONS OF CONSUMERS –
what consumers think will happen in the future that affects their actions NOW!!

NON-PRICE DETERMINANTS CON’T.⦿Elasticity of demand – how much demand
changes to respond to changes in price◼More elastic when goods are luxuries
• Ex: steak, diamonds, SUV◼More inelastic when good is needed
• Ex: medicine (insulin), soap, milk

NON-PRICE DETERMINANTS CON’T.
n SUBSTITUTION EFFECT◼As price increases for a good, demand for its
substitute (chicken for beef; generic) goes upn COMPLEMENTARY GOODS
◼As price goes down for one good, demand for that good & its complement both go up
◼DVD player on sale but DVD bought for regular price

NON-PRICE DETERMINANTS⦿REMINDER: “P I P E E R”
◼Preference of consumers (popularity)◼ Income of consumers ($$ to spend)◼Population (# of consumers)◼Expectations for future (what to do NOW?)◼Elasticity (effect of price)◼Related Goods
• substitute available?• price of complementary good changes- demand for
both changes?

SUPPLY IS⦿Amount of a good or service producers are
willing and able to sell⦿Major determinant of supply is PRICE⦿Amount of supply at each price is quantity⦿Amount of supply at each price is shown in a
“Supply Schedule”
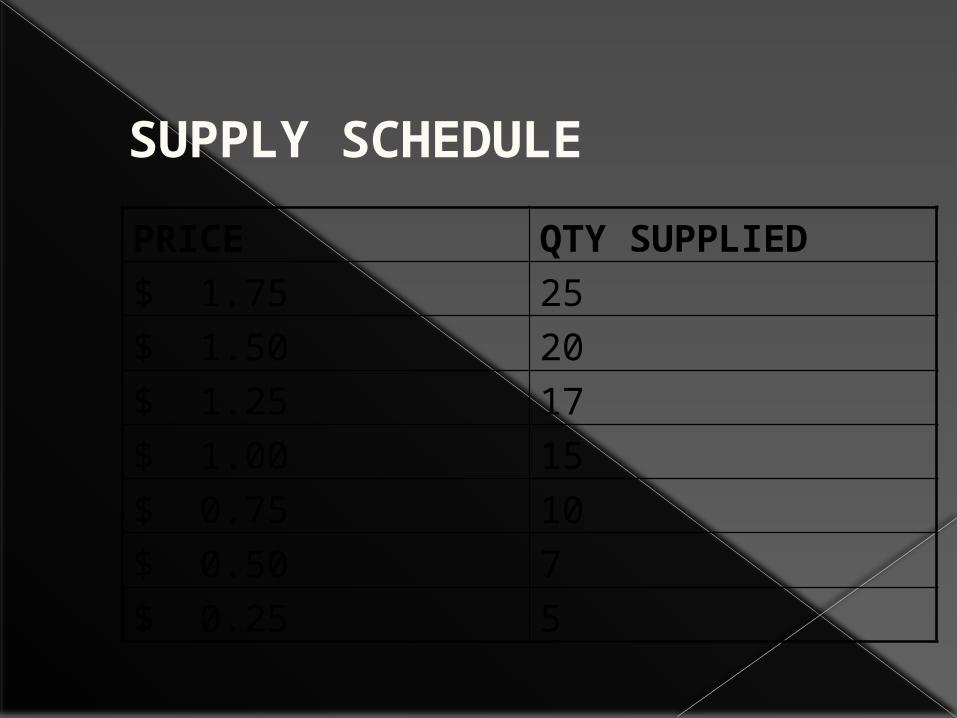
SUPPLY SCHEDULE
PRICE QTY SUPPLIED
$ 1.75 25
$ 1.50 20
$ 1.25 17
$ 1.00 15
$ 0.75 10
$ 0.50 7
$ 0.25 5

SUPPLY CURVEPRICE
QUANTITY
SUPPLY
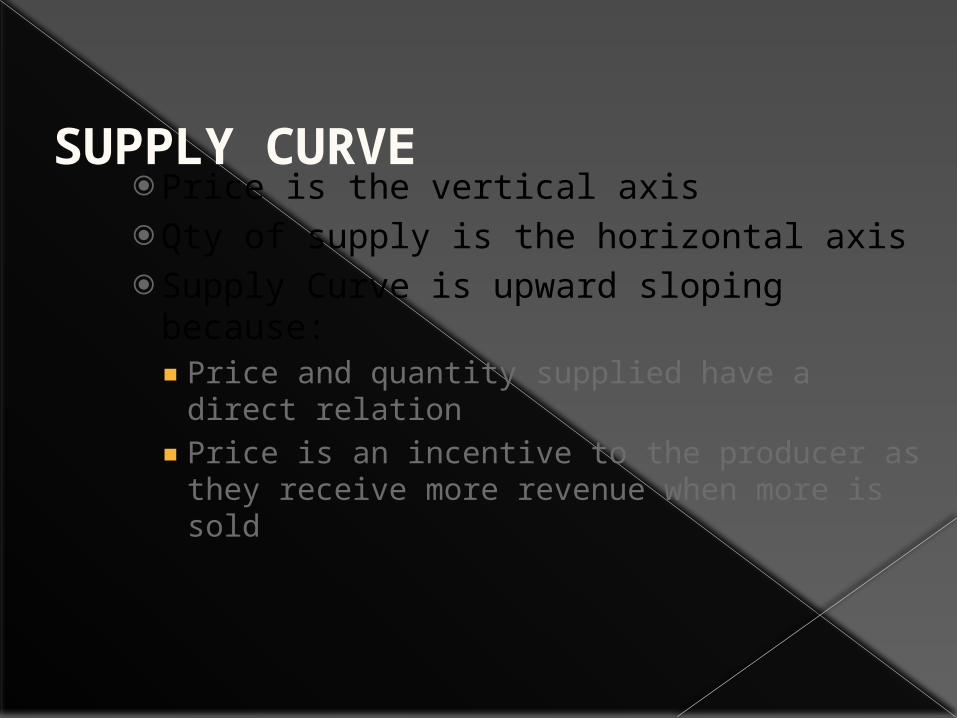
SUPPLY CURVE⦿Price is the vertical axis⦿Qty of supply is the horizontal axis⦿Supply Curve is upward sloping because:
◼Price and quantity supplied have a direct relation
◼Price is an incentive to the producer as they receive more revenue when more is sold

LAW OF SUPPLY
⦿Supply varies directly with price
⦿ If Price goes up – Supply goes up⦿ If Price goes down – Supply goes down
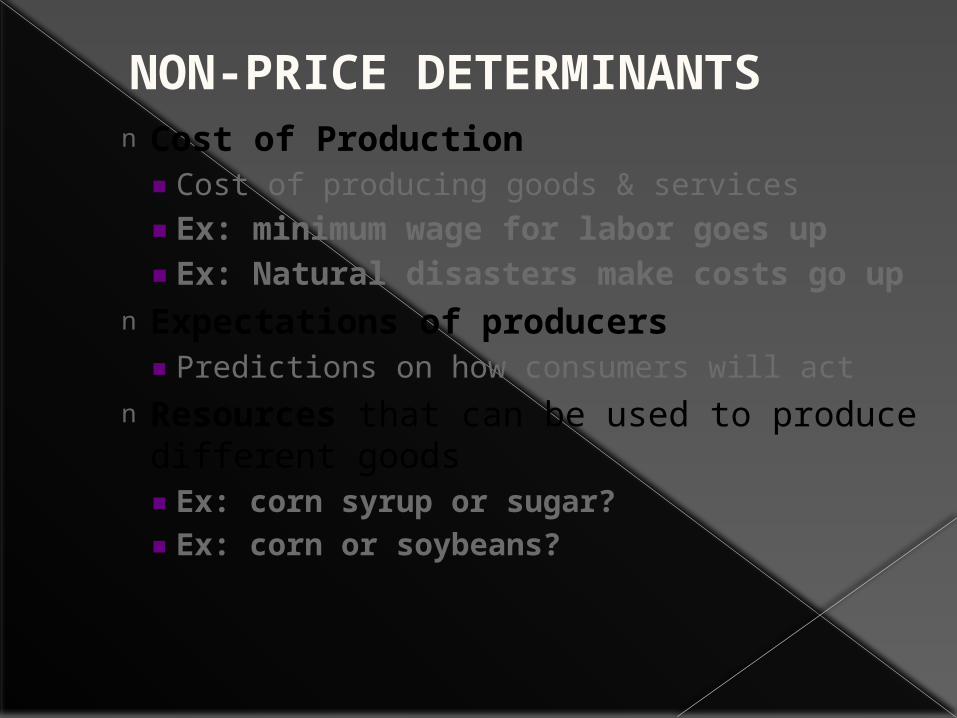
NON-PRICE DETERMINANTSn Cost of Production
◼Cost of producing goods & services◼Ex: minimum wage for labor goes up◼Ex: Natural disasters make costs go up
n Expectations of producers◼Predictions on how consumers will act
n Resources that can be used to produce different goods◼Ex: corn syrup or sugar?◼Ex: corn or soybeans?
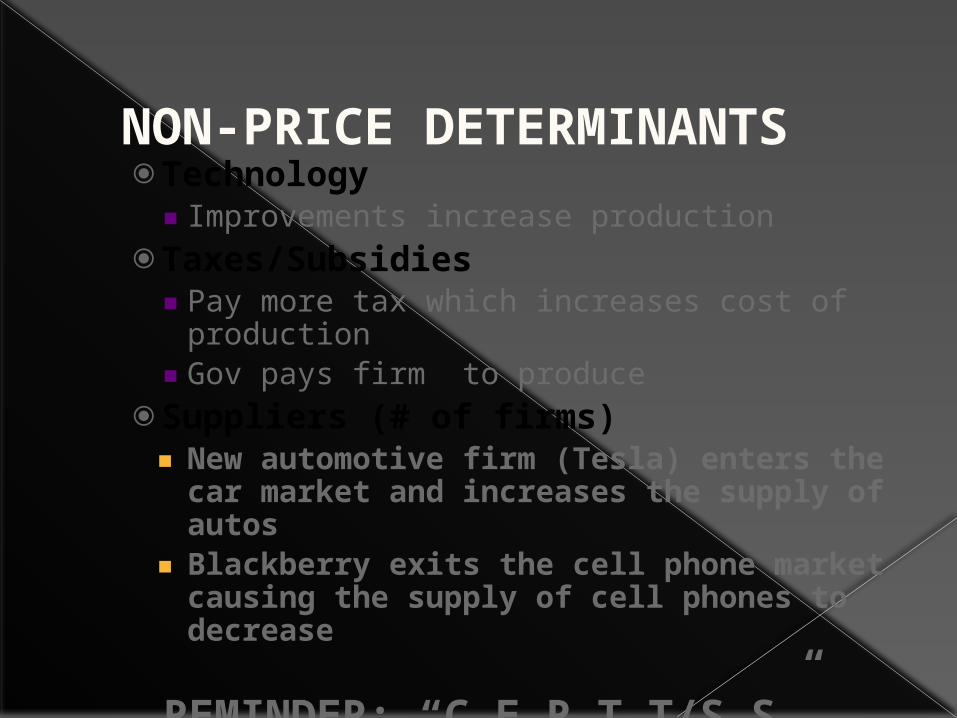
NON-PRICE DETERMINANTS⦿Technology
◼ Improvements increase production⦿Taxes/Subsidies
◼Pay more tax which increases cost of production
◼Gov pays firm to produce⦿Suppliers (# of firms)
◼ New automotive firm (Tesla) enters the car market and increases the supply of autos
◼ Blackberry exits the cell phone market causing the supply of cell phones to decrease
REMINDER: “C E R T T/S S”

SHIFTS IN SUPPLY & DEMAND CURVES
⦿ Increase - shifts to the right⦿Decrease - shifts to the left
PRICE
QUANTITY
PRICE
QUANTITY
D 1
D 2
D 1
D 2

SHIFTS IN SUPPLY & DEMAND CURVES
n Increase - shifts to the right
n Decrease - shifts to the left

EQUILIBRIUM PRICE⦿Point where buyers and sellers are equally
satisfied⦿Point where D & S curves intersect⦿Adam Smith’s Invisible Hand Theory
◼Forces of S & D, competition & price make societies use resources efficiently

EQUILIBRIUM PRICEPRICE
QUANTITY
SUPPLY
DEMAND
E P
EQ

SURPLUS⦿Supply is greater than demand at this price⦿Must adjust by lowering price to reach
equilibrium
supply
demand
SURPLUS
D Qty S Qty
P
Q

PRICE FLOORS⦿Government sets minimum price
◼Price can’t go lower◼Causes surplus◼Market can’t adjust
Ex: Minimum wage causes surplus of workers at set price
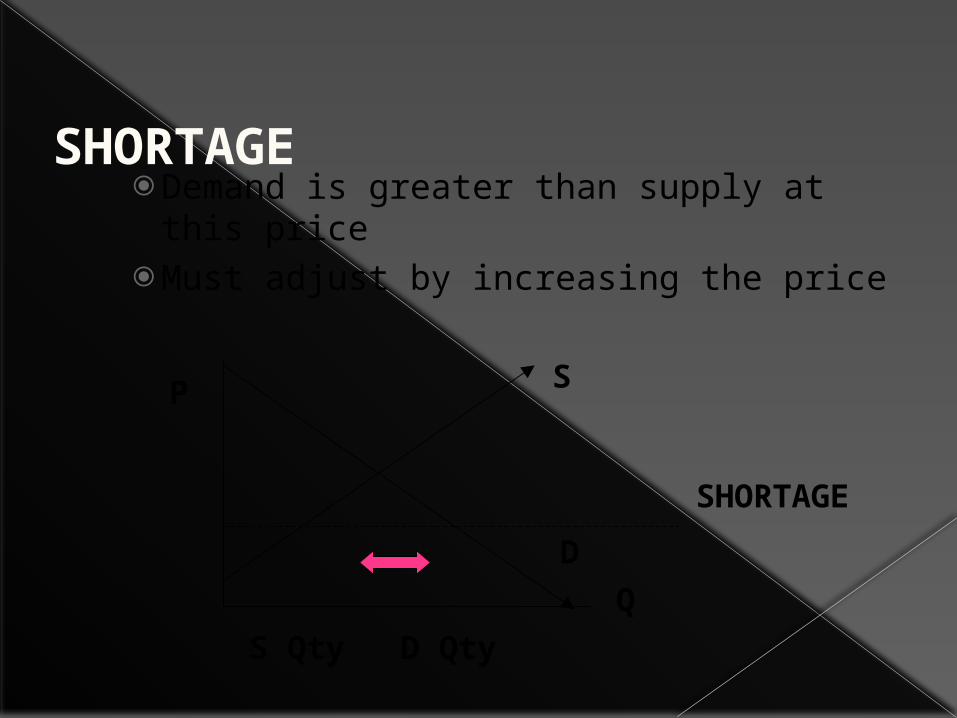
SHORTAGE⦿Demand is greater than supply at this price⦿Must adjust by increasing the price
P
Q
S
D
SHORTAGE
S Qty D Qty

PRICE CEILINGS⦿Government sets maximum price
◼Price can’t go higher◼Causes shortage◼Market can’t adjust
Ex: Rent controls, Price controls, Utility rates set by gov’t.
SUPPLY AND DEMAND CURVES Economic Analysis
In the supply/demand curves for new cars, where would the equilibrium price and quantities supplied/demanded be (P1 Q1)?
Now what if companies start to replace human workers, who take breaks, get sick, and get bored, with robots that work 24 hours per day? A change has taken place? Would it affect supply or demand first? Would supply increase or decrease due to this change? If the price were not changed, would there be a shortage or a surplus? What will happen to the Price and Quantity in order to reach the new equilibrium?
Congratulations! You have just done “economic analysis:
1. Before change:
a. Find original equilibrium.
2. Change:
a. Did it affect supply or demand first?
b. Which determinant caused the shift?
c. Did it increase or decrease?
3. After change:
a. Where is the new equilibrium?
b. What happens to Price?
c. What happens to Quantities demanded and supplied?

Two Curves Move -
We learned the S and D shift determinants separately, but in the prompts, two curves can move at once, causing S and D to shift at once.
When this happens, one of the variables, price or quantity, will change, but one will not change much or at all. We say that the variable is “indeterminate”. This means we can’t tell because we do not know the magnitude of the shifts.


