

Dis cus si on Paper No.09-076
Noncognitive Skills in Economics:Models, Measurement,and Empirical Evidence
Hendrik Thiel and Stephan L. Thomsen

Dis cus si on Paper No.09-076
Noncognitive Skills in Economics:Models, Measurement,and Empirical Evidence
Hendrik Thiel and Stephan L. Thomsen
Die Dis cus si on Pape rs die nen einer mög lichst schnel len Ver brei tung von neue ren For schungs arbei ten des ZEW. Die Bei trä ge lie gen in allei ni ger Ver ant wor tung
der Auto ren und stel len nicht not wen di ger wei se die Mei nung des ZEW dar.
Dis cus si on Papers are inten ded to make results of ZEW research prompt ly avai la ble to other eco no mists in order to encou ra ge dis cus si on and sug gesti ons for revi si ons. The aut hors are sole ly
respon si ble for the con tents which do not neces sa ri ly repre sent the opi ni on of the ZEW.
Download this ZEW Discussion Paper from our ftp server:
http://ftp.zew.de/pub/zew-docs/dp/dp09076.pdf
First version: June 2009Revised version: November 15, 2011

Non-technical Summary
Measuring unobserved individual ability is a core challenge of the analysis of questions related to human cap-
ital development. For this purpose, concepts from psychology, predominantly measures of IQ, have become
established means in empirical economics. However, individual differences that drive human capital related
achievements go far beyond pure intelligence. Within the last decade, the consideration of personality traits
has found its way into the economic literature and substantially contributes to narrow the gap of explained and
unexplained aspects of human capital outcomes. Economists usually refer to noncognitive skills instead of per-
sonality traits. It is tempting to employ the instruments from psychology without further consideration of the
different aims both disciplines pursue in applying these constructs. Whereas economists are interested in estab-
lishing personality traits as productivity enhancing skills for rather specific settings, personality psychologists
are more interested in explaining an individual’s complete spread of behavior and thoughts.
The overview at hand gives an extensive treatise of central questions and findings regarding the proper applica-
tion of instruments for personality assessment. It conveys basic definitions, types of measurement, personality
development, theoretical modeling, outcomes, and problems arising with empirical analysis of personality traits.
It focuses on notational and methodological specifics of the psychological literature and links it to the field of
economics. It addresses crucial assumptions necessary to establish existence of a set of noncognitive skills in
the sense of the human capital theory. The paper also addresses econometric challenges inherent in the analysis
of personality traits and provides an overview on the methodological literature that intends to overcome these
problems. A cursory summary of studies examining outcomes and investments in the evolvement of personality
traits sheds light on the formation process.
Some major findings highly relevant for policy recommendations could be identified in the literature: Early in-
vestments are the most crucial inputs into skill formation in general and should be followed by later investments.
As a consequence, early neglect usually cannot be compensated in the aftermath since returns to education di-
minish. Even more importantly, the impact of acquired noncognitive skills on various outcomes throughout the
life course could be even more eminent than skills related to pure intelligence. Not only schooling and later
earnings, but also important social and health-related outcomes are strongly affected.

Das Wichtigste in Kurze
Die Erfassung der unbeobachtbaren individuellen Fahigkeiten ist die wesentliche Anforderung in der empirischen
Untersuchung humankapitaltheoretisch motivierter Fragestellungen. Hierzu werden seit langem Konzepte aus
der Psychologie verwendet, insbesondere zur Messung kognitiver Fahigkeiten wie z.B. dem IQ. Wesentliche
Teile individueller Unterschiede bleiben bei einer solchen Approximation aber unerklart. Der Einbezug von
Personlichkeitsmerkmalen in der jungeren Forschung hat zu einem erheblichen Erkenntnisgewinn in der Erklarung
dieser Unterschiede beigetragen. Entsprechend der Terminologie der Humankapitaltheorie ist in der okono-
mischen Literatur der Begriff nicht-kognitive Fahigkeiten anstelle der Personlichkeitsmerkmale gebrauchlich.
Eine Folge des interdisziplinaren Charakters der verwendeten Instrumente ist jedoch, dass ein allzu unbedachter
Einsatz, ohne Berucksichtigung der in der Psychologie getatigten Einschrankungen, die Ergebnisse nachhaltig
verzerren kann.
Der vorliegende Aufsatz gibt einen Uberblick uber die Fragestellungen, die fur einen korrekten Einsatz der zu
Verfugung stehenden Instrumente relevant sind. Der Schwerpunkt liegt dabei auf der abgrenzenden Definition,
der Messung und Erfassung, der theoretischen Erklarung des Entwicklungsprozesses uber den Lebenszyklus und
der verfugbaren empirischen Evidenz uber die Folgen nicht-kognitiver Fahigkeiten. Die Validitat bei der Anwen-
dung der jeweiligen psychometrischen Konzepte ist jedoch von einigen einschrankenden Annahmen abhangig,
die fur eine sinnvolle Verknupfung zur okonomischen Literatur jedoch eintscheidend sind. Eine kurz Diskussion
der am haufigsten auftretenden methodischen Probleme und geeigneter okonometrischer Losungsansatze ist
ebenfalls Gegenstand des Beitrags. Zum besseren Verstandnis der Humankapitalentwicklung wird ein reprasen-
tativer Uberblick uber empirische Studien, die mogliche Investitionen in den Entwicklungsprozess sowie die
Erlose gesteigerter nicht-kognitiver Fahigkeiten thematisieren, gegeben.
Als zentrale Ergebnisse aus dieser Ubersicht lassen sich die folgenden hervorheben: Fruhkindliche Investitionen
sind die entscheidenden Inputs in die Fahigkeitenentwicklung, sie sollten aber durch spatere Investitionen erganzt
werden. Wichtige Konsequenz hieraus ist, dass Vernachlassigungen im fruhen Alter im Nachhinein nur schwer
zu kompensieren sind, da Bildungsinvestitionen einem abnehmenden Grenzertrag unterliegen. Daruber hinaus
kann die Tatsache, dass nicht-kognitive Fahigkeiten einen weitaus nachhaltigeren Einfluss auf viele Großen
im Lebensverlauf haben als bislang angenommen, als fundamental und essenziell beurteilt werden. Zu den
beeinflussten Großen zahlen neben Schulabschluss und Verdienst auch soziale Ergebnisse und die Gesundheit.
Noncognitive Skills in Economics:
Models, Measurement, and Empirical Evidence*
Hendrik Thiel�
NIW, Hannover
Stephan L. Thomsen�
Leibniz University Hannover & NIW, Hannover & ZEW, Mannheim
First version: June 2009Revised version: November 15, 2011
Abstract
There is an increasing economic literature considering personality traits as a source of individual dif-ferences in labor market productivity and other outcomes. This paper provides an overview on the role ofthese skills regarding three main aspects: measurement, development over the life course, and outcomes.Based on the relevant literature from different disciplines, the common psychometric measures used toassess personality are discussed and critical assumptions for their application are highlighted. We sketchcurrent research that aims at incorporating personality traits into economic models of decision making. Arecently proposed production function of human capital which takes personality into account is reviewedin light of the findings about life cycle dynamics in other disciplines. Based on these foundations, themain results of the empirical literature regarding noncognitive skills are briefly summarized. Moreover,we discuss common econometric pitfalls that evolve in empirical analysis of personality traits and possiblesolutions.
Keywords: noncognitive skills, personality, human capital formation, psychometric measures
JEL Classification: I20, I28, J12, J24, J31
*We thank Katja Coneus, Friedhelm Pfeiffer and the participants of the University of Magdeburg Mentoring Seminar 2009,Potsdam, for valuable comments. Financial support from the Stifterverband fur die Deutsche Wissenschaft (Claussen-Simon-Stiftung) is gratefully acknowledged. The usual disclaimer applies.
�Hendrik Thiel is Research Assistant at the NIW, Hannover. Address: Konigstraße 53, D-30175 Hannover, e-mail: [email protected],phone: +49 511 12331635, fax: +49 511 12331655.
�Stephan L. Thomsen is Professor of Applied Economic Policy at Leibniz University Hannover, Director of the Lower SaxonyInstitute of Economic Research (NIW), and Research Associate at the Centre for European Economic Research (ZEW) Mannheim.Address: Konigstraße 53, D-30175 Hannover, e-mail: [email protected], phone: +49 511 12331632, fax: +49 511 12331655.
1 Introduction
There is a long literature in economics that investigates the sources and mechanisms of individual
differences in labor market productivity. Starting with the seminal work by Becker (1964), numerous
approaches modeling the relationship between innate ability, acquired skills, educational investment,
and economic outcomes in terms of educational or labor market success have been established.1 Un-
fortunately, empirical analysis in this field has been always burdened with a lack of observability of
individual differences in these determinants. For several decades, measures of cognitive ability, mostly
IQ or achievement tests, have been used for approximation.2 In psychology, the personality as another
source of individual differences in achievements has been a core topic for a long time (see, e.g., Roberts
et al., 2007, for an overview). Although these determinants have been implicitly addressed in human
capital theory, empirical economists have just started to take these findings into account and to em-
phasize the crucial role of personality traits in explaining economic outcomes (see, e.g., Heckman and
Rubinstein, 2001). For traits related to these outcomes economists use the term noncognitive skills.
The practical implementation of measurement is attained by means of psychometric constructs.3 The
consideration of trait measures in empirical analysis contributes to a better understanding of the gen-
esis and the evolvement of skills other than those indicated by formal education and labor market
experience.
However, the objectives in applying these measures in economics and psychology fundamentally
differ. Economists are interested in establishing traits as productivity enhancing skills for rather
specific settings. Personality psychologists, on the contrary, try to explain an individual’s complete
spread of behavior and thoughts. Delving into this literature is cumbersome for researchers from the
economic discipline. Nonetheless, using the set of psychometric measures in an ill-advised manner due
to a lack of knowledge of the broad notions in psychology can lead to very contradictory results.
The overview at hand gives an extensive treatise of central questions and findings regarding
definitions, measurement, development, theoretical modeling, outcomes, and problems arising with
empirical analysis of personality traits. It complements other surveys on the topic in that it focuses
on notational and methodological specifics of the psychological literature and links it to the field
of economics. It addresses some critical assumptions necessary to establish existence of a set of
noncognitive skills in the sense of the human capital theory. We also address econometric challenges
inherent to the analysis of personality traits and provide an overview on the methodological literature
that intends to overcome these problems. The survey is completed by a cursory summary of studies
1 Another landmark contribution to the literature on human capital development is due to Ben-Porath (1967). Seealso Becker and Tomes (1986), Aiyagari et al. (2003), and Coleman and DeLeire (2003).
2 See, for example, Hause (1972), Leibowitz (1974), Bound et al. (1986), and Blackburn and Neumark (1992). Seealso Griliches (1977) for an overview.
3 Psychometrics is the field of psychology that deals with measurement of psychological constructs, including person-ality traits.
1
relating to outcomes and formation of personality traits.
The topics are discussed in the following order: we will introduce crucial definitions and elicit
how the notion of noncognitive skills is embedded in the psychologic literature in the next section.
Afterwards, a selection of psychometric measures for personality traits will be presented and evalu-
ated with respect to their virtues and drawbacks. In addition, we give an introductory overview on
validity and reliability measures commonly used in psychometrics, and what should be considered
when applying them for construct choice. Section 4 embeds the psychologic and sociologic literature
on personality development into a formal framework of human capital formation suggested by Cunha
and Heckman (2007). Section 5 outlines general notions and first evidence on how to map personality
traits into economic preference parameters. In Section 6 we review a number of studies establishing
causal inference for noncognitive skills on several outcomes. Econometric approaches that account for
the fact that measures based on test scores only imperfectly represent latent personality traits are
introduced in section 7. It intends to provide a valuable means to researchers unfamiliar with the
topic. Section 8 concludes and gives an outlook.
2 Noncognitive Skills: Some Notational Clarifications
The term noncognitive skills originates from the economic literature starting to emerge in course of
the work by Heckman and Rubinstein (2001). It comprises the notion of personality traits which are,
besides pure intelligence, particularly relevant for several human capital outcomes, such as educational
or labor market achievements. These traits constitute, along with other determinants, an individual’s
personality. In economic terms, personality is a kind of response function to various tasks (see Alm-
lund et al., 2011). There are several approaches in the psychologic literature that target modeling
personality in light of environmental entities. A good point of departure is the model suggested by
Roberts et al. (2006) and therefore we use it as a reference framework for the remainder of this article.
It designates four core factors of personality: personality traits, abilities (cognitive), motives, and nar-
ratives. Together with social roles and cultural determinants, these core factors produce the identity
(consciously available self-image about the four factors, including self-reports) and reputation (others’
perspectives) of an individual. The model also accounts for the possibility of feedback processes, that
is, the possibility of environment activating the core factors and vice versa. In its original definition,
personality traits are relatively persistent attributes of behaviors, feelings and thoughts, i.e., they
are largely non-situational (see Allport, 1937). However, the prevalence of consistency (or at least a
certain degree) across situations is not without controversy in the literature. We will elaborate on this
in a later section.
Prominent examples for personality traits are self-discipline, self-control, agreeableness, self-
2
esteem, or conscientiousness, just to mention a few.4 As the aforementioned model by Roberts et
al. (2006) suggests, few issues of personality are devoid of cognition. Sometimes it is even hard to con-
ceptually (not empirically, we will elaborate on this in section 3) distinguish cognitive and personality
traits. For instance, emotional intelligence (see Salovey et al., 2004), which describes the processing
ability to anticipate the consequences of feelings and the resulting behavior, is a marginal case in
terms of cognitive and personality traits.5 Hence, the denotation noncognitive is rather imprecise.
Nonetheless, in accordance with most of the economic literature, we use the terms noncognitive skills
and personality traits interchangeably in the following.
In order to relate the notions from psychology to economic terms, one can think of cognitive
and noncognitive skills as an acquired and inherited stock of human capital. However, to attain
definitional plainness we need to resolve the dichotomy of skills and abilities prevailing in traditional
human capital literature. Becker (1964) claims a binary stratification where abilities are innate and
genetically predetermined, whereas skills are acquired over the life cycle. According to this view, skills
and abilities are two distinct determinants of potential outcomes.6 Contemporary literature, enriched
by constructs of personality and intelligence as an interdisciplinary means of measuring human capital,
emphasizes and empirically proves that innate abilities provide the initial input in the process of skill
formation (see Cunha and Heckman, 2006, Cunha et al., 2010). These findings suggest to waive the
distinction between skills and abilities.
Put together, it is obvious that human personality is a highly complex construct that goes
beyond the concept of personality traits and requires consideration of multiple factors combined in an
interactional pattern. As the remainder of this paper will show, personality and its impact on various
outcomes are of particular interest for the field of economics. To make theory and assessment from
psychology a powerful toolbox for empirical research in economics, however, one has to presume a
sufficient degree of stability and make certain simplifications. Fortunately, an economist’s objective
is rarely to model and map virtually all facets of personality, but to identify relatively stable and
conveniently assessable determinants of the outcomes of interest. This circumstance in association
with a general tendency to reconcile different views about cross-situational stability of the personality
in the psychological field (Roberts, 2009) will ease some of the discussions rendered subsequently.
4 For example, Allport and Odbert (1936) obtained about 18,000 attributes describing individual differences in theEnglish language.
5 Borghans et al. (2008a) discuss further examples like cognitive style, typical intellectual engagement, and practicalintelligence.
6 To that effect, Becker (1964) figures out that acquired skills possess higher explanatory power for future earningsthan innate abilities do.
3
3 Measuring Noncognitive Skills
There is no uniform assertion about the adequate assessment of personality and the underlying per-
sonality models prevalent in psychology. Hence a brief overview on the relevant psychologic literature
is a sensible first step. The crucial issue in terms of postulating persistent skills for economic analysis
is to ensure the stability of personality traits across situations. If consistency across situations is only
fragile or at worst non-existent, and situational and contextual determinants drive observed measures
instead, it would be meaningless to evaluate its relevance and to construe it as a persistent set of skills
which constitutes human capital.
3.1 Personality and Situations
The existence of persistent traits has been subject to vigorous discussion in the literature in the last
decades. The common reading of the influential work by Mischel (1968) is that all patterns of behavior,
feelings, and thoughts are manifestations of specific situations, not of personality traits. Mischel and
his proponents constitute this as a misinterpretation in the aftermath. Mischel (1973) has endeavored
to incorporate situation into whatever drives stable characteristics (e.g. personality traits), dubbing
it the if-then signature of personality. This signature characterizes an individual by stable patterns of
variability across situations. Orom and Cervone (2009) therefore claim that Mischel’s initial point was
that cross-situational consistency in personality assessment is low when limiting to global, nomothetic
trait constructs.7 Things become more clear-cut when dropping this rigid assumption and allowing for
other factors to affect measured personality. The ensuing discourse in the literature led to alternative
notions of personality.
The social-cognitive approach established and advocated by Mischel (1973) and Bandura (1986)
provides such an alternative structure of personality. It mainly focuses on explaining the cognitive
processing underlying thoughts and behaviors. Accordingly, people differ in terms of cognitive abilities
relevant for the implementation of certain behaviors. The awareness of these abilities in conjunction
with expectations about self-efficacy, goals, and valuation standards constitute the personality. All four
subsystems of personality are interactional in nature and therefore not separately assessable.8 Strictly
speaking, the evaluator has to account for the situation as perceived by the observed individual
and analyze consistent patterns in this situational context. One of Bandura’s contributions is the
concept of reciprocal determinism. It essentially states that there is no actual source of behavior as
asserted by trait theorist or behaviorists. Instead there is a triangular feedback system composed
of personal characteristics, behavior, and environmental factors. An interior processing approach
underlying this system is the cognitive-affective processing system by Mischel and Shoda (1995). It
7 This does not imply that cross-situational consistency is non-existent.8 A social-cognitive theorist would not assign a certain score to one of these systems.
4
interrelates the abovementioned subsystems (abilities, expectations, goals, and valuation standards)
by means of cognition and affects. Individual differences therefore arise from differences in activation
levels of cognitions and affects. The accessability of activation levels differs over various situations.
A contrary view to the whole situation debate is held by the proponents of the global dispositional
approach. It is exemplified best by concepts like the Five Factor Model of Goldberg (1971) and related.9
Proponents of the Five Factor Model constantly highlight the consistency of personality across time
and situation.
The most widely held approach in contemporary personality psychology is to combine the as-
sumption of a certain stability in traits with social-cognitive units, such as goals expectations, and
assign them to different levels of analysis.10 The Roberts model for personality that we use as a base-
line accounts for these units and their interaction with environmental factors.11 Moreover, it maintains
the notion of personality traits irrespective of the underlying cognitive processing function and refers
to other units of analysis in the system of personality when modeling contextual patterns.
All observed (or otherwise assessed) measures of latent personality traits can also be manifesta-
tions of the other units of analysis addressed in the Roberts model. For instance, fulfilling a certain
social role at the time the assessment takes place is a contextualizing variable one has to control for
(see Wood, 2007).12 This proceeding gives rise to a certain stability of personality traits across situa-
tions and therefore paves the way for application of the kind of personality tests empirical economists
are most interested in.
3.2 Types of Assessment-Tools
How do trait theorists or social-cognitive theorists assess the entities in their respective models and
what are the pros and cons of the respective methods with regard to different assessment situations?
There are three main dimensions an evaluator has to decide on: (1) the type of assessment, (2) the
person to be assessed, and (3) the dimension.
(1) Proponents of the social-cognitive approach usually rely on qualitative assessment methods
conducted by experts who passively observe or interview. This method involves variations of situational
stimuli and substitutions of the assessed person until systematic evidence for the underlying processing
is revealed. For applications within the scope of observational (and even experimental) data prevailing
in empirical economics this type of assessment is rather cumbersome and costly. For large scale
9 The most widely applied version is the Big Five inventory of Costa and McCrae (2008).10 Even very early definitions of personality traits implicitly account for situational variance in behavior (Allport,
1961, p. 347)11 Roberts (2009, p. 138) vividly summarizes this reconciling approach in the following manner: “The trait psycholo-
gists can continue to focus on factor structure and test retest stability. The social cognitive psychologists can studygoals, motives, beliefs, and affect - things that putatively change.”
12 As section 4 will briefly address, permanently fulfilling certain social roles does not solely affect measures of person-ality, but induces changes of states of personality traits as well.
5
investigations quantitative assessment methods are undeniably more appealing and, therefore, in our
focus henceforth. In general, their aim is to provide scores for respective dimensions of the construct.
These scores are directly used for analyses or employed to derive an underlying latent construct.
(2) Moreover, the evaluator has to choose between self-reports and observer reports. Self-
reported measures are convenient due to their simple implementation but implicitly assume that
respondents are capable to consciously perceive their personality or at least their actions manifesting
it. This prerequisite does not generally apply. For instance, infants and children are not capable of
doing so and, thus, are usually assessed by observers from the social environment (parents or teachers).
Distortions of self-reports or observer ratings can also be more generic. For traits related to typical
social settings, like meeting a stranger or having a discussion, observer ratings tend to predict behavior
better than self-reports since the potential for disorder in self-perception is high. For instance, what
the narrator of a joke believes to be funny is not perceived by others in the same manner. Vice versa,
self-reported personality ratings are more strongly related to assessments of emotional issues driven
by interior processes and less shared with others. An illustrative example for that is a person annoyed
by depressions who would usually try to conceal his or her problems from others. On the other hand,
they lack the virtue of easy implementation of test scores administered as a questionnaire. The choice
of the person to be assessed therefore strongly depends on the trait of interest.
(3) The remaining question is to which extent a measure captures the personality. Besides
various low-dimensional scores for assessing the magnitude of specific traits, there is a large number
of taxonomies mapping human personality as a whole. Proponents of these personality inventories
or high-order constructs advocate the global dispositional approach we discussed above and therefore
construe these models as comprehensive personality inventories.
Higher-Order Constructs: Most mappings of personality impute a hierarchical structure which
is based on common (exploratory) factor analytic approaches exploiting lexical-linguistic informa-
tion. These inventories build on measurement systems comprising a multitude of respective questions
(items). They follow the notion of the setups usually applying to the segmentation of general IQ.13
In case of personality the level of abstraction is lower. Despite early efforts to identify a general fac-
tor for personality (see Webb, 1915), personality inventories from the prosperity period of the global
dispositional approach usually assume at least three major factors. Table 1 provides an overview on
the commonly used concepts in the literature.
< Include Table 1 about here >13 A version of Cattell (1971) includes fluid intelligence, that is, the ability to solve novel problems, and crystallized
intelligence, comprising knowledge and developed skills.
6

A widely accepted taxonomy is the Five Factor Model established by Goldberg (1971) and the
related Big Five by Costa and McCrae (1992). The identification of five high-order factors is not
uncontested in the literature. Some factor analytic results suggest a lower number of factors, whereas
others claim a higher number. Eysenck (1991), for example, provides a model with just three factors;
Digman (1997) curtails the Big Five distinction to only two higher-order factors.14 In contrast to that,
Hough (1992) proposes a more stratified version of the Big Five taxonomy, the so-called Big Nine. Due
to their factor analytic genesis virtually all the aforementioned concepts lack a theoretical foundation
and, therefore, are largely inconsistent with the type of personality models discussed above. Only for
exceptional cases neurological support for the constructs is available (see, e.g., Canli, 2006, pertaining
to the Big Five).
As a consequence, low predictive power of a high-order factor does not necessarily imply that
all of the lower-order factors in Table 1 exert no influence on an outcome of interest. Using lower-
order constructs or even uni-dimensional factors often entails a gain in explanatory power, but at the
potential cost of not covering all relevant personality facets.
Lower-Order Constructs: There is also a large number of lower-order constructs. Prominent
examples in the context of educational outcomes are self-control (see Wolfe and Johnson, 1995) and
the related self-discipline (see Duckworth and Seligman, 2005). The Brief Self-Control Scale (Tangney
et al., 2004) is a commonly used means of assessing self-control. It includes 13 items which sum up
to a score increasing with self-control. The Internal-External Locus of Control by Rotter (1966) is
often perceived as a related measure, but merely assesses an individual’s attitude on how self-directed
(internal) or how coincidental attainments in her or his life are. The original Locus of Control (Rotter,
1966) comprises 60 items. Usually, longitudinal datasets apply abbreviated versions.15 A similar scale
for Locus of Control is the Internal Control Index (Duttweiler, 1984), a 28-item scale that scores
in the internal direction. Self-esteem provides a further important determinant of educational and
labor market outcomes (see Heckman et al., 2006). It is often quantified by the Rosenberg Self-
Esteem Scale (Rosenberg, 1965), a 10-item scale. For the assessment of children’s personality the
use of observation from third persons prevail. A corresponding scale based on observational report
is the Self-Control Rating Scale (Kendall and Wilcox, 1979), a 33-item scale indicating the ability of
inhibiting impulsiveness.
This leads to the related field of temperamental studies prevailing in developmental psychol-
ogy.16 Constructs to assess temperament rather refer to behavioral tendencies than pure behavioral
14 The factors are not presented in Table 1 since they are simply denoted metatraits without further specification.15 The German Socio Economic Panel (SOEP), for instance, comprises a 10 item version, whereas the National
Longitudinal Survey of Youth uses a 23 item version.16 Developmental psychology deals with all kind of psychological changes over the life course, not only personality.
The major focus, however, is on infancy and childhood.
7
acts. An influential model has been suggested by Thomas et al. (1968). It stratifies temperament
to nine categories each grouped into three types of intensity. There are further established concepts
of temperament, e.g., Buss and Plomin (1975) and Rothbart (1981), but even more recent literature
is still involved in this topic (see, e.g., Rothbart and Bates, 2006).17 Meanwhile, some interrelations
between concepts of personality psychology and developmental psychology have been established. For
instance, Caspi (2000) reveals links between the extent of temperamental facets at age 3 and person-
ality at adulthood. Temperament at infancy and early childhood designates later personality but is
remittently affecting behavior as the individual matures. According to Thomas and Chess (1977),
purely temperamental expressions at later age are only likely in case of being faced with a new en-
vironmental setting. However, the inferences from studies linking temperament and personality are
far from being conclusive (see Rothbart et al., 2000, Shiner and Caspi, 2003, Caspi et al., 2005, for a
review of the literature).
3.3 Reliability
Reliability refers to the consistency of answers to a psychometric task over time or across observa-
tions.18 It originates from methods of classical test theory, one of the very first fields analyzing issues
of measurement error. What should be considered when picking tests in order to ensure a high de-
gree of reliability? The consistency of a task to measure a trait is mainly imperiled if other units of
analysis in the (Roberts) model are captured by it. Separately assessing these units is difficult due
to the fact that they are not isolated but instead influence each other simultaneously. For instance,
when measuring a certain personality trait by means of a questionnaire, it is important not to prompt
the respondent to project his thoughts into a particular situation in order to reply to an item. In this
case the score can be a manifestation of the trait of interest, but also of motivation, past experiences,
or narratives and abilities helpful for comprehension of the task.
Though proponents of the global dispositional approach claim that most of the variables dis-
cussed in the Roberts model can be mapped into the dimensions of their personality inventories (see
Costa and McCrae, 1992, for emprical evidence), this result is dissatisfying when it comes to identifi-
cation of persistent traits and subsequent anchoring to economic outcomes. Methods of exploratory
17 See Goldsmith et al. (1987) for an overview on temperamental measures.18 Reliability could be most directly checked by means of test-retest correlations over time. Generally, each test item
i can be expressed asxi = αiτi + εi,
where xi is the attained score, τi is the true score with αi as the corresponding scaling parameter, and εi is anerror term. Since test-retest settings are rarely at hand, other coefficients prevail. A standard measure to quantifyreliability across several items is Cronbach’s alpha (see Cronbach, 1951) which can be determined as follows:
ρα = (l
l − 1)(1 − ∑
li=1 V ar(xi)
V ar(∑li=1 xi)) ,
where l is the number of items used to measure the true score. It relates item variance to the variance of the totalscore and therefore increases with rising inner consistency of the construct.
8
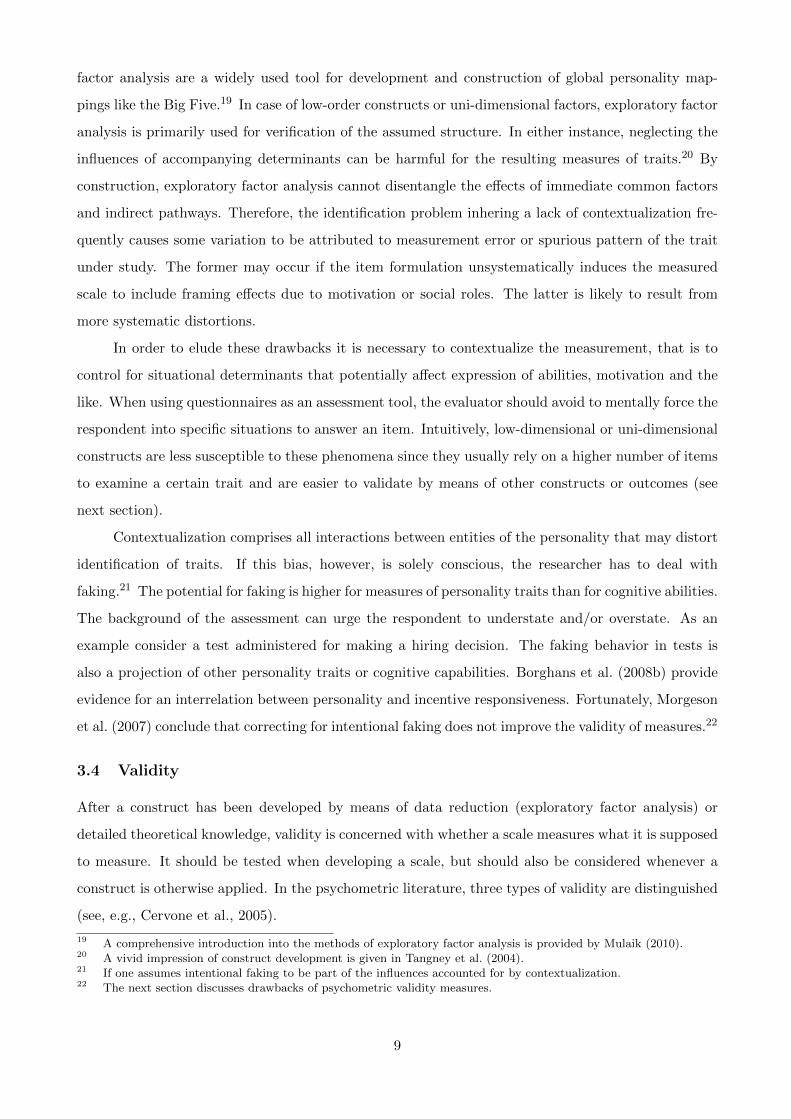
factor analysis are a widely used tool for development and construction of global personality map-
pings like the Big Five.19 In case of low-order constructs or uni-dimensional factors, exploratory factor
analysis is primarily used for verification of the assumed structure. In either instance, neglecting the
influences of accompanying determinants can be harmful for the resulting measures of traits.20 By
construction, exploratory factor analysis cannot disentangle the effects of immediate common factors
and indirect pathways. Therefore, the identification problem inhering a lack of contextualization fre-
quently causes some variation to be attributed to measurement error or spurious pattern of the trait
under study. The former may occur if the item formulation unsystematically induces the measured
scale to include framing effects due to motivation or social roles. The latter is likely to result from
more systematic distortions.
In order to elude these drawbacks it is necessary to contextualize the measurement, that is to
control for situational determinants that potentially affect expression of abilities, motivation and the
like. When using questionnaires as an assessment tool, the evaluator should avoid to mentally force the
respondent into specific situations to answer an item. Intuitively, low-dimensional or uni-dimensional
constructs are less susceptible to these phenomena since they usually rely on a higher number of items
to examine a certain trait and are easier to validate by means of other constructs or outcomes (see
next section).
Contextualization comprises all interactions between entities of the personality that may distort
identification of traits. If this bias, however, is solely conscious, the researcher has to deal with
faking.21 The potential for faking is higher for measures of personality traits than for cognitive abilities.
The background of the assessment can urge the respondent to understate and/or overstate. As an
example consider a test administered for making a hiring decision. The faking behavior in tests is
also a projection of other personality traits or cognitive capabilities. Borghans et al. (2008b) provide
evidence for an interrelation between personality and incentive responsiveness. Fortunately, Morgeson
et al. (2007) conclude that correcting for intentional faking does not improve the validity of measures.22
3.4 Validity
After a construct has been developed by means of data reduction (exploratory factor analysis) or
detailed theoretical knowledge, validity is concerned with whether a scale measures what it is supposed
to measure. It should be tested when developing a scale, but should also be considered whenever a
construct is otherwise applied. In the psychometric literature, three types of validity are distinguished
(see, e.g., Cervone et al., 2005).
19 A comprehensive introduction into the methods of exploratory factor analysis is provided by Mulaik (2010).20 A vivid impression of construct development is given in Tangney et al. (2004).21 If one assumes intentional faking to be part of the influences accounted for by contextualization.22 The next section discusses drawbacks of psychometric validity measures.
9
Content Validity: Content Validity is a qualitative type of validity and requires sound theoretical
foundation in order to evaluate whether the whole theoretical domain is captured by the data. For
instance, if a construct justified by theory comprises three different dimensions, that is, three latent
factors, one needs measures for all of them. Otherwise, content validity is questionable. A lack of
theoretical consensus is the major weakness of this kind of validity.
Criterion Validity: To test for criterion validity one needs a variable that constitutes a standard
measure to which to compare the used measures. It can be a concurrent measure from the same
measurement system or a predictive measure provided by a future outcome. The magnitude is usually
represented by means of correlations between measurement and criterion variables. It can be shown
(see Bollen, 1989, for a detailed discussion) that the magnitude is largely sensitive to unsystematic
error variance in both, measurement and criterion variable, and depends on the choice of criteria.23
Moreover, validity measures based on simple correlation are not necessarily capturing a causal rela-
tionship.
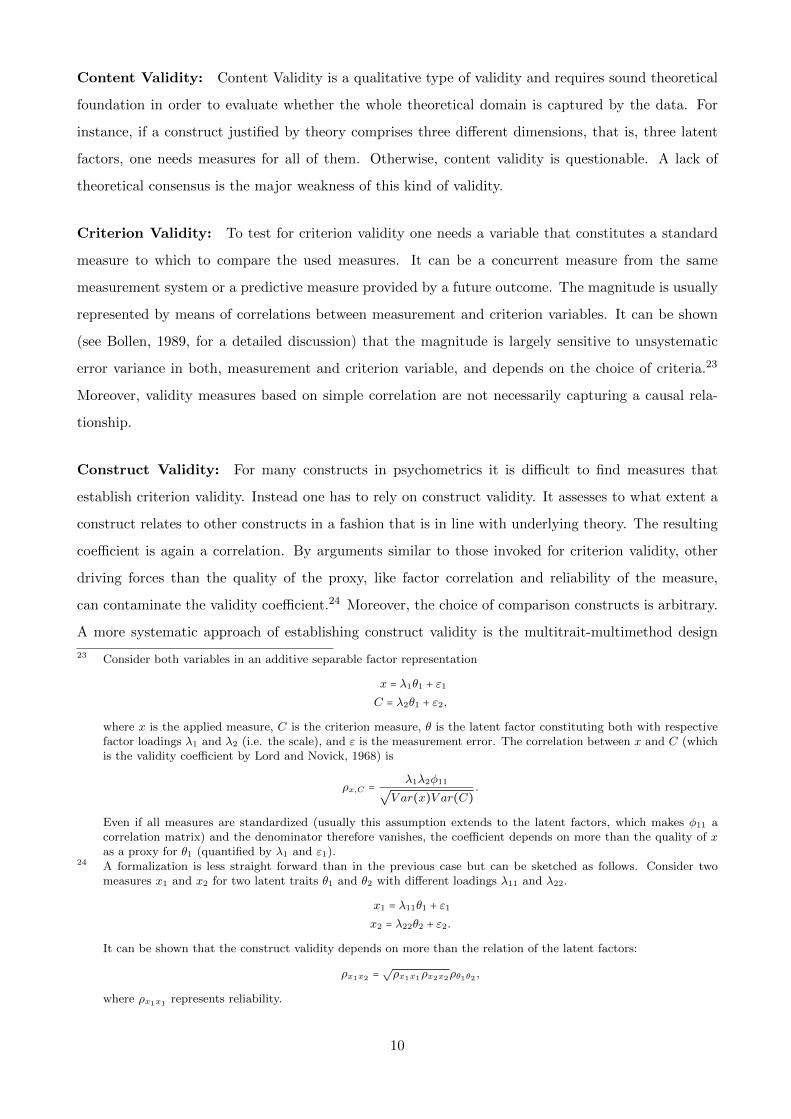
Construct Validity: For many constructs in psychometrics it is difficult to find measures that
establish criterion validity. Instead one has to rely on construct validity. It assesses to what extent a
construct relates to other constructs in a fashion that is in line with underlying theory. The resulting
coefficient is again a correlation. By arguments similar to those invoked for criterion validity, other
driving forces than the quality of the proxy, like factor correlation and reliability of the measure,
can contaminate the validity coefficient.24 Moreover, the choice of comparison constructs is arbitrary.
A more systematic approach of establishing construct validity is the multitrait-multimethod design
23 Consider both variables in an additive separable factor representation
x = λ1θ1 + ε1
C = λ2θ1 + ε2,
where x is the applied measure, C is the criterion measure, θ is the latent factor constituting both with respectivefactor loadings λ1 and λ2 (i.e. the scale), and ε is the measurement error. The correlation between x and C (whichis the validity coefficient by Lord and Novick, 1968) is
ρx,C =λ1λ2φ11√
V ar(x)V ar(C).
Even if all measures are standardized (usually this assumption extends to the latent factors, which makes φ11 acorrelation matrix) and the denominator therefore vanishes, the coefficient depends on more than the quality of xas a proxy for θ1 (quantified by λ1 and ε1).
24 A formalization is less straight forward than in the previous case but can be sketched as follows. Consider twomeasures x1 and x2 for two latent traits θ1 and θ2 with different loadings λ11 and λ22.
x1 = λ11θ1 + ε1
x2 = λ22θ2 + ε2.
It can be shown that the construct validity depends on more than the relation of the latent factors:
ρx1x2 =√ρx1x1ρx2x2ρθ1θ2 ,
where ρx1x1 represents reliability.
10
suggested by Campbell and Fiske (1959). It requires that two or more traits are measured by two or
more constructs (i.e. methods). If the correlations for the same trait across measures are significantly
large, there is evidence for convergent validity. Discriminant validity arises if convergent validity is
higher than the correlation between measures which neither share trait nor method and higher than
the correlation between different traits measured with the same method. Again, the magnitude of
convergent validity can be sensitive for other reasons than closeness of the measure, like latent factor
correlation and reliability.
As the foregoing discussion suggests, there is a twofold circularity to solve in order to obtain
reasonable validity measures. The first is circularity in a statistical sense, that is, a simultaneous
causality between measures and the latent traits. The second is a circularity in justification of genuine
measures and resultant measures of validation. This is what Almlund et al. (2011) denote an intrinsic
identification problem rather than a parameter identification problem. Loosely speaking, one should
always be aware of the “chicken and egg problem” of choosing a construct and validating it by means
of constructs that were established in the same manner. In order to resolve the former problem and
to ensure causality one has to rely on structural equation approaches.
To deal with the latter, at least one dedicated measurement equation per trait is required
(following the term by Carneiro et al., 2003), that is, a measure that exclusively depends on a particular
trait. At the same time the use of dedicated measures warrants parameter identification. Consider
a psychometric task. Even if one controls for situational determinants, identification is restricted to
tuples of traits without dedicated measures. In case of low-order constructs and respective real world
outcomes this reasoning is easier to achieve. For more general dimensions it requires a more profound
justification in choosing measurement and validation constructs.
4 Determinants and Dynamics of Personality Traits
Arguably, only those components that are sufficiently stable across situations, that is personality traits
and cognitive abilities, can be construed as skills in the sense of the human capital literature.
With this subtle notion about the complexity of personality at hand, the remaining questions
with particular relevance for policy recommendation are (1) what determines the formation of the
personality traits and (2) to what extent are they influenced by the environment. In the following
we will present a theoretical approach known as the Technology of Skill Formation (see Cunha and
Heckman, 2007) along with a brief overview on the underlying empirical literature.
Similar to the Roberts model of thoughts and behavior in an environmental context, the inter-
actional pattern between personality traits and IQ has to be considered for the formation process.25
25 As mentioned in the previous section, cognitive capabilities can have an impact on faking behavior in respondingto a personality test. Vice versa, IQ tests never exactly measure pure cognitive intelligence. The results also can
11

Cunha et al. (2006) refer to a range of intervention studies which capture different periods of childhood
and adolescence. The respective results are summarized in Table 2. Most of the data sets used in the
empirical studies cover childhood and adolescence retrospectively and only provide measures of cogni-
tive abilities and scholastic achievement. Fortunately, there is a strong consensus in the literature that
IQ largely stabilizes before schooling age. If scholastic achievements are an outcome of intelligence
and some other abilities and a certain treatment results in a permanent shift in achievements but not
in IQ, then there are other, presumably noncognitive, skills that are affected by the treatment.
< Include Table 2 about here >
Although the evaluation of interventions providing such kind of treatment does only provide
implicit evidence for the formation of noncognitive skills, Cunha et al. (2006) reveal a clear for-
mation pattern involving two important features: self-productivity and dynamic complementarity.
Self-productivity postulates that skills acquired at one stage enhance the formation of skills at later
stages. Dynamic complementarity captures that a higher level of skills at an earlier stage enhances
the productivity of investments in the ensuing stages and that early investments should be followed
by later ones. As a consequence, the early childhood constitutes a bottleneck period for investments
in the formation process.
Evidence for this pattern is provided by research from various disciplines. In neurobiology
the existence of such critical periods is attributed to a superior susceptibility of neural circuits and
brain architecture in early lifetime (see Knudsen, 2004, Knudsen et al., 2006). Studies from clinical
psychology draw the same inference. For instance O’Connor et al. (2000) assess cognitive abilities
among a group of Romanian orphans who were adopted into UK families between 1990 and 1992
and compare them at ages four and six to adopted children from within the UK. As opposed to
the Romanian orphans, the UK orphans were all placed into their new families before the age of six
months. Their findings suggest that early deprived children never catch up. In case of personality
traits the time period of malleability is longer. Intervention studies aiming at children in school age
usually report gains in behavioral measures. As the findings of Table 2 illustrate, even interventions at
primary school age boost scholastic performance in a lasting manner without permanently raising IQ.
By the arguments above, these findings provide implicit evidence on the susceptibility of personality
beyond early childhood. This is in line with the literature in pediatric psychiatry (see, e.g., Dahl,
2004) highlighting the role of the prefrontal cortex in governing emotion and self-regulation and its
malleability up into the early twenties of life. There is evidence for an even more extensive period of
plasticity. For instance, Roberts and Delvecchio (2000) in a meta-analysis show that the rank-order of
the Big Five factors stabilizes beyond adolescence, but there are still moderate changes until age 50.
reflect motivational and thus aspects of personality traits.
12
Roberts et al. (2006) show the highest mean-level change to be concentrated on young adulthood. The
authors suggest that these changes are induced by persistent shifts in social roles and role expectations
common to most individuals. Given the discussion on the accuracy of the Big Five to measure pure
traits in the previous section, these findings seem reasonable. A social role is a situational factor that
determines measured traits. As long as there are changes in social roles over the life course, it is
tempting to interpret them as instability in actual traits.26
The assumption of complementarity across stages is in line with the following empirical picture.
Table 2 shows that early interventions which involve a long-term follow-up are most successful. How-
ever, most of the gains fade out if no further efforts are made. Vice versa, sole remediation attempts
in adolescence exhibit only weak effects.27 However, the efficiency of interventions in adolescence is
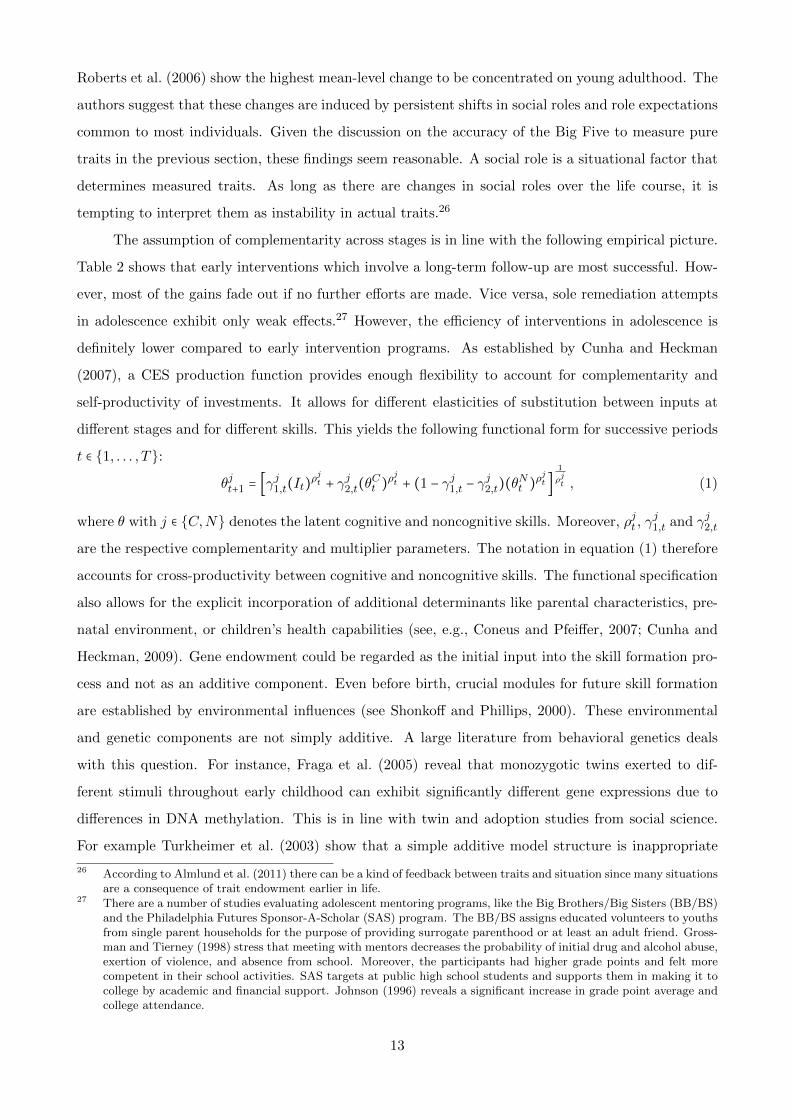
definitely lower compared to early intervention programs. As established by Cunha and Heckman
(2007), a CES production function provides enough flexibility to account for complementarity and
self-productivity of investments. It allows for different elasticities of substitution between inputs at
different stages and for different skills. This yields the following functional form for successive periods
t ∈ {1, . . . , T}:
θjt+1 = [γj1,t(It)ρjt + γj2,t(θ
Ct )ρ
jt + (1 − γj1,t − γ
j2,t)(θ
Nt )ρ
jt ]
1
ρjt , (1)
where θ with j ∈ {C,N} denotes the latent cognitive and noncognitive skills. Moreover, ρjt , γj1,t and γj2,t
are the respective complementarity and multiplier parameters. The notation in equation (1) therefore
accounts for cross-productivity between cognitive and noncognitive skills. The functional specification
also allows for the explicit incorporation of additional determinants like parental characteristics, pre-
natal environment, or children’s health capabilities (see, e.g., Coneus and Pfeiffer, 2007; Cunha and
Heckman, 2009). Gene endowment could be regarded as the initial input into the skill formation pro-
cess and not as an additive component. Even before birth, crucial modules for future skill formation
are established by environmental influences (see Shonkoff and Phillips, 2000). These environmental
and genetic components are not simply additive. A large literature from behavioral genetics deals
with this question. For instance, Fraga et al. (2005) reveal that monozygotic twins exerted to dif-
ferent stimuli throughout early childhood can exhibit significantly different gene expressions due to
differences in DNA methylation. This is in line with twin and adoption studies from social science.
For example Turkheimer et al. (2003) show that a simple additive model structure is inappropriate
26 According to Almlund et al. (2011) there can be a kind of feedback between traits and situation since many situationsare a consequence of trait endowment earlier in life.
27 There are a number of studies evaluating adolescent mentoring programs, like the Big Brothers/Big Sisters (BB/BS)and the Philadelphia Futures Sponsor-A-Scholar (SAS) program. The BB/BS assigns educated volunteers to youthsfrom single parent households for the purpose of providing surrogate parenthood or at least an adult friend. Gross-man and Tierney (1998) stress that meeting with mentors decreases the probability of initial drug and alcohol abuse,exertion of violence, and absence from school. Moreover, the participants had higher grade points and felt morecompetent in their school activities. SAS targets at public high school students and supports them in making it tocollege by academic and financial support. Johnson (1996) reveals a significant increase in grade point average andcollege attendance.
13

to capture the complexity of the IQ generating process and that there are substantial interactions of
genes and environment. The fact that most empirical results from adoption studies promote genetical
factors as the main driving force of skill formation is due to the low share of low income families from
adverse environments in these samples. Personality and behavioral patterns also have a genetic and
an environmental component (see Bouchard and Loehlin, 2001) and the same pattern applies. For
instance, Caspi et al. (2002) reveal this relationship for psycho-pathologic phenomena like antisocial
behavior.28
When adulthood is attained in period T + 1, the disposable stock of human capital can be
regarded as the outcome of the acquired cognitive and noncognitive skills developed up to T in a
specification as in equation (1). Cunha and Heckman (2006) present estimates of the parameters of
equation (1) and directly quantify the degrees of self-productivity and complementarity. The data they
use comprise measures of cognitive ability, temperament, motor and social development, behavioral
problems, and self-confidence of the children and of their home environment. The results yield strong
evidence for self-productivity within the production of the respective skill types.29 The cross-effects
are weaker. Complementarity is evident for both, cognitive and noncognitive stocks, but somewhat
higher in case of the former. The average parameter estimate is slightly below zero which indicates
that the production technology could be approximated well by a Cobb-Douglas function. Slightly
altered estimation strategies yielding similar results are provided by Cunha and Heckman (2008) and
Cunha et al. (2010).
The estimation approaches used to quantify the parameter values in equation (1) yield factor
loadings that represent the roles played by different environmental resources in the skill formation
process. According to these results, indicators that relate to cultural and educational involvement,
like having special lessons or going to the theater, are of particular importance. Family income
however is less important. As Currie (2009) suggests, parents obtaining higher labor market returns
may invest less time in children and are only partially able to compensate this neglect by provision
of substituting goods. The properties of the skill formation discussed above, suggest that schooling,
in particular post-primary schooling, is a minor determinant compared to investments outside school.
The major foundation is already set in preschool age. Additional data constraints even bolster these
effects. As discussed by Todd and Wolpin (2007) in context of education production functions it
is generally difficult to find data that combine rich information on schooling and home resources.
Moreover, there is always less variation in more aggregated indicators for schooling resources. This
could lead to additional attenuation of the estimated effects.
28 A further discussion including additional empirical evidence is given in Heckman (2008) and Cunha and Heckman(2009).
29 The identification strategy is in spirit of the factor structure models discussed in section 7. It allows for endogenouschoice variables and measurement error in indicators.
14

5 Personality Traits and Economic Preference Parameters
It is clearly intuitive to assume a relationship between the expressions of cognitive and noncognitive
skills and economic preference parameters. For instance, the patience of an individual is arguably
related to his or her time preference. As Borghans et al. (2008a) summarize, from an economic point
of view it is meaningful to relate personality concepts to common parameters like time-preference, risk-
preference, and leisure-preference, but also to the more recently studied concepts of social preferences
like altruism and reciprocity (Fehr and Gachter, 2000). Relating traits and preference parameters in
a causal way requires a notion of the underlying theory. Due to the complexity of human thoughts
and behavior, such a theory is difficult to establish. Even without consideration of traits, finding a
functional form for a utility function that accounts for all facets of social preferences observed in the
lab is tedious (see Fehr and Schmidt, 2006, for a discussion). Following Almlund et al. (2011) and
their various model suggestions, from an economic point of view personality traits can be construed
as preferences as well as constraints. Formally, a utility maximizing agent under uncertainty could be
characterized by the following implicit representation:
E [U(x,Pθ,e, e∣ψθ)∣Iθ] s.t. I + r′Pθ,e = x′w and ∑ e = e (2)
All variables with θ as a subscript constitute a possible pathway of influence of traits on the
economic representation of an agent’s response function. E [U(⋅)∣Iθ] is the expected utility for the
arguments x, P (⋅), and e given the information set I which in turn depends on traits. All arguments
are vectors: x is a vector of consumption goods and e is the vector of effort devoted to all possible tasks
and the sum of its elements cannot exceed e.30 Since effort can cause a kind of “good feeling” after
endeavor, it also enters the utility function directly. In addition, it is a complement for the vector of
available traits θ in the vector function for productivity P (θ, e), which maps θ and e into outcomes for
all possible tasks. P (⋅) is the intangible pathway of productivity into utility, whereas the tangible one
is through consumption goods. The goods with price vector w are funded by income not depending on
productivity for tasks I and the income from performing tasks for task-specific rewards r. Traits can
also be a constraint in another sense than in equation (2). Dohmen et al. (2007) discuss the potential
for confounding due to observational equivalence of differences in actual preferences and differences
in capabilities required to perform the task that is used to measure the preferences. In terms of
equation (2) this means it is difficult to disentangle ψ and I. As an example, consider the degree of
numeracy that affects the comprehension of an investment decision used to assess time preference.
Borghans et al. (2008b) examine potential links between noncognitive traits and responsive-
ness for incentives in answering cognitive tests using primary data for a sample of Dutch students.
30 Think of effort as a representation of the situational parameters discussed in the psychologic literature above.
15
The responsiveness is captured by common economic preference parameters. They find a negative
correlation between the Internal Locus of Control and the personal discount-rate and similarly a cor-
relation between emotional stability and risk-preference. Both appeal intuitively plausible. Dohmen
et al. (2008) use data from the German Socioeconomic Panel (SOEP) to reveal possible relationships
between Big Five personality traits, measures of reciprocity, and trust. All Big Five factors exert
significant positive influence on positive reciprocity, especially conscientiousness and agreeableness.
Moreover, neuroticism promotes trust and negative reciprocity.
Given the complexity described above, studies which rely on correlations between skills and
economic preference parameters provide only vague and sometimes inconclusive evidence. Generally,
questionnaire assessments of preference parameters are likely to suffer from a number of potential
problems. The observed preferences are either simply stated, i.e., on hypothetical items, or if revealed,
only within a non-market setting. Yet, it is ambiguous whether preferences for artificial and real
market settings are identical (see Kirby, 1997, and Madden et al., 2003, for two opposing views). If an
experimental assessment embodies real rewards, choosing the respective payoffs binds the participant
to maintain his or her choice. In a real life setting, however, the individual also has to withstand other
opportunities, and there may be a higher degree of uncertainty for future payoffs. It proves difficult to
partial out time preference from risk-aversion (see Borghans et al., 2008a, and the literature they refer
to). Moreover, measures of time preference may be subject to framing effects. Non-linearities with
respect to the payoffs are also likely and limit the external validity of experimental findings. There
are numerous other inconsistencies which indicate the premature status of this research field.31
6 Direct and Indirect Outcomes of Personality Traits
Until recently, noncognitive skills have not played an important role in explaining labor market out-
comes. Bowles et al. (2001) argue that early explanations of wage differentials like disequilibrium rents
(Schumpeter, 1934) and incentive effects (Coase, 1937) can be explained in light of personality traits.
In the sense of these models, the respective traits are construed as not being productivity enhancing.
They stress that it is important to distinguish different scopes of the labor market. Two illustrative
examples demonstrate this: in a working environment where monitoring is difficult, behavioral traits
like truth telling may be higher rewarded than in other cases. Considering a low-skill labor market,
docility, dependability, and persistence may be highly rewarded, whereas self-direction may generate
higher earnings for someone who is a white collar worker. Besides different rewards in different occu-
pation segments of the labor market, people also opt in these occupations owing to personality (see
Antecol and Cobb-Clark, 2010). Heinicke and Thomsen (2011) show that returns to noncognitive skills
31 For further discussio see Almlund et al. (2011).
16

within occupational groups provide a mixed signal due to group-specific returns and self-selection.
It is difficult to determine if certain traits increase wages by affecting occupational choice, pro-
ductivity, or if market mechanisms additionally induce wage premiums for certain traits. On a more
general level Borghans et al. (2008c) show that supply and demand for workers more or less endowed
with directness relative to caring create a wage premium for directness. Another explanation is that
the society solidifies certain expectations about appropriate traits and behavior, and rewards or pun-
ishes individuals who deviate from them in either direction. This interpretation is fostered by the
results of Mueller and Plug (2006) for the gender wage gap in the US. They show that particularly
men obtain a wage penalty for Big Five agreeableness, a trait stronger associated with women.
Our aim in what follows is to give a very short review of empirical studies dealing with predictive
power of noncognitive skills. Tables 3 and 4 provide characteristics of a selection of studies but are
far from comprehensive. Borghans et al. (2008a) and Almlund et al. (2011) give a more widespread
overview of empirical evidence, including the literature from other disciplines.
< Include Tables 3 and 4 about here >
Irrespective of how the traits are valued in the market, noncognitive skills explain differences
in the earnings structure well. Heckman et al. (2006) provide empirical evidence on the effects of
noncognitve skills constituted by self-control and self-esteem on log hourly wages. Especially for the
lower deciles of the distribution of latent skills a strong influence is revealed. Flossmann et al. (2007)
reproduce these results for German data.
< Include Figure 1 about here >
Figure 1 compares the net effects of an increase in noncognitive abilities on log wages obtained
in the two studies. Particularly for the upper and lower deciles of the distribution the marginal effect
of an increase in noncognitive skills is higher. Both results provide an important indication on how
personality traits affect earnings.
Noncognitive (and cognitive) abilities do not solely affect wages, but educational outcomes as
well. Presumably, the major effects of abilities on wages are mediated through the endogenous school-
ing choice (see Piatek and Pinger, 2010). The structural approach pursued by Heckman et al. (2006)
and Flossmann et al. (2006) accounts for this issue. Besides wages in general Heckman et al. (2006)
also assess the effects of cognitive and noncognitive abilities on wages given certain levels of schooling
and on the probability of graduating at certain levels. For instance, for males, noncognitive skills
hardly affect the probability of being a regular high school dropout but rather promote the probabili-
ties of being a GED32 participant, of graduating from high school, of graduating from a two year, and
32 GED stands for General Educational Development and is a test that certifies college eligibility of US high schoolgraduates.
17
from a four year college.
Hence, it is of particular interest to identify which traits affect educational performance and
along with it schooling choices. Duckworth and Seligman (2005) show that self-discipline even exceeds
the explanatory power of IQ in predicting performance at school. They define self-discipline as a
hybrid of impulsiveness and self-control. Highly self-disciplined adolescents outperform their peers on
all inquired outcomes including average grades, achievement-test scores, and school attendance.
The choice of self-discipline as the noncognitive skill of interest is related to the findings by
Wolfe and Johnson (1995). They assess which measure is most eligible for predicting grade point
averages (GPA) in a sample of 201 psychology students. The outstanding GPA predictors are measures
displaying the level of control and items closely related, like self-discipline. Thus, besides cognitive
skills, noncognitive skills play an equally important role in affecting schooling choices or years of
schooling, respectively.
Since personality is malleable throughout adolescence and IQ is fairly set earlier in life, the
inverse causation also applies. This induces the aforementioned simultaneity. Hansen et al. (2003)
determine causal effects of schooling on achievement tests. They reveal that an additional year of
schooling increases the Armed Forces Qualification Test (AFQT) score by 3 to 4 points. Achievement
tests provide a mixed signal constituted of IQ and personality traits (see Borghans et al., 2011), where
IQ is relatively stable from school age on.
Noncognitive abilities also exhibit an intense influence on social outcomes. Closely related to
the previously discussed wage achievements are employment status and mean work experience which
are likewise substantially affected by the personality.33 Further outcomes like the probabilities of
daily smoking, of incarceration, and of drug abuse are examined and are significantly determined by
noncognitive skills, albeit to different extents.
7 A Brief Guide to Empirical Analysis
This section intends to give a brief overview on the eligibility of different estimation strategies to
deal with the specifics of personality test scores. The previous sections on formation of personality
traits and measurement suggest various sources for simultaneity and measurement error. Therefore,
one has to scrutinize the data generating process very carefully before using measures obtained from
test scores for empirical analysis. There are occasions when measured traits are employed as an
outcome variable, usually program evaluation or longitudinal settings, which aim at examining the
role of environmental influences on the formation processes. As discussed by Cunha and Heckman
(2008), the multiplicity and endogeneity of investments that foster the development of personality
33 See also Heckman et al. (2006) for a detailed discussion and magnitudes.
18

traits causes a lack of instruments. To overcome the resultant econometric problems one needs proper
randomization of investments or structural approaches in the spirit of those employed to generate the
results referred to in section 4. Most research questions dealing with noncognitive skills and their
relation to human capital outcomes, however, incorporate them as explanatory variables. In this
case the threat to parameter consistency of standard regression approaches is more severe. Again,
instrumental variable methods are a self-evident response to various kinds of endogeneity problems,
but as with the endogeneity of investments in the formation process, it is difficult to find a sufficient
number.34 As an alternative eluding both problems, one can try to correct standard estimates and
avoid settings with obvious simultaneity, or one can use latent variable approaches imposing some
additional structure.35 Below, we will elaborate on both approaches.
7.1 Adjusted Regression
The virtue of measurement error correction, as opposed to all approaches presented in what follows,
is its simplicity. When it comes to more complex structures, including simultaneity, factor approaches
are more due. The simplicity of estimation comes at another cost: relatively precise information about
the magnitude of measurement error, i.e. reliability, is required. Such a source of information can be
reliability measures from classical test theory, which, however, impose very strong assumptions on the
relation between true and measured score. For instance, Cronbach’s alpha requires scaling parameters
(or slope parameters in regression terms) between measured and true score to be equal across items
in order to yield a consistent reliability estimate (see Bollen, 1989, for discussion). For most measures
this assumption does not hold and reliability is therefore underestimated. Nonetheless, given a decent
estimate of the share of measurement error in overall variation of the item sum, it is straightforward
to adjust least square estimates by weighting the variation in the erroneous explanatory variables.36
Unfortunately, accounting for simultaneity still requires proper instruments in this set up. To resolve
this problem structural approaches with latent variables are more common.
34 In conjecture with the problem of attaining the just-identified case, the existence of weak instruments entails furthercomplications.
35 We follow the definition of Aigner et al. (1984) for latent variables. According to their definition, as opposed tounobserved variables, latent variables cannot be represented as a linear combination of observed variables.
36 In the univariate case one would simply use
βA = ∑ni=1(xi − x)(yi − y)∑ni=1(xi − x)2 − nV ar(error) .
Using an arbitrary coefficient of reliability ρ this expression can also be written as
βA = ∑ni=1(xi − x)(yi − y)ρ∑ni=1(xi − x)2
.
The multivariate case is derived by Schneeweiss (1976) among others.
19

7.2 Methods based on Factor Analysis
Latent variable models are a generalization of error-in-measurement (EIV) models in that in either
case the observed personality score is a manifestation of the latent true score (see Aigner et al., 1984).
However, the aim of the EIV literature is somewhat different. It primarily intends to obtain consistent
estimates when some explanatory variables are erroneous. In contrast, latent variable approaches
also aim at estimation of parameters that represent the relationship between latent factors and ob-
served response variables.37 Most common in estimation are different kinds of maximum likelihood
approaches. Parameters which designate the model are referred to as structural parameters, whereas
those parameters which vary over observation (like individual latent skills) are denoted incidental
parameters.
In EIV models it is common to maximize the conditional likelihoods iteratively or to integrate
out the latent factor to obtain a closed form expression. In case of the former, simultaneous ML
estimation of structural and incidental parameters can cause severe consistency problems (see Neyman
and Scott, 1948).38 In case of maximizing the marginal likelihood one has to impose mostly overly
restrictive distributional assumptions on the latent factors (see Heckman et al., 2006). However, both
approaches provide no inference about the latent factors.
In order to overcome this, traditional factor analysis uses other estimation strategies. Given
some identification restrictions on the latent factors and their factor loadings (see, e.g, Joreskog, 1977,
and Aigner et al., 1984, for discussion) latent factor structure models can identify both, structural and
incidental parameters.39 Moreover, depending on the number of latent factors, a sufficient number
of measurement equations and some knowledge about the structure between the latent factors and
other observables is required.40 The LISREL approach by Joreskog (1977) estimates the parameters
of the complete model by minimizing the discrepancy between the sample correlation matrix and the
correlation matrix imputed by the model. This can be attained by different estimation techniques
such as maximum likelihood or least squares (see Bollen, 1989, for a comparison of the different
approaches with regard to consistency and efficiency). Generally, the scale for the loadings is set
by standardizing all observables in the system. Hence, the estimates are only interpretable to a
37 To illustrate the close relation, consider the following notations for an erroneous explanatory variable and a simplefactor model with x representing the observed manifestation of a latent factor θ and an unexplained residual ε.
x = λθ + εx = θ + ε
The obvious difference is that factor analysis is interested in identification of both, factor loadings λ and latentfactors θ.
38 Baker and Kim (2004) discuss assumptions for iterative estimation to resolve this problem.39 It is common in standard factor analysis to assume uncorrelated factors. However, there are infinite combinations of
factors and loadings that are in a sense observationally equivalent. The standard approach to warrant identifcationis to fix the variances of the common factors to unity and to impose sign restrictions on the factors.
40 This number can be reduced if the underlying theory justifies to fix some parameters or to introduce identitiesamong parameters.
20

limited extent. One possible way to overcome this limitation is to simulate the model with different
specifications of standardized observables and latent factors (see Piatek and Pinger, 2010). A more
severe problem in classical factor structure models, however, is the strong distributional dependence
of the results. Tractability of the discrepancy function even requires normality assumption for the
observables. If these assumptions are not valid for the population, the estimates are inconsistent.41
Another drawback is that classical factor structure models require linear responses in measurements
and outcome equations. The critical assumption for this functional form to apply is that the responses
are linear in latent traits, which is very restrictive. The restrictiveness increases as the item scales get
smaller.
Carneiro et al. (2003) discuss identification assumptions of more general types of factor struc-
ture models accounting for multiple factors and different types of link functions for the response
variables. They show how identification of the factor loadings can be established by exploiting co-
variance structures in conjecture with some additional restrictions. Identification is eased by using
dedicated measures, that is, a response variable per latent factor that is only determined by this
particular factor. This step even allows for dropping the independence assumption between factors.42
Carneiro et al. (2003) solve the problem of switching signs causing observationally equivalent struc-
tures of factors and loadings by normalizing a particular factor loading in the measurement system to
unity. Given a subtle choice of this normalization one can anchor the estimated parameters into ap-
propriate real world outcomes (see, e.g., Cunha and Heckman, 2008) and thus assign an interpretable
metric to them. These, along with some further independence and support conditions discussed by
Carneiro et al. (2003), finally establish identification of the factor model. When choosing a measure-
ment construct one should always consider that increasing the dimensionality dramatically raises the
required number of measurement equations. Therefore, some careful exploratory analysis should be
conducted in advance.
Extensions of discrepancy function estimation described above for ordered discrete response
variables are available (see Joreskog and Moustaki, 2001, for an overview). However, these meth-
ods become more intricate as the number of factors and, therefore, the number of discrete response
equations increases. The same holds for most of the suitable frequentist approaches like Expecta-
tion Maximization (EM, Dempster et al., 1977) or Maximum Simulated Likelihood (MSL, Gourieroux
and Monfort, 1991). More flexible approaches drawing on Bayesian techniques, particularly Markov
Chain Monte Carlo methods (MCMC), have evolved in the last years due to progress in computational
speed.43 The most convenient properties for estimation of factor structure models for latent abilities
41 As shown by Heckman et al. (2006), the distributions of latent cognitive and noncognitive skills are non-normal.42 In common factor analysis this factor rotation problem prohibits identification without additional assumptions.43 Bayesian estimation builds on the notion to enhance the imposed assumptions on the data generation process
(which is the likelihood in common reading) by prior beliefs about the parameter distribution. Applying Bayes’Theorem yields a posterior distribution that unifies the assumptions made on the data generating process and the
21

has the Gibbs sampler (Geman and Geman, 1984) and its extension due to Tanner and Wong (1987),
the so-called Data Augmentation (see also van Dyk and Meng, 2001). It uses a simple contrivance for
ease of computation. Instead of relying on the posterior of the parameters conditional on observable
responses, latent responses, and latent factors for estimation, it explicitly models the posterior for
parameters and latent elements conditional on observed data. This is achieved by integrating over the
product of the latent factors, latent responses and the initial posterior conditional on both. Since it is
only a reformulation, the marginal distributions implied by the augmented distribution have to coin-
cide with the original posterior. The procedure is a two step version of the Gibbs sampler. First, the
latent components are drawn from their distributions conditional on data and parameters within the
so-called imputation step and then draws for the parameters conditional on those from the imputation
step are conducted in a posterior step. The algorithm cycles between imputation and posterior step
until convergence.44 A very precise summary for practitioners along with some refinements is provided
by Piatek (2010).
Given covariance structures, only the first two moments of the distributions of latent factors
can be identified and therefore is not sufficient for relaxation of normality assumptions. Carneiro et
al. (2003) show conditions under which the complete distribution of a latent factor is nonparametrically
identified.45 The imputation step can then be sampled from a mixture of normals which provides
enough flexibility to approximate any other distribution (see Diebolt and Robert, 1984).46 Another
virtue of the Data Augmentation Algorithm is that the sampled results for the individual latent factors
can be stored after convergence. For a better illustration and interpretation of the results it is common
to use them to simulate the outcomes of interest for different percentile ranges of the latent factors
and, for instance, the mean of the observable variables (see Piatek and Pinger, 2010). This yields a
graphical representation of the results as shown in Figure 1.
unconditional parameter distribution (a comprehensive introduction to the topic is provided by Geweke, 2005).Formally, this implies
p(Θ∣data) = f(data∣Θ)f(Θ)f(data) ∝ L(data∣Θ)f(Θ),
where Θ is a set of parameters, p(Θ∣data) is the posterior, L(data∣Θ) is the data generating process or the Likelihood,and f(Θ) is the imposed prior distribution of the parameters. The outstanding virtue of this approach is its abilityto deal with lacking closed forms. Estimates from the posterior distribution can be obtained in different manners.One possibility is to compute marginal distributions for the parameters of interest by means of numerical or MonteCarlo integration and obtaining the respective moments of the marginal as a spinoff. Another way is to directlysimulate draws from the posterior. Both methods become increasingly complex as the dimensionality of the posteriorrises. This is where MCMC algorithms come into play (Gilks et al., 1996, provide a detailed treatise of the topic).MCMC algorithms sample from chains of conditional distributions more simple in nature than the posterior. Thesimulation finally converges to draws from the joint posterior. The resulting chains fulfil the Markov chain conditionin that transition probabilities between states only depend on the current state and that after a sufficient numberof iterations the probability of being in particular state is independent of the initial state (stationarity).
44 In that sense, Data Augmentation is the Bayesian equivalent to EM algorithm.45 Particularly, the identification requires combinations of continuous and discrete response variables.46 The implementation is also discussed in Piatek (2010).
22
7.3 Item Response Theory
Another strand of the psychometric literature which arose from classical test theory is item response
theory (IRT, see Sijtsma and Junker, 2006, for a historical classification). It traces back to the work of
Lazarsfeld (1950) and Lord (1952). The breakthrough contributions in the psychometric field are by
Lord and Novick (1968) and Samejima (1952). The basic notion that IRT exploits is the probabilistic
relation between latent ability and categorical responses by analyzing the pattern across observations
and items. The most convenient way to illustrate IRT is to consider dichotomous items. If abilities are
positively related to the response, the response probability is usually modeled by means of a normal
or logistic cumulative density function, the so-called item characteristic curve (ICC).47 In terms of the
normal density the mean provides the scale location, which in some sense is the difficulty, whereas the
variance determines the discriminatory power of the item. The extension to polytomous responses is
analogous. The ICC for the lowest response on the scale has an inverted shape, whereas the ICC for
the highest response has the usual CDF form. The scale realizations in between exhibit a decreasing
response probability towards both bounds of the scale and therefore have a bell shape with probability
mass at different locations. A more consistent functional form for estimation is obtained by treating
different permutations as dichotomous and cumulate the ICCs accordingly. For m response categories
this yields m − 1 non-intersecting and monotonic characteristic curves of the usual shape.
The aim is then to estimate the parameters determining the shape of the ICC, i.e., the structural
parameters, and the incidental parameters representing the latent abilities of the assessed individuals.
Given some independence assumptions traditional estimation approaches use an iterative maximum
likelihood procedure cycling between conditional likelihoods for incidental and structural parameters
(see Birnbaum, 1968). As pointed out by Neyman and Scott (1948), simultaneous ML estimation
of structural and incidental parameters can lead to severe inconsistency. Eluding these problem
requires assumptions only valid for models with a discrimination parameter fixed at unity, so-called
Rasch Models (see Andersen, 1972). Enhancements in computational speed have led to more robust
strategies like the Bock and Aitken solution (Bock and Aitken, 1981) which uses EM over numerically
integrated marginal likelihoods.48
The previous techniques, however, impose several parametric assumptions to enforce properties
like monotonicity and non-intersection. There are more flexible contributions from the econometric
literature which rely on semiparametric estimation approaches.49 Conditions for this kind of model to
be feasible are established by Spady (2006) and comprise monotonicity, stochastic dominance and local
47 For the opposite relation the survival function can be used.48 See Baker and Kim (2004) for a discussion of further methods. Common Item Response Models can be formulated
as Generalized Linear Latent and Mixed Models (GLLAMM) and estimated accordingly (see, Rijmen et al., 2003,Rabe-Hesketh et al., 2007, for a detailed treatise).
49 Following the notation of Chen (2007) the applied methods are semi-nonparametric. See also Hardle et al. (2004)and Horowitz (2009) for a comprehensive overview of such techniques.
23
independence assumptions (i.e. independence of item responses conditional on the latent attitude).
Suggestions for the implementation of potential estimation procedures are provided by Spady (2007)
and Weiss (2010).50 The basic notion is to exploit the joint empirical distribution of item responses to
obtain the item characteristic curves.51 As opposed to the fully parametric IRT approaches discussed
above, the semiparametric version only imposes a specific distribution for the latent trait conditional on
background information and approximates the response functions nonparametrically. The most direct
way is to use a Sieve Maximum Likelihood strategy established by Grenander (1981).52 Alternatively,
the response functions can be approximated via an Exponential Tilting procedure (see Barron and
Sheu, 1991).53 Given a set of items the estimates can be used to estimate expected values (or other
moments) of the latent ability location on a continuum like the interval [0,1].54 If an interpretable
scale is chosen the estimated latent ability can be directly employed for further regression analysis.55
8 Concluding Remarks
This paper has reviewed the recent influential literature that considers the role of noncognitive skills
as a determinant of human capital. In addition, a selection of the empirical evidence that highlights
the determinism of crucial achievements and outcomes as a result of these skills has been briefly sum-
marized. Moreover, we have discussed the notion of noncognitive skills in light of the relevant psycho-
logical literature. In terms of measuring noncognitive skills, empirical research in economics strongly
benefits from psychometric concepts, and economists should be aware of the underlying assumptions.
The commonly used approaches to measure personality traits are not completely conclusive. On the
one hand, overall measures tend to be too general in that they veil important variation, whereas on the
50 Conditional independence also implies that background characteristics affect the response probabilities only throughlatent abilities.
51 Formally this means that the observed pattern is assumed to be generated by the following ML setup:
p(r1, r2, . . . , pm∣X) = ∫ p1(r1∣θ)p2(r2∣θ) . . . pm(rm∣θ)f(θ∣X)dθ,
where pi (i = 1, . . . ,m) is the response probability for the ith item, θ is a scalar latent skill, and X is a set ofbackground characteristics.
52 Sieve methods can be extended to other estimators than ML. Without distributional assumptions the parameterspace for the response functions is infinite and maximization of the criterion function is therefore infeasible. TheMethod of Sieves defines a series of approximation spaces in order to reduce dimensionality of the previously infinitedimensional parameter space. For concave optimization problems with finite dimensional linear sieve spaces, thistechnique is also denoted series estimation (see Geman and Hwang, 1982, Barron and Sheu, 1991, and Chen, 2007for technical overview). Appropriate base functions are orthogonal polynomials, trigonometric polynomials andshape-preserving splines, just to mention a few (see Hardle, 1994, and Chen, 2007).
53 The tilting procedure for density approximation is part of the computationally feasible optimization problem of theExponential Tilting estimator discussed by Kitamura and Stutzer (1997) and Imbens et al. (1998).
54 Applying Bayes’ Theorem, the distribution providing the expectations can be computed as follows:
f(θ∣r,X) = f(r, θ∣X)p(r∣X) =
p1(r1∣θ) . . . pm(rm∣θ)f(θ∣X)∫ p1(r1∣θ)p2(r2∣θ) . . . pm(rm∣θ)f(θ∣X)dθ
,
where the numerator uses the distribution imposed on θ conditional on X together with the estimates for the itemresponse functions and the denominator is its integral obtained by numerical integration.
55 See Spady (2007) for simultaneous estimation strategies.
24

other hand, measures of specific personality traits may put the researcher to a hard choice regarding
their adequacy. As shown, psychometric coefficients that assess the eligibility of constructs all have
their own limitations.
With regard to formation and stratification of skills, the role and the timing of educational
and parental investments have been proven to be crucial in the empirical literature. Regardless of the
particular effects, virtually all empirical studies suggest a joint conclusions: early investments are most
crucial, but nonetheless, should be complemented later on. Early neglect, on the other hand, cannot
be compensated in later stages of life without prohibitively high costs. Hence, in terms of support for
low skilled or disadvantaged individuals the focus should be on early preschool age. Given this pattern
for the intertemporal allocation of resources, the role of schooling investments is rather subordinate.
The Cunha-Heckman model formalizes this process by means of a dynamic production function and
also provides parameter estimates. Though the estimation approach accounts for measurement error,
the insights on pattern and transmission of parental investments are far from definite. Attributing
parental traits to preferences like altruism that allow to model the investment behavior of parents into
their children is a complex but desirable aim.
As has been briefly discussed, noncognitive skills are important determinants of several outcomes,
like educational achievement and labor market success. The revealed pattern for different personality
traits are relatively unequivocal across studies. However, yet it is mostly unclear in how far the
compound of productivity enhancement, occupational sorting, wage premia due to social desirability,
and self-selection affects the results.
Personality measures applied within an econometric framework tend to suffer from measurement
error, simultaneity bias, and spurious influences by other unobservables. Due to these issues, the
relation between personality traits and economic preference parameters is still patchwork and leaves
many unanswered questions. Drawing inference on correlations between traits and preferences is
a necessary first step but provides only cursory results. A better theoretical understanding of the
pathways between both concepts is inevitable in order to obtain more conclusive insights. As a
consequence, empirical analysis urges adequate methods. The literature reviewed in Section 7 has
given an introductory glance on appropriate factor analytic methods and those based on Item Response
Theory.
The summarized findings of this very recent literature enrich the traditional view on human
capital in economics by considering noncognitive skills as an additional determinant of lifetime labor
market and social outcomes. Moreover, the essential role of infancy and early childhood in producing
these outcomes is accentuated. This provides new policy implications. First, good parenting is (and
will remain) the major source of educational success; this is only indirectly driven by family income.
Therefore, intervention policies should be adopted already at preschool age and should primarily focus
25

on home environment. Second, the time interval for sufficient governmental influence is more limited
in case of cognitive skills than for noncognitive skills. The malleability of personality throughout
adolescence and beyond provides a powerful and instantaneous policy tool. Nonetheless, this is just
a crude guidance originating from an evolving literature. Both, the optimal timing and intensity for
reducing upcoming and existent inequalities remain still to be determined.
References
Aigner, D. J., C. Hsiao, A. Kapteyn, and T. Wansbeek (1984): “Latent Variables Models in
Econometrics,” in Handbook of Econometrics, ed. by Z. Griliches, and M. D. Intriligator, vol. 2,
chap. 23, pp. 1321–1393. Elsevier B.V., Amsterdam, North Holland.
Aiyagari, R., J. Greenwood, and A. Seshadri (2002): “Efficient Investment in Children,” Jour-
nal of Economic Theory, 102(2), 290–321.
Allport, G. W. (1937): Personality: A Psychogical Interpretation. Holt, Rhinehart and Winston,
New York.
(1961): Pattern and Growth in Personality. Holt, Rinehart and Winston, New York, NY.
Allport, G. W., and H. Odbert (1936): “Trait-Names, a Psycholexical Study,” Psychological
Monographs, 47(211).
Almlund, M., A. L. Duckworth, J. Heckman, and T. Kautz (2011): “Personality Psychology
and Economics,” IZA Discussion Papers 5500, Institute for the Study of Labor (IZA), Bonn.
Andersen, E. B. (1972): “The Numerical Solution of a Set of Conditional Estimation Equations,”
Journal of the Royal Statistical Society, Series B, 34(1), 42–54.
Andrews, S. R., J. B. Blumenthal, D. L. Johnson, C. J. Ferguson, T. M. Lasater, P. E.
Malone, and D. B. Wallace (1982): “The Skills of Mothering: A Study of Parent Child Devel-
opment Centers,” Monographs of the Society for Research in Child Development, 47(6), 1–83.
Antecol, H., and D. A. Cobb-Clark (2010): “Do Non-Cognitive Skills Help Explain the Occu-
pational Segregation of Young People?,” IZA Discussion Paper Series 5093, Institute for the Study
of Labor (IZA), Bonn.
Baker, F. B., and S.-H. Kim (2004): Item Response Theory. Dekker Media, New York.
Bandura, A. (1986): Social Foundations of Thought and Action: A Social Cognitive Theory. Prentice
Hall, New Jersey.
26
Barron, A. R., and C.-H. Sheu (1991): “Approximation of Density Functions by Sequences of
Exponential Families,” The Annals of Statistics, 19(3), 1347–1369.
Becker, G., and N. Tomes (1986): “Human Capital and the Rise and Fall of Families,” Journal of
Labor Economics, 75(4), 1–39.
Becker, G. S. (1964): Human Capital: A Theoretical and Empirical Analysis, with Special Reference
to Education, The University of Chicago Press. National Bureau of Economic Research, New York,
Third Edition from 1993.
Ben-Porath, Y. (1967): “The Production of Human Capital and the Life Cycle of Earnings,” The
Journal of Political Economy, 75(4), 352–365.
Birnbaum, A. (1968): “Some Latent Trait Models and their Use in Infering an Exmaminee’s Ability,”
in Statistical Theories of Mental Test Scores, ed. by F. M. Lord, and M. R. Novick, pp. 397–479.
Addison-Wesley, Reading, MA.
Blackburn, M., and D. Neumark (1992): “Unobserved Ability, Efficiency Wages, and Interindus-
try Wage Differentials,” Quarterly Journal of Economics, 107(4), 1421–1436.
Blomeyer, D., K. Coneus, M. Laucht, and F. Pfeiffer (2009): “Initial risk matrix, home
resources, ability development and children’s achievement,” Journal of the European Economic
Association, 7(2-3), 638–648.
Bock, R. R., and M. Aitken (1981): “Marginal Maximum Likelihood Estimation of Item Param-
eters: Application of an EM Algorithm,” Psychometrika, 46(4), 443–459.
Bollen, K. A. (1989): Structural Equations with Latent Variables. John Wiley & Sons, New York,
NY.
Borghan, L., B. H. Goldsteyn, J. Heckman, and J. E. Humphries (2011): “Identification
Proglems in Personality Psychology,” IZA Discussion Paper Series 5605, Institute for the Study of
Labor (IZA), Bonn.
Borghans, L., A. L. Duckworth, J. Heckman, and B. ter Weel (2008a): “The Economics
and Psychology of Personality Traits,” Journal of Human Resources, 43(4), 972–1059.
Borghans, L., H. Meijers, and B. ter Weel (2008b): “The Role of Noncognitive Skills in
Explaining Cognitive Test Scores,” Economic Inquiry, 46(1), 2–12.
Borghans, L., B. ter Weel, and B. A. Weinberg (2008c): “Interpersonal Styles and Labor
Market Outcomes,” Journal of Human Resources, 43(4), 815–858.
27
Bouchard, T. J., and J. C. Loehlin (2001): “Genes, Evolution, and Personality,” Behavior Ge-
netics, 31(3), 243–273.
Bound, J., Z. Griliches, and B. H. Hall (1986): “Wages, Schooling and IQ of Brothers and
Sisters: Do the Family Factors Differ?,” International Economic Review, 27(1), 77–105.
Bowles, S., H. Gintis, and M. Osborne (2001): “The Determinants of Earnings: A Behavioral
Approach,” Journal of Economic Literature, 38(4), 1137–1176.
Braakmann, N. (2009): “The Role of Psychological Traits for the Gender Gap in Full-Time Em-
ployment and Wages: Evidence from Germany,” DIW Discussion Papers 162, German Institute for
Economic Research (DIW), Berlin.
Buss, A. H., and R. Plomin (1975): A Temperament Theory of Personality Development. John
Wiley & Sons, New York.
Campbell, D. T., and D. W. Fiske (1959): “Convergent and Discriminant Validation by the
Multitrait-Multimethod Matrix,” Psychological Bulletin, 56(2), 81–105.
Campbell, F. A., and C. T. Ramey (1994): “Effects of Early Intervention on Intellectual and
Academic Achievement: A Follow-Up Study of Children from Low-Income Families,” Child Devel-
opment, 65, 684–698.
Canli, T. (2006): Biology of Personality and Individual Differences. Guilford Press, New York.
Carneiro, P., C. Crawford, and A. Goodman (2007): “The Impact of Early Cognitive and
Non-Cognitive Skills on Later Outcomes,” CEE Discussion Papers 0092, Centre for the Economics
of Education at the London School of Economics (CEE), London.
Carneiro, P., K. Hansen, and J. Heckman (2003): “Estimating Distributions of the Treatment
Effects with an Application to the Returns to Schooling and Measurement of the Effects of Uncer-
tainty on College Choice,” International Economic Review, 44(2), 361–421.
Caspi, A. (2000): “The Child Is Father of the Man: Personality Continuities From Childhood to
Adulthood,” Journal of Child Psychology and Psychiatry, 78(1), 158–172.
Caspi, A., J. McClay, T. E. Moffitt, J. Mill, J. Martin, I. W. Craig, A. Taylor, and
R. Poulton (2002): “Role of Genotype in Cycle of Violence Maltreated Children,” Science, 297,
851–853.
Caspi, A., B. W. Roberts, and R. L. Shiner (2005): “Personality Development - Stability and
Change,” Annual Review of Psychology, 56(1), 453–484.
28
Cattell, R. (1971): Abilities: Their Structure, Growth and Action. Houghton Mifflin, Boston.
Chen, X. (2007): “Large Sample Sieve Estimation of Semi-Nonparametric Models,” in Handbook of
Econometrics, ed. by J. J. Heckman, and E. E. Leamer, vol. 6B, chap. 76, pp. 5549–5632. Elsevier
B.V., Amsterdam, North Holland.
Coase, R. H. (1937): “The Nature of the Firm,” Economica, 4(16), 386–405.
Coleman, M., and T. DeLeire (2003): “An Economic Model of Locus of Control and the Human
Capital Investment Decision,” Journal of Human Resources, 38(3), 701–721.
Coneus, K., J. Gernandt, and M. Saam (2009): “Noncognitive Skills, School Achievments and
Educational Dropout,” ZEW Discussion Paper 19, Centre for European Economic Research (ZEW),
Mannheim.
Coneus, K., and M. Laucht (2008): “The Effect of Early Noncognitive Skills on Social Outcomes
in Adolescence,” ZEW Discussion Paper 115, Centre for European Economic Research (ZEW),
Mannheim.
Coneus, K., and F. Pfeiffer (2007): “Self-Productivity in Early Childhood,” ZEW Discussion
Paper 053, Centre for European Economic Research (ZEW), Mannheim.
Costa, P., and R. McCrae (1992): Revised Neo Personality Inventory (NEO PI-R) and Neo Five-
Factor (NEO-FFI). Psychological Assessment Resources, Odessa, FL.
Costa, P. T., and R. R. McCrae (2008): “Revised NEO Personality Inventory (NEO PI-R)
and NEO Five-Factor Inventory (NEO-FFI),” in The SAGE Handbook of Personality Theory and
Assessment: Personality Measurement and Testing, ed. by G. J. Boyle, G. Matthews, and D. H.
Saklofske, vol. 2, pp. 179–196. SAGE Publications Ltd., Thousand Oaks, California.
Cronbach, L. J. (1951): “Coefficient Alpha and the Internal Structure of Tests,” Psychometrika,
16(3), 297–334.
Cunha, F., and J. Heckman (2006): “Investing in our Young People,” unpublished, available at
http://www-news.uchicago.edu/releases/06/061115.education.pdf.
(2007): “The Technology of Skill Formation,” American Economic Review, 97(2), 31–47.
(2008): “Formulating, Identifying and Estimating the Technology of Cognitive and Noncog-
nitive Skill Formation,” Journal of Human Resources, 43(4), 738–782.
(2009): “The Economics and Psychology of Inequality and Human Development,” Journal
of the European Economic Association, 7(2/3), 320–364.
29
Cunha, F., J. Heckman, L. Lochner, and D. Masterov (2006): “Interpreting the Evidence on
Life Cycle Skill Formation,” in Handbook of the Economics of Education, ed. by E. A. Hanushek,
and F. Welch, vol. 1, chap. 12, pp. 697–812. Elsevier B.V., Amsterdam, North-Holland.
Cunha, F., J. Heckman, and S. Schennach (2010): “Estimating the Technology of Cognitive and
Noncognitive Skill Formation,” Econometrica, 78(3), 883–991.
Currie, J. (2009): “Healthy, Wealthy, and Wise: Socioeconomic Status, Poor Health in Childhood,
and Human Capital Development,” Journal of Economic Literature, 47(1), 87–122.
Currie, J., and D. Thomas (1995): “Does Head Start Make a Difference?,” American Economic
Review, 85(3), 341–364.
Dahl, R. E. (2004): “Adolescent Brain Development: A Period of Vulnerabilities and Opportunities,”
in Annals of the New York Academy of Sciences 1021, pp. 1–22. New York Academy of Sciences.
Dempster, A. P., N. M. Laird, and D. B. Rubin (1977): “Maximum Likelihood from Incomplete
Data via the EM Algorithm,” Journal of the Royal Statistical Society, Series B, 39(1), 1–38.
Diebolt, J., and C. P. Robert (1984): “Estimation of Finite Mixture Distributions through
Bayesian Sampling,” Journal of the Royal Statistical Society, Serie B, 56(2), 363–375.
Digman, J. M. (1997): “Higher-Order Factors of the Big Five,” Journal of Personality and Social
Psychology, 73(6), 1246–1256.
Dohmen, T., A. Falk, D. Huffman, and U. Sunde (2007): “Are Risk Aversion and Impatience
Related to Cognitive Ability?,” IZA Discussion Papers 2735, Institute for the Study of Labor (IZA),
Bonn.
(2008): “Representative Trust and Reciprocity: Prevalence and Determinants,” Economic
Inquiry, 46(1), 84–90.
Duckworth, A. L., and M. Seligman (2005): “Self-Discipline Outdoes IQ in Predicting Academic
Performance of Adoloscents,” American Psychological Society, 16(12), 939–944.
Duttweiler, P. (1984): “The Internal Control Index: A Newly Developed Measure of Locus of
Control,” Educational and Psychological Measurement, 44(2), 209–221.
Eysenck, H. J. (1991): “Dimensions of Personality: Sixteen, Five or Three? Criteria for a Taxonomic
Paradigm,” Personality and Individual Differences, 8(12), 773–790.
Fehr, E., and S. Gachter (2000): “Fairness and Retaliation: The Economics of Reciprocity,”
Journal of Economic Perspectives, 14(3), 159–181.
30

Fehr, E., and K. M. Schmidt (2006): “The Economics of Fairness, Reciprocity and Altruism -
Experimental Evidence and New Theories,” in Handbook of the Economics of Giving, Altruism and
Reciprocity, ed. by S.-C. Kolm, and J. M. Ythier, vol. 1, pp. 615–699. Elsevier B.V., Amsterdam,
North-Holland.
Flossmann, A., R. Piatek, and L. Wichert (2007): “Going Beyond Returns to Education: The
Role of Noncognitive Skills on Wages in Germany,” unpublished, available at http://www.afse.
fr/docs/congres2007/docs/619716flopiwi.pdf.
Fortin, N. M. (2008): “The Gender Wage Gap among Young Adults in the United States - The
Importance of Money versus People,” Journal of Human Resources, 43(4), 884–918.
Fraga, M., E. Ballestar, M. Paz, S. Ropero, F. Setien, M. Ballestar, D. Heine-Suner,
J. Cigudosa, M. Urioste, J. Benitez, M. Boix-Chornet, A. Sanchez-Aguilera, C. Ling,
E. Carlsson, P. Poulsen, A. Vaag, Z. Stephan, T. Spector, Y.-Z. Wu, C. Plass, and
M. Esteller (2005): “Epigenetic Differences Arise during the Lifetime of Monozygotic Twins,”
Proceedings of the National Academy of Sciences of the United States of America, 102(30), 10604–
10609.
Fuerst, J. S., and D. Fuerst (1993): “Chicago Experience with an Early Childhood Programme:
The Special Case of the Child Parent Center Program,” Educational Research, 35(3), 237–253.
Geman, S., and D. Geman (1984): “Stochastic Relaxation, Gibbs Distributions and the Bayesian
Restoration of Images,” IEEE Transactions on Pattern Analysis and Machine Intelligence, 12(5),
609–628.
Geweke, J. (2005): Contemporary Bayesian Econometrics and Statistics. John Wiley & Sons, New
York, NY.
Gilks, W. R., S. Richardson, and D. Spiegelhalter (1996): Markov Chain Monte Carlo in
Practice. Chapman & Hall, London.
Goldberg, L. (1971): “A Historical Survey of Personality Scales and Inventories,” in Advances in
Psychological Assessment, ed. by P. McReynolds, pp. 293–336. Science and Behavior Books, Palo
Alto, California.
Goldsmith, H. H., A. H. Buss, R. Plomin, M. K. Rothbart, A. Thomas, S. Chess, R. A.
Hinde, and R. B. McCall (1987): “Rounddtable: What is temperament? Four approaches,”
Child Development, 58, 505–529.
31

Gourieroux, C., and A. Monfort (1991): “Simulation Based Inference in Models with Hetero-
geneity,” Annales d’Economie et de Statistique, 20/21, 69–107.
Grenander, U. (1981): Abstract Inference. John Wiley & Sons, New York, NY.
Griliches, Z. (1977): “Estimating the Returns to Schooling: Some Econometric Problems,” Econo-
metrica, 45(1), 1–22.
Grossman, J., and J. Tierney (1998): “Does Mentoring Work? An Impact Study of the Big
Brothers Big Sisters Program,” Evaluation Review, 22(3), 403–426.
Hansen, K., J. Heckman, and K. Mullen (2004): “The Effect of Schooling and Ability on Achieve-
ment Test Scores,” Journal of Econometrics, 121(1/2), 39–98.
Hause, J. C. (1972): “Earnings Profile: Ability and Schooling,” Journal of Political Economy, 80(3,
Part 2), 108–138.
Heckman, J. (2008): “Schools, Skills, and Synapses,” Economic Inquiry, 46(3), 289–324.
Heckman, J., and Y. Rubinstein (2001): “The Importance of Noncognitive Skills: Lessons from
the GED Testing Program,” The American Economic Review, 91(2), 145–149.
Heckman, J., J. Stixrud, and S. Urzua (2006): “The Effects of Cognitive and Noncognitive
Abilities on Labor Market Outcomes and Social Behavior,” Journal of Labor Economics, 24(3),
411–482.
Heineck, G., and S. Anger (2010): “The Returns to Cognitive Abilities and Personality Traits in
Germany,” Labour Economics, 17(3), 535–546.
Heinicke, K., and S. L. Thomsen (2011): “Heterogeneous Returs to Personality - The Role of
Occupational Choice,” Discussion paper, University of Magdeburg, mimeo.
Hill, J. L., J. Brooks-Gunn, and J. Waldfogel (2002): “Sustained Effects of High Participation
in Early Intervention for Low-Birth-Weight Premature Infants,” Developmental Psychology, 39(4),
730–744.
Hopkins, K., and G. Bracht (1975): “Ten-Year Stability of Verbal and Nonverbal IQ Scores,”
American Educational Research Journal, 12(4), 469–477.
Horowitz, J. L. (2009): Semiparametric and Nonparametric Methods in Econometrics. Springer,
Heidelberg.
Hough, L. M. (1992): “The ”Big Five” Personality Variables - Construct Confusion: Description
versus Prediction,” Human Performance, 5(1), 139–155.
32
Hardle, W., M. Muller, A. Werwatz, and S. Sperlich (2004): Nonparametric and Semipara-
metric Models. Springer, Heidelberg.
Imbens, G. W., R. H. Spady, and P. Johnson (1998): “Information Theoretic Approaches to
Inference in Moment Condition Models,” Econometrica, 66(2), 333–357.
Jackson, D. (1976): Jackson Personality Inventory Test Manual. Research Psychologists Press,
Goshen, New York.
Johnson, A. (1996): “An Evaluation of Long-Term Impacts of the Sponsor-a-Scholar Program on
Student Performance,” Mathematica Policy Research Inc.
Johnson, D. L., and T. Walker (1991): “A Follow-up Evaluation of Houston Parent-Child Devel-
opment Center: School Performance,” Journal of Early Intervention, 15(3), 226–236.
Johnson, J. S., and E. L. Newport (1989): “Criticle Period Effects in Second Language Learning:
The Influence of Maturational State on the Acquisition of English as a Second Language,” Cognitive
Psychology, 21, 60–99.
Joreskog, K. (1977): “Structural Equation Models in the Social Sciences: Specification, Estimation
and Testing,” in Applications of Statistics, ed. by P. R. Krishnaih, pp. 265–287. Elsevier B.V.,
Amsterdam, North Holland.
Joreskog, K. G., and I. Moustaki (2001): “Factor Analysis of Ordinal Variables: A Comparison
of Three Approaches,” Multivariate Behavioral Research, 36(3), 347–387.
Kendall, P., and L. Wilcox (1979): “Self-Control in Children: Development of a Rating Scale,”
Journal of Consulting and Clinical Psychology, 47, 1020–1029.
Kirby, K. N. (1997): “Bidding on the Future: Evidence Against Normative Discounting of Delayed
Rewards,” Journal of Experimental Psychology. General, 126(1), 54–70.
Kitamura, Y., and M. Stutzer (1997): “An Information-Theoretic Alternative to Generalized
Methods of Moments Estimation,” Econometrica, 65(4), 861–874.
Knudsen, E. (2004): “Sensitive Periods in the Development of the Brain and Behavior,” Journal of
Cognitive Neuroscience, 16(4), 1412–1425.
Lazarsfeld, P. F. (1950): “The Logical and Mathematical Foundation of Latent Structure Analy-
sis,” in Measurement and Prediction, ed. by S. Stouffer, L. Guttman, E. A. Suchman, P. F. Lazars-
feld, S. A. Stas, and J. A. Clausen, pp. 362–412. Princeton University Press, Princeton, NJ.
33

Leibowitz, A. (1974): “Home Investments in Children,” Journal of Political Economy, 82(2, Part
2), 111–131.
Lord, F. M. (1952): A Theory of Test Scores. Psychometric Monograph Nr. 7, Psychometric Society.
Lord, F. M., and M. R. Novick (1968): Statistical Theories of Mental Test Scores. Addison-Wesley,
Reading, MA.
Madden, G. J., A. M. Begotka, B. R. Raiff, and L. L. Kastern (2003): “Delay Discounting of
Real and Hypothetical Rewards,” Experimental and Clinical Psychopharmacology, 11(2), 139–145.
Mischel, W. (1968): Personality and Assessment. John Wiley & Sons, New York.
(1973): “Toward a Cognitive Social Learning Reconceptualization of Personality,” Psycho-
logical Review, 80(4), 246–268.
Mischel, W., and Y. Shoda (1995): “A Cognitive-Affective System Theory of Personality: Recon-
ceptualizing Situations, Dispositions, Dynamics, and Invariance in Personality Structure,” Psycho-
logical Review, 102(2), 246–268.
Morgeson, F., M. Campion, R. Dipboye, J. Hollenbeck, K. Murphy, and N. Schmitt
(2007): “Reconsidering the use of Personality Tests in Personnel Selection Contexts,” Personal
Psychology, 60, 683–729.
Mueller, G., and E. Plug (2006): “Estimating the Effect of Personality on Male and Female
Earnings,” Industrial and Labor Relations Review, 60(1), 3–22.
Mulaik, S. A. (2010): Foundations of Factor Analysis. CRC Press, Boca Raton, FL.
Murnane, R. J., J. B. Willett, M. J. Braatz, and Y. Duhaldeborde (2000): “Do Different
Dimensions of Male High School Students’ Skills Predict Labor Market Success a Decade Later?
Evidence from the NLSY,” Economics of Education Review, 20(4), 311–320.
Newport, E. (1990): “Maturational Constraints on Language Learning,” Cognitive Science, 14(1),
11–28.
Neyman, J., and E. L. Scott (1948): “Consistent Estimates Based on Partially Consistent Obser-
vations,” Econometrica, 16(1), 1–32.
O’Connor, T. G., M. Rutter, C. Beckett, L. Keaveney, J. M. Kreppner, and the English
and Romanian Adoptees Study Team (2000): “The Effects of Global Severe Privation on
Cognitive Competence: Extension and Longitudinal Follow-Up,” Child Development, 71(2), 376–
390.
34
Orom, H., and D. Cervone (2009): “Personality Dynamics, Meaning, and Idiosyncrasy: Assessing
Personality Architecture and Coherence Idiographically,” Journal of Research in Personality, 43(2),
228–240.
Osborne-Groves, M. (2005): “How Important is your Personality? Labor Market Returns to
Personality for Women in the US and UK,” Journal of Economic Psychology, 26, 827–841.
Pervin, L., D. Cervone, and O. John (2005): Theories of Personality. John Wiley & Sons, New
York, NY.
Piatek, R. (2010): “Bayesian Inference for Factor Structure Models via Gibbs Sampling,” CMS
Discussion Paper 2010-03, Center for Quantitative Methods and Survey Research (CMS), Konstanz.
Piatek, R., and P. Pinger (2010): “Maintaining (Locus of) Control? Assessing the Impact of
Locus of Control on Education Decisions and Wages,” IZA Discussion Paper Series 5289, Institute
for the Study of Labor (IZA), Bonn.
Rabe-Hesketh, S., A. Skrondal, and X. Zheng (2007): “Multilevel Structural Equation Model-
ing,” in Handbook of Computing and Statistics with Applications, ed. by E. Kontoghiorghes, vol. 1,
pp. 209–227. Elsevier B.V., Amsterdam, North Holland.
Rijmen, F., F. Tuerlinckx, P. D. Boeck, and P. Kuppens (2003): “A Nonlinear Mixed Model
Framework for Item Response Theory,” Psychological Methods, 8(2).
Roberts, B., P. Harms, J. Smith, D. Wood, and M. Webb (2006): “Using Multiple Methods in
Personality Psychology,” in Handbook of Multimethod Measurement in Psychology, ed. by M. Eid,
and E. Diener, chap. 22, pp. 321–335. American Psychological Association, Washington, DC.
Roberts, B., N. Kuncel, R. Shiner, A. Caspi, and L. Goldberg (2007): “The Power of
Personality,” Perspectives on Psychological Science, 2(4), 313–345.
Roberts, B., K. Walton, and W. Viechtbauer (2006): “Patterns of Mean-Level Change in
Personality Traits Across the Life Course: A Meta-Analysis of Longitudinal Studies,” Psychological
Bulletin, 132, 1–25.
Roberts, B. W. (2009): “Back to the Future: Personality and Assessment and Personality Develop-
ment,” Journal of Research in Psychology, 43(2), 137–145.
Roberts, B. W., and W. F. Delvecchio (2000): “The rank-order consistency of personality from
childhood to old age: A quantitative review of longitudinal studies,” Psychological Bulletin, 126,
3–25.
35
Rosenberg, M. (1965): Society and the Adolescent Self-Image. Princeton University Press, Princeton,
New Jersey.
Rothbart, M. K. (1981): “Measurement of Temperament in Infancy,” Child Development, 52, 569–
578.
Rothbart, M. K., S. A. Ahadi, and D. E. Adams (2000): “Temperament and Personality: Origins
and Outcomes,” Journal of Personality and Social Psychology, 78(1), 122–135.
Rothbart, M. K., and M. Bates (2006): “Temperament,” in Handbook of Child Psychology Vol.
3 - Social, Emotional and Personality Development, ed. by W. Damon, N. Eisenberg, and R. M.
Lerner, pp. 99–166. John Wiley & Sons, New York.
Rotter, J. (1966): Generalized Expectancies for Internal versus External Control of Reinforcement.
American Psychological Association, Washington, DC.
Salovey, P., M. Brackett, and J. D. Mayer (2004): Emotional Intelligence - Key Readings on
the Mayer and Salovey Model. National Professional Ressources Inc., Port Chester, NY.
Samejima, F. (1952): ”Estimation of Latent Ability Using a Response Pattern of Graded Scores”.
Psychometric Monograph Nr. 17, Psychometric Society.
Schneeweiss, H. (1976): “Consistent Estimation of a Regression with Errors in Variables,” Metrika,
23, 101–115.
Schumpeter, J. A. (1934): The Theory of Economics Development. Oxford University Press, Lon-
don.
Schweinhart, L. J., H. V. Barnes, and D. P. Weikart (1993): Significant Benefits - The
High/Scope Perry Preschool Study Through Age 27. High/Scope Educational Research Foundation,
Ypsilanti, Michigan.
Shiner, R., and A. Caspi (2003): “Personality Differences in Childhood and Adolescence: Mea-
surement, Development, and Consequences,” Journal of Child Psychology and Psychiatry, 44(1),
2–32.
Shonkoff, J., and D. Phillips (2000): From Neurons to Neighborhoods: The Sience of Early Child
Development. National Academy Press, Washington D.C.
Sijtsma, K., and B. W. Junker (2006): “Item Response Theory: Past Performance, Present
Developments, and Future Expectations,” Behaviormetrika, 33(1), 75–102.
36
Spady, R. H. (2006): “Indentification and Estimation of Latent Attitudes and their Behavioral
Implications,” CEMMAP Working Paper CWP12/06, Centre for Micro Data Methods and Practice
(CEMMAP), London.
(2007): “Semiparametric Methods for the Measurement of Latent Attitudes and the Estima-
tion of their Behavioral Consequences,” CEMMAP Working Paper CWP26/07, Centre for Micro
Data Methods and Practice (CEMMAP), London.
Tangney, J., R. Baumeister, and M. Boone (2004): “High Self-Control Predicts Good Ad-
justment, Less Pathology, Better Grades, and Interpersonal Success,” Journal of Personality, 72,
271–322.
Tanner, M. A., and W. H. Wong (1987): “The Calculation of Posterior Distributions by Data
Augmentation,” Journal of the American Statistical Association, 82(398), 528–540.
Tellegen, A. (1985): “Structures of Mood and Personality and their Relevance to Assessing Anxiety,
with an Emphasis on Self-Report,” in Anxiety and the Anxiety Disorders, ed. by H. Tuma, and
J. Maser, pp. 681–706. Lawrence Erlbaum Associates, Hillsdale, New Jersey.
Thomas, A., and S. Chess (1977): Temperament and Development. Brunner/Mazel, New York.
Thomas, A., S. Chess, and H. G. Birch (1968): Temperament and Behavior Disorders in Children.
New York University Press, New York.
Todd, P., and K. Wolpin (2007): “The Production of Cognitive Achievement in Children: Home,
School and Racial Test Score Gaps,” Journal of Human Capital, 1(1), 91–136.
Turkheimer, E., A. Haley, M. Waldron, B. D’Onofrio, and I. Gottesman (2003): “So-
cioeconomic Status Modifies Heritability of IQ in Young Children,” Psychological Science, 14(6),
623–628.
Urzua, S. (2008): “Racial Labor Market Gaps: The Role of Abilities and Schooling Choices,” Journal
of Human Resources, 43(4), 919–971.
van Dyk, D. A., and X.-L. Meng (2001): “The Art of Data Augmentation,” Journal of Computa-
tional and Graphical Statistics, 10(1), 1–50.
Webb, E. (1915): “Character and Intelligence,” British Journal of Psychology, 1(3), 1–99.
Weiss, C. T. (2010): “The Effects of Cognitive and Noncognitive Abilities on Earnings: Different
School Systems,” Discussion paper, European University Institute, mimeo.
37
Wolfe, R., and S. Johnson (1995): “Personality as a Predictor of College Performance,” Educa-
tional and Psychological Measurement, 55(2), 177–185.
Wood, D. (2007): “Using PRISM to Compare the Explanatory Value of General and Role-
Contextualized Trait Ratings,” Journal of Personality, 76(6), 1103–1126.
38
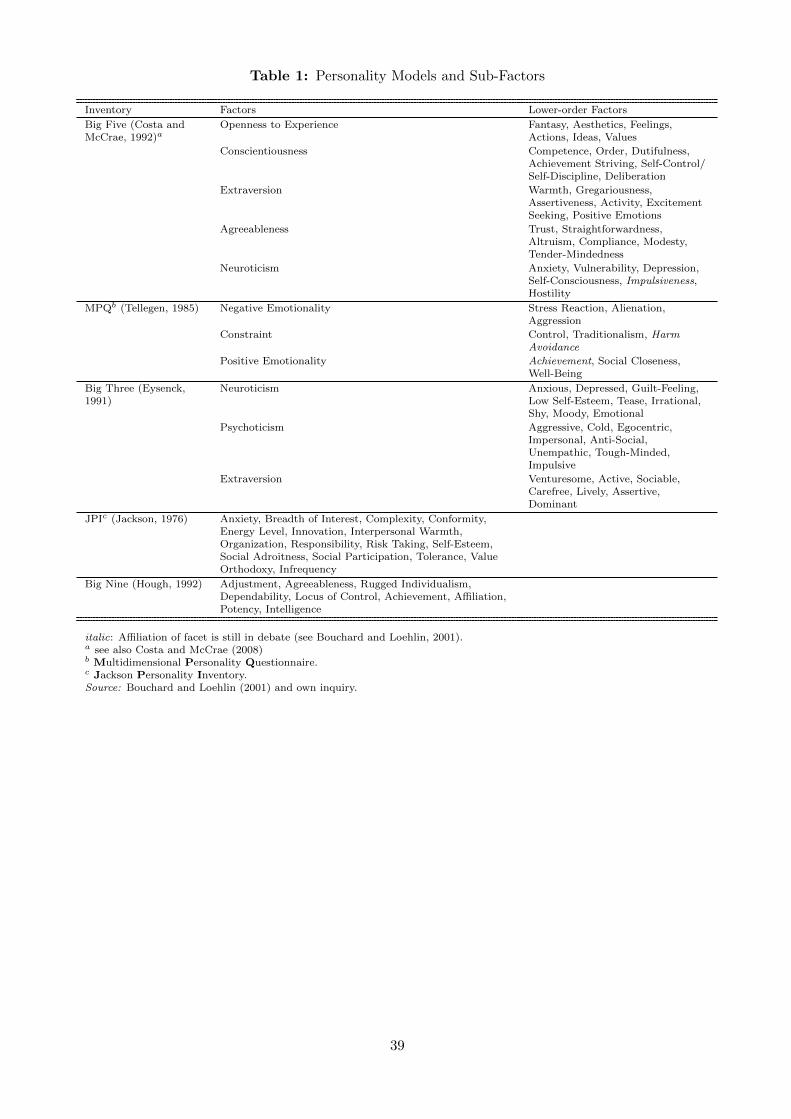
Table 1: Personality Models and Sub-Factors
Inventory Factors Lower-order Factors
Big Five (Costa andMcCrae, 1992)a
Openness to Experience Fantasy, Aesthetics, Feelings,Actions, Ideas, Values
Conscientiousness Competence, Order, Dutifulness,Achievement Striving, Self-Control/Self-Discipline, Deliberation
Extraversion Warmth, Gregariousness,Assertiveness, Activity, ExcitementSeeking, Positive Emotions
Agreeableness Trust, Straightforwardness,Altruism, Compliance, Modesty,Tender-Mindedness
Neuroticism Anxiety, Vulnerability, Depression,Self-Consciousness, Impulsiveness,Hostility
MPQb (Tellegen, 1985) Negative Emotionality Stress Reaction, Alienation,Aggression
Constraint Control, Traditionalism, HarmAvoidance
Positive Emotionality Achievement, Social Closeness,Well-Being
Big Three (Eysenck,1991)
Neuroticism Anxious, Depressed, Guilt-Feeling,Low Self-Esteem, Tease, Irrational,Shy, Moody, Emotional
Psychoticism Aggressive, Cold, Egocentric,Impersonal, Anti-Social,Unempathic, Tough-Minded,Impulsive
Extraversion Venturesome, Active, Sociable,Carefree, Lively, Assertive,Dominant
JPIc (Jackson, 1976) Anxiety, Breadth of Interest, Complexity, Conformity,Energy Level, Innovation, Interpersonal Warmth,Organization, Responsibility, Risk Taking, Self-Esteem,Social Adroitness, Social Participation, Tolerance, ValueOrthodoxy, Infrequency
Big Nine (Hough, 1992) Adjustment, Agreeableness, Rugged Individualism,Dependability, Locus of Control, Achievement, Affiliation,Potency, Intelligence
italic: Affiliation of facet is still in debate (see Bouchard and Loehlin, 2001).a see also Costa and McCrae (2008)b Multidimensional Personality Questionnaire.c Jackson Personality Inventory.Source: Bouchard and Loehlin (2001) and own inquiry.
39

Table
2:
Ove
rvie
wof
emp
iric
alst
ud
ies
Technolo
gy
Feature
Study/
Pro-
gram
Data
Sam
ple
Siz
eD
uratio
nR
esearch
Questio
nM
ethod
Results
Sensi
tive
/C
rit-
ical
Peri
od
Hopkin
sand
Bra
cht
(1975)
part
sof
2hig
hsc
hool
gra
du-
ati
ng
cla
sses
(≈20,0
00
en-
rollm
ents
)fr
om
dis
tric
tB
ould
er
County
(Col-
ora
do)
vari
es
betw
een
N=
236
and
N=
1709
ass
ess
ment
(un-
bala
nced):
≈10
yrs
.
stabilit
yof
gro
up
verb
al
and
gro
up
nonverb
alIQ
score
sth
roughout
gra
de
1,2
,4,7
,9and
11
corr
ela
tional
analy
sis
-st
abilit
yb
ecom
es
evid
ent
betw
een
gra
des
4and
7,
i.e.,
corr
ela
tion
of
adja
cent
mea-
sure
ments
exceedsr=.7
-nonverb
al
IQis
less
stable
Johnso
nand
New
port
(1989),
New
-p
ort
(1990)
nati
ve
Chin
ese
or
Kore
an
speakin
gst
udents
(Univ
er-
sity
of
Illinois
)w
ith
English
as
ase
cond
language
and
imm
igra
tion
ages
betw
een
3and
39
N=
46
Cro
ss-s
ecti
on
imm
igra
tion-a
ge
dep
endent
diff
ere
nces
inse
cond
language
pro
ficie
ncy
inte
rms
of
synta
xand
morp
holo
gy
corr
ela
tional
analy
sis
-corr
ela
tion
betw
een
age
of
arr
ival
and
test
perf
orm
ance:
r=−.
77∗∗∗
(contr
ollin
gfo
rvari
ous
backgro
und
vari
able
s)-
for
earl
yarr
ivals
(age
3-1
5,
N=
23):r=−.
87∗∗∗;
for
late
arr
ivals
(age
17-3
9,N
=23):
no
signifi
cant
corr
ela
tion
O’C
onnor,
Rutt
er,
Beck-
ett
,K
eaveney,
Kre
ppner,
and
the
English
and
Rom
ania
nA
dopte
es
Stu
dy
Team
(2000)
Rom
ania
nadopte
es
from
depri
ved
envi-
ronm
ents
pla
ced
at
ages
0to
42
month
s(b
e-
tween
1990
and
1992)
and
earl
yadopte
es
from
wit
hin
the
UK
pla
ced
betw
een
ages
of
0and
6m
onth
sas
contr
ol
gro
up
treatm
ent
gro
up
(Rom
ania
ns)
:N
=165;
contr
ol
gro
up:N
=52
ass
ess
ment
at
ages
4and
6(e
xcept
for
48
Rom
ania
nor-
phans
pla
ced
aft
er
age
of
24
month
sw
ho
were
only
ass
ess
ed
at
age
6)
eff
ects
of
earl
ydepri
ved
envi-
ronm
ents
on
cognit
ive
com
pe-
tence
(Glo
bal
Cognit
ive
Index,
GC
I)and
poss
ible
rem
edia
tion
corr
ela
tional
analy
sis;
rep
eate
dA
NO
VA
-at
age
six
(whole
sam
ple
):corr
ela
tion
betw
een
dura
tion
of
depri
vati
on
and
GC
I,r=
−.77∗∗∗
-re
peate
dA
NO
VA
(data
from
age
4and
6):
gro
up-f
acto
r,F(2,150)=
14.8
9∗∗∗;
age-
facto
r,F(1,150)=
54.9
0∗∗∗;
no
signifi
cant
inte
racti
on
term
,i.e.,
gain
sover
tim
eare
equal
acro
ssgro
ups
and
earl
ydefi
cit
sare
main
tain
ed
Self
-P
roducti
vit
y/C
om
ple
men-
tari
ty
Cam
pb
ell
and
Ram
ey
(1994),
Car-
olina
Ab
ecedar-
ian
-childre
nfr
om
low
-incom
efa
m-
ilie
sra
ndom
lyass
igned
totr
eat-
ment
and
contr
ol
gro
up
at
infa
ncy
and
again
befo
reente
ring
kin
der-
gart
en
(TT
,T
C,
CT
,C
C)
-fo
ur
cohort
sfr
om
1972-1
977
N=
111
(T=
57;
C=
53)
-tre
atm
ent:
infa
ncy
-age
8fo
rT
T,
infa
ncy
-age
5fo
rT
C,
age
5-
8fo
rC
Tand
no
treatm
ent
for
CC
gro
up
-ass
ess
ment:
at
least
annually
up
toage
8and
addit
ionally
at
age
12
eff
ects
of
diff
ere
nt
tim
ing
of
1.
pre
school
pro
gra
m,
in-
clu
din
gfu
llday
care
wit
haddit
ional
involv
em
ent
and
advis
ory
for
pare
nts
2.
school
age
pro
gra
m,
pro
vid
-in
ghom
esc
hool
teachers
...o
nW
echsl
er
Inte
llig
ence
Scale
for
childre
n(W
ISC
,lo
ngit
udin
al)
and
Woodcock
Test
of
Academ
icA
chie
vem
ent
(WT
AA
,at
age
12)
rep
eate
dA
NO
VA
-lo
ngit
udin
al
data
:T
-gro
up
const
antl
ysh
ow
sa
signifi
cant
advanta
ge
inIQ
up
toage
of
8-
age
12
data
:TT
>TC
>CT
>CC
concern
ing
overa
llsc
ore
(WIS
Cand
WT
AA
),F(6,170)=
2.6
3∗∗
Johnso
nand
Walk
er
(1991),
Houst
on
Pare
nt-
Child
Develo
pm
ent
Cente
r(P
CD
C)
childre
nfr
om
low
-incom
eM
exic
an-
Am
eri
can
fam
-ilie
sra
ndom
lyass
igned
totr
eat-
ment
and
contr
ol
gro
up
N=
216
(ini-
tially),T
=97,
C=
119
(follow
-up
data
only
part
ially
avail-
able
)
-tr
eatm
ent:
2yrs
.(s
tart
ing
1970)
-fo
llow
-up
as-
sess
ment
cro
ss-
secti
onal
eff
ect
of
hom
evis
its
for
par-
ent
supp
ort
inth
efi
rst
year
(ab
out
age
1to
2)
and
cente
r-base
dpro
gra
ms
for
pare
nts
and
childre
nof
aggre
gate
d400
hrs
.in
year
two
(age
2to
3),
on
gra
des,
Iow
aT
est
of
Basi
cSkills
(IT
BS)
and
Cla
ssro
om
Behavio
ral
Invento
ry(C
BI)
at
ages
8-1
1
AN
OV
A-
at
tim
eof
pro
gra
mcom
ple
-ti
on,
pro
gra
mchildre
nhad
sup
eri
or
IQsc
ore
s(A
ndre
ws
et
al.,
1982)
-at
ages
8-1
1T=C
for
gra
des
-IT
BS:T>C
for
vocabula
rysc
ore
(F(1,107)=
7.4
0∗∗∗),
readin
g(F(1,107)=
6.7
2∗∗)
and
language
(F(1,107)=
5.7
0∗∗)
-C
BI:T
<C
for
host
ilit
y(F(1,134)=
7.6
2∗∗∗)
conti
nued
on
next
page
40
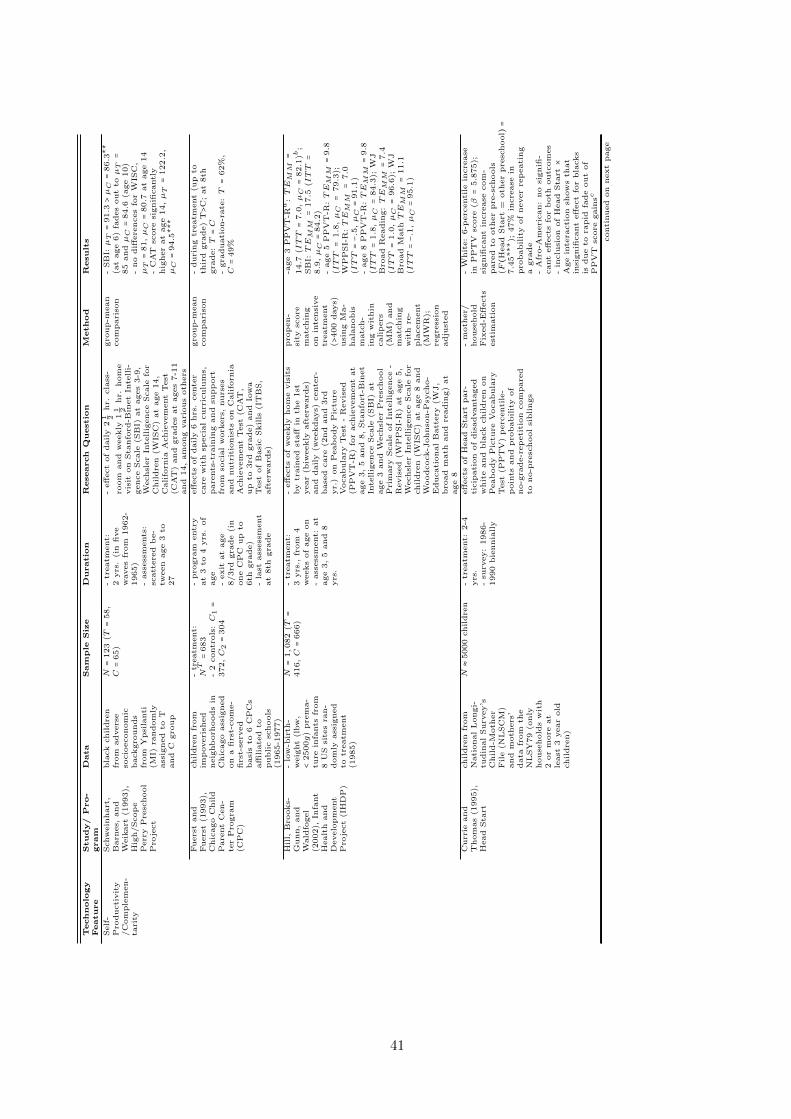
Technolo
gy
Feature
Study/
Pro-
gram
Data
Sam
ple
Siz
eD
uratio
nR
esearch
Questio
nM
ethod
Results
Self
-P
roducti
vit
y/C
om
ple
men-
tari
ty
Schw
ein
hart
,B
arn
es,
and
Weik
art
(1993),
Hig
h/Scop
eP
err
yP
resc
hool
Pro
ject
bla
ck
childre
nfr
om
advers
eso
cio
econom
icbackgro
unds
from
Ypsi
lanti
(MI)
random
lyass
igned
toT
and
Cgro
up
N=
123
(T=
58,
C=
65)
-tr
eatm
ent:
2yrs
.(i
nfi
ve
waves
from
1962-
1965)
-ass
ess
ments
:sc
att
ere
db
e-
tween
age
3to
27
-eff
ect
of
daily
21 2
hr.
cla
ss-
room
and
weekly
11 2
hr.
hom
evis
iton
Sta
nfo
rd-B
inet
Inte
lli-
gence
Scale
(SB
I)at
ages
3-9
,W
echsl
er
Inte
llig
ence
Scale
for
Childre
n(W
ISC
)at
age
14,
Califo
rnia
Achie
vem
ent
Test
(CA
T)
and
gra
des
at
ages
7-1
1and
14,
am
ong
vari
ous
oth
ers
gro
up-m
ean
com
pari
son
-SB
I:µT=
91.3
>µC=
86.3∗∗
(at
age
6)
fades
out
toµT
=85
andµC=
84.6
(age
10)
-no
diff
ere
nces
for
WIS
C,
µT=
81,µC=
80.7
at
age
14
-C
AT
score
signifi
cantl
yhig
her
at
age
14,µT
=122.2
,µC=
94.5∗∗∗
Fuers
tand
Fuers
t(1
993),
Chic
ago
Child
Pare
nt
Cen-
ter
Pro
gra
m(C
PC
)
childre
nfr
om
imp
overi
shed
neig
hb
orh
oods
inC
hic
ago
ass
igned
on
afi
rst-
com
e-
firs
t-se
rved
basi
sto
6C
PC
saffi
liate
dto
public
schools
(1965-1
977)
-tr
eatm
ent:
NT=
683
-2
contr
ols
:C
1=
372,C
2=
304
-pro
gra
mentr
yat
3to
4yrs
.of
age
-exit
at
age
8/3rd
gra
de
(in
one
CP
Cup
to6th
gra
de)
-la
stass
ess
ment
at
8th
gra
de
eff
ects
of
daily
6hrs
.cente
rcare
wit
hsp
ecia
lcurr
iculu
ms,
pare
nts
-tra
inin
gand
supp
ort
from
socia
lw
ork
ers
,nurs
es
and
nutr
itio
nis
tson
Califo
rnia
Achie
vem
ent
Test
(CA
T,
up
to3rd
gra
de)
and
Iow
aT
est
of
Basi
cSkills
(IT
BS,
aft
erw
ard
s)
gro
up-m
ean
com
pari
son
-duri
ng
treatm
ent
(up
toth
ird
gra
de)
T>C
;at
8th
gra
de:T=C
-gra
duati
on-r
ate
:T
=62%
,C=
49%
Hill,
Bro
oks-
Gunn,
and
Wald
fogel
(2002),
Infa
nt
Healt
hand
Develo
pm
ent
Pro
ject
(IH
DP
)
-lo
w-b
irth
-w
eig
ht
(lbw
,<
2500g)
pre
ma-
ture
infa
nts
from
8U
Ssi
tes
ran-
dom
lyass
igned
totr
eatm
ent
(1985)
N=
1,082
(T=
416,C=
666)
-tr
eatm
ent:
3yrs
.,fr
om
4w
eeks
of
age
on
-ass
ess
ment:
at
age
3,
5and
8yrs
.
-eff
ects
of
weekly
hom
evis
its
by
train
ed
staff
inth
e1st
year
(biw
eekly
aft
erw
ard
s)and
daily
(weekdays)
cente
r-base
dcare
(2nd
and
3rd
yr.
)on
Peab
ody
Pic
ture
Vocabula
ryT
est
-R
evis
ed
(PP
VT
-R)
for
achie
vem
ent
at
age
3,
5and
8,
Sta
nfo
rt-B
inet
Inte
llig
ence
Scale
(SB
I)at
age
3and
Wechsl
er
Pre
school
Pri
mary
Scale
of
Inte
llig
ence
-R
evis
ed
(WP
PSI-
R)
at
age
5,
Wechsl
er
Inte
llig
ence
Scale
for
childre
n(W
ISC
)at
age
8and
Woodcock-J
ohnso
n-P
sycho-
Educati
onal
Batt
ery
(WJ,
bro
ad
math
and
readin
g)
at
age
8
pro
pen-
sity
score
matc
hin
gon
inte
nsi
ve
treatm
ent
(>400
days)
usi
ng
Ma-
hala
nobis
matc
h-
ing
wit
hin
calip
ers
(MM
)and
matc
hin
gw
ith
re-
pla
cem
ent
(MW
R);
regre
ssio
nadju
sted
-age
3P
PV
T-R
a:TE
MM
=14.7
(ITT=
7.0
,µC
=82.1
)b;
SB
I:TE
MM
=17.5
(ITT
=8.9
,µC=
84.2
)-
age
5P
PV
T-R
:TE
MM
=9.8
(ITT
=1.8
,µC
=79.3
);W
PP
SI-
R:TE
MM
=7.0
(ITT=−.
5,µC=
91.1
)-
age
8P
PV
T-R
:TE
MM
=9.8
(ITT
=1.8
,µC
=84.3
);W
JB
road
Readin
g:TE
MM
=7.4
(ITT
=1.0
,µC
=96.6
);W
JB
road
MathTE
MM
=11.1
(ITT=−.
1,µC=
95.1
)
Curr
ieand
Thom
as
(1995),
Head
Sta
rt
childre
nfr
om
Nati
onal
Longi-
tudin
al
Surv
ey’s
Child-M
oth
er
File
(NL
SC
M)
and
moth
ers
’data
from
the
NL
SY
79
(only
house
hold
sw
ith
2or
more
at
least
3year
old
childre
n)
N≈
5000
childre
n-
treatm
ent:
2-4
yrs
.-
surv
ey:
1986-
1990
bie
nnia
lly
eff
ects
of
Head
Sta
rtpar-
ticip
ati
on
of
dis
advanta
ged
whit
eand
bla
ck
childre
non
Peab
ody
Pic
ture
Vocabula
ryT
est
(PP
TV
)p
erc
enti
le-
poin
tsand
pro
babilit
yof
no-g
rade-r
ep
eti
tion
com
pare
dto
no-p
resc
hool
siblings
-m
oth
er/
house
hold
Fix
ed-E
ffects
est
imati
on
-W
hit
e:
6-p
erc
enti
lein
cre
ase
inP
PT
Vsc
ore
(β=
5.8
75);
signifi
cant
incre
ase
com
-pare
dto
oth
er
pre
-schools
(F(H
ead
Sta
rt=
oth
er
pre
school)=
7.4
5∗∗∗);
47%
incre
ase
inpro
babilit
yof
never
rep
eati
ng
agra
de
-A
fro-A
meri
can:
no
signifi
-cant
eff
ects
for
both
outc
om
es
-in
clu
sion
of
Head
Sta
rt×
Age
inte
racti
on
show
sth
at
insi
gnifi
cant
eff
ect
for
bla
cks
isdue
tora
pid
fade
out
of
PP
VT
score
gain
sc
conti
nued
on
next
page
41
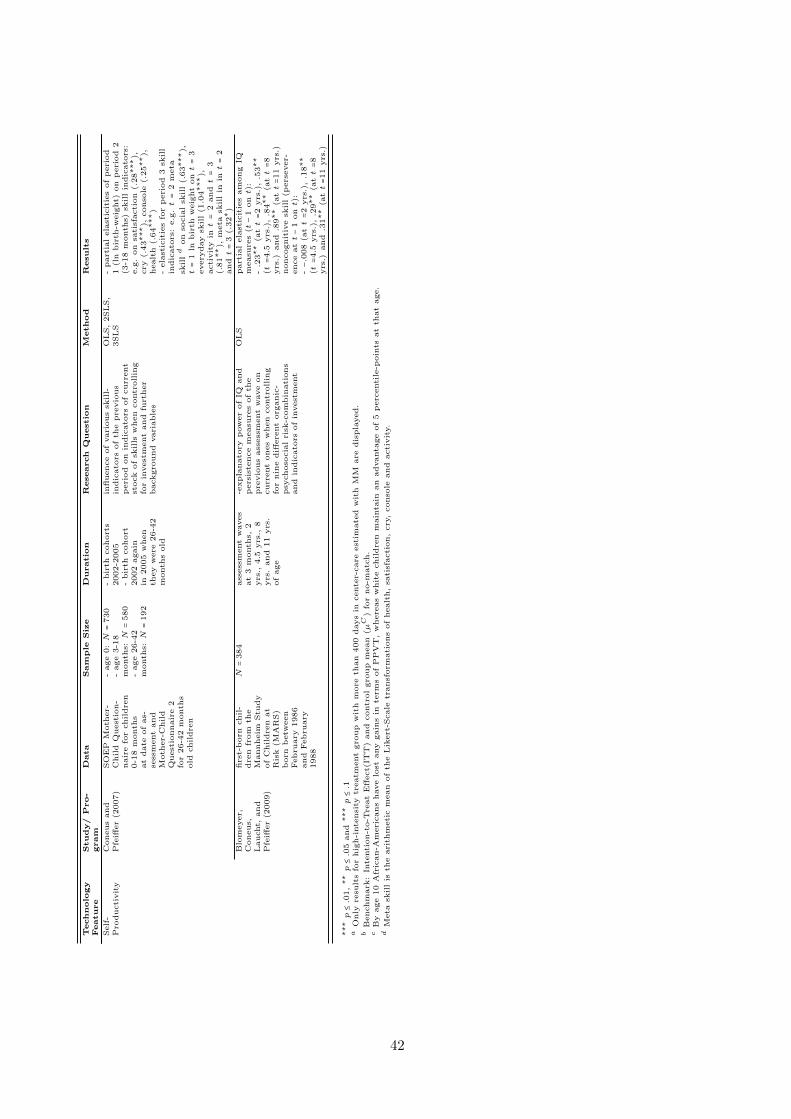
Technolo
gy
Feature
Study/
Pro-
gram
Data
Sam
ple
Siz
eD
uratio
nR
esearch
Questio
nM
ethod
Results
Self
-P
roducti
vit
yC
oneus
and
Pfe
iffer
(2007)
SO
EP
Moth
er-
Child
Quest
ion-
nair
efo
rchildre
n0-1
8m
onth
sat
date
of
as-
sess
ment
and
Moth
er-
Child
Quest
ionnair
e2
for
26-4
2m
onth
sold
childre
n
-age
0:N
=730
-age
3-1
8m
onth
s:N
=580
-age
26-4
2m
onth
s:N
=192
-bir
thcohort
s2002-2
005
-bir
thcohort
2002
again
in2005
when
they
were
26-4
2m
onth
sold
infl
uence
of
vari
ous
skill-
indic
ato
rsof
the
pre
vio
us
peri
od
on
indic
ato
rsof
curr
ent
stock
of
skills
when
contr
ollin
gfo
rin
vest
ment
and
furt
her
backgro
und
vari
able
s
OL
S,
2SL
S,
3SL
S-
part
ial
ela
stic
itie
sof
peri
od
1(l
nbir
th-w
eig
ht)
on
peri
od
2(3
-18
month
s)sk
ill
indic
ato
rs:
e.g
.on
sati
sfacti
on
(.28∗∗∗),
cry
(.43∗∗∗),
conso
le(.
25∗∗),
healt
h(.
64∗∗∗)
-ela
stic
itie
sfo
rp
eri
od
3sk
ill
indic
ato
rs:
e.g
.t=
2m
eta
skilld
on
socia
lsk
ill
(.63∗∗∗),
t=
1ln
bir
thw
eig
ht
ont=
3every
day
skill
(1.0
4∗∗∗),
acti
vit
yint=
2andt=
3(.
81∗∗),
meta
skill
inint=
2andt=
3(.
32∗)
Blo
meyer,
Coneus,
Laucht,
and
Pfe
iffer
(2009)
firs
t-b
orn
chil-
dre
nfr
om
the
Mannheim
Stu
dy
of
Childre
nat
Ris
k(M
AR
S)
born
betw
een
Febru
ary
1986
and
Febru
ary
1988
N=
384
ass
ess
ment
waves
at
3m
onth
s,2
yrs
.,4.5
yrs
.,8
yrs
.and
11
yrs
.of
age
-expla
nato
ryp
ow
er
of
IQand
pers
iste
nce
measu
res
of
the
pre
vio
us
ass
ess
ment
wave
on
curr
ent
ones
when
contr
ollin
gfo
rnin
ediff
ere
nt
org
anic
-psy
choso
cia
lri
sk-c
om
bin
ati
ons
and
indic
ato
rsof
invest
ment
OL
Spart
ial
ela
stic
itie
sam
ong
IQm
easu
res
(t−
1ont)
:-.2
3∗∗
(att=2
yrs
.),.5
3∗∗
(t=4
.5yrs
.),.8
4∗∗
(att=8
yrs
.)and.8
9∗∗
(att=1
1yrs
.)noncognit
ive
skill
(pers
ever-
ence
att−
1ont)
:-−.
008
(att=2
yrs
.),.1
8∗∗
(t=4
.5yrs
.),.2
9∗∗
(att=8
yrs
.)and.3
1∗∗
(att=1
1yrs
.)
∗∗∗p≤.0
1,∗∗p≤.0
5and∗∗∗p≤.1
aO
nly
resu
lts
for
hig
h-i
nte
nsi
tytr
eatm
ent
gro
up
wit
hm
ore
than
400
days
incente
r-care
est
imate
dw
ith
MM
are
dis
pla
yed.
bB
enchm
ark
:In
tenti
on-t
o-T
reat
Eff
ect(
ITT
)and
contr
ol
gro
up
mean
(µC
)fo
rno-m
atc
h.
cB
yage
10
Afr
ican-A
meri
cans
have
lost
any
gain
sin
term
sof
PP
VT
,w
here
as
whit
echildre
nm
ain
tain
an
advanta
ge
of
5p
erc
enti
le-p
oin
tsat
that
age.
dM
eta
skill
isth
eari
thm
eti
cm
ean
of
the
Lik
ert
-Scale
transf
orm
ati
ons
of
healt
h,
sati
sfacti
on,
cry
,conso
leand
acti
vit
y.
42

Table
3:
Ove
rvie
wof
Stu
die
sA
nal
yzi
ng
the
Eff
ects
ofN
onco
gnit
ive
Skil
lson
Vari
ou
sO
utc
om
es
Study
Data
Sam
ple
Siz
eTim
eH
oriz
on
Research
Questio
nM
ethod
Results
Coneus
and
Laucht
(2008)
Mannheim
Stu
dy
of
Childre
nat
Ris
k(M
AR
S)
N=
384
noncognit
ive
skills
at
ages
3m
onth
sand
2yrs
.,outc
om
es
betw
een
ages
8and
19
eff
ects
of
earl
yte
mp
era
menta
lm
easu
res
(exp
ert
rati
ngs)
on
gra
des
and
socia
loutc
om
es
childre
nF
ixed-
Eff
ects
part
icula
rly
low
att
en-
tion
span
(benchm
ark
:hig
hatt
enti
on
span)
shri
nks
math
gra
des
(β=.5
5∗∗∗),
gra
des
inG
erm
an
(β=.3
5∗∗∗),
num
ber
of
delinquencie
s(β
=3.1
1∗∗∗),
pro
babilit
yof
smokin
g(β
=.1
5∗∗),
and
num
ber
of
alc
o-
holic
dri
nks
per
month
(β=
22.7
7∗∗∗)
Duckw
ort
hand
Seligm
an
(2005)
two
conse
cuti
ve
cohort
sof
US
eig
ht-
gra
de
hig
hsc
hool
students
N1=
140,N
2=
164
2002
and
2003
eff
ect
of
self
-dis
cip
line
(com
-p
ose
dof
standard
ized
self
-contr
ol
and
impuls
iveness
rati
ngs)
on
gra
de
poin
taver-
age
OL
Sa
one
standard
devia
tion
incre
ase
inse
lf-d
iscip
line
incre
ase
sG
PA
by.1∗∗∗
for
the
2002
and
by.0
8∗∗
for
the
2003
cohort
Coneus,
Gern
andt,
and
Saam
(2009)
Germ
an
Socio
Eco-
nom
icP
anel
(SO
EP
)youth
quest
ionnair
e,
waves
2000-2
005
N=
3,650
noncognit
ive
skills
,academ
icsk
ills
and
backgro
und
vari
able
sw
ere
ass
ess
ed
from
2000
on,
info
rmati
on
on
school
tracks
up
to(i
nclu
din
g)
2005
eff
ect
of
inte
rnal
contr
ol
at
age
17
on
late
reducati
onal
dro
pout
(up
toage
21)
Corr
ela
ted
Ran-
dom
Eff
ects
aone
standard
devia
tion
incre
ase
inin
tern
al
con-
trol
decre
ase
sdro
pout
pro
babilit
yat
age
17
by
2.5
%and
by
6%
at
age
19
Wolf
eand
Johnso
n(1
995)
Stu
dents
from
Sta
teU
niv
ers
ity
of
New
York
N=
201
cro
ssse
cti
on
infl
uence
of
vari
ous
pers
on-
ality
invento
ries
and
dis
tinct
scale
son
college
gra
de
poin
tavera
ge
(GP
A)
OL
Spart
icula
rin
fluence
of
trait
sre
late
dto
contr
ol,
i.e.,
org
aniz
ati
on
(fro
mJP
I)β=.2
7∗∗∗,
contr
ol
(fro
mB
IG3)β=.3
2∗∗∗
and
consc
ienti
ousn
ess
(fro
mB
igF
ive)β=.3
1∗∗∗
Carn
eir
o,
Cra
wfo
rd,
and
Goodm
an
(2007)
Nati
onal
Child
Devel-
opm
ent
Surv
ey
1958
(NC
DS58)
init
ial
cohort
size
≈17,0
00
backgro
und
vari
able
sat
1958
and
1965,
skill
measu
res
at
1965
and
1969,
schooling
outc
om
es
at
1974
and
lab
or
mark
et
outc
om
es
at
2000
eff
ect
of
cognit
ive
and
noncog-
nit
ive
skills
(socia
ladju
st-
ment)
at
childhood
on
vari
ous
outc
om
es
OL
SP
robit
standard
ized
socia
lad-
just
ment
score
eff
ects
,e.g
.,pro
babilit
yof
stayin
gon
at
school
unti
lage
16
(.038∗∗∗),
em
plo
ym
ent
statu
sat
42
(.026∗∗∗)
and
log
hourl
yw
ages
at
42
(.033∗∗∗)
Murn
ane,
Wille
tt,
Bra
atz
,and
Duhald
e-
bord
e(2
000)
Nati
onal
Longit
udin
al
Surv
ey
of
Youth
1979
(NL
SY
79)
subsa
mple
for
male
s
N=
1,448
measu
res
ass
ess
ed
in1980,
wages
(age
27/28)
from
1990
to1993
eff
ect
of
self
-est
eem
(con-
trollin
gfo
rcognit
ive
speed,
schola
stic
achie
vem
ent,
eth
nic
gro
up
and
cale
ndar
year)
of
15-1
8year
old
male
son
log
hourl
yw
ages
at
age
27/28
OL
Sa
one
poin
tin
cre
ase
inR
ose
nb
erg
self
-est
eem
scale
incre
ase
slo
ghourl
yw
age
by
3,7%
(β=.0
37∗∗∗)
Heckm
an,
Sti
xru
d,
and
Urz
ua
(2006)
Nati
onal
Longit
udin
al
Surv
ey
of
Youth
(NL
SY
79)
N=
6,111
annual
ass
ess
ment
begin
nin
g1979
on
backgro
und
vari
able
s,te
stsc
ore
sonly
in1979
infl
uence
of
cognit
ive
and
noncognit
ive
skills
(inte
rnal
contr
ol
and
self
-est
eem
)as-
sess
ed
inadole
scence
(ages
14-2
1)
on
vari
ous
socia
land
lab
or
mark
et
outc
om
es
at
age
30,
contr
ollin
gfo
rsc
hooling
and
backgro
und
facto
rst
ruc-
ture
model
and
Bayesi
an
Mark
ov
Chain
Monte
Carl
om
eth
ods
-noncognit
ive
skills
even
stro
nger
pre
dic
tlo
gw
ages
for
most
educati
onal
degre
es,
esp
ecia
lly
at
the
tails
of
the
dis
trib
uti
onb
-fu
rther
infl
uence
on
pro
babilit
yof
unem
plo
y-
ment,
of
bein
ga
whit
ecollar
work
er,
of
gra
d-
uati
ng
from
college,
of
smokin
gand
mari
juana
use
and
of
incarc
era
tion
conti
nued
on
next
page
43
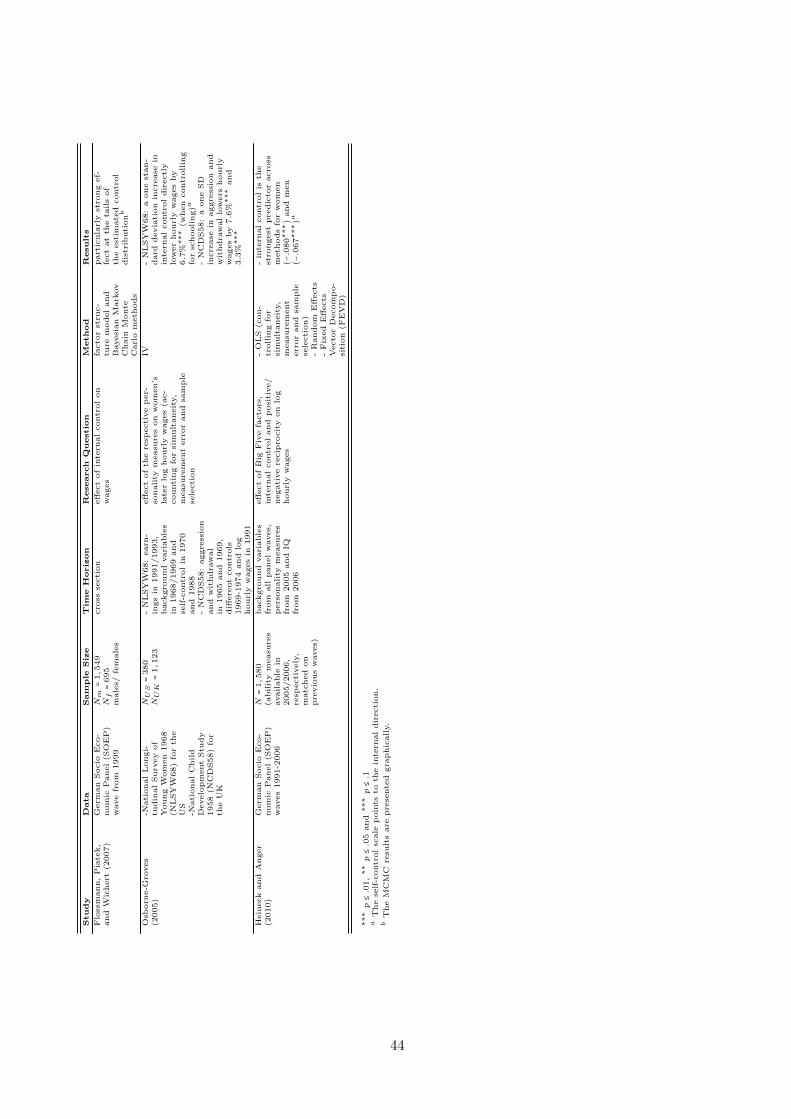
Study
Data
Sam
ple
Siz
eTim
eH
oriz
on
Research
Questio
nM
ethod
Results
Flo
ssm
ann,
Pia
tek,
and
Wic
hert
(2007)
Germ
an
Socio
Eco-
nom
icP
anel
(SO
EP
)w
ave
from
1999
Nm
=1,549
Nf=
695
male
s/fe
male
s
cro
ssse
cti
on
eff
ect
of
inte
rnal
contr
ol
on
wages
facto
rst
ruc-
ture
model
and
Bayesi
an
Mark
ov
Chain
Monte
Carl
om
eth
ods
part
icula
rly
stro
ng
ef-
fect
at
the
tails
of
the
est
imate
dcontr
ol
dis
trib
uti
onb
Osb
orn
e-G
roves
(2005)
-Nati
onal
Longi-
tudin
al
Surv
ey
of
Young
Wom
en
1968
(NL
SY
W68)
for
the
US
-Nati
onal
Child
Develo
pm
ent
Stu
dy
1958
(NC
DS58)
for
the
UK
NU
S=
380
NU
K=
1,123
-N
LSY
W68:
earn
-in
gs
in1991/1993,
backgro
und
vari
able
sin
1968/1969
and
self
-contr
ol
in1970
and
1988
-N
CD
S58:
aggre
ssio
nand
wit
hdra
wal
in1965
and
1969,
diff
ere
nt
contr
ols
1969-1
974
and
log
hourl
yw
ages
in1991
eff
ect
of
the
resp
ecti
ve
per-
sonality
measu
res
on
wom
en’s
late
rlo
ghourl
yw
ages
(ac-
counti
ng
for
sim
ult
aneit
y,
measu
rem
ent
err
or
and
sam
ple
sele
cti
on
IV-
NL
SY
W68:
aone
stan-
dard
devia
tion
incre
ase
inin
tern
al
contr
ol
dir
ectl
ylo
wer
hourl
yw
ages
by
6.7
%∗∗∗
(when
contr
ollin
gfo
rsc
hooling)a
-N
CD
S58:
aone
SD
incre
ase
inaggre
ssio
nand
wit
hdra
wal
low
ers
hourl
yw
ages
by
7.6
%∗∗∗
and
3.3
%∗∗∗
Hein
eck
and
Anger
(2010)
Germ
an
Socio
Eco-
nom
icP
anel
(SO
EP
)w
aves
1991-2
006
N=
1,580
(abilit
ym
easu
res
available
in2005/2006,
resp
ecti
vely
,m
atc
hed
on
pre
vio
us
waves)
backgro
und
vari
able
sfr
om
all
panel
waves,
pers
onali
tym
easu
res
from
2005
and
IQfr
om
2006
eff
ect
of
Big
Fiv
efa
cto
rs,
inte
rnal
contr
ol
and
posi
tive/
negati
ve
recip
rocit
yon
log
hourl
yw
ages
-O
LS
(con-
trollin
gfo
rsi
mult
aneit
y,
measu
rem
ent
err
or
and
sam
ple
sele
cti
on)
-R
andom
Eff
ects
-F
ixed
Eff
ects
Vecto
rD
ecom
po-
siti
on
(FE
VD
)
-in
tern
al
contr
ol
isth
est
rongest
pre
dic
tor
acro
ssm
eth
ods
for
wom
en
(−.0
80∗∗∗)
and
men
(−.0
67∗∗∗)a
∗∗∗p≤.0
1,∗∗p≤.0
5and∗∗∗p≤.1
aT
he
self
-contr
ol
scale
poin
tsto
the
inte
rnal
dir
ecti
on.
bT
he
MC
MC
resu
lts
are
pre
sente
dgra
phic
ally.
44

Table
4:
Ove
rvie
wof
Stu
die
sA
nal
yzi
ng
the
Eff
ects
ofN
onco
gnit
ive
Skil
lson
Wage
Gap
s
Study
Data
Sam
ple
Siz
eTim
eH
oriz
on
Research
Questio
nM
ethod
Results
Fort
in(2
008)
-N
ati
onal
Longit
u-
din
al
Surv
ey
of
Hig
hSchool
Cla
ssof
1972
(NL
S72)
-8th
gra
de
students
from
the
Nati
onal
Educati
onal
Lon-
git
udin
al
Stu
dy
(NE
LS88)
not
rep
ort
ed
(subsa
mple
sare
use
dfo
rcom
para
bilit
y)
-N
LS72:
back-
gro
und
and
test
sfr
om
1973/74/76
and
1979,
wages
from
1979
-N
EL
S88:
back-
gro
und
etc
.su
rveyed
in1990/92/94
and
2000,
wages
from
2000
eff
ect
of
inte
rnal
contr
ol,
self
-est
eem
,im
port
ance
of
money/w
ork
and
imp
ort
ance
of
people
/fa
mily
on
log
hourl
yw
ages
at
ages
24
(NE
LS88)
and
25
(NL
S72),
contr
oll
ing
for
cognit
ive
skills
,exp
eri
ence
and
oth
er
vari
able
s
OL
S(O
axaca-
Ranso
mT
yp
eD
ecom
posi
tion)
NL
S72:
6.4
%of
the.2
4lo
gw
age
gap
due
tononcognit
ive
skills
,par-
ticula
rly
by
imp
ort
ance
of
money/w
ork
NE
LS88:
5.3
%of.1
8gap,
again
main
lydue
toim
-p
ort
ance
of
money/w
ork
Urz
ua
(2008)
Nati
onal
Longit
udi-
nal
Surv
ey
of
Youth
(NL
SY
79)
repre
-se
nta
tive
sam
ple
and
subsa
mple
for
overs
am
pling
bla
cks
N=
3,423
annual
ass
ess
ment
begin
nin
g1979
on
backgro
und
vari
able
s,te
stsc
ore
sonly
in1979
rela
tionsh
ipb
etw
een
cognit
ive
(Arm
ed
Serv
ice
Vocati
onal
Apti
tude
Batt
ery
subte
sts,
ASV
AB
)and
noncognit
ive
(inte
rnal
contr
ol,
self
-est
eem
)abilit
ies,
schooling
choic
es,
and
bla
ck-w
hit
ela
bor
mark
et
diff
ere
nti
als
facto
rst
ruc-
ture
model
and
Bayesi
an
MC
MC
meth
ods
noncognit
ive
skills
are
stro
ng
pre
dic
tors
of
schooling
choic
es
and
wages
for
both
gro
ups,
but
expla
inlitt
leof
the
racia
lw
age
gap
a
Bra
akm
ann
(2009)
Germ
an
Socio
Eco-
nom
icP
anel
(SO
EP
),2005
wave
for
25-5
5years
old
full
tim
eem
plo
yed
resp
ondents
N=
4,123
cro
ss-s
ecti
on
beff
ects
of
Big
Fiv
e,
inte
rnal
contr
ol
and
posi
tive/
negati
ve
recip
rocit
yon
log
hourl
yw
ages
OL
S(B
linder-
Oaxaca
Decom
-p
osi
tion)
usi
ng
male
sas
refe
rence,
noncognit
ive
skills
expla
inup
to17.7
%c
of
the.1
8lo
gw
age
gap,
main
lydue
tow
om
en’s
hig
her
degre
eof
agre
eable
ness
and
neuro
ticis
m
Mueller
and
Plu
g(2
006)
Wis
consi
nL
ongit
u-
din
al
Stu
dy
(WL
S),
hig
hsc
hool
gra
duate
sin
1957
N=
5,025
backgro
und
vari
able
sfr
om
1964,
1975
and
1992;
IQfr
om
1957;
pers
onali
tyfr
om
1992
eff
ect
of
standard
ized
Big
Fiv
em
easu
res
on
gender
wage
gap
(contr
oll
ing
for
backgro
und,
IQ,
educati
on
and
tenure
)
OL
S(O
axaca-
Ranso
mT
yp
eD
ecom
posi
tion)
-diff
ere
nces
innoncog-
nit
ive
skills
expla
in7.3
%and
diff
ere
nces
inre
-w
ard
s4.5
%of
the.5
8lo
gw
age
gap
infa
vor
of
men
(dri
ven
by
wom
en’s
hig
her
degre
eof
agre
eable
ness
and
neuro
ticis
m)
-th
ep
enalt
yfo
ragre
e-
able
ness
and
neuro
ticis
mis
2.9
%hig
her
incase
of
wom
en
∗∗∗p≤.0
1,∗∗p≤.0
5and∗∗∗p≤.1
aT
he
MC
MC
resu
lts
are
only
pre
sente
dgra
phic
all
y.
bA
measu
refo
rri
sk-a
vers
ion
was
surv
eyed
inth
e2004
wave.
cU
sing
the
male
coeffi
cie
nts
as
refe
rence.
45

(a) (b)
(c)(d)
Figure 1: Net effect of noncognitive skills on log wages for 30-year old males and females in Germanyand the United States. Upper panel: males (a) and females (b) in Germany. Lower panel: males (c)and females (d) in the United States. Sources: Flossmann, Piatek, and Wichert (2007) and Heckman,Stixrud, and Urzua (2006).
46


