
Northwest Tennessee Workforce Study
Business and Economic Research CenterJennings A. Jones College of BusinessMiddle Tennessee State University
Northwest Tennessee Workforce Study
Business and Economic Research CenterDavid Penn, DirectorMurat Arik, Associate Director
Susan Harmon, Associate Professor, Marketing

Overview of Study
Current economic structure
Preparedness to grow
Strengths and weaknesses

Research Methods
Analysis of population, employment, income, and wage trends
Survey of local employers Survey of workforce professionals Focus group interviews
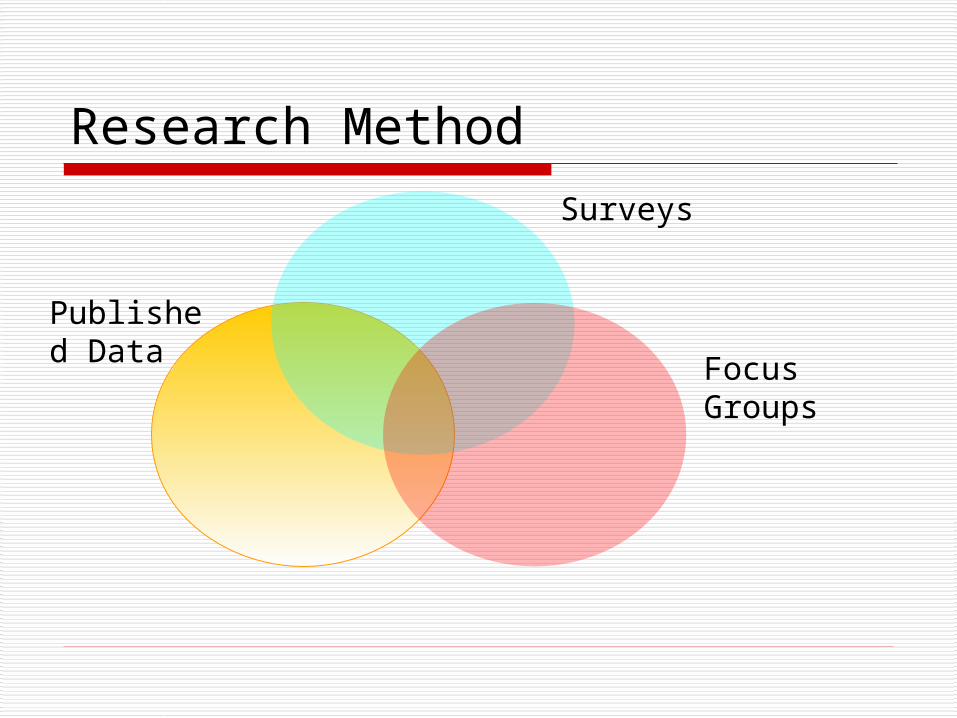
Research Method
Published Data
Surveys
Focus Groups
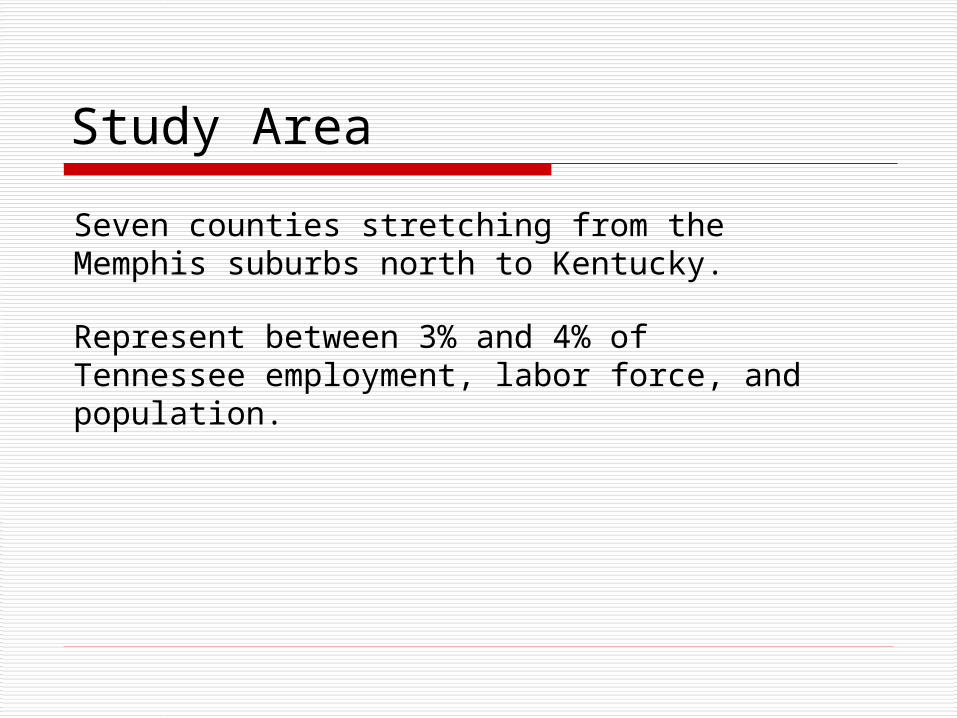
Study Area
Seven counties stretching from the Memphis suburbs north to Kentucky.
Represent between 3% and 4% of Tennessee employment, labor force, and population.

Context
Important trends – Increasing importance of trade.
Foreign-made goods more in demand. Exports also growing quickly. International trade share of GDP on the
rise.

Context
Important trends – Information technology revolution.
IT sector responsible for large share of recent growth.
Widespread usage of IT has reduced production costs, increased productivity.

Context
Consequences Competition much more intense than
ten or twenty years ago. Companies have little pricing power.

Context
Implications Pressure to increase productivity will
continue. Pressure to reduce production costs
will continue.

Context
Results More consolidations, downsizing,
outsourcing. Productivity will be a critical factor; can
be enhanced with continuing education, training.
Reducing turnover, cutting fixed costs also helpful in increasing productivity.
Current Structure
Population, income, employmentAmong other Tennessee workforce areas, per capita income is one of lowest and unemployment rate one of the highest.
Growth of population and labor force flat, lag state growth rate.
Personal income growth also lags state growth rate.

Current Structure
Industrial DistributionMuch more dependent on manufacturing as a source of employment and payroll than the rest of the state, about twice as important as for Tennessee.

Current Structure
Educational AttainmentBachelor’s degree or higher –
Tennessee: 19.6%NW Tennessee: 7.6% - 12.0%
Less than high school –Tennessee: 24.1%NW Tennessee: 25.4% - 36.1%

Current Employment Status
2,350
2,400
2,450
2,500
2,550
2,600
2,650
2,700
Tho
usan
ds
Tennessee

Current Employment Trends
2,350
2,400
2,450
2,500
2,550
2,600
2,650
2,700
Tho
usan
ds
66.0
67.0
68.0
69.0
70.0
71.0
72.0
73.0
74.0
75.0
76.0
Tennessee NW Counties

Current Employment Trends
•Impacts on payroll employment vary by region of state.
•Tennessee down 2.5% from peak in Jan 2000 to June 2003.
•Northwest counties down 8.2% from Jan 2000 peak.
Strengths and Weaknesses
Weaknesses•Lack of industrial diversity
•Not enough resources for post-secondary education
•Low educational attainment
•Weak regional cooperation

Strengths and Weaknesses
Workforce Professionals
•Weak regional cooperation
Figure 25. Is the Existing Level of Workforce Education a Barrier to Employment?
0 10 20 30 40 50 60
Major Barrier
Moderate Barrier
Not a Barrier
Percent of Professional Opinion

Strengths and Weaknesses
Strengths
•Strong work ethic
•Location
There are a lot of people here who do care about other people. It is a strong community in that respect. I think we have some positives; we just need to sell those positives to other people.

Preparedness to GrowEmployers’ Viewpoint
Skills in new hiresReading –Not a problem: 34%Moderate problem: 18%High to critical problem: 6%
Math –Not a problem: 26%Moderate problem: 28%High to critical problem: 10%
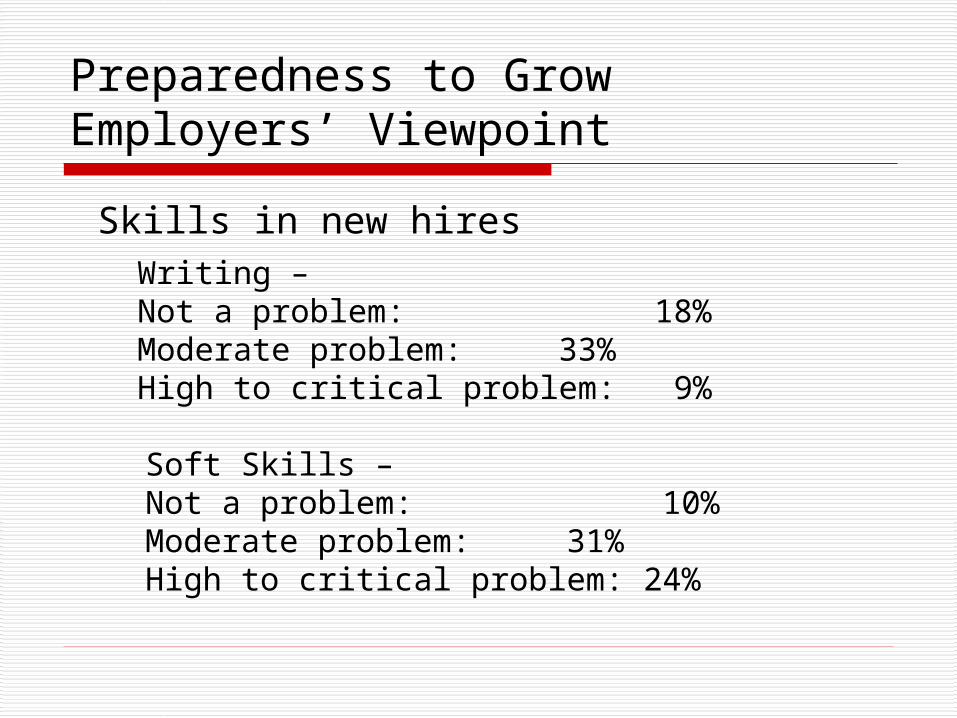
Preparedness to GrowEmployers’ Viewpoint
Skills in new hiresWriting –Not a problem: 18%Moderate problem: 33%High to critical problem: 9%
Soft Skills –Not a problem: 10%Moderate problem: 31%High to critical problem: 24%

Preparedness to GrowEmployers’ Viewpoint
Soft Skills
Right now, in banking, a high school degree is not enough for the technical skills they need, communication skills, people skills, soft skills are not there...just things that a lot of us who are older learned at home, such as people skills, communication skills, how to dress.

Employers’ View
Figure 21. How Well Would You Say the Quality of the NW Tennessee Labor Supply Meets Your Current Needs?
010
203040
5060
7080
Extremely well Very well Acceptably well Not very well Not at all
Pe
rce
nt
All employers Small employers Large employers

Employers’ View
Registered NurseLicensed Practical NurseTruck DriverMaintenance WorkerSales RepresentativeTellerCustomer Service Representative
Occupations in shortest supply:Receptionist/ClerkMachinistTool and Die MakerComputer OperatorLaborerWelder/Fabricator

Employers’ ViewpointEducation Preferences for Occupations in Shortest Supply
0.00% 10.00%
20.00%
30.00%
40.00%
50.00%
60.00%
70.00%
Less than highschool
High school
Some college
Bachelor's degree
Small employers Large employers

Employers’ ViewpointEducation Preferences for Occupations in Shortest Supply
0.00% 10.00%
20.00%
30.00%
40.00%
50.00%
60.00%
70.00%
Less than highschool
High school
Some college
Bachelor's degree
Small employers Large employers
Employers’ Viewpoint
For occupations in shortest supply:
Just 13.4% of jobs could be filled by workers with less than high school diploma.
These workers comprise 31.1% of the Northwest Tennessee workforce.

Employers’ Viewpoint
For occupations in shortest supply:
17.6% of jobs will be filled by workers with at least a Bachelor’s degree (23.2% for large employers).
These workers comprise 10.1% of the Northwest Tennessee workforce.

Employers’ View - Growth
Table 40. Desired Level of Employment 10 Years from Now
Level of Employment Percent
Fewer Employees 13.1
About the Same Number 18.3
Up to 50 Percent More 42.3
51 Percent to 100 Percent More 17.5
More Than 100 Percent More 8.8

Employers’ View – Hiring Needs
Demand for workers with less than high school education will drop sharply during the next ten years.
Demand for workers with a high school degree will not grow as quickly as for those with more education and training.

Employers’ View - Constraints
Figure 23. Most Important Constraints on Growth During the Next 10 Years
0.0% 10.0% 20.0% 30.0% 40.0% 50.0% 60.0% 70.0% 80.0%
Other
Availability of financial capital for expansion
Controlling non-labor costs
Improving productivity
Finding new markets
Workers’ compensation costs
Healthcare costs
Large employers All employers Small employers

Employers’ View - Constraints
Table 31. To What Extent Do Rising Health Care Insurance Costs Limit the Number of Employees Your Company Can Hire?
Severity of Problem (percent of employers)
Not a Problem Low Medium High Critical Problem
All Employers 16.79 13.74 20.61 25.96 22.9 Small Employers 16.67 16.67 24.36 17.95 24.36 Large Employers 16.98 9.43 15.09 37.73 20.75

Employers’ Concerns
Generally optimistic about long-run future.
Concerned about workers’ compensation costs.
Want to find a way to keep more young people in the area.
Concerned about costs of health care.

Preparedness to Grow
Uncontrollable factors
Growth
Controllable factors
Markets trends
Competition
Quality of human resources
Infrastructure
Cultural and recreational amenities

Are We Prepared?Context for Northwest Tennessee
Future jobs will require broader skills Mathematics Communication Computer skills Analytical reasoning Creativity

Are We Prepared?Context for Northwest Tennessee
A broadly skilled workforce is more able to adapt to changing economic conditions. Very difficult to identify winners with any
degree of certainty. Workers with broad skills have better
chance of success. Workforce better prepared to take
advantage of opportunities that arise.

Final Thoughts
Growth is what happens to us.
Economic development is nurtured from within.

Business and Economic Research Center
www.mtsu.edu/~berc
Midstate Indicators
Tennessee’s Business
Global Commerce
Special studies and impact analyses


