

Notes on Logistic Notes on Logistic RegressionRegression
STAT 4330/8330
Introduction
Previously, you learned about odds ratios (OR’s).
We now transition and begin discussion of binary logistic regression. We will see that OR’s play an important role in the results of binary logistic models.
STAT4330/8330 PRIESTLEY
Binary Logistic Regression
Binary Logistic Regression is an appropriate when:1.The response variable is categorical w/ 2 categories (binary, dichotomous, etc.). The response categories are often generically labeled “success” or “failure”.2.One or more explanatory variables are involved. These can be either quantitative or categorical or a mixture of both.3.One is interested in assessing the relationship between the binary response and the explanatory variables and/or predicting the response category based on the value(s) of the explanatory variable(s).
STAT4330/8330 PRIESTLEY
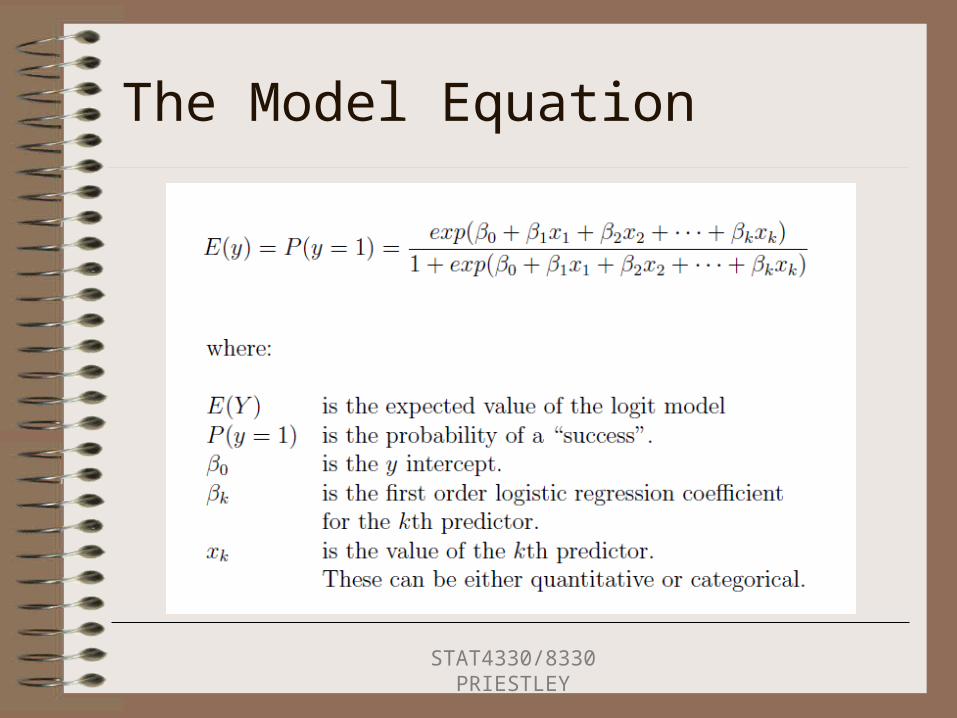
The Model Equation
STAT4330/8330 PRIESTLEY

The Model Equation
A few points:1.E(y) can never fall below 0 or above 1
(Remember: it is a probability!).2.The model is not a linear function of
the β parameters. This is a type of nonlinear regression model.
STAT4330/8330 PRIESTLEY
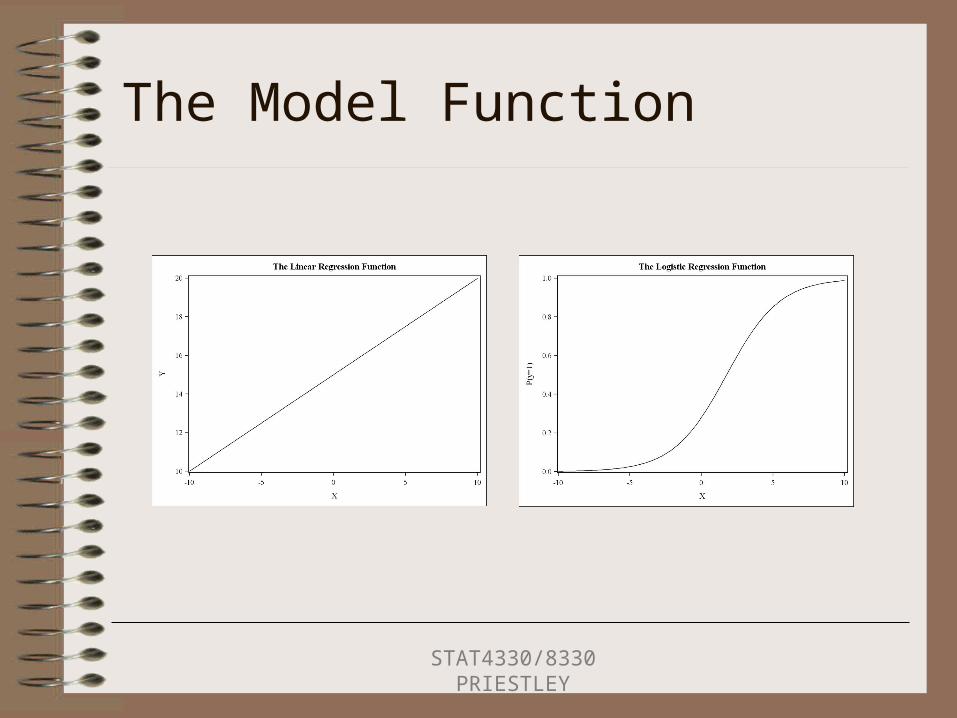
The Model Function
STAT4330/8330 PRIESTLEY
The Model Equation
Alternatively, the equation can be transformed to show that it models the natural logarithm of the odds of y = 1.
STAT4330/8330 PRIESTLEY
The Model Equation
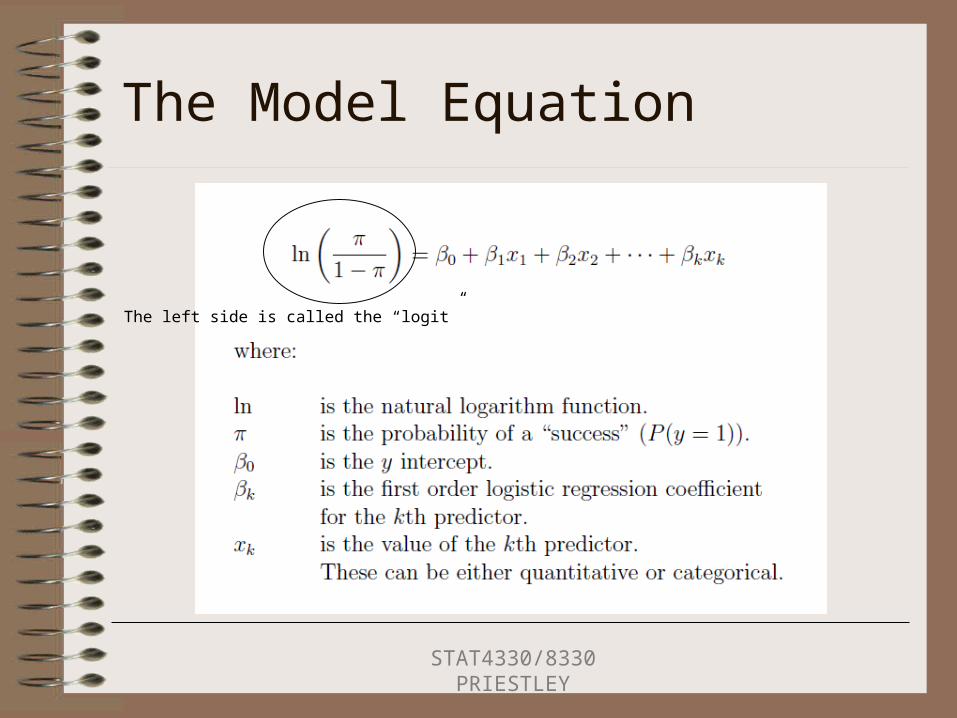
The left side is called the “logit”
STAT4330/8330 PRIESTLEY
The Model Equation
In general, the bi estimates the change in the log-odds when xi is increased by 1 unit, holding all other x’s in the model fixed.
Therefore, exp(bi) estimates the OR of a success for each additional 1-unit increase in xi.
Furthermore, (exp(bi)-1)*100 gives the percent increase in the odds of a success for each 1-unit increase in xi.
STAT4330/8330 PRIESTLEY

Model Fit Statistics
All of these statistics assess the model fit through the quality of the explanatory capacity of the model.
STAT4330/8330 PRIESTLEY
Model Fit Statistics
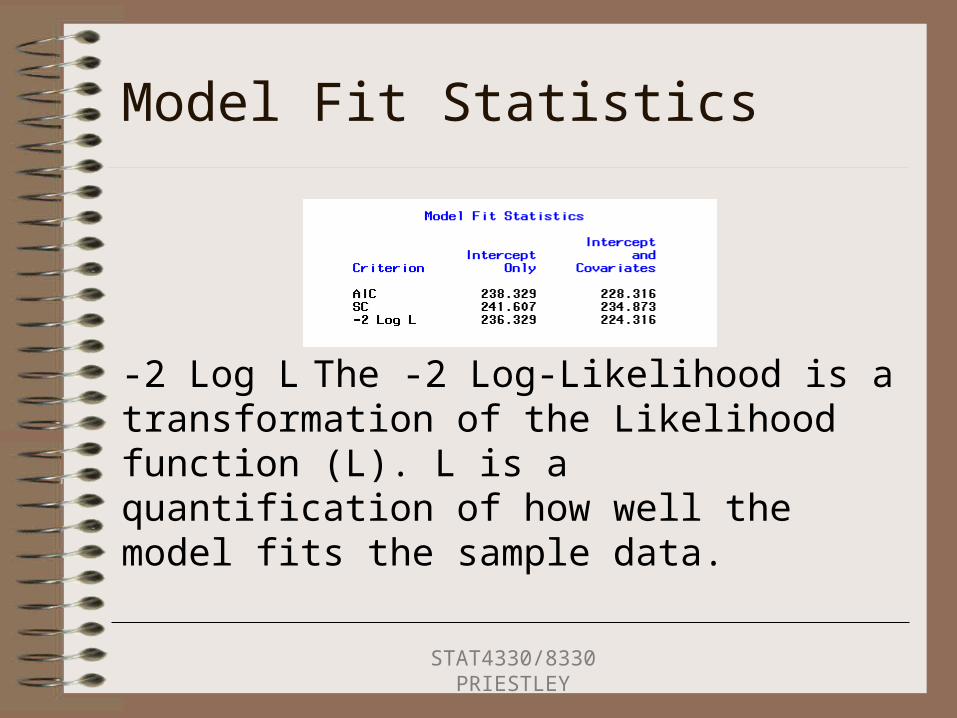
-2 Log L The -2 Log-Likelihood is a transformation of the Likelihood function (L). L is a quantification of how well the model fits the sample data.
STAT4330/8330 PRIESTLEY
Model Fit Statistics
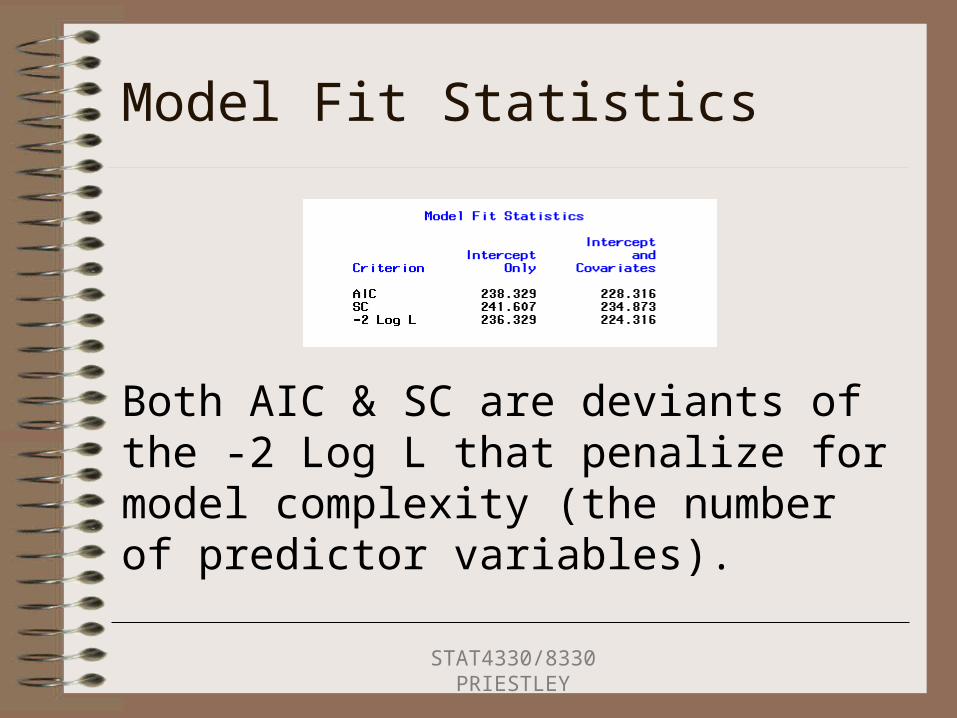
Both AIC & SC are deviants of the -2 Log L that penalize for model complexity (the number of predictor variables).
STAT4330/8330 PRIESTLEY

Model Fit Statistics
AIC Akaike Information Criterion. Used to compare non-nested models. Smaller is better. AIC is only meaningful in relation to another model’s AIC value.
STAT4330/8330 PRIESTLEY
Model Fit Statistics
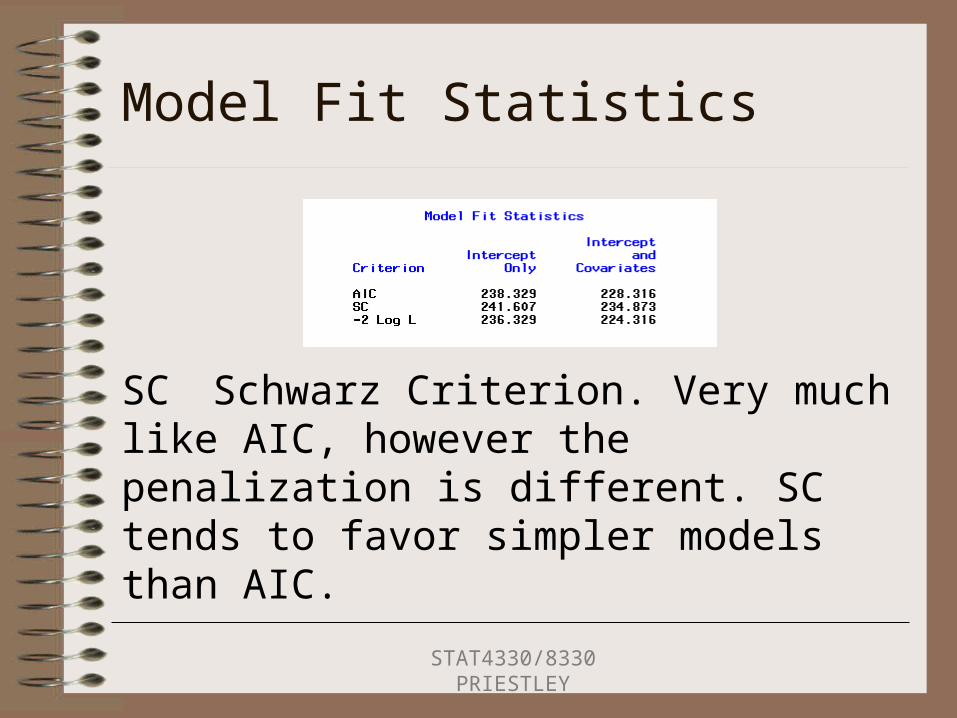
SC Schwarz Criterion. Very much like AIC, however the penalization is different. SC tends to favor simpler models than AIC.
STAT4330/8330 PRIESTLEY

Model Fit Statistics
Choose either AIC or SC (not both) and use the values under the heading ‘Intercept and Covariates’ to compare to competing models.
STAT4330/8330 PRIESTLEY

The model equation.
STAT4330/8330 PRIESTLEY
Inference: The Coefficients.
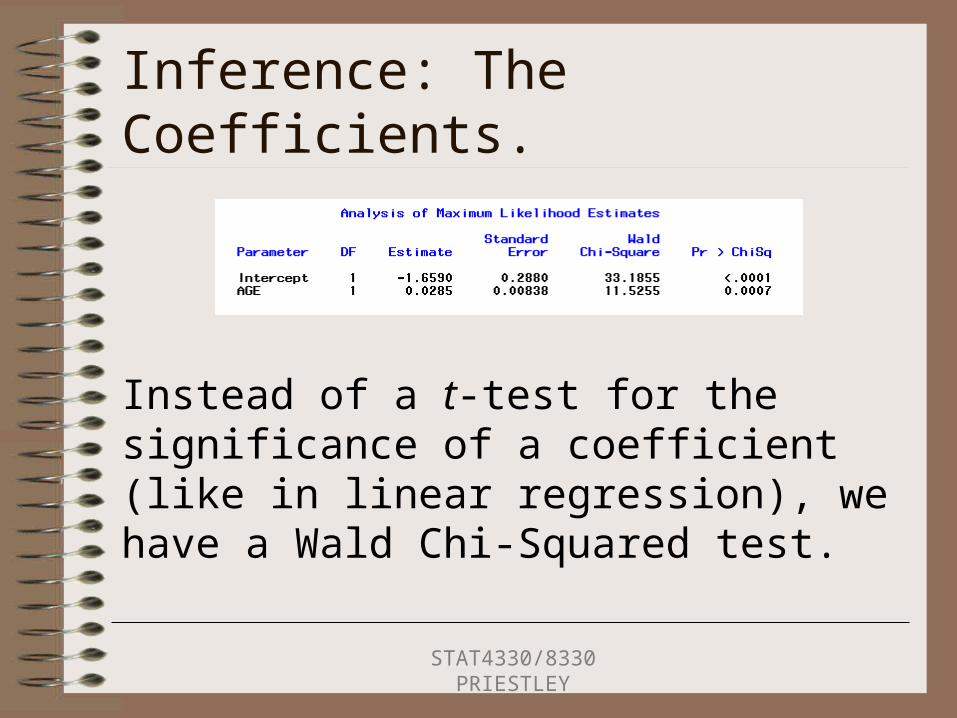
Instead of a t-test for the significance of a coefficient (like in linear regression), we have a Wald Chi-Squared test.
STAT4330/8330 PRIESTLEY

Inference: The Coefficients.
Remember, typically we do not evaluate the intercept, but rather focus on the test for each predictor.
STAT4330/8330 PRIESTLEY
Inference: The Coefficients.
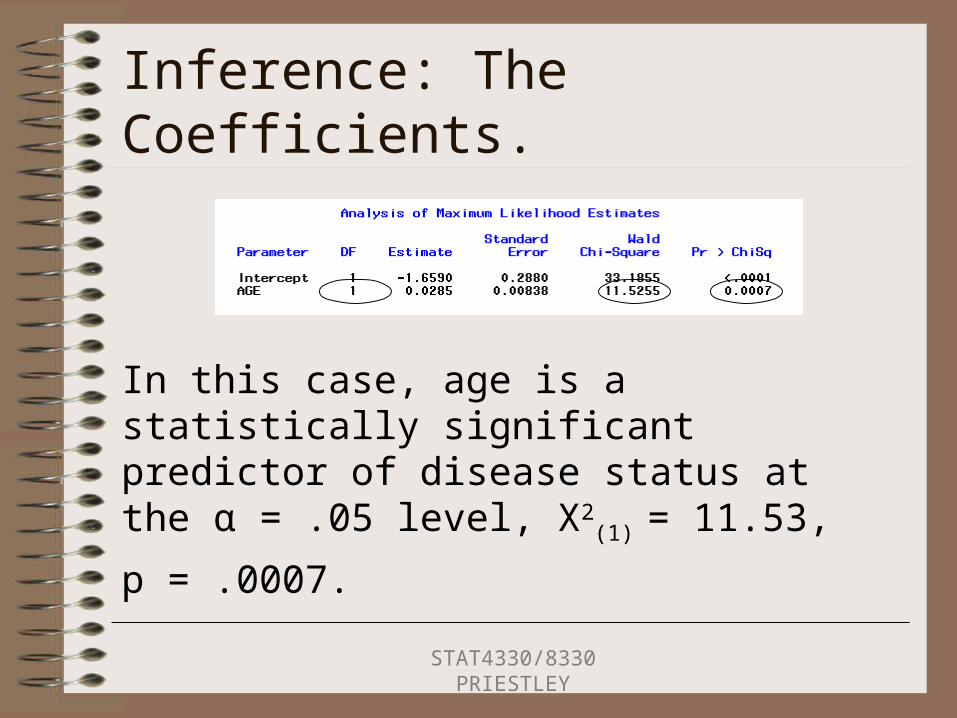
In this case, age is a statistically significant predictor of disease status at the α = .05 level, X2
(1) = 11.53,
p = .0007.
STAT4330/8330 PRIESTLEY

Inference: The Coefficients.
One can also obtain CI’s for the parameter estimates using CL option in the MODEL statement of PROC LOGISTIC.
STAT4330/8330 PRIESTLEY
Inference: The Coefficients.
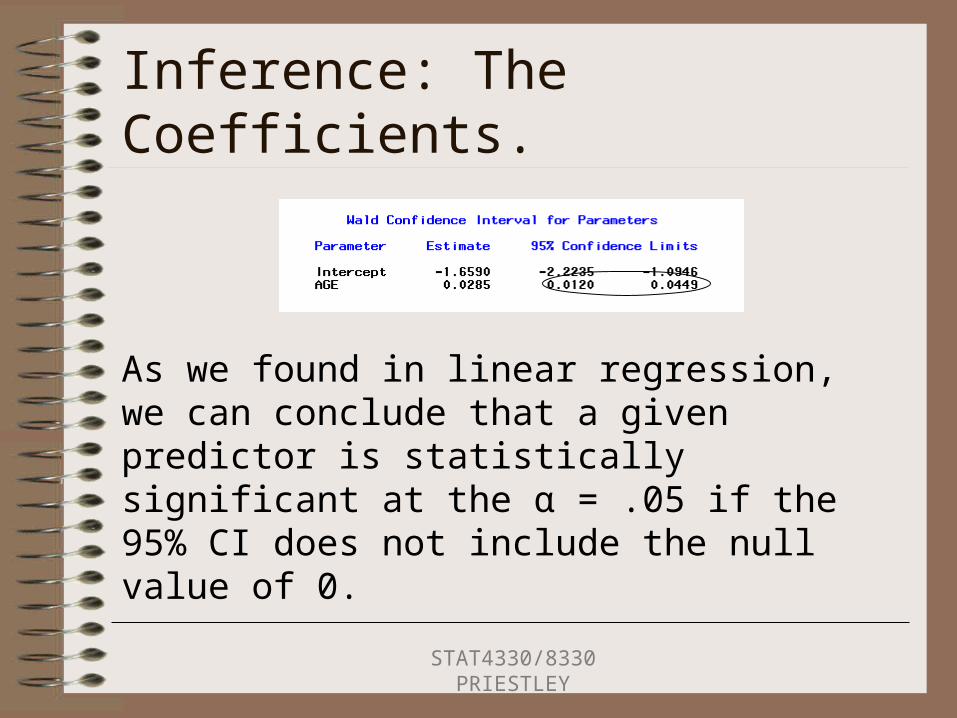
As we found in linear regression, we can conclude that a given predictor is statistically significant at the α = .05 if the 95% CI does not include the null value of 0.
STAT4330/8330 PRIESTLEY

Inference: The Coefficients.
Therefore, our best estimate of the change in the log-odds for age is 0.0285, however, we are 95% confident that that change lies between 0.0120 and 0.0449 for the population.
STAT4330/8330 PRIESTLEY
Inference: The Coefficients.
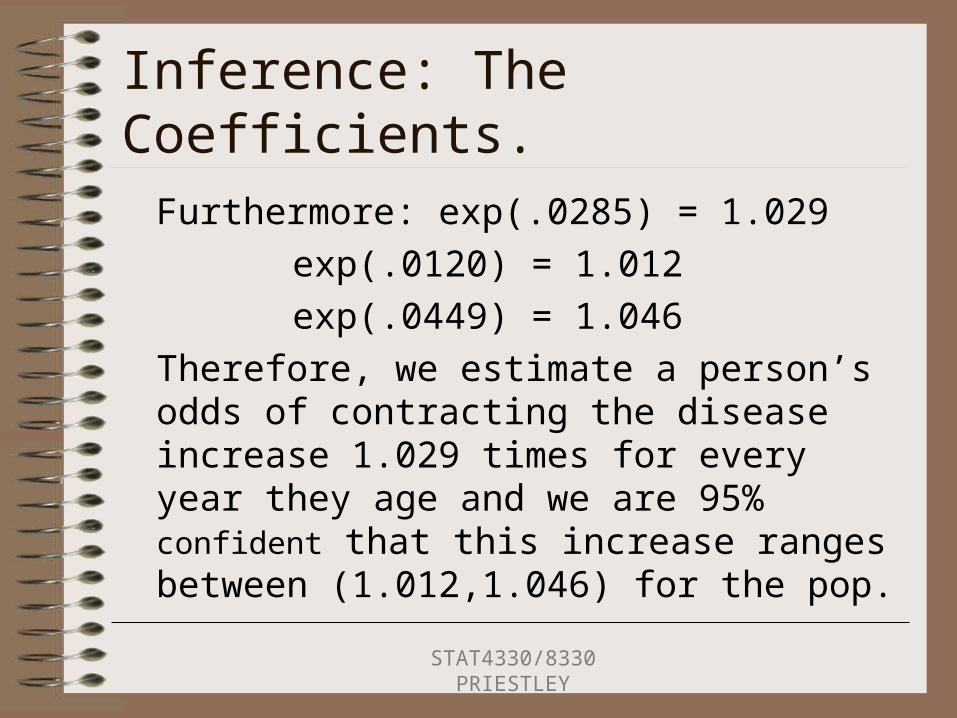
Furthermore: exp(.0285) = 1.029 exp(.0120) = 1.012 exp(.0449) = 1.046
Therefore, we estimate a person’s odds of contracting the disease increase 1.029 times for every year they age and we are 95% confident that this increase ranges between (1.012,1.046) for the pop.
STAT4330/8330 PRIESTLEY

Inference: The Coefficients.
Of course, we no longer have to compute these odds ratio estimates by hand, because SAS provides them for us.
STAT4330/8330 PRIESTLEY

Inference: The Coefficients.
Furthermore: (exp(.0285)-1)*100% = 2.89%.
(exp(.0120)-1)*100% = 1.21%
(exp(.0449)-1)*100% = 4.59%
We can state that the odds of contracting the disease increase by 2.89% with each additional year in age and we are 95% confident that this increase ranges between (1.21%,4.59%) for the pop.
STAT4330/8330 PRIESTLEY
Final Note: Model Fitting
Realize that in order to estimate the model parameters, the data must consist of a substantial number of each response category. For example, one will not be able to estimate the risk of contracting a disease if the data set does not contain any individuals who have been diagnosed with the disease.
STAT4330/8330 PRIESTLEY

Final Note: Model Fitting
Essentially, then, in order to estimate the probability of either a success or failure, the data set must contain a substantial number (> 30 is best) of observations that experienced a success and a substantial number that experienced a failure.
STAT4330/8330 PRIESTLEY
More about output.
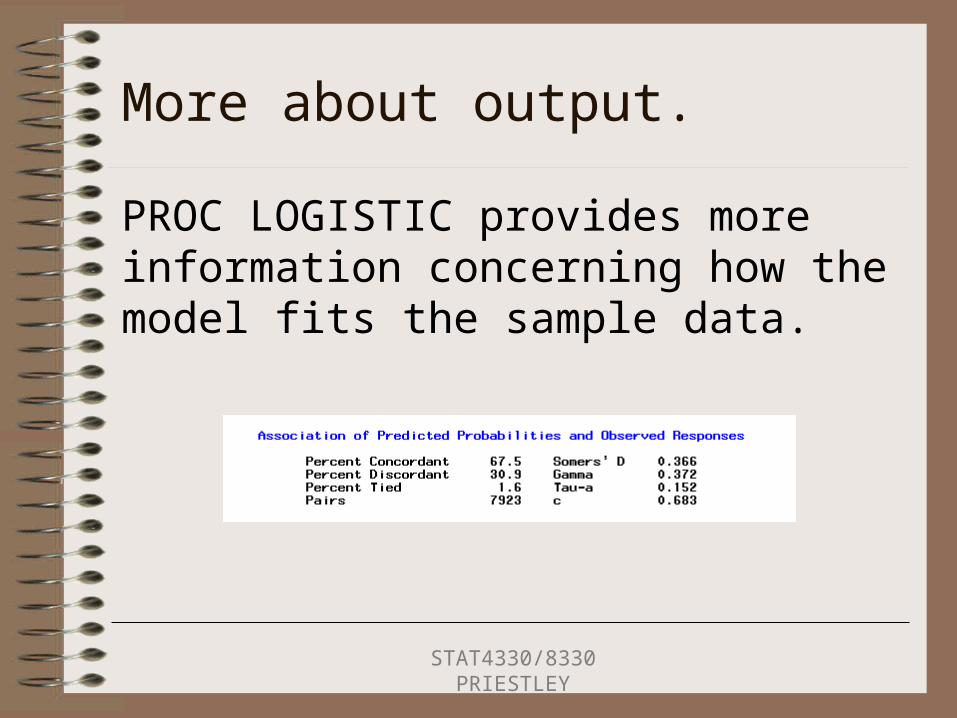
PROC LOGISTIC provides more information concerning how the model fits the sample data.
STAT4330/8330 PRIESTLEY
More about Model Fit
Percent ConcordantA pair of observations with
different observed responses is considered concordant if the observation with the lower ordered response value has a lower predicted value than the observation with a higher ordered response value.
STAT4330/8330 PRIESTLEY
More about Model Fit
Percent DiscordantA pair is considered discordant
if an observation with a lower ordered response value has a higher predicted value than an observation with a higher order response.
STAT4330/8330 PRIESTLEY

More about Model Fit
Percent TiedA pair with different responses
is considered tied if it is neither concordant nor discordant.
STAT4330/8330 PRIESTLEY
More about Model Fit
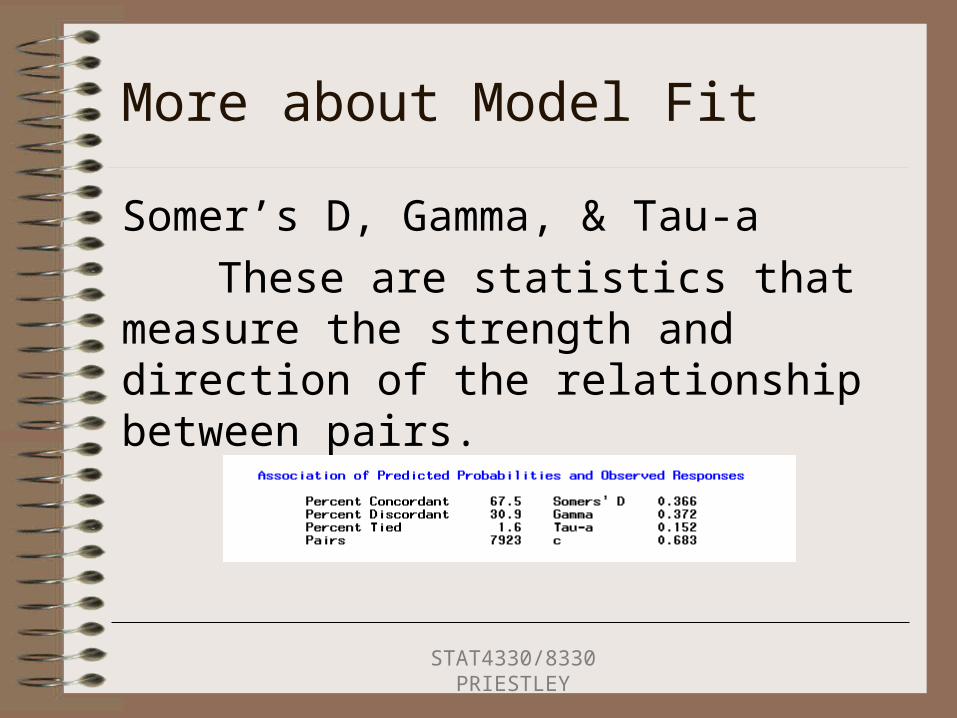
Somer’s D, Gamma, & Tau-aThese are statistics that
measure the strength and direction of the relationship between pairs.
STAT4330/8330 PRIESTLEY
More about Model Fit
Somer’s D & Tau-aLike r, these vary between -1.0
(all pairs discordant) & +1.0 (all pairs are concordant).
Somer’s D = the difference between the % concordant and the % discordant * 100.
STAT4330/8330 PRIESTLEY
More about Model Fit
GammaGamma is a similar statistic:
it’s values also range between -1.0 & +1.0, however the interpretation of these values is different: -1.0 = no association & + 1.0 = perfect association.
STAT4330/8330 PRIESTLEY

Predicted Values
The output of a logit model is the predicted probability of a success for each observation.
STAT4330/8330 PRIESTLEY
Predicted Values
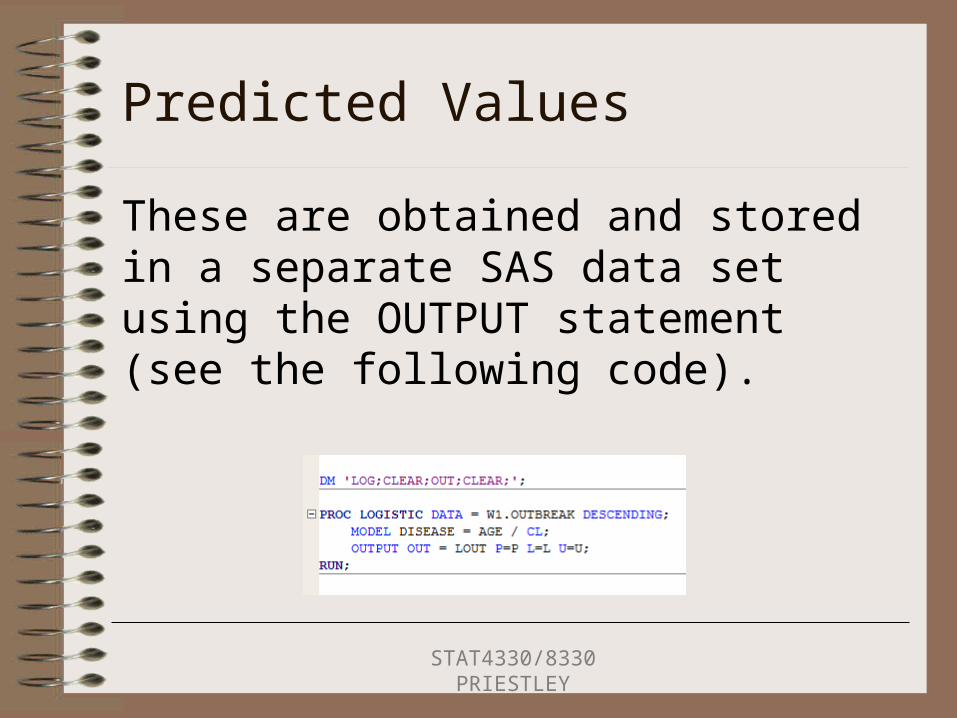
These are obtained and stored in a separate SAS data set using the OUTPUT statement (see the following code).
STAT4330/8330 PRIESTLEY
Predicted Values
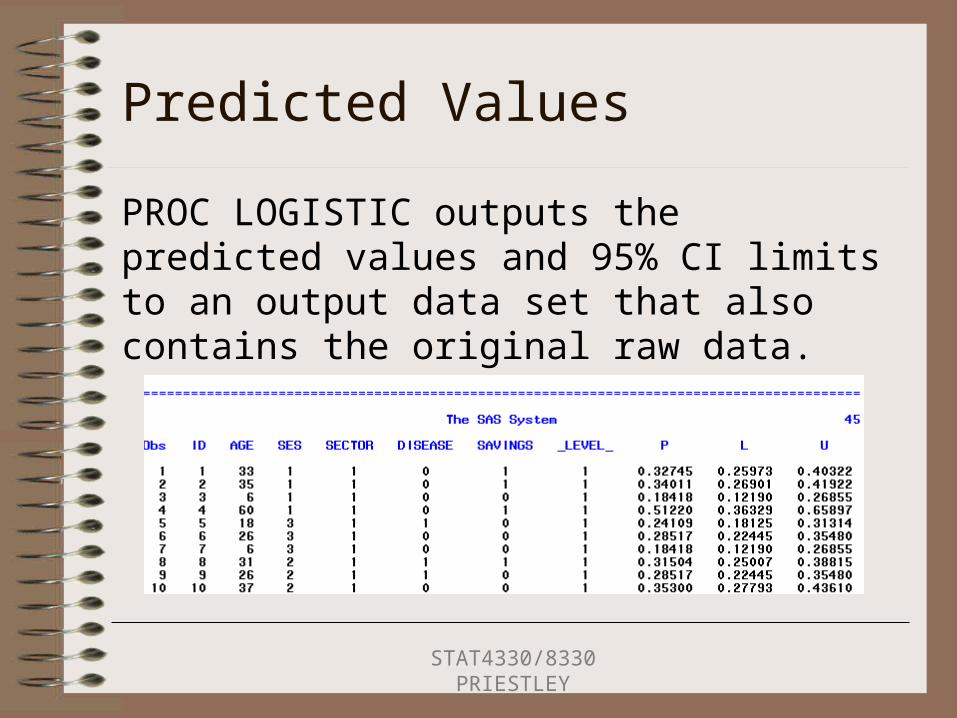
PROC LOGISTIC outputs the predicted values and 95% CI limits to an output data set that also contains the original raw data.
STAT4330/8330 PRIESTLEY
Predicted Values
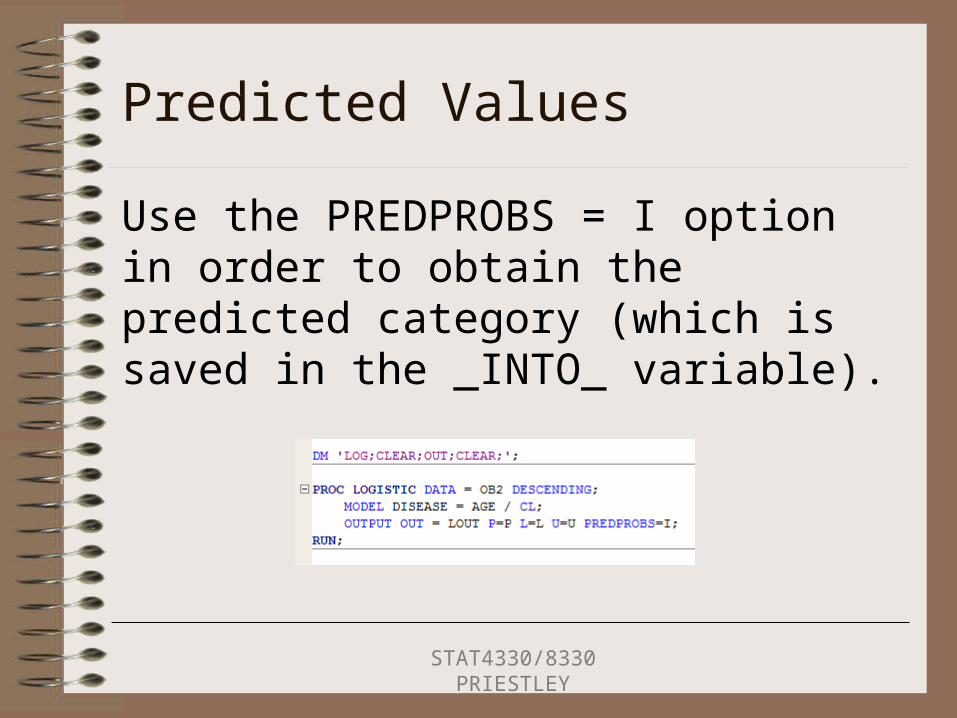
Use the PREDPROBS = I option in order to obtain the predicted category (which is saved in the _INTO_ variable).
STAT4330/8330 PRIESTLEY

Predicted Values
_FROM_ = The observed response category = The same value as the response variable.
STAT4330/8330 PRIESTLEY

Predicted Values
_INTO_ = The predicted response category.
STAT4330/8330 PRIESTLEY

Predicted Values
IP_1 = The Individual Probability of a response of 1.
STAT4330/8330 PRIESTLEY
Scoring Observations in SAS
Obtaining predicted probabilities and/or predicted outcomes (categories) for new observations (i.e., scoring new observations) is done in logit modeling using the same procedure we used in scoring new observations in linear regression.
STAT4330/8330 PRIESTLEY
Scoring Observations in SAS
1. Create a new data set with the desired values of the x variables and the y variable set to missing.
2. Merge the new data set with the original data set.
3. Refit the final model using PROC LOGISTIC using the OUTPUT statement.
STAT4330/8330 PRIESTLEY
Classification Table & Rates
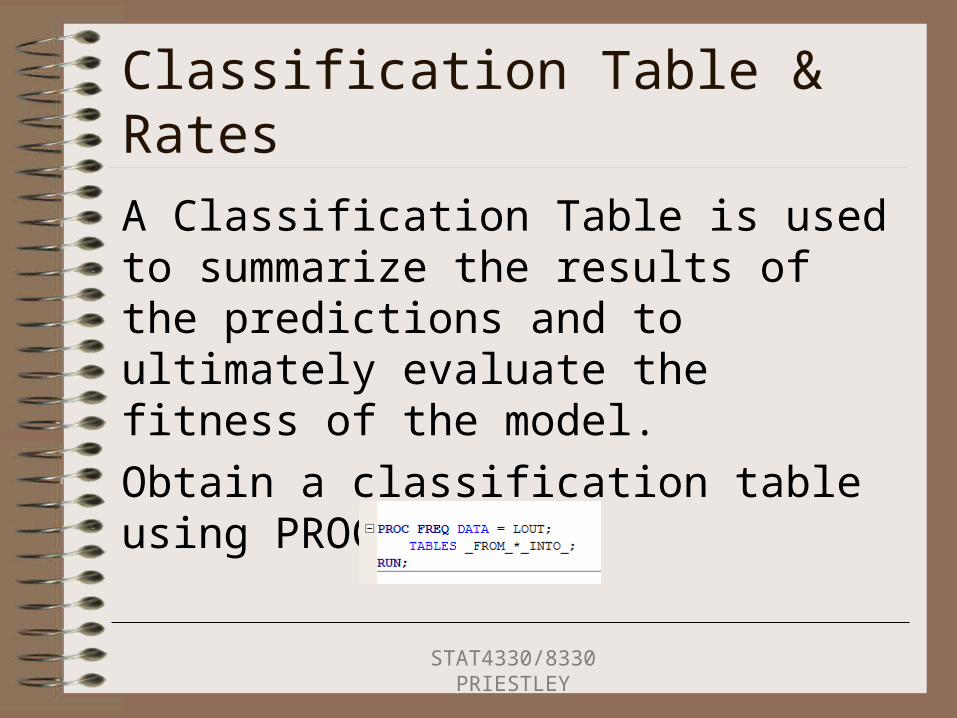
A Classification Table is used to summarize the results of the predictions and to ultimately evaluate the fitness of the model.Obtain a classification table using PROC FREQ.
STAT4330/8330 PRIESTLEY
Classification Table & Rates
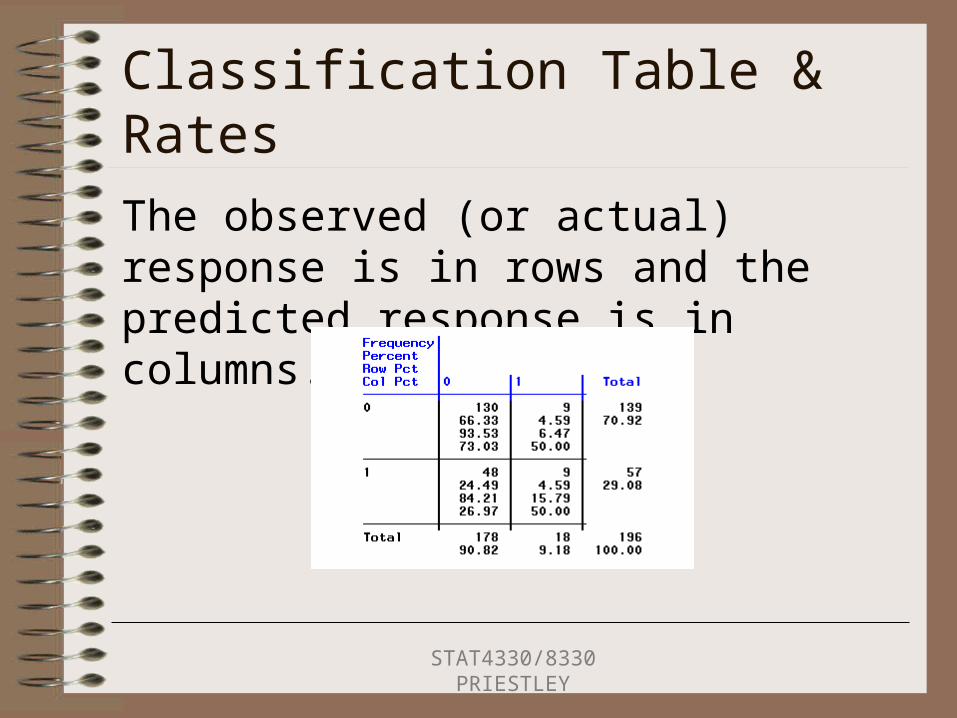
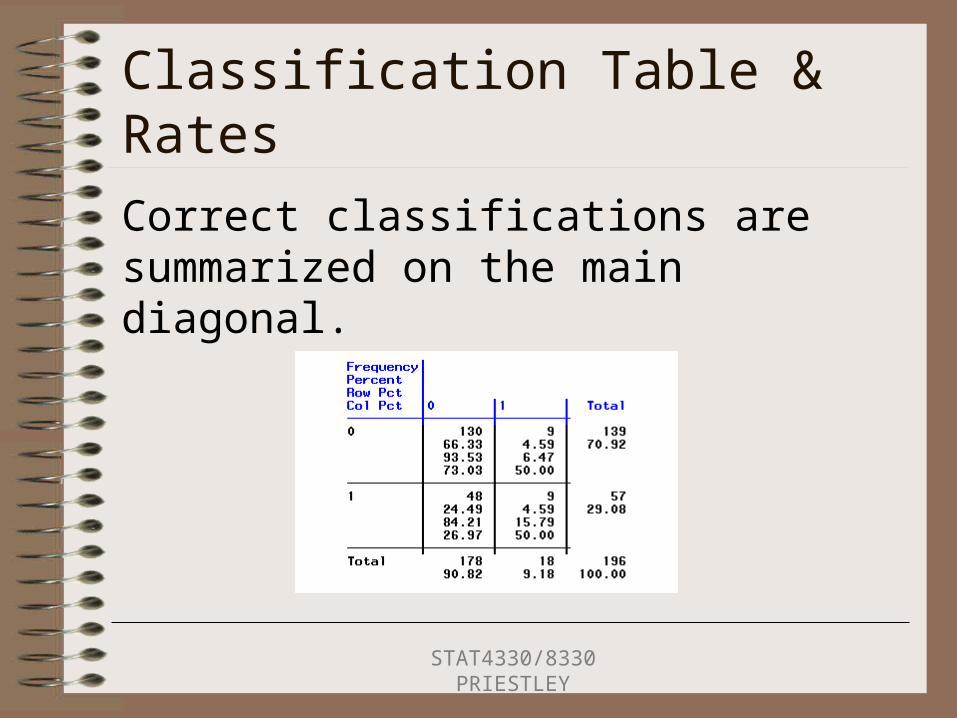
The observed (or actual) response is in rows and the predicted response is in columns.
STAT4330/8330 PRIESTLEY
Classification Table & Rates
Correct classifications are summarized on the main diagonal.
STAT4330/8330 PRIESTLEY
Classification Table & Rates
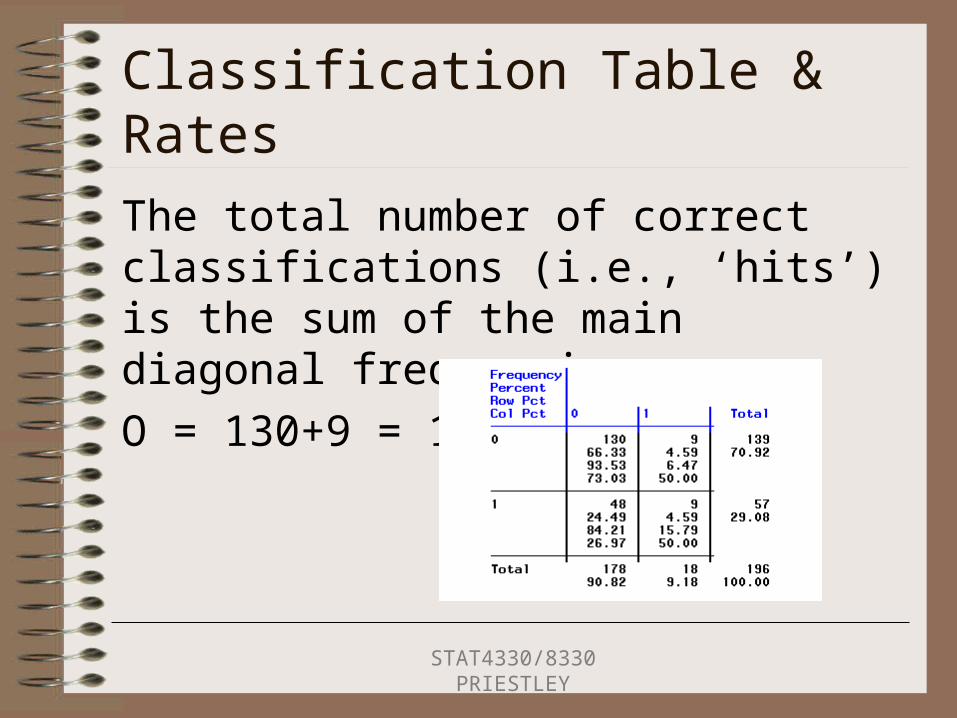
The total number of correct classifications (i.e., ‘hits’) is the sum of the main diagonal frequencies.O = 130+9 = 139
STAT4330/8330 PRIESTLEY
Classification Table & Rates
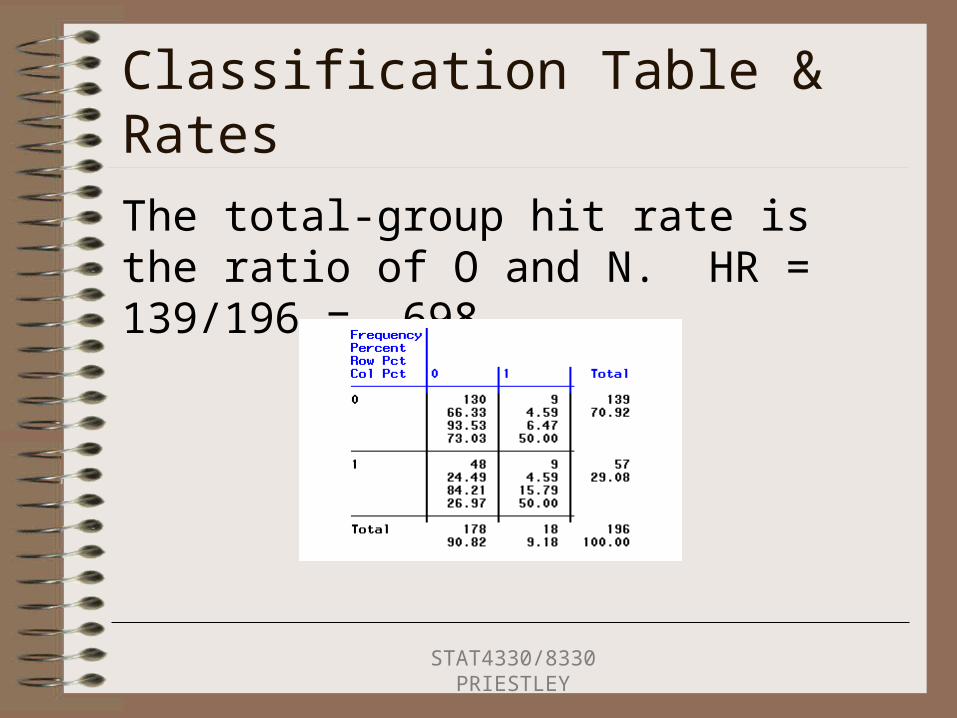
The total-group hit rate is the ratio of O and N. HR = 139/196 = .698
STAT4330/8330 PRIESTLEY

Classification Table & Rates
Individual group hit rates can also be calculated. These are essentially the row percents on the main diagonal.
STAT4330/8330 PRIESTLEY


