

(now Swachh Bharat Mission)
Public Affairs Foundation
Implementation of a Citizen Report Card (CRC-1) as a part of
Improving Consumer Voices and Accountability in the Nirmal Bharat Abhiyan
(now Swachh Bharat Mission)
Report of Findings
Submitted to
Public Affairs Centre
[For Feedback, please contact Meena Nair at [email protected]]
March 2015

i Public Affairs Foundation| CRC-1 Tamil Nadu and Odisha| PAC/BMGF| March 2015
Table of Contents
List of Abbreviations ............................................................................................................................... v
Executive Summary ................................................................................................................................. 1
Section 1: Introduction ......................................................................................................................... 10
Background of the Study ............................................................................................................... 12
Objectives of the Citizen Report Card (CRC) ................................................................................. 13
Implementation of CRC-1.............................................................................................................. 14
Outline of the CRC-1 Report ......................................................................................................... 15
Section 2: Methodology ........................................................................................................................ 16
Section 3: Key Findings - Thematic Analyses ........................................................................................ 31
Theme 1: What is the Life-span of a TSC/NBA Toilet? .................................................................. 33
Theme 2: Is Lack of Water an Impediment to Improving Toilet Usage? ...................................... 41
Theme 3: (A) Rural Sanitary Marts (RSMs) under the NBA - Did Beneficiaries Use Them?.......... 50
Theme 4: Beneficiary experience of corruption while building a toilet under the NBA ............... 60
Theme 5: Vulnerability of Socially and Economically Disadvantaged Groups .............................. 67
Theme 6: Are IEC Activities Contributing to Awareness of Sanitation and the NBA Program? ... 74
Section 4a: Salient findings from Household Survey of TSC/NBA Beneficiaries in Tamil Nadu ............ 82
1. Socio- Economic Profile of Households .................................................................................... 83
2. Awareness on Sanitation .......................................................................................................... 89
3. Access, usage, quality and reliability of services provided under TSC/NBA ............................. 91
4. Usage of toilet ........................................................................................................................... 99
5. Problems faced and Grievance Redress .................................................................................. 100
6. Level of corruption in the process of toilet construction ....................................................... 101
7. Satisfaction of respondents on features of NBA ..................................................................... 101
8. Household attitude and behaviour towards toilet construction and usage ........................... 103
9. Observation of the toilet ......................................................................................................... 103
Section 4b: Salient findings from Household Survey of TSC/NBA Beneficiaries in Odisha ................. 105
1. Socio-Economic Profile of Households ........................................................................................... 106
2. Awareness on sanitation ................................................................................................................. 112
3. Access, usage, quality and reliability of services provided under TSC/NBA ................................... 114
4. Usage of toilet ................................................................................................................................. 122
5. Problem and Grievance Redress ..................................................................................................... 123
ii Public Affairs Foundation| CRC-1 Tamil Nadu and Odisha| PAC/BMGF| March 2015
6. Extra Payments Made by Beneficiaries ........................................................................................... 123
7. Level of Satisfaction of respondents on the features of NBA ......................................................... 127
8. Household attitude and behaviour towards toilet construction and usage ................................... 128
9. Observation of the toilet ................................................................................................................. 129
Section 5a: Findings from Officials’ interviews in Tamil Nadu ............................................................ 130
Section 5b: Findings from Officials’ interviews in Odisha ................................................................... 143
List of Tables
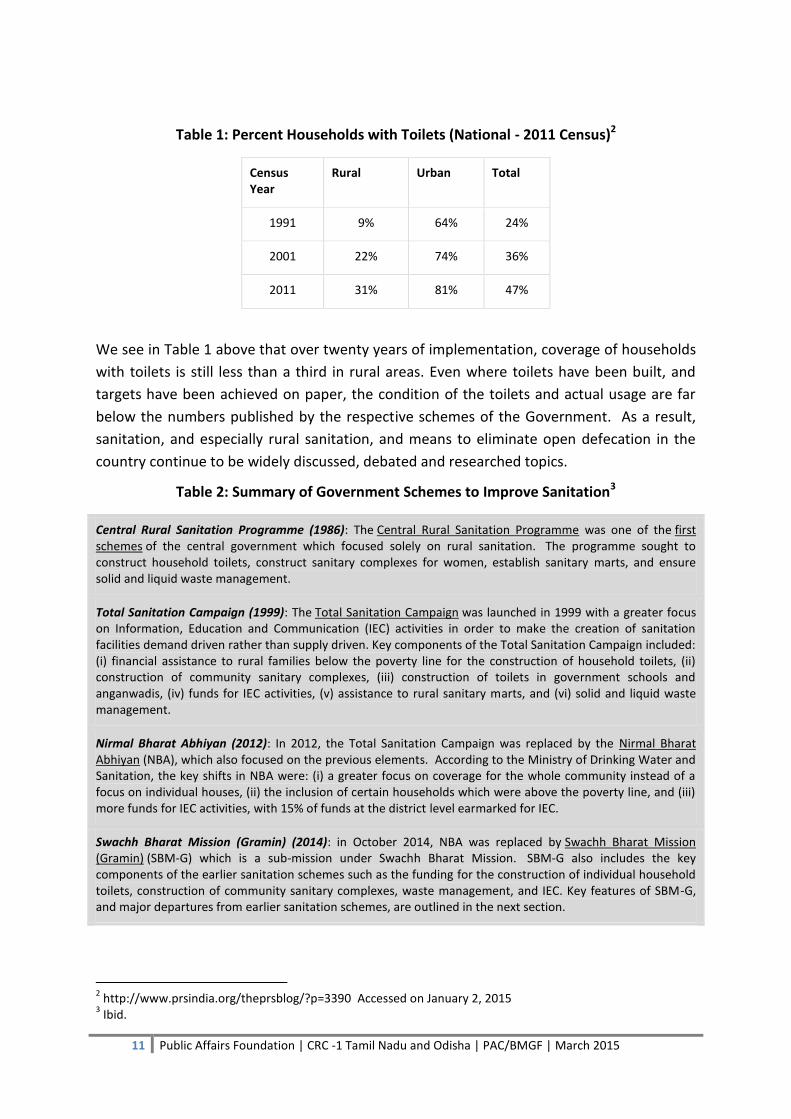
Table 1: Percent Households with Toilets (National - 2011 Census) .................................................................... 11
Table 2: Summary of Government Schemes to Improve Sanitation .................................................................... 11
Table 3: Percent of Rural Households with Toilets - Select States (2011 Census) ................................................ 13
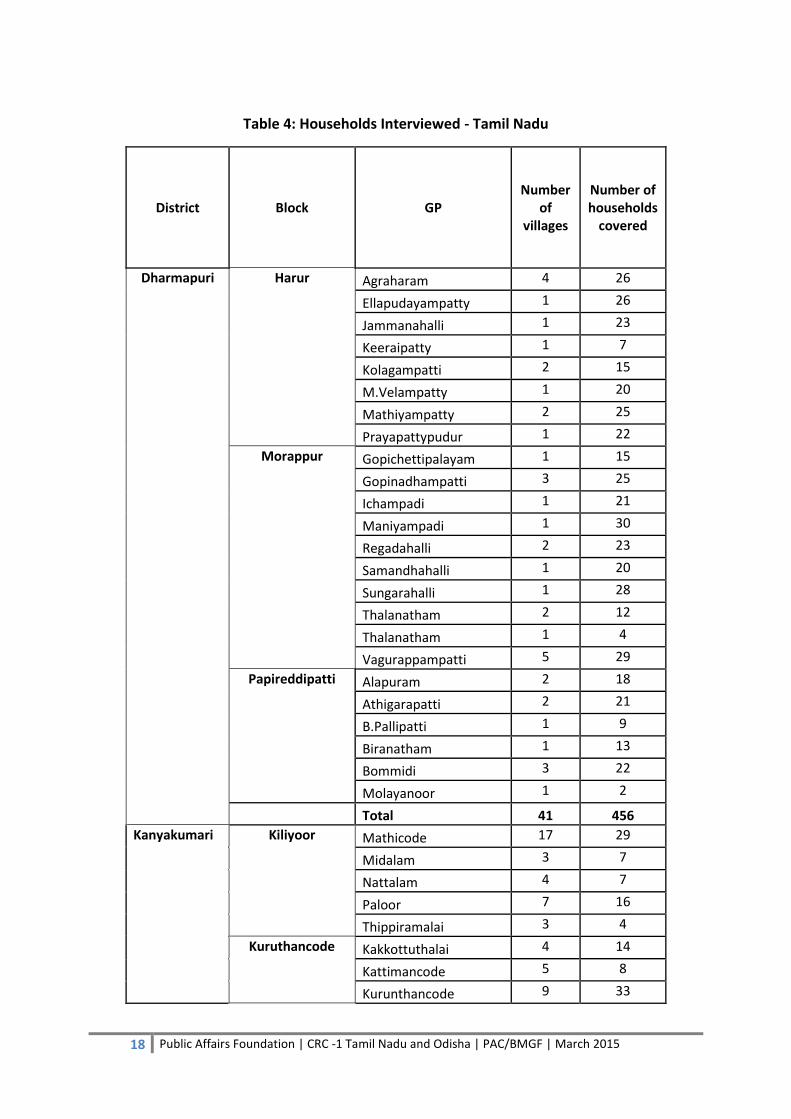
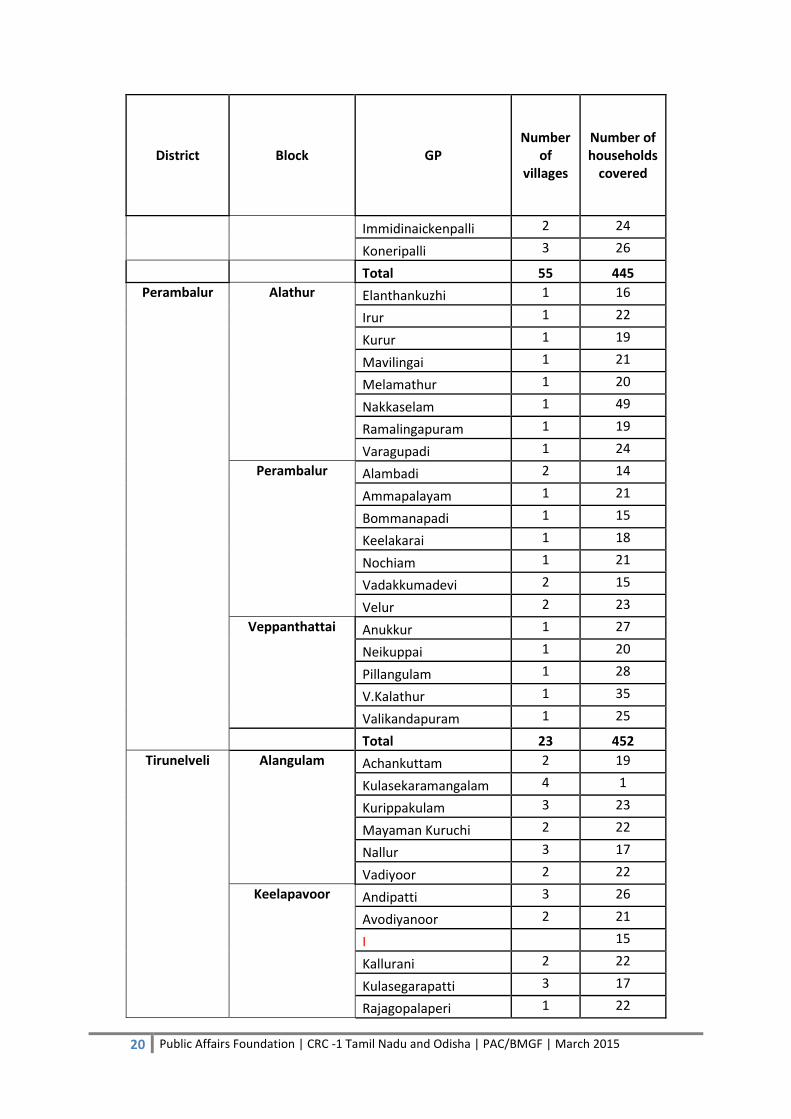
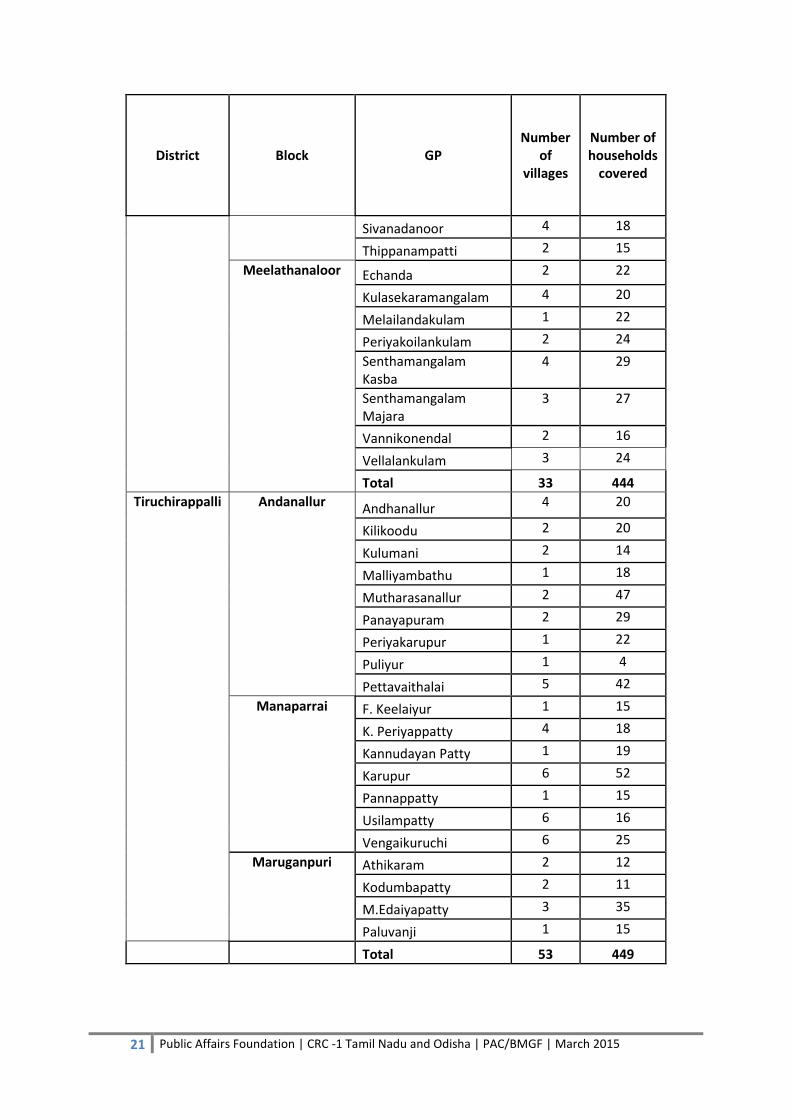
Table 4: Households Interviewed - Tamil Nadu .................................................................................................... 18
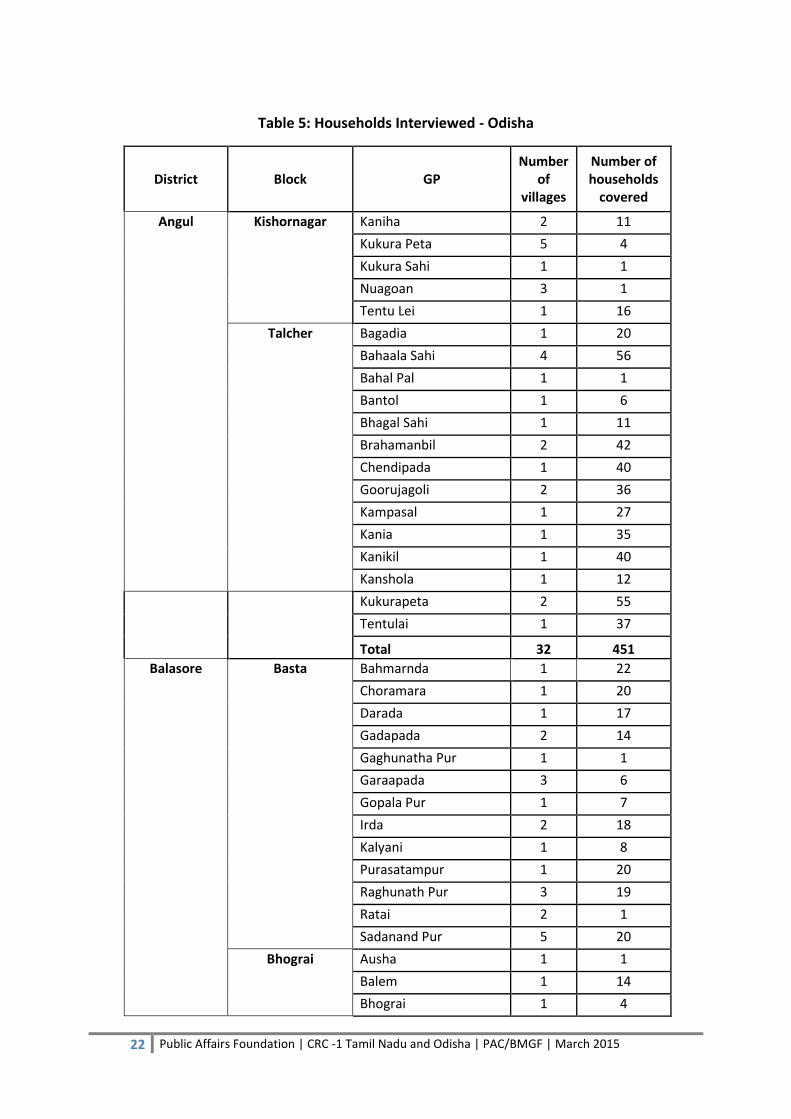
Table 5: Households Interviewed - Odisha ........................................................................................................... 22
Table 6: Summary of Sample Sizes - Tamil Nadu and Odisha ............................................................................... 27
Table 7: Sample Size for Officials Interviews by State .......................................................................................... 27
Table 8: Percentage of Households with Toilets (National - 2011 Census) .......................................................... 33
Table 9: Percentage of Rural Households with Toilets (2011 Census) ................................................................. 33
Table 10: Year Toilet Built ..................................................................................................................................... 34
Table 11: Reported Toilet Usage .......................................................................................................................... 42
Table 12: Total Water Usage per Day by District - Tamil Nadu ............................................................................ 43
Table 13: Total Water Usage per Day by District - Odisha.................................................................................... 44
Table 14: Use of Water for Sanitation .................................................................................................................. 45
Table 15: Water Piped Into Dwelling or Yard - Odisha ......................................................................................... 46
Table 16: Water Piped Into Dwelling or Yard - Tamil Nadu .................................................................................. 47
Table 17: Self-Arranged Materials vs. Overall Satisfaction by Socio-Economic Levels ......................................... 55
Table 18: Condition of the Toilet vs. Who Built the Toilet ................................................................................... 57
Table 19: Usage of Toilet vs. Who Built the Toilet ................................................................................................ 58
Table 20: Usage vs. Who Built the Toilet - by District (Odisha) ............................................................................ 58
Table 21: Usage vs. Who Built the Toilet - By District (Tamil Nadu) ..................................................................... 59
Table 22: Awareness of the TSC/NBA Incentive ................................................................................................... 68
Table 23: Condition of NBA Toilet by Socio-Economic Groups ............................................................................. 69
Table 24: Who Built the Toilet by Socio-Economic Groups .................................................................................. 70
Table 25: Households that Paid Extra Money to Avail of NBA Benefits ............................................................... 71
Table 26: Percent Overall Satisfied with the Toilet Construction under NBA ...................................................... 72
Table 27: Sample size of the areas under study in Tamil Nadu ............................................................................ 83
Table 28: Education Levels of Other Members of the Household - Tamil Nadu .................................................. 84
Table 29: Commencement of toilet construction ................................................................................................ 91
Table 30: Construction vs Condition of Toilet ...................................................................................................... 93
Table 31: Incentives for each Individual Household Latrine in Tamil Nadu ......................................................... 95
Table 32: Extra money spent and total cost of toilet construction ...................................................................... 96
Table 33: Amount borrowed for toilet construction ............................................................................................ 97
Table 34: Presence of an electric bulb inside the toilet ..................................................................................... 104
iii Public Affairs Foundation| CRC-1 Tamil Nadu and Odisha| PAC/BMGF| March 2015
Table 35: Sample Size of the areas under study ................................................................................................. 106
Table 36: Level of education of other members within the Household ............................................................. 107
Table 37: Commencement of toilet construction .............................................................................................. 114
Table 38: Construction vs Condition of Toilet .................................................................................................... 116
Table 39: Unit Cost of IHHL in Odisha (Rupees).................................................................................................. 118
Table 40: Extra money and total money spent on toilet construction ............................................................... 119
Table 41: Amount borrowed for toilet construction .......................................................................................... 120
Table 42: Officials' interviewed by District - Tamil Nadu .................................................................................... 130
Table 43: Officials interviewed at various levels ................................................................................................ 133
Table 44: Problems faced by potential beneficiaries ......................................................................................... 135
Table 45: Reasons for increase in applications for toilet construction under NBA in Tamil Nadu ..................... 138
Table 46: Position held by the officials interviewed ........................................................................................... 140
Table 47: Officials interviewed by District .......................................................................................................... 143
Table 48: Officials in-charge of contacting beneficiaries .................................................................................... 145
Table 49: Officials interviewed at various levels ................................................................................................ 146
Table 50: Reasons for increase in applications for NBA ..................................................................................... 151
Table 51: Reasons for no increase in applications for NBA ................................................................................ 151
Table 52: Position held by the officials interviewed ........................................................................................... 153
List of Figures
Figure 1: Condition of TSC/NBA Toilets Built Between 2010 and 2014 ................................................................ 35
Figure 2: District Variations in Average Domestic Water Usage Per day (No. of Pots/Buckets) .......................... 45
Figure 3: Number of Trips per Day to Fetch Water .............................................................................................. 47
Figure 4: Distance Travelled Per Trip to Fetch Water ........................................................................................... 48
Figure 5: Reports of Lack of Water as a Problem by Social Group ....................................................................... 49
Figure 6: Awareness of RSMs in Odisha ............................................................................................................... 51
Figure 7: Who Arranged Materials? ..................................................................................................................... 51
Figure 8: If Materials Arranged by Self, Who Helped? ......................................................................................... 52
Figure 9: Who Arranged Materials vs. Percent Satisfied with NBA - Odisha ........................................................ 53
Figure 10: Who Arranged Materials vs. Percent Satisfaction with NBA - Tamil Nadu .......................................... 54
Figure 11: Who Built the TSC/NBA Toilet for the Beneficiary? ............................................................................. 56
Figure 12: Direct Corruption Experienced by Respondents (Extra Payments Made) ........................................... 61
Figure 13: Respondents Reporting Receipt of Wages for NBA Related NREGA Work-Days on the Job-Card -
Tamil Nadu ................................................................................................................................................... 64
Figure 14: Caste wise distribution ........................................................................................................................ 83
Figure 15: Age wise distribution of respondents .................................................................................................. 84
Figure 16: Household ownership of assets ........................................................................................................... 85
Figure 17: Main fuel used for cooking .................................................................................................................. 86
Figure 18: Economic Status of HHs ....................................................................................................................... 87
Figure 19: Household Annual Income .................................................................................................................. 87
Figure 20: Sources of water: Drinking purposes* ................................................................................................. 88
Figure 21: Sources of water: Domestic purposes* ............................................................................................... 88
Figure 22: Sources of Information on Toilet Construction ................................................................................... 89
Figure 23: Impact of exposure to NBA .................................................................................................................. 90
Figure 24: Household toilet status........................................................................................................................ 92
Figure 25: Status of toilets .................................................................................................................................... 92
Figure 26: Usage vs who built the toilet .............................................................................................................. 93
Figure 27: Ease of using the toilet ........................................................................................................................ 95

iv Public Affairs Foundation| CRC-1 Tamil Nadu and Odisha| PAC/BMGF| March 2015
Figure 28: Receiving the incentive ........................................................................................................................ 98
Figure 29: Stage of receiving the incentive .......................................................................................................... 98
Figure 30: Toilet Usage by Family Members ........................................................................................................ 99
Figure 31: Reasons for open defecation ............................................................................................................. 100
Figure 32: Respondents Reporting Payment of Extra Money ............................................................................ 101
Figure 33: Overall satisfaction with the toilet construction process* ................................................................ 102
Figure 34: Age wise distribution of respondents ................................................................................................ 106
Figure 35: Distribution of Respondents by Social Group .................................................................................... 107
Figure 36: Economic Status of Households ........................................................................................................ 108
Figure 37: Household annual income ................................................................................................................ 108
Figure 38: Household assets* ............................................................................................................................. 109
Figure 39: Primary fuel used for cooking ............................................................................................................ 110
Figure 40: Main source of water: Drinking purposes* ....................................................................................... 110
Figure 41: Main source of water: Domestic purposes* ...................................................................................... 111
Figure 42: Sources of information on toilet construction .................................................................................. 112
Figure 43: Wall paintings on sanitation outside offices in Odisha ...................................................................... 113
Figure 44: Impact of exposure to NBA ................................................................................................................ 113
Figure 45: Household toilet status...................................................................................................................... 115
Figure 46: Usage vs who built the toilet ............................................................................................................. 116
Figure 47: Receiving the incentive* ................................................................................................................... 120
Figure 48: Stage of receiving the incentive* ...................................................................................................... 121
Figure 49: Toilet usage by family members ........................................................................................................ 122
Figure 50: Reasons for open defecation ............................................................................................................. 122
Figure 51: Problems faced during the construction of the toilet ....................................................................... 123
Figure 52: Extra Payments made by Beneficiaries across districts in Odisha .................................................... 124
Figure 53: Overall satisfaction with the toilet construction process .................................................................. 127
Figure 54: Organogram for Kanyakumari .......................................................................................................... 131
Figure 55: Official contacted to apply for NBA ................................................................................................... 132
Figure 56: Information on eligibility and subsidy amount for NBA ................................................................... 132
Figure 57: Officials handling grievance redressal* ............................................................................................. 135
Figure 58: Medium Used for IEC activities.......................................................................................................... 137
Figure 59 Individuals conducting IEC activities ................................................................................................... 138
Figure 60: Overall satisfaction with the services under NBA/TSC ...................................................................... 142
Figure 61: Organogram Balasore ........................................................................................................................ 144
Figure 62: Official contacted to apply for NBA ................................................................................................... 145
Figure 63: Information on eligibility and subsidy amount under NBA ............................................................... 146
Figure 64: Officials handling grievance redressal ............................................................................................... 149
Figure 65: Media for IEC activities ...................................................................................................................... 151
Figure 66: Overall Satisfaction with features of TSC/NBA .................................................................................. 155
Figure 67: Levels of satisfaction with the various services of NBA ..................................................................... 156
v Public Affairs Foundation| CRC-1 Tamil Nadu and Odisha| PAC/BMGF| March 2015
List of Abbreviations
APL Above Poverty Line
BDO Block Development Officer
BMGF Bill and Melinda Gates Foundation
BRCC Block Resources Centre Coordinator
BPL Below Poverty Line
CAPI Computer Aided Personal Interview
CRC Citizen Report Card
CRCC Cluster Resources Centre Coordinator
CRSP Central Rural Sanitation Programme
CSC Community Score Card
DEO Data Entry Operator
DPC District Project Coordinator
FGD Focus Group Discussion
GP Gram Panchayat
GS Gram Sathi
HH Household
IEC Information, Education Communication
IHHL Individual Household Latrine
JE Junior Engineer
MECOM Monitoring and & Evaluation Coordinator
MIS Management Information Systems
NBA Nirmal Bharat Abhiyan
NREGA National Rural Employment Generation Scheme (Also known as
MGNREGA)
OD Open Defecation
PAC Public Affairs Centre
PAF Public Affairs Foundation
RSM Rural Sanitary Mart
RWO Rural Welfare Officer
SD Swachchata Doot
SBM Swachch Bharat Mission
TN Tamil Nadu
TSC Total Sanitation Campaign
VLW Village Level Worker

vi Public Affairs Foundation| CRC-1 Tamil Nadu and Odisha| PAC/BMGF| March 2015
[page left blank]
1 Public Affairs Foundation| CRC-1 Tamil Nadu and Odisha| PAC/BMGF| March 2015
Executive Summary
A Citizen Report Card (CRC) exercise was conducted in six districts each of two states, Tamil
Nadu and Odisha, to gather citizen feedback on sanitation. Specifically, citizens who had
built an Individual Household Latrine (IHHL) in the last five years using the NBA incentive (or
the earlier TSC) constituted the respondents pool for the CRC survey. The intent was to
study citizen voices in the Nirmal Bharat Abhiyan (NBA), as a part of Public Affair Centre's
BMGF-funded larger study, Improving Consumer Voices and Accountability in the Nirmal
Bharat Abhiyan. The NBA being a flagship demand driven initiative of the Central
Government to improve sanitation coverage, this study set out to examine whether and
how much the consumers/beneficiaries of the scheme had avenues for engagement with
the process of building a household toilet in their homes.
A detailed questionnaire was administered to beneficiaries across the twelve districts,
recording their experience of seeking the NBA incentive, interacting with the NBA officials,
building a toilet, using the toilet and, satisfaction with the entire process from application to
construction. The districts chosen by PAC were roughly, the two top performers, two middle
and two low performers of the NBA program in their respective states. Similarly, the states
too are a relatively better performer (Tamil Nadu) and a poor performer (Odisha) in the NBA
program.
Officials' interviews at every level of the NBA implementation - ranging from Gram
Panchayat officials to district level and line officials of the various ministries involved in the
implementation - supplemented the beneficiary household interviews.
Public Affairs Foundation implemented the Citizen Report Card, with inputs from Public
Affairs Centre and WaterAid (especially at the Questionnaire review stage). Data Collection
for the household interviews was done through a Computer Aided Personal Interview (CAPI)
software/hardware, while the official interviews were done through paper surveys. Sample
sizes were designed to provide adequate district level estimates of findings. A household
sample size of 2669 households in Tamil Nadu, and 2680 households in Odisha were evenly
distributed over the six districts in each state respectively. Similarly, 383 officials in Tamil
Nadu and 323 officials in Odisha comprised the officials’ sample. Extensive field visits by PAF
staff during the course of the CRC contributed qualitatively to observations and analyses of
the findings.
2 Public Affairs Foundation| CRC-1 Tamil Nadu and Odisha| PAC/BMGF| March 2015
CRC Findings - Key Pointers to the Performance of NBA
Beneficiary responses to questions on key CRC themes (access, quality and reliability,
problems faced and resolution, extra payments made, and satisfaction with the services
provided) present a window into the implementation of the NBA program in the two states.
This report highlights the findings of the CRC through a series of thematic analyses that
provide key pointers to the possible reasons for performance (or under performance) of the
TSC/NBA in the two states. In addition, the report provides detailed findings separately for
each state, and for the officials' interviews in each state. The report has been designed with
the view that each section and each theme can be read as a discrete piece (by officials in
each state, for example). Detailed frequency tables for every question in the two CRC
questionnaires form a separate annexure (not appended with the report due to the volume
of tables generated).
Key Findings in Brief
Overview
Despite decades of government efforts and large financial outlays, rural sanitation coverage has moved up
only a few percentage points
The two states where CRC-1 was implemented - Tamil Nadu and Odisha - also show similar trends (9% and
6% percent increase respectively in rural coverage between the 2001 and 2011 censuses).
The situation is even more dismal when we assess the numbers of toilets in usable condition (functional
toilets)
Toilets are un-usable for various environmental (flooding, cyclones) as well as man-made reasons (low
quality, contractor-built, lack of superstructure (walls, roof, door), lack of money, contractor negligence.
The SBM-Gramin does not make any provisions for repair and rebuilding of the early adapters’ toilets.
Soft loans and favorable payment terms can be planned through SHGs and microfinance institutions to
strengthen beneficiaries’ ability to repair and rebuild broken toilets
Hopes of achieving ODF targets rest on this yet to be planned strategy to repair and rebuild.
Is lack of water an impediment?
Difference in water source - whether piped-in or fetched - seems to be a driver in deciding whether water
is used for toilet flushing purposes. Those who cite lack of water are more likely to be fetching water from
outside sources.
Availability of water, distance and trips being near constant, it appears that those who fetch water try to
prioritize use due to the extra effort required in fetching the water when compared to those who have
water piped into their dwelling or yard. Water for toilet purposes could be low on the priority list.

3 Public Affairs Foundation| CRC-1 Tamil Nadu and Odisha| PAC/BMGF| March 2015
Availability of RSMs; Voice and Ownership in building of the toilet
While RSMs were touted as a one stop shop for buying toilet accessories in the rural areas, the concept
has not really taken off yet. If the SBM wants to promote RSMs as such outlets, penetration in rural areas
needs to be high, citizen friendly, accessible and economical.
Beneficiaries in both states have clearly indicated their high satisfaction levels with the quality, design and
spaciousness of the toilet, and their overall NBA experience, when they have a voice and ownership in
planning for the toilet in their home and procuring materials.
Conversely, contractor driven mass building of sub-standard toilets, with limited or no avenues for
beneficiary engagement have not elicited high satisfaction levels among the beneficiaries.
Although overall satisfaction levels with the NBA differed across socio-economic and demographic
categories, most differences were not statistically significant.
Completion and usage of toilets is strongly related to who built the toilets for the beneficiary. Those who
built the toilet themselves (or hired a mason to build it for them) showed higher completion and usage of
toilets compared to households with NGO/Contractor built toilets.
Direct and indirect forms of corruption
Lack of awareness in the beneficiaries leads to confusion whether the ‘extra payments’ are beneficiary
contributions or bribes.
Patchy implementation of best practices like receipts for beneficiary contributions leads to such confusion.
Some districts in Tamil Nadu exhibited both direct and indirect forms of corruption.
Clear indications that districts with contractor led toilet building processes under the NBA are prone to
both direct and indirect corruption.
Indirect corruption often involved incomplete or poor/shoddy work, such as lack of a roof or door on the
newly built toilet.
Odisha had other indirect forms of corruption – such as missing toilets where the beneficiary’s name
appears on the TSC/NBA completed list, but there is no toilet on the ground.
Such indirect correction deprives the citizens of NBA incentives, and renders them ineligible for the
incentive in future.
Difference in NBA experience across Socio-economic groups
Variations are seen in how socio-economic groups experience the NBA.
Toilets in completed and usable condition were significantly lower in SC households and those living in
kutcha houses
Lower socio-economic groups also were more likely to have toilets built by contractors/NGOs compared to
higher socio economic groups
Along the same lines, lower socio-economic groups had higher reports of paying extra money to avail of
the NBA benefits
Surprisingly, all these factors did not show a difference in overall satisfaction in Tamil Nadu. In Odisha,
some variation in overall satisfaction was visible among the lower socio- economic groups.
4 Public Affairs Foundation| CRC-1 Tamil Nadu and Odisha| PAC/BMGF| March 2015
Key Themes in Detail
While the TSC/NBA (and now SBM) focus is on setting targets for number of individual
household toilets to be constructed during the target year, this study clearly describes the
key theme that the quality and longevity of toilets built with the NBA incentive are critical to
ending open defecation. Although numbers maybe reported by the states for each year,
with targets as the benchmark for measuring success, it is evident that the toilets built are
not surviving beyond short periods.
In Odisha especially, the CRC gathered that while the uptake of toilet construction itself was
slow in the last few years, even more dismal was the functional status of the toilets thus
constructed. Of the toilets constructed between 2010 and 2014 in the sample interviewed,
nearly 50% are not in usable condition due to either disrepair or incomplete construction.
The reasons given vary from the pit being blocked, debris in the pit to absence of walls, roof
and lights. Some destruction of open toilets (already without roof and walls) due to natural
calamities such as floods and hurricanes was reported in Odisha. Overall, it was clear that
nearly half the recently constructed toilets being unusable is a dire situation that will make
the chances of achieving an end to open defecation rather grim.
Critical to this discussion of quality and longevity of toilets is the issue of who builds the
toilets. Contractors in fact built a majority of the toilets declared unusable by the
beneficiaries. Wherever beneficiaries themselves had a hand in building the toilet (either
with or without the help of a mason), fewer instances of unusable toilets were reported.
The new SBM would do well to note this crucial nuance. To succeed, SBM has to actively
discourage mass building of sub standard and poor quality toilets by contractors just to
complete target quotas.
Repair of such unusable toilets is also vital to achieving the goal of ending open defecation.
While NBA did not make any provisions for assistance with such repairs, SBM has an
opportunity to encourage various funding sources, such as Self Help Groups and
Microfinance institutions to provide soft loans and other assistance to past beneficiaries
with currently unusable or under-constructed toilets. Without such forward thinking policies
to fix the broken toilets, it would seem that the SBM will continue the trend of a slow-paced
run seen under the TSC and the NBA, and find itself running in the same spot for another
decade or more.
A key reason often cited for unused toilets is lack of water. This report presents data from
the CRC to examine the notion of shortage of water as a reason for low toilet usage. By
looking at the water usage levels of the sample as a whole, and comparing it to the water
usage of those who complained of lack of water as a reason for not using the toilet, the
study found that both groups used similar quantities of water per day. The key difference
lay in how the water was supplied to the home - whether it was piped in or fetched from a
distance. Those who cited lack of water seemed more likely to fetch water from an outside

5 Public Affairs Foundation| CRC-1 Tamil Nadu and Odisha| PAC/BMGF| March 2015
source through multiple trips in a day, compared to the rest of the sample who used water
that was piped into the dwelling or yard. We can conclude that while quantity of water used
is consistent across both groups, those who fetch water prioritize use in the household, and
find other domestic uses to be of a higher priority than flushing the toilet.
In keeping with the overall aims of the research study - to examine citizen voices in the NBA
- another theme in the CRC examined the ownership exhibited by beneficiaries in procuring
materials for the individual household toilet and the building process - whether beneficiaries
built the toilet themselves, or whether the district NBA machinery awarded contracts to
NGOs/Contractors to build toilets. A sub theme is the presence of Rural Sanitary Marts -
whether they were present in the rural areas for beneficiaries to access and buy materials
from. This ownership of efforts and outcome is critical to whether beneficiaries end up using
the toilets built, and is therefore examined in detail, including satisfaction levels with the
toilet, and usage numbers in both the states.
Findings on this theme show that beneficiaries in both states are highly satisfied with the
quality, design and spaciousness of the toilet, and their overall NBA experience, when they
have a voice and ownership in planning for the toilet, buying the materials and getting the
toilet built. Conversely, contractor-built toilets, with limited avenues for beneficiary
engagement showed markedly lower satisfaction levels. Predictably then, completion and
usage of toilets was also strongly correlated to who built the toilet - those who build the
toilet themselves (or hired a mason themselves to build it) showed higher completion and
usage of toilets compared to households with NGO/Contractor built toilets. Despite such a
strong association between beneficiary ownership of the process and the outcomes of
completed and used toilets, the impediment to increasing such involvement is the
availability of materials. RSMs were hardly prevalent. If the SBM wants to promote RSMs as
the one stop shop for beneficiaries to procure materials, penetration in rural areas needs to
improve significantly, be citizen friendly, accessible and economical.
An important component of a CRC is the attempt to measure corruption and assess the
levels of corruption in service delivery based on Citizen Response. However, citizens can
only report on direct corruption - where they have to pay extra amounts to avail of the
service being delivered. Other forms of corruption - systemic and indirect - are often
unreported or underreported, and need to be studied through other methods. Indirect
corruption in the NBA involves shoddy and/or incomplete work, poor quality, violation of
regulated design standards (dimensions of the toilet, lack of roof, walls or door), and in the
most extreme case recorded in Odisha during field visits, 'paper toilets', where beneficiary
information is entered onto a list of completed toilets, but there are no toilets on the
ground. Such indirect corruption deprives citizens of the incentive, and more crucially, puts
their names on a beneficiary list, permanently disabling their chances of being a beneficiary
in the future. Despite all these findings of the study, recorded in this report, we believe that
such indirect corruption in the NBA is greatly underreported, and cannot be accurately

6 Public Affairs Foundation| CRC-1 Tamil Nadu and Odisha| PAC/BMGF| March 2015
estimated through the methods of this study. The mere presence of such instances,
however, is telling in exposing the tip of the iceberg at least, on issues of corruption in the
NBA.
Finally, one of the themes explored in this report is the idea of vulnerability - do some
groups of beneficiaries face disadvantages in accessing the NBA scheme and incentive? If so,
what are the characteristics of groups that experience the NBA differently compared to
others? We examined this hypothesis by correlating gender of head of the household, social
group of the beneficiary households, annual income levels and, the type of house lived in
(kutcha, semi-pucca or pucca) to the NBA experience. We find that often, marginalized
groups such as SC, ST, and those living in kutcha houses (a proxy for economic levels) have
less say in who builds the toilet for them, whether they receive the incentive (which would
depend on who built the toilet) and how they procured the materials. Lower socio-economic
groups of beneficiaries were also more likely to have unused toilets or toilets in need of
repair. They also had higher reports of having paid extra money to avail of the benefits. Yet,
there were no wide variations in overall satisfaction levels, especially in Tamil Nadu. Some
variation in satisfaction was found in Odisha. The gender of the head of the household did
not show statistically significant difference in how each gender experienced the NBA.
Tamil Nadu – High Awareness, Completion and Usage Numbers
In the six districts of Tamil Nadu covered in the CRC, awareness of the NBA was high (85%).
Gram Panchayat Members, officials and the Swachchata Doot were the main sources of
information regarding toilet construction under the NBA. Completion numbers reflect the
high awareness among the beneficiaries: 83% reported that their toilet built under the NBA
scheme was complete and in usable condition. Respondents also reported usage in greater
proportions: 84% of the respondents reported that all the members use the toilet at all
times. Kanyakumari and Tirunelveli were the highest, with 100% of the beneficiaries
reporting toilet usage all the time. Lowest reports of usage were recorded in Perambalur
and Dharmapuri – incidentally, both districts reporting contractor-built toilets in greater
numbers compared to the other four districts.
Reports of extra money spent on the toilet construction varied across districts. Average
amount spent on toilet construction reported was Rs. 15,273 (Median=Rs. 12000), with
Dharmapuri reporting the lowest at Rs. 7652 and Tirunelveli residents reporting Rs. 26,189.
This is because in Tirunelveli residents did not take to the idea of pit toilets and preferred
Septic tank toilets, which cost more than the pit latrines. In some areas, a small bath area
was added to the toilet, resulting in the extra cost.
The extra money spent on the toilet construction was procured through loans, as reported
by 68% of the respondents in the Tamil Nadu sample. Money lenders, pawn brokers,
relatives and banks were the source of the loan. Only 45% had partially repaid the loan.
7 Public Affairs Foundation| CRC-1 Tamil Nadu and Odisha| PAC/BMGF| March 2015
Regarding the NBA incentive, 21% had received the incentive in full and another 14% had
received partial amounts. Two points can be kept in mind here.
a) since many of the sample households had recently constructed toilets, it is possible that
the amounts will be received shortly (and not at the time of data collection)
b) in districts with contractor-built toilets, beneficiaries will never receive the incentive
amount, since the NBA officials will pass on the incentive directly to the builder.
Where toilets were left half constructed, the reasons given were often to do with the
insufficiency of funds, delays in receiving incentives, contractors asking for bribes or taking
the incentive amounts and not finishing the work on the toilet.
Very few respondents (2%) however, reported facing a problem while building the toilet. Of
this small number, the main problems reported were not receiving construction materials
and, not receiving the incentive. Most of those who experienced a problem (74%) went to a
GP member for problem resolution.
Seven percent of the beneficiaries (n=173) reported direct “extra payments” to officials to
avail of the NBA benefits. Most of them paid to be selected as a beneficiary, for arranging
masons, digging of the pit and arranging materials. These payments paint only a partial
picture of the situation. Observations by field staff and the research team note that by
cutting corners on the quality of the toilets – whether through reducing the height of the
walls, not putting a roof on the toilet, transferring NREGA wages to the contractor instead of
the beneficiaries – officials found various ways to short change the beneficiaries.
Despite these noted problems, satisfaction levels among beneficiaries, as measured through
various indicators on the NBA process, remained high at 87%. In districts where
beneficiaries built the toilets themselves (or with the help of a mason), overall satisfaction
was reported at greater than 90%, with Kanyakumari reporting 100% overall complete
satisfaction levels. In Permabalur (73%) and Dharmapuri (66%), respondents reported
markedly lower satisfaction levels compared to the other districts.
Odisha – Low Awareness, Poor Completion and Usage Reported
Primarily, it was very difficult for the research and survey teams to locate beneficiaries in
Odisha. Data from the NBA website, or official numbers given by the district officials, did not
tally with the ground situation. A substantial amount of time was spent throughout the
study in locating beneficiaries that fit the criteria of the study (toilet constructed under the
TSC/NBA between 2010 and 2014). Subsequently, when located, the survey team realized
that finding recently built toilets was an uphill task. One of the reasons could be that Odisha
has lagged behind in implementing NBA, did not have a completed baseline 2012 survey
unlike other states, and official apathy was clearly visible at all stages of the study, including
cooperation with the study and survey teams.
8 Public Affairs Foundation| CRC-1 Tamil Nadu and Odisha| PAC/BMGF| March 2015
The available sample for Odisha therefore is spread across several years, with 36% of the
respondents reporting 2010 as the year the toilet was built. Only 25% reported 2013 or
2014 as the year of construction. This is in contrast to Tamil Nadu, where 76% reported
2014 as the year of construction, and another 14% reported 2013. Because of this variation
between the states, true comparison of experiences of beneficiaries is hindered. However,
the survey team had no choice but to accept earlier built toilets into the sample in Odisha,
since recently constructed toilets were not reported or available for inclusion in the study.
Despite this shortcoming however, the data for the two states speak volumes in explaining
the variation in experiences and satisfaction of beneficiaries with the NBA process.
In contrast to Tamil Nadu, Odisha recorded poor completion and usage of toilets by
respondents. Only 52% of the respondents reported that the toilet was in a completed and
usable condition. The rest either had a completed but unusable toilet (32%), or discontinued
construction. Significantly, where the toilet was built by the respondents themselves (or
with the help of a mason), 77% reported a complete and usable toilet. In contrast, where
the toilet was built by an NGO or a contractor, only 40% reported the same. Stated
differently, 45% of the respondents who had an NGO/Contractor-built toilet reported it to
be unusable. 15% had a discontinued or half-constructed toilet. This is a significant finding
and mirrors findings from Dharmapuri and Permabalur in Tamil Nadu which had a higher
proportion of contractor-built toilets compared to the other districts.
As in Tamil Nadu, this issue of who built the toilet impacts usage in a significant manner. In
districts that record high number of self-built toilets, usage numbers are also high – such as
in Angul, with 45% self built/89% usage; and, Cuttack, 90% self-built/77% usage. Overall in
Odisha, only 51% of the beneficiaries reported that all the members of the family use the
toilet at all times.
These data are compelling because the NBA focuses on achieving targets each year and
measures accomplishment by the number of toilets built against this target. However, the
CRC has shown that of the toilets reported under coverage data, if 50% of the beneficiaries
have unusable toilets, and usage is also at 50% (of usable toilets), then the coverage data
has to be adjusted to accurately reflect the situation on the ground. Mere statistics on the
number of toilets obfuscates the true picture – that the longevity of toilets is questionable,
and therefore, in the end, an open defection-free society is not achievable with such
unsolved issues on the ground.
In Odisha too, extra money paid by respondents to avail of the services is only one indicator
of leakages in the system. In some GPs, the team found that beneficiaries’ names on the list
did not translate to toilets on the ground. Villagers were unhappy when told that their
names are on a beneficiary list of households with completed toilets. This has a dual
disadvantage for such households – not only do they not have a toilet currently; they are
also ineligible to receive the incentive, since the fictitious list contains their names as past

9 Public Affairs Foundation| CRC-1 Tamil Nadu and Odisha| PAC/BMGF| March 2015
beneficiaries. It is unclear how widespread this practice is, but the proof in one GP is
sufficient to surmise that the practice of such lists may be occurring in other GPs too.
It follows from the above findings that satisfaction levels will be low in Odisha. Lack of
avenues for ownership and action on the demand side, poor quality of construction, and the
slowness of uptake are reflected in the satisfaction levels. Only 39% of the respondents
reported complete satisfaction with the NBA overall. Cuttack showed the highest overall
satisfaction levels, with 79% reporting complete satisfaction. In Baleshwar, where
contractor-built toilets, as well as highest ‘extra payments’ were reported, satisfaction was
at a low 8%. Sambalpur, also on the lower side, reported 7% overall complete satisfaction.
Summary
Results of the CRC in both states – Tamil Nadu and Odisha – have given some clear pointers
to issues plaguing the TSC and NBA, which if unresolved, will continue to cripple the scheme
under SBM. Not giving enough voice and choice to the beneficiaries and awarding contracts
to NGOs and/or contractors to build toilets severely reduces the chances of completed and
usable toilets, longevity of the toilets and, importantly, usage of the toilets. Coverage data
based on numbers of toilets built do not give a clear picture of the above, and will be an
impediment to achieving Open Defecation-Free status by 2019 as envisaged by the SBM. As
the later chapters will show, giving control of the scheme to the Gram Panchayats, and
therefore to the citizens, will increase their involvement and accountability in the NBA (now
SBM).
10 Public Affairs Foundation | CRC -1 Tamil Nadu and Odisha | PAC/BMGF | March 2015
Improving Consumer Voices and Accountability in the Nirmal Bharat Abhiyan1
A Citizen Report Card (CRC-1) in Tamil Nadu and Odisha
Section 1: Introduction
Sanitation programs planned and launched by the Government of India over nearly thirty
years have attempted to reduce open defecation in the country. Starting with the Central
Rural Sanitation Programme (CRSP) in 1986, the focus has been on improving sanitation by
building individual household latrines, especially in rural areas, as well as community
facilities in villages, schools and Anganwadis. Individual latrines were to be built with the
help of a government subsidy to the household, while the community toilets were built with
pooled funds of the state and central governments. The rural sanitation program under
CRSP went through several periodic revisions based on feedback from the states, as well as
the five year plan allocations of the National Planning Commission. The revisions led to the
program moving from a supply side, infrastructure and subsidy driven program to a demand
driven and integrated approach to ending open defecation by providing funds for
infrastructure, as well as demand generation activities through education and
communication campaigns.
The CRSP eventually gave way to the Total Sanitation Campaign (TSC) in 1999. This program
focused on enhancing the demand driven focus, with greater allocations for Information,
Education and Communication (IEC) activities to generate demand, and accelerating
individual toilet coverage in the country, especially in rural areas. In 2012, TSC was renamed
Nirmal Bharat Abhiyan (NBA), and additional components such as NREGA convergence were
added to supplement the amount available to beneficiaries to construct individual
household toilets. A brief summary of each stage of the Government’s sanitation program is
given in Table 2.
Despite such programmatic interventions by the Government across the country and over
the years, rural sanitation in India is still patchy. Progress over the span of each scheme is
only incremental, leaving large sections of the population continuing to engage in open
defecation.
1 Nirmal Bharat Abhiyan (NBA) has since been changed to Swachh Bharat Mission (SBM). Since this study was
launched prior to the change, NBA will be used in the report to maintain consistency.
11 Public Affairs Foundation | CRC -1 Tamil Nadu and Odisha | PAC/BMGF | March 2015
Table 1: Percent Households with Toilets (National - 2011 Census)2
Census Year
Rural Urban Total
1991 9% 64% 24%
2001 22% 74% 36%
2011 31% 81% 47%
We see in Table 1 above that over twenty years of implementation, coverage of households
with toilets is still less than a third in rural areas. Even where toilets have been built, and
targets have been achieved on paper, the condition of the toilets and actual usage are far
below the numbers published by the respective schemes of the Government. As a result,
sanitation, and especially rural sanitation, and means to eliminate open defecation in the
country continue to be widely discussed, debated and researched topics.
Table 2: Summary of Government Schemes to Improve Sanitation3
Central Rural Sanitation Programme (1986): The Central Rural Sanitation Programme was one of the first schemes of the central government which focused solely on rural sanitation. The programme sought to construct household toilets, construct sanitary complexes for women, establish sanitary marts, and ensure solid and liquid waste management.
Total Sanitation Campaign (1999): The Total Sanitation Campaign was launched in 1999 with a greater focus on Information, Education and Communication (IEC) activities in order to make the creation of sanitation facilities demand driven rather than supply driven. Key components of the Total Sanitation Campaign included: (i) financial assistance to rural families below the poverty line for the construction of household toilets, (ii) construction of community sanitary complexes, (iii) construction of toilets in government schools and anganwadis, (iv) funds for IEC activities, (v) assistance to rural sanitary marts, and (vi) solid and liquid waste management.
Nirmal Bharat Abhiyan (2012): In 2012, the Total Sanitation Campaign was replaced by the Nirmal Bharat Abhiyan (NBA), which also focused on the previous elements. According to the Ministry of Drinking Water and Sanitation, the key shifts in NBA were: (i) a greater focus on coverage for the whole community instead of a focus on individual houses, (ii) the inclusion of certain households which were above the poverty line, and (iii) more funds for IEC activities, with 15% of funds at the district level earmarked for IEC.
Swachh Bharat Mission (Gramin) (2014): in October 2014, NBA was replaced by Swachh Bharat Mission (Gramin) (SBM-G) which is a sub-mission under Swachh Bharat Mission. SBM-G also includes the key components of the earlier sanitation schemes such as the funding for the construction of individual household toilets, construction of community sanitary complexes, waste management, and IEC. Key features of SBM-G, and major departures from earlier sanitation schemes, are outlined in the next section.
2 http://www.prsindia.org/theprsblog/?p=3390 Accessed on January 2, 2015
3 Ibid.
12 Public Affairs Foundation | CRC -1 Tamil Nadu and Odisha | PAC/BMGF | March 2015
Specifically, although envisaged as a demand driven scheme, the top-down implementation
model begs the question of the extent of voice and agency on the part of the citizens. As
WaterAid found in its study of TSC in five states4,
“the TSC is getting increasingly state led and target driven…” and that, while the TSC
guidelines “mention that the programme has to be community led and people centered,
actual implementation on the ground is largely state led and target driven with the line
departments functioning as major drivers of the programme”.
In this context of a top down approach by the Government (in implementation, if not on
paper), It is imperative to examine whether a bottom-up model - where citizens, villages and
Gram Panchayats (GPs) have a larger role in implementation - will make a difference and
lead to better and speedier success in increasing rural toilet coverage. Spears (2012)5 writes
of the ‘P-factor” – where, if the Pradhan [head of the village or GP] was good,
implementation of the program was good as well. He also emphasizes the policy lesson:
villages are a critical level of governance for sanitation intervention.
Background of the Study
Public Affairs Centre’s current study, “Improving Consumer Voices and Accountability in the
Nirmal Bharat Abhiyan”, aims to explore the above theme, and utilize various social
accountability tools such as Citizen Report Cards (CRC) and Community Score Cards (CSC) to
enhance citizen voices in the NBA. Through this research and intervention study, PAC hopes
to improve the processes in the NBA by which the demand side of the equation is seen in
action and not just on paper.
In order to study the demand and supply side of the processes, and examine the current
platform for citizen voices and accountability in the NBA, PAC, a pioneer in social
accountability studies, was funded by the Bill and Melinda Gates Foundation (BMGF) to
conduct two Citizen Report Cards over a period of thirty six months, interspersed with a
Community Score Card. The purpose is to engage with the communities and service
providers to work on improving the awareness of citizens in select areas regarding the NBA
program in particular and sanitation in general.
The two states chosen for the study are Tamil Nadu and Odisha. Tamil Nadu appeared to be
a 'better performing state' under the NBA program in terms of coverage achieved, whereas
Odisha lay at the bottom of the pile when compared along the same parameters. The
selection of states was made based on NBA data. The study aimed to examine the
conditions and outcomes of NBA implementation in these two states, in order to unearth
4 “Feeling the Pulse – A Study of the Total Sanitation Campaign in Five States”, WaterAid India (2008), p. 9.
5 “Policy Lessons from Implementing India’s Total Sanitation Campaign”, Dean Spears, Princeton University &
NCAER, 2012, at the India Policy Forum, 2012. p. 15.

13 Public Affairs Foundation | CRC -1 Tamil Nadu and Odisha | PAC/BMGF | March 2015
any specific characteristics of implementation that were leading to the observed results of
the NBA program. It is noted here however, that 'better performing' and 'bottom of the pile'
are relative terms. NBA data have been notoriously inconsistent, and do not in most cases
match census data on sanitation coverage. The coverage numbers provided here are based
on census data.
Table 3: Percent of Rural Households with Toilets - Select States (2011 Census)6
State 2001 2011 % Change
Odisha 8 14 6
Tamil Nadu 14 23 9
All India 22 31 9
As Table 3 illustrates, Tamil Nadu's incremental change over the ten years was equal to the
national average, whereas Odisha was lower, with only a 6% increase in rural sanitation
coverage between the two censuses.
Objectives of the Citizen Report Card (CRC)
The Citizens Report Card (CRC) is a simple and credible tool used extensively by public
agencies to generate systematic feedback from actual users of public services on various
quantitative and qualitative aspects of service delivery.
CRCs elicit information about users’ awareness, access, usage, quality, reliability,
responsiveness and satisfaction with public services. In the context of poverty reduction
programmes, it often complements expert analyses and conventional poverty monitoring
indices with a “bottom-up” assessment of pro-poor services. A CRC identifies the key
constraints faced by citizens, especially the poor and underserved, in accessing public
services, their appraisals of the quality and adequacy of these services, and the quality of
the interactions they have with providers. CRCs offer recommendations on sector policies,
strategies and programmes to address these constraints and improve service delivery.
Citizen Report Cards capture citizens' feedback in simple and unambiguous terms by
indicating levels of satisfaction or dissatisfaction. CRCs go beyond the superficial and delve
into the specific aspects of interaction between the service agencies and the citizen to
identify problem areas in the delivery and provision of specific services. In simpler terms,
CRC-based analysis suggests that dissatisfaction has causes, which may be related to the
quality of service (such as reliability of water supply or availability of learning materials in
6 http://www.prsindia.org/theprsblog/?p=3390 Accessed on January 2, 2015
14 Public Affairs Foundation | CRC -1 Tamil Nadu and Odisha | PAC/BMGF | March 2015
public schools), the type of difficulty encountered while dealing with the agency to solve
service problems (for example, complaints of water supply cuts), hidden costs in making use
of the public service (special tuition fees to teachers or investments in filters to purify
“drinking water”), and extra money/bribes paid to avail services.
The methodology involves a survey of the users of different public services, and the
aggregation of the users’ experiences as a basis for rating the services. This is possible
because the methodology makes use of advanced techniques of social science research for
selecting samples, designing questionnaires, conducting interviews, and interpreting results.
As a result, the report cards provide a reliable and comprehensive representation of citizens'
feedback.
Relevance of CRC to the Current Study
The CRC questionnaire aimed at beneficiaries, as well as interviews with officials, in the two
states chosen for the study – Tamil Nadu and Odisha – can be used to critically examine the
avenues and forums for voices of consumers/beneficiaries that the NBA mechanism
provides in each district. From preliminary observations in both states, some districts seem
to be doing better than others in providing such forums. Others are, through a top down
approach, narrowing the avenues available for citizens to own the process as their own.
Unless citizen voices are strengthened, the results of the NBA will continue to be patchy as
seen over the past decade. For the NBA to be a truly ‘demand-driven’ initiative, developing
and implementing mechanisms to strengthen the demand side voices will be the challenge
of the NBA (now SBM). Results from CRC-1 will be used to develop indicators to feed into
the upcoming CSC exercise in the two states.
Implementation of CRC-1
PAC has partnered with Public Affairs Foundation (PAF) to execute the CRC portion of the
study. PAF has implemented numerous CRCs in various parts of India and the world over the
last twelve years. Most recently, PAF has completed a CRC in the state of Bihar covering
eight services across 38 districts in the state, with a sample of 32,000 households. In the
sanitation sector, PAF recently executed an impact evaluation study examining the impact
of a behavior change campaign on toilet construction in Davanagere district, Karnataka. The
study employed a quasi-experimental design and conducted a baseline survey followed by
an end-line survey after the intervening behavior change campaign. In addition to toilet
construction as a long term outcome, the study also examined changes in behaviors and
perceptions related to toilets and sanitation among the village households in the district.
In implementing the CRC for the current project, PAF has worked closely with the PAC team
in planning the study, designing the questionnaires as well as seeking substantive inputs
from the PAC team, and WaterAid India (a domain knowledge partner on the project).
15 Public Affairs Foundation | CRC -1 Tamil Nadu and Odisha | PAC/BMGF | March 2015
Outline of the CRC-1 Report
This report describes the implementation of CRC-1 in Tamil Nadu and Odisha.
Section 2 describes the methodology adopted in the implementation, including selection of
districts, sampling of households and officials, and data collection procedures including
quality monitoring.
Section 3 presents findings in the two states on key themes that will help situate the
discussion around sanitation, and highlight the main issues that are contributing to the
sluggish progress of the NBA program in some districts/states.
Section 4 presents an analysis of the findings of the CRC from the household survey,
separately for each state, followed by a discussion of the findings and relevance to the next
steps of the project on hand for PAC.
Section 5 describes the responses of the officials collected through a separate questionnaire
in each state.
Detailed frequency counts for all questions in the Household and Officials/Providers'
questionnaires are provided in the Annexure.
16 Public Affairs Foundation | CRC -1 Tamil Nadu and Odisha | PAC/BMGF | March 2015
Section 2: Methodology
CRC-1 in the chosen districts of Odisha and Tamil Nadu focused on gathering valuable
feedback from beneficiaries of the Individual Household Latrines program (IHHL) under
the Nirmal Bharat Abhiyan. Beneficiaries were eligible for inclusion in the Household
sample if they had availed of the TSC/NBA incentive to build a toilet in their home
between 2010 and 2014. In some districts, the year was relaxed to include toilets built
prior to 2010, due to shortfall in the number of recent toilets available for inclusion in
the sample.
The questionnaire to elicit such feedback focused on:
Beneficiaries’ experience of applying for the subsidy program
Access to information, ease of access and usage
Problems and resolution in the process of their participation in the program
Grievance Redress mechanisms (if any) in the process of participation
Corruption (if any) and other formal and informal payments encountered by the
beneficiaries
Overall satisfaction with the IHHL program under Nirmal Bharat Abhiyan.
In addition, the questionnaire collected information on respondent demographics
and socio-economic characteristics (occupation, income, assets, APL/BPL
classification, age, gender, household composition and, social group affiliation).
A second component of the CRCs gathered feedback from officials at various levels
connected with the IHHL program of Nirmal Bharat Abhiyan. Based on details gathered
during the preparatory phase of the study, a list of officials belonging to various
implementing agencies, such as gram panchayats, Block/Taluk offices, district offices and
the NBA program, was drawn up. This list was used to choose officials from all strata for
feedback/interviews. A separate questionnaire was administered to the officials. The
focus of this questionnaire was:
Their experience of administering the subsidy program under NBA
Program bottlenecks, issues and resolution under the program
17 Public Affairs Foundation | CRC -1 Tamil Nadu and Odisha | PAC/BMGF | March 2015
Geographic Areas for the study
The districts in each state chosen for the study are as follows:
Tamil Nadu: Dharmapuri, Kanyakumari, Krishnagiri, Perambalur, Tirunelveli
and Tiruchirappalli7 (Trichy).
Odisha: Anugul, Baleshwar (Balasore), Cuttack, Dhenkanal, Ganjam and
Sambalpur.
PAC, in consultation with WaterAid, chose the six districts in each state. Broadly, the
districts represent a mix of high performers, medium and low performers in the NBA
program in the state. Sambalpur was chosen as a replacement for Boudh in Odisha, which
although earlier on the list was eliminated due to logistic issues.
Selection of Blocks and GPs in each District
NBA implementation is often unevenly spread across blocks and GPs in a district. Added to
this uneven spread, statistics appearing on the NBA website often do not translate into real
toilets on the ground (this will be discussed in detail in the later sections). Therefore,
although the NBA data were extensively studied, and a new dataset was created to enable
summarizing block and GP wise statistics of toilets built, the NBA numbers turned out to be
unreliable. The team had to therefore rely on district NBA officials to recommend blocks
where the TSC/NBA toilet penetration was sufficient enough to allow for adequately sample
sizes in each block.
PAF staff contacted the district level NBA coordinator in each district. With the help of the
coordinator and/or the Block Development Officers, Blocks were chosen for the CRC sample.
At least three blocks were chosen in each district based on the recommendation of the
district and Block level staff. An additional block was added if the earlier choices did not
yield enough households to include in the sample. Further, selection of GPs within each
Block ensured as much spread as possible across GPs with toilets. Within each GP, multiple
villages were included in the sample where possible. In consultation with PAC, sample
requirement specified was that a household with a TSC/NBA toilet built between 2010 and
2014 was eligible to be in the CRC survey.
Tables 3 and 4 provide Block and GP level sample sizes for each district in Tamil Nadu and
Odisha.
7 Wherever this report uses the shorter and commonly used name “Trichy”, it refers to the district of
Tiruchirappalli.
18 Public Affairs Foundation | CRC -1 Tamil Nadu and Odisha | PAC/BMGF | March 2015
Table 4: Households Interviewed - Tamil Nadu
District Block GP Number
of villages
Number of households
covered
Dharmapuri
Harur
Agraharam 4 26
Ellapudayampatty 1 26
Jammanahalli 1 23
Keeraipatty 1 7
Kolagampatti 2 15
M.Velampatty 1 20
Mathiyampatty 2 25
Prayapattypudur 1 22
Morappur
Gopichettipalayam 1 15
Gopinadhampatti 3 25
Ichampadi 1 21
Maniyampadi 1 30
Regadahalli 2 23
Samandhahalli 1 20
Sungarahalli 1 28
Thalanatham 2 12
Thalanatham 1 4
Vagurappampatti 5 29
Papireddipatti
Alapuram 2 18
Athigarapatti 2 21
B.Pallipatti 1 9
Biranatham 1 13
Bommidi 3 22
Molayanoor 1 2
Total 41 456
Kanyakumari Kiliyoor
Mathicode 17 29
Midalam 3 7
Nattalam 4 7
Paloor 7 16
Thippiramalai 3 4
Kuruthancode
Kakkottuthalai 4 14
Kattimancode 5 8
Kurunthancode 9 33
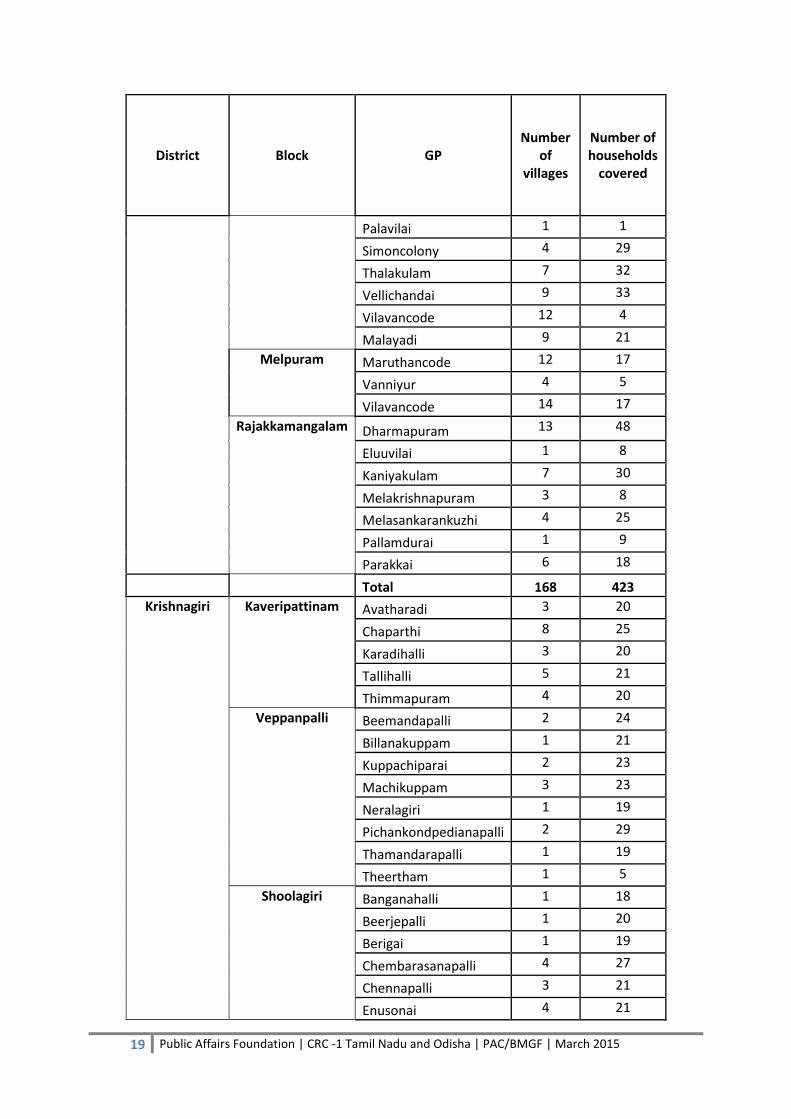
19 Public Affairs Foundation | CRC -1 Tamil Nadu and Odisha | PAC/BMGF | March 2015
District Block GP Number
of villages
Number of households
covered
Palavilai 1 1
Simoncolony 4 29
Thalakulam 7 32
Vellichandai 9 33
Vilavancode 12 4
Malayadi 9 21
Melpuram
Maruthancode 12 17
Vanniyur 4 5
Vilavancode 14 17
Rajakkamangalam
Dharmapuram 13 48
Eluuvilai 1 8
Kaniyakulam 7 30
Melakrishnapuram 3 8
Melasankarankuzhi 4 25
Pallamdurai 1 9
Parakkai 6 18
Total 168 423
Krishnagiri
Kaveripattinam
Avatharadi 3 20
Chaparthi 8 25
Karadihalli 3 20
Tallihalli 5 21
Thimmapuram 4 20
Veppanpalli
Beemandapalli 2 24
Billanakuppam 1 21
Kuppachiparai 2 23
Machikuppam 3 23
Neralagiri 1 19
Pichankondpedianapalli 2 29
Thamandarapalli 1 19
Theertham 1 5
Shoolagiri
Banganahalli 1 18
Beerjepalli 1 20
Berigai 1 19
Chembarasanapalli 4 27
Chennapalli 3 21
Enusonai 4 21
20 Public Affairs Foundation | CRC -1 Tamil Nadu and Odisha | PAC/BMGF | March 2015
District Block GP Number
of villages
Number of households
covered
Immidinaickenpalli 2 24
Koneripalli 3 26
Total 55 445
Perambalur
Alathur
Elanthankuzhi 1 16
Irur 1 22
Kurur 1 19
Mavilingai 1 21
Melamathur 1 20
Nakkaselam 1 49
Ramalingapuram 1 19
Varagupadi 1 24
Perambalur
Alambadi 2 14
Ammapalayam 1 21
Bommanapadi 1 15
Keelakarai 1 18
Nochiam 1 21
Vadakkumadevi 2 15
Velur 2 23
Veppanthattai
Anukkur 1 27
Neikuppai 1 20
Pillangulam 1 28
V.Kalathur 1 35
Valikandapuram 1 25
Total 23 452
Tirunelveli
Alangulam
Achankuttam 2 19
Kulasekaramangalam 4 1
Kurippakulam 3 23
Mayaman Kuruchi 2 22
Nallur 3 17
Vadiyoor 2 22
Keelapavoor
Andipatti 3 26
Avodiyanoor 2 21
I 15
Kallurani 2 22
Kulasegarapatti 3 17
Rajagopalaperi 1 22
21 Public Affairs Foundation | CRC -1 Tamil Nadu and Odisha | PAC/BMGF | March 2015
District Block GP Number
of villages
Number of households
covered
Sivanadanoor 4 18
Thippanampatti 2 15
Meelathanaloor
Echanda 2 22
Kulasekaramangalam 4 20
Melailandakulam 1 22
Periyakoilankulam 2 24
Senthamangalam Kasba
4 29
Senthamangalam Majara
3 27
Vannikonendal 2 16
Vellalankulam 3 24
Total 33 444
Tiruchirappalli
Andanallur
Andhanallur 4 20
Kilikoodu 2 20
Kulumani 2 14
Malliyambathu 1 18
Mutharasanallur 2 47
Panayapuram 2 29
Periyakarupur 1 22
Puliyur 1 4
Pettavaithalai 5 42
Manaparrai
F. Keelaiyur 1 15
K. Periyappatty 4 18
Kannudayan Patty 1 19
Karupur 6 52
Pannappatty 1 15
Usilampatty 6 16
Vengaikuruchi 6 25
Maruganpuri
Athikaram 2 12
Kodumbapatty 2 11
M.Edaiyapatty 3 35
Paluvanji 1 15
Total 53 449
22 Public Affairs Foundation | CRC -1 Tamil Nadu and Odisha | PAC/BMGF | March 2015
Table 5: Households Interviewed - Odisha
District Block GP Number
of villages
Number of households
covered
Angul
Kishornagar
Kaniha 2 11
Kukura Peta 5 4
Kukura Sahi 1 1
Nuagoan 3 1
Tentu Lei 1 16
Talcher
Bagadia 1 20
Bahaala Sahi 4 56
Bahal Pal 1 1
Bantol 1 6
Bhagal Sahi 1 11
Brahamanbil 2 42
Chendipada 1 40
Goorujagoli 2 36
Kampasal 1 27
Kania 1 35
Kanikil 1 40
Kanshola 1 12
Kukurapeta 2 55
Tentulai 1 37
Total 32 451
Balasore
Basta
Bahmarnda 1 22
Choramara 1 20
Darada 1 17
Gadapada 2 14
Gaghunatha Pur 1 1
Garaapada 3 6
Gopala Pur 1 7
Irda 2 18
Kalyani 1 8
Purasatampur 1 20
Raghunath Pur 3 19
Ratai 2 1
Sadanand Pur 5 20
Bhograi
Ausha 1 1
Balem 1 14
Bhograi 1 4

23 Public Affairs Foundation | CRC -1 Tamil Nadu and Odisha | PAC/BMGF | March 2015
District Block GP Number
of villages
Number of households
covered
Darada 1 3
Gopalpur 1 9
Gusuda 1 1
Kalyani 1 19
Kharadi Pipal 2 20
Kosada 2 16
Mandar Sahi 4 20
Nachinda 2 20
Nimat Pur 2 20
Saddhhapur 6 17
Sukuda 1 3
Tukuni Hazira 2 26
Baliapal
Bania Diha 2 20
Jambhirai 3 20
Nuagaa 3 20
Rataea 2 19
Total 62 445
Cuttack
Baranga
Dadha Patna 3 9
Harianta 4 20 Khalarda 3 18
Korkora 3 19
Kuranga Pradhan 5 24
Kuranga Sasan 4 22
Madhusudanpur 1 1
Nagari 2 11
Naraj Marthapur 3 24
Ramdas Pur 5 24
Sainso 3 20
Usuma 3 30
Kantapada
Adaspur 2 3
Bada Patasundarpur 2 20
Bagalpur 3 20
Bramhanabati 4 30
Bramhansailo 3 21
Dimiri 2 6
Hmanabrabati 1 1
Jharpada 4 19
Kamarsahi 1 1
N.G Gram 1 4
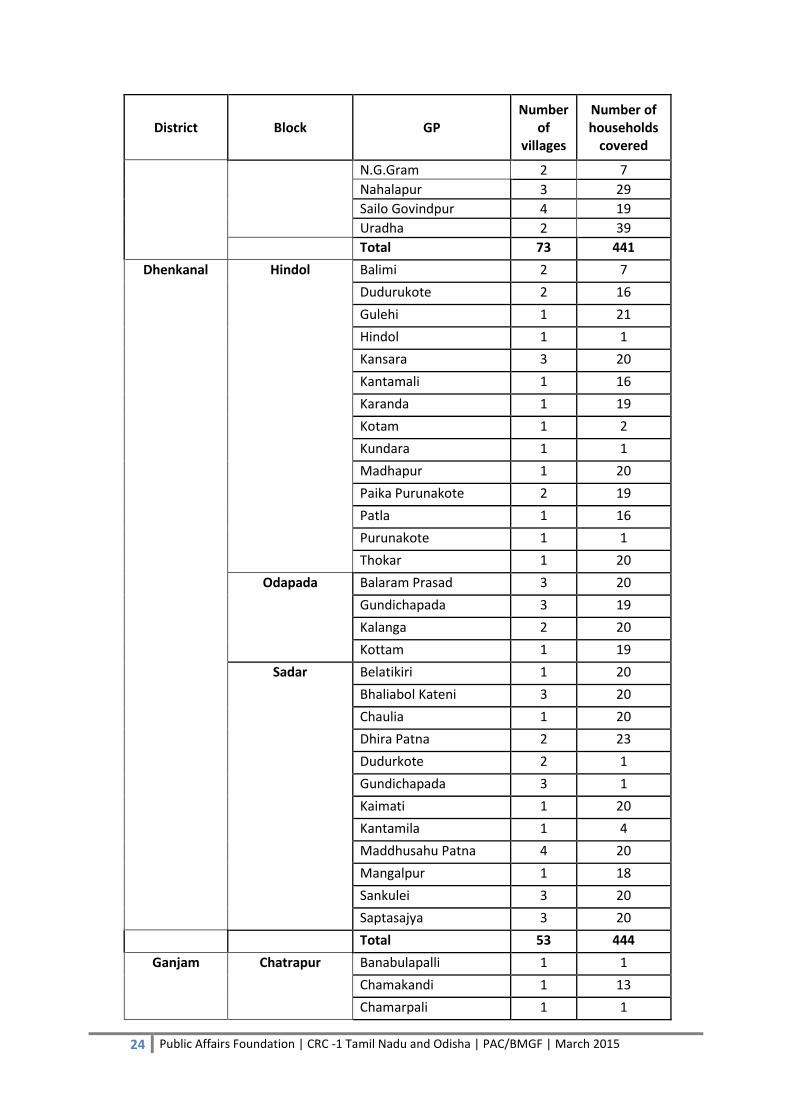
24 Public Affairs Foundation | CRC -1 Tamil Nadu and Odisha | PAC/BMGF | March 2015
District Block GP Number
of villages
Number of households
covered
N.G.Gram 2 7
Nahalapur 3 29
Sailo Govindpur 4 19
Uradha 2 39
Total 73 441
Dhenkanal
Hindol
Balimi 2 7
Dudurukote 2 16
Gulehi 1 21
Hindol 1 1
Kansara 3 20
Kantamali 1 16
Karanda 1 19
Kotam 1 2
Kundara 1 1
Madhapur 1 20
Paika Purunakote 2 19
Patla 1 16
Purunakote 1 1
Thokar 1 20
Odapada
Balaram Prasad 3 20
Gundichapada 3 19
Kalanga 2 20
Kottam 1 19
Sadar Belatikiri 1 20
Bhaliabol Kateni 3 20
Chaulia 1 20
Dhira Patna 2 23
Dudurkote 2 1
Gundichapada 3 1
Kaimati 1 20
Kantamila 1 4
Maddhusahu Patna 4 20
Mangalpur 1 18
Sankulei 3 20
Saptasajya 3 20
Total 53 444
Ganjam
Chatrapur
Banabulapalli 1 1
Chamakandi 1 13
Chamarpali 1 1

25 Public Affairs Foundation | CRC -1 Tamil Nadu and Odisha | PAC/BMGF | March 2015
District Block GP Number
of villages
Number of households
covered
Chhamakhandi 1 5
Jhadabai 2 2
Kanamana 1 19
Jagannathaprasad
Alashu 1 15
Alasugamu 1 5
Balisahi 1 1
Gayaganda 1 21
Khajurpali 1 1
Khetamunda 1 5
Khetamundali 1 2
Khetamundali 1 12
Khetamundari 1 1
Khetamundeli 1 6
Kokal 1 15
Kshetamunduli 1 1
Kukalaba 1 5
Pratap Pur 1 12
Radhapadara 1 20
Tarasing 2 19
Patrapur
Ankulai 8 39
Bhuratala 2 20
Dandi Pur 1 1
Jhadabandh 1 2
Padadig 3 40
Patra Pur 1 21
Tadipur 1 19
Purushottampur
Tumba 2 19
Turubudi 1 20
Aladigan 1 2
Ankuli 4 1
Arakha Pur 1 24
Jhadabai 1 20
K N Pur 1 13
Pratapur 1 1
Purushottampur 1 1
Tankachai 1 16
Total 55 441
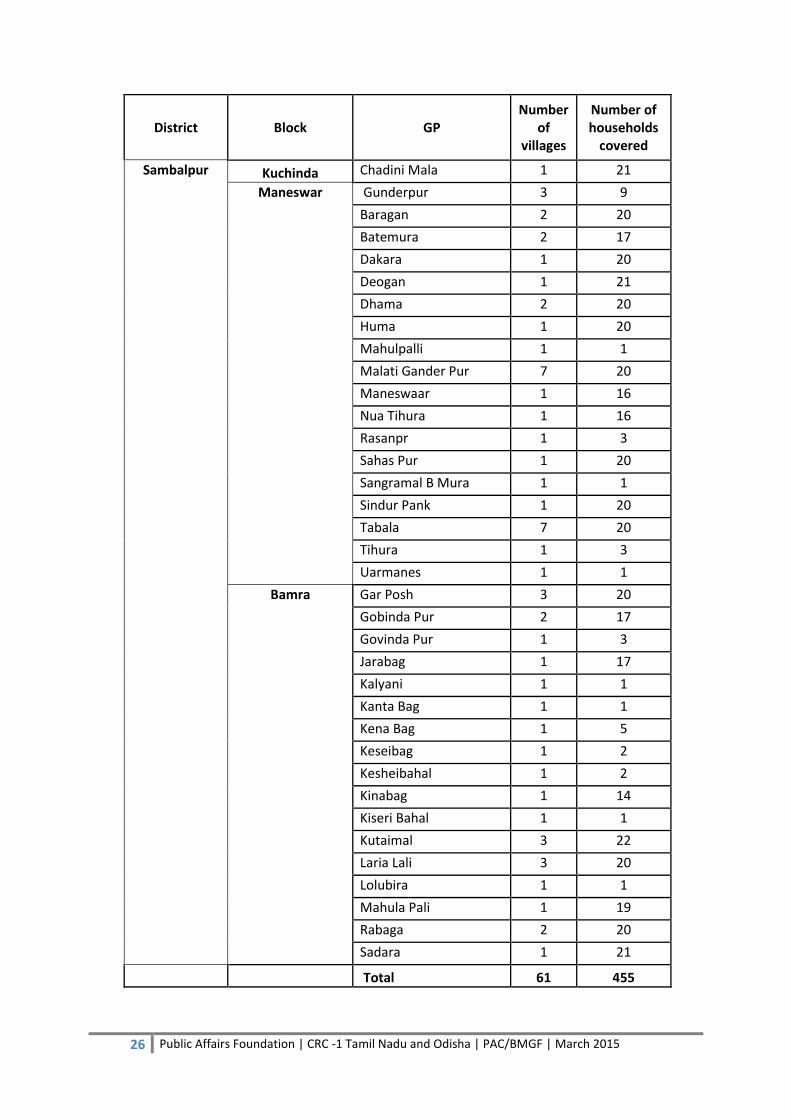
26 Public Affairs Foundation | CRC -1 Tamil Nadu and Odisha | PAC/BMGF | March 2015
District Block GP Number
of villages
Number of households
covered
Sambalpur
Kuchinda Chadini Mala 1 21
Maneswar Gunderpur 3 9
Baragan 2 20
Batemura 2 17
Dakara 1 20
Deogan 1 21
Dhama 2 20
Huma 1 20
Mahulpalli 1 1
Malati Gander Pur 7 20
Maneswaar 1 16
Nua Tihura 1 16
Rasanpr 1 3
Sahas Pur 1 20
Sangramal B Mura 1 1
Sindur Pank 1 20
Tabala 7 20
Tihura 1 3
Uarmanes 1 1
Bamra Gar Posh 3 20
Gobinda Pur 2 17
Govinda Pur 1 3
Jarabag 1 17
Kalyani 1 1
Kanta Bag 1 1
Kena Bag 1 5
Keseibag 1 2
Kesheibahal 1 2
Kinabag 1 14
Kiseri Bahal 1 1
Kutaimal 3 22
Laria Lali 3 20
Lolubira 1 1
Mahula Pali 1 19
Rabaga 2 20
Sadara 1 21
Total 61 455
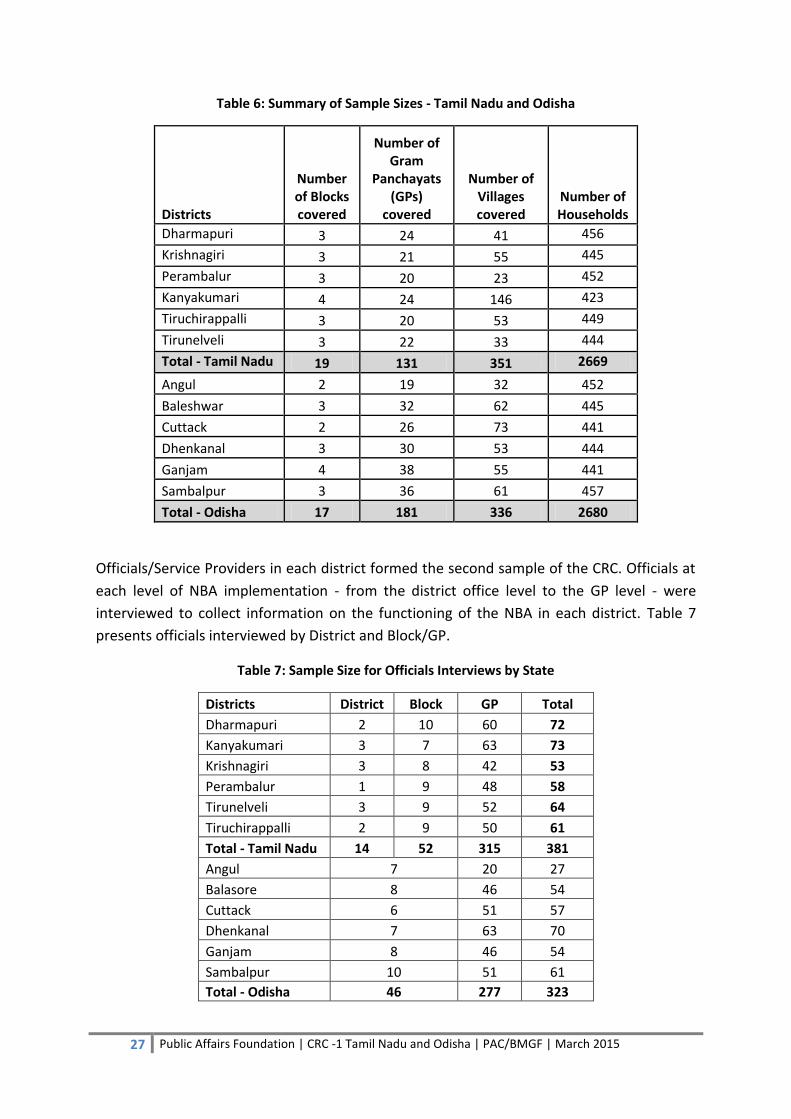
27 Public Affairs Foundation | CRC -1 Tamil Nadu and Odisha | PAC/BMGF | March 2015
Table 6: Summary of Sample Sizes - Tamil Nadu and Odisha
Districts
Number of Blocks covered
Number of Gram
Panchayats (GPs)
covered
Number of Villages covered
Number of Households
Dharmapuri 3 24 41 456
Krishnagiri 3 21 55 445
Perambalur 3 20 23 452
Kanyakumari 4 24 146 423
Tiruchirappalli 3 20 53 449
Tirunelveli 3 22 33 444
Total - Tamil Nadu 19 131 351 2669
Angul 2 19 32 452
Baleshwar 3 32 62 445
Cuttack 2 26 73 441
Dhenkanal 3 30 53 444
Ganjam 4 38 55 441
Sambalpur 3 36 61 457
Total - Odisha 17 181 336 2680
Officials/Service Providers in each district formed the second sample of the CRC. Officials at
each level of NBA implementation - from the district office level to the GP level - were
interviewed to collect information on the functioning of the NBA in each district. Table 7
presents officials interviewed by District and Block/GP.
Table 7: Sample Size for Officials Interviews by State
Districts District Block GP Total
Dharmapuri 2 10 60 72
Kanyakumari 3 7 63 73
Krishnagiri 3 8 42 53
Perambalur 1 9 48 58
Tirunelveli 3 9 52 64
Tiruchirappalli 2 9 50 61
Total - Tamil Nadu 14 52 315 381
Angul 7 20 27
Balasore 8 46 54
Cuttack 6 51 57
Dhenkanal 7 63 70
Ganjam 8 46 54
Sambalpur 10 51 61
Total - Odisha 46 277 323
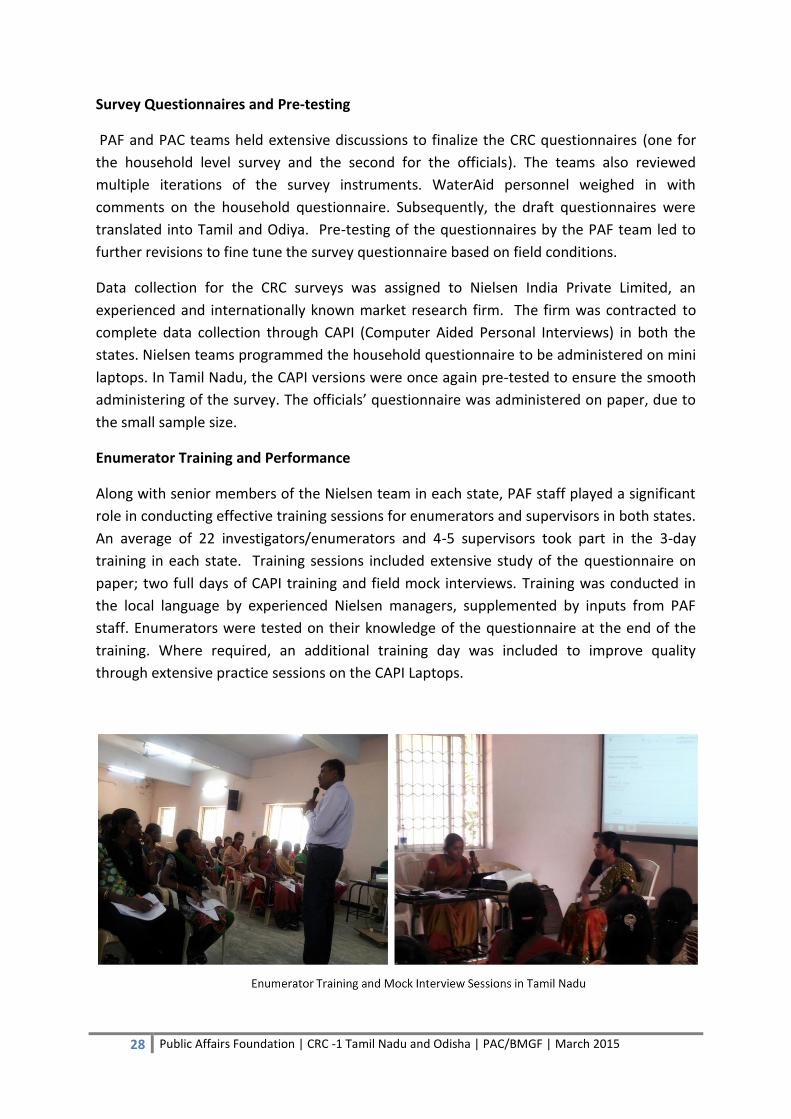
28 Public Affairs Foundation | CRC -1 Tamil Nadu and Odisha | PAC/BMGF | March 2015
Survey Questionnaires and Pre-testing
PAF and PAC teams held extensive discussions to finalize the CRC questionnaires (one for
the household level survey and the second for the officials). The teams also reviewed
multiple iterations of the survey instruments. WaterAid personnel weighed in with
comments on the household questionnaire. Subsequently, the draft questionnaires were
translated into Tamil and Odiya. Pre-testing of the questionnaires by the PAF team led to
further revisions to fine tune the survey questionnaire based on field conditions.
Data collection for the CRC surveys was assigned to Nielsen India Private Limited, an
experienced and internationally known market research firm. The firm was contracted to
complete data collection through CAPI (Computer Aided Personal Interviews) in both the
states. Nielsen teams programmed the household questionnaire to be administered on mini
laptops. In Tamil Nadu, the CAPI versions were once again pre-tested to ensure the smooth
administering of the survey. The officials’ questionnaire was administered on paper, due to
the small sample size.
Enumerator Training and Performance
Along with senior members of the Nielsen team in each state, PAF staff played a significant
role in conducting effective training sessions for enumerators and supervisors in both states.
An average of 22 investigators/enumerators and 4-5 supervisors took part in the 3-day
training in each state. Training sessions included extensive study of the questionnaire on
paper; two full days of CAPI training and field mock interviews. Training was conducted in
the local language by experienced Nielsen managers, supplemented by inputs from PAF
staff. Enumerators were tested on their knowledge of the questionnaire at the end of the
training. Where required, an additional training day was included to improve quality
through extensive practice sessions on the CAPI Laptops.
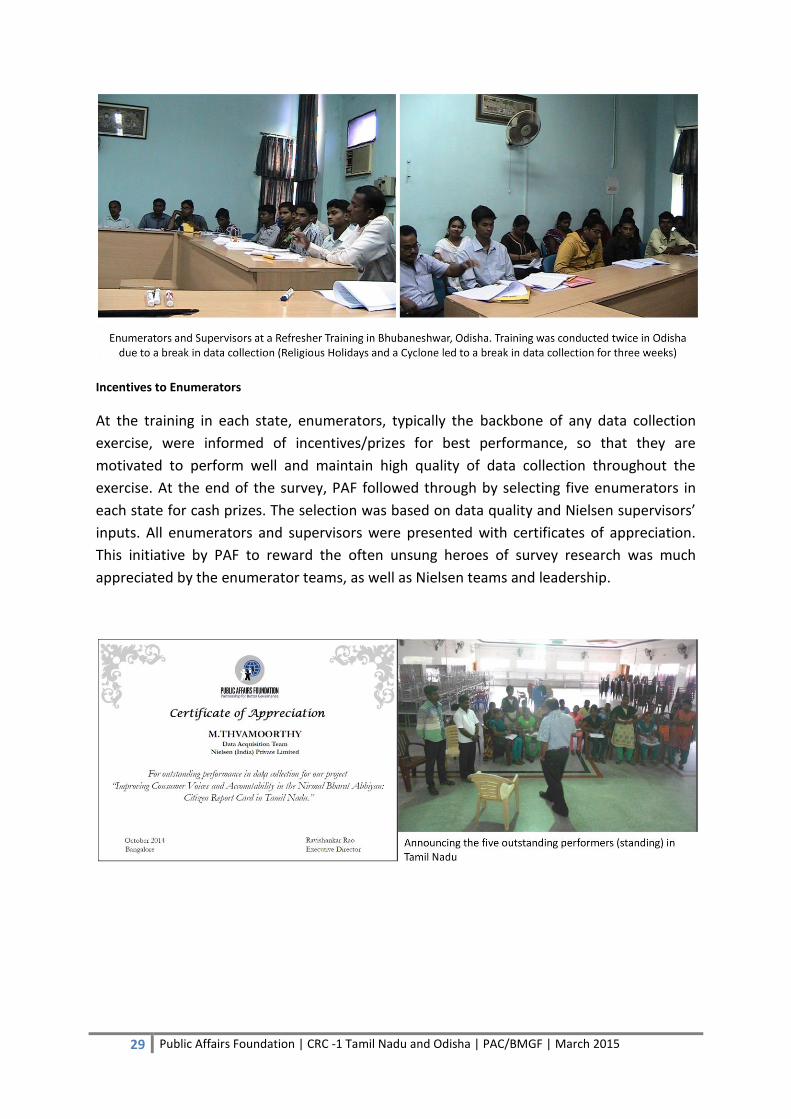
29 Public Affairs Foundation | CRC -1 Tamil Nadu and Odisha | PAC/BMGF | March 2015
Incentives to Enumerators
At the training in each state, enumerators, typically the backbone of any data collection
exercise, were informed of incentives/prizes for best performance, so that they are
motivated to perform well and maintain high quality of data collection throughout the
exercise. At the end of the survey, PAF followed through by selecting five enumerators in
each state for cash prizes. The selection was based on data quality and Nielsen supervisors’
inputs. All enumerators and supervisors were presented with certificates of appreciation.
This initiative by PAF to reward the often unsung heroes of survey research was much
appreciated by the enumerator teams, as well as Nielsen teams and leadership.

30 Public Affairs Foundation | CRC -1 Tamil Nadu and Odisha | PAC/BMGF | March 2015
Data Collection
Immediately after the training program in each state, the data collection exercise was
launched in both the states. Starting with one district, where all teams got to administer the
surveys and debrief on any problems in the questionnaires, the teams fanned out to all
districts on the list and completed data collection systematically.
In both the states, data collection was impacted by various happenings – in Tamil Nadu,
political turmoil led to violence in the state. Teams were instructed to ensure safety of the
enumerators first and suspend data collection if required. Teams ceased work and resumed
only after transportation resumed in the state. In Odisha, various festivals (Dussehra and
Diwali), followed by Cyclone Hudhud led to suspension of field work for nearly a month. As a
result, an additional refresher training session was conducted at the beginning of phase II of
the data collection exercise, to ensure data quality.
Household surveys and officials interviews were completed in both the states between the
months of September and November.
Quality Monitoring – During Training, Data Collection and Post-Survey
Senior PAF staff, along with junior members, monitored all aspects of the CRC data
collection process, starting with questionnaire design to CAPI testing, training of
enumerators and the administering of the survey. On monitoring visits, each enumerator
was accompanied by a PAF member at least once, to ensure that the enumerator
understood each question and administered it properly. Instant feedback was presented to
the supervisors, along with debrief sessions, to ensure that they supervised and guided their
teams effectively. Every team was visited by the PAF team at least once during field work in
both the states. Enumerators who had minor difficulties were singled out for additional
attention, and it was found that eventually they performed on par with the rest of the team.
At the end of the survey process, the CAPI data for household interviews was cleaned and
finalized by the Nielsen Team. The PAF team received the final SPSS datasets, along with
frequency tables for each question. The Officials interview data was hand entered by the
Nielsen team. Constant data quality checks led to numerous back and forth interactions
between the Nielsen and PAF teams, during which the Nielsen team provided the
clarifications and corrections required. Finalized datasets will be provided to PAC along with
the frequency table annexure and this report.
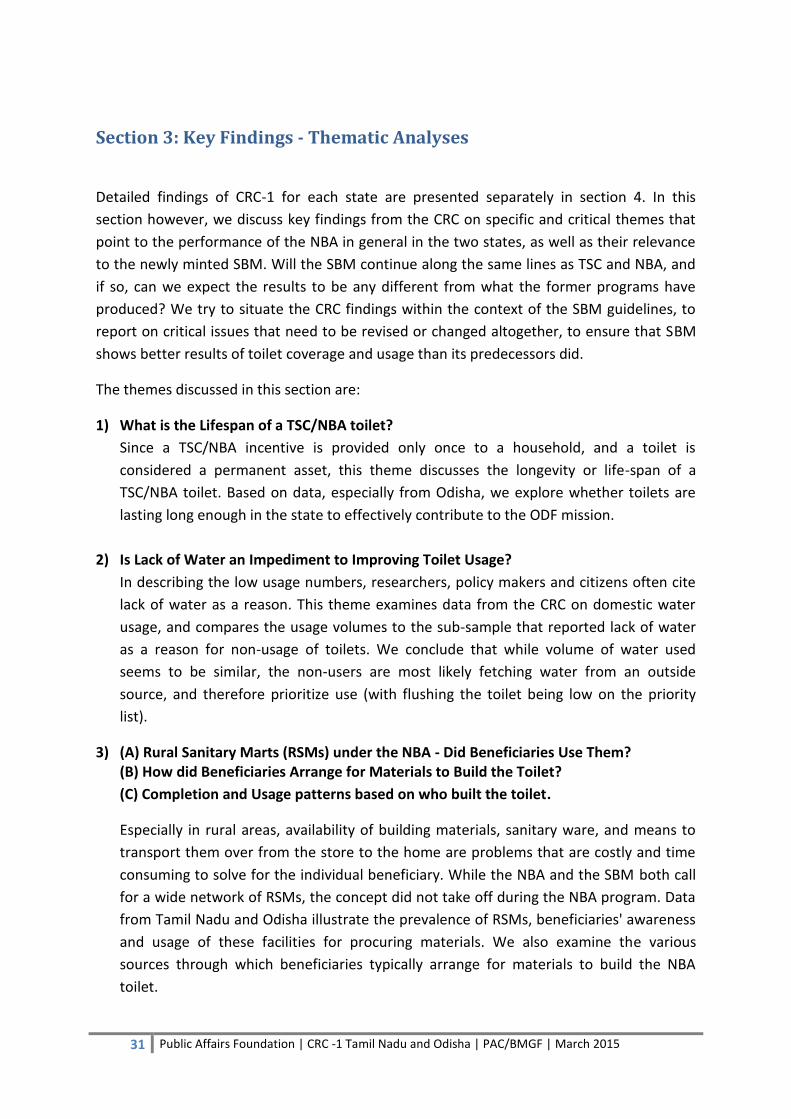
31 Public Affairs Foundation | CRC -1 Tamil Nadu and Odisha | PAC/BMGF | March 2015
Section 3: Key Findings - Thematic Analyses
Detailed findings of CRC-1 for each state are presented separately in section 4. In this
section however, we discuss key findings from the CRC on specific and critical themes that
point to the performance of the NBA in general in the two states, as well as their relevance
to the newly minted SBM. Will the SBM continue along the same lines as TSC and NBA, and
if so, can we expect the results to be any different from what the former programs have
produced? We try to situate the CRC findings within the context of the SBM guidelines, to
report on critical issues that need to be revised or changed altogether, to ensure that SBM
shows better results of toilet coverage and usage than its predecessors did.
The themes discussed in this section are:
1) What is the Lifespan of a TSC/NBA toilet?
Since a TSC/NBA incentive is provided only once to a household, and a toilet is
considered a permanent asset, this theme discusses the longevity or life-span of a
TSC/NBA toilet. Based on data, especially from Odisha, we explore whether toilets are
lasting long enough in the state to effectively contribute to the ODF mission.
2) Is Lack of Water an Impediment to Improving Toilet Usage?
In describing the low usage numbers, researchers, policy makers and citizens often cite
lack of water as a reason. This theme examines data from the CRC on domestic water
usage, and compares the usage volumes to the sub-sample that reported lack of water
as a reason for non-usage of toilets. We conclude that while volume of water used
seems to be similar, the non-users are most likely fetching water from an outside
source, and therefore prioritize use (with flushing the toilet being low on the priority
list).
3) (A) Rural Sanitary Marts (RSMs) under the NBA - Did Beneficiaries Use Them? (B) How did Beneficiaries Arrange for Materials to Build the Toilet?
(C) Completion and Usage patterns based on who built the toilet.
Especially in rural areas, availability of building materials, sanitary ware, and means to
transport them over from the store to the home are problems that are costly and time
consuming to solve for the individual beneficiary. While the NBA and the SBM both call
for a wide network of RSMs, the concept did not take off during the NBA program. Data
from Tamil Nadu and Odisha illustrate the prevalence of RSMs, beneficiaries' awareness
and usage of these facilities for procuring materials. We also examine the various
sources through which beneficiaries typically arrange for materials to build the NBA
toilet.
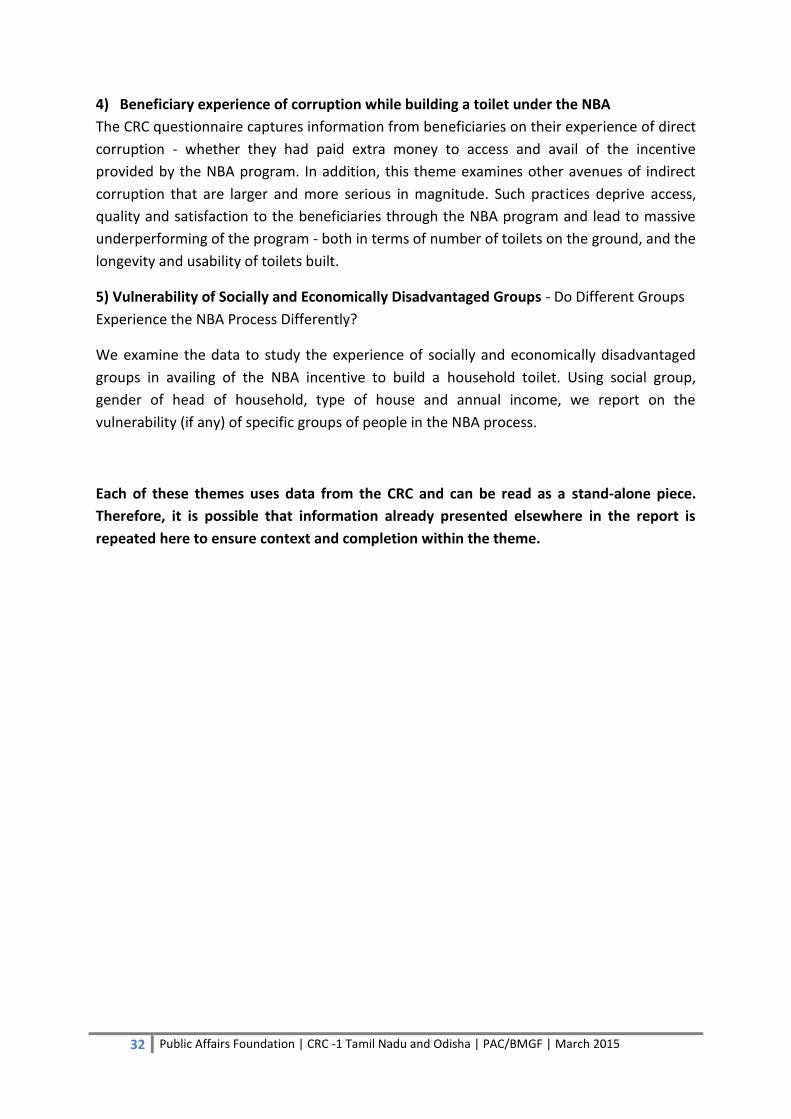
32 Public Affairs Foundation | CRC -1 Tamil Nadu and Odisha | PAC/BMGF | March 2015
4) Beneficiary experience of corruption while building a toilet under the NBA
The CRC questionnaire captures information from beneficiaries on their experience of direct
corruption - whether they had paid extra money to access and avail of the incentive
provided by the NBA program. In addition, this theme examines other avenues of indirect
corruption that are larger and more serious in magnitude. Such practices deprive access,
quality and satisfaction to the beneficiaries through the NBA program and lead to massive
underperforming of the program - both in terms of number of toilets on the ground, and the
longevity and usability of toilets built.
5) Vulnerability of Socially and Economically Disadvantaged Groups - Do Different Groups
Experience the NBA Process Differently?
We examine the data to study the experience of socially and economically disadvantaged
groups in availing of the NBA incentive to build a household toilet. Using social group,
gender of head of household, type of house and annual income, we report on the
vulnerability (if any) of specific groups of people in the NBA process.
Each of these themes uses data from the CRC and can be read as a stand-alone piece.
Therefore, it is possible that information already presented elsewhere in the report is
repeated here to ensure context and completion within the theme.

33 Public Affairs Foundation | CRC -1 Tamil Nadu and Odisha | PAC/BMGF | March 2015
Theme 1: What is the Life-span of a TSC/NBA Toilet?
Decades of Efforts and Limited Progress
The Government of India has been trying for decades to improve sanitation coverage in the
country, especially in rural areas. Whether through the Central Rural Sanitation Program
(CRSP, 1986-1999), the Total Sanitation Campaign (TSC, 1999-2012), the Nirmal Bharat
Abhiyan (NBA, 2012-2014) or the Swachh Bharat Mission (SBM, 2014 - current), persistent
efforts, and enormous outlays and expenditure have been the hallmarks of the
Government’s efforts. Making the country Open Defecation-Free (ODF) is a lofty goal
pursued by all these missions over the decades.
That all these earlier missions (minus the SBM, which has just begun) have succeeded only
partially in increasing toilet coverage across the country is evident from the numbers.
Rather than present TSC/NBA numbers, which are confusing at best, we present the 2011
census data on percent of households with toilets8:
Table 8: Percentage of Households with Toilets (National - 2011 Census)
Year Rural Urban Total
1991 9% 64% 24%
2001 22% 74% 36%
2011 31% 81% 47%
Despite interventions through the schemes above, the progress across census
years/decades is only a few percentage points. Rural areas, especially, continue to show
dismal progress in household toilet coverage. In the two states covered in CRC-1 under the
BMGF-PAC project, Odisha and Tamil Nadu, a similar pattern of under-achievement is seen
in rural areas :
Table 9: Percentage of Rural Households with Toilets (2011 Census)9
State (Rural) 2001 2011
Tamil Nadu 14% 23%
Odisha 8% 14%
8 http://www.prsindia.org/theprsblog/?p=3390 downloaded on February 4, 2015.
9 Ibid.
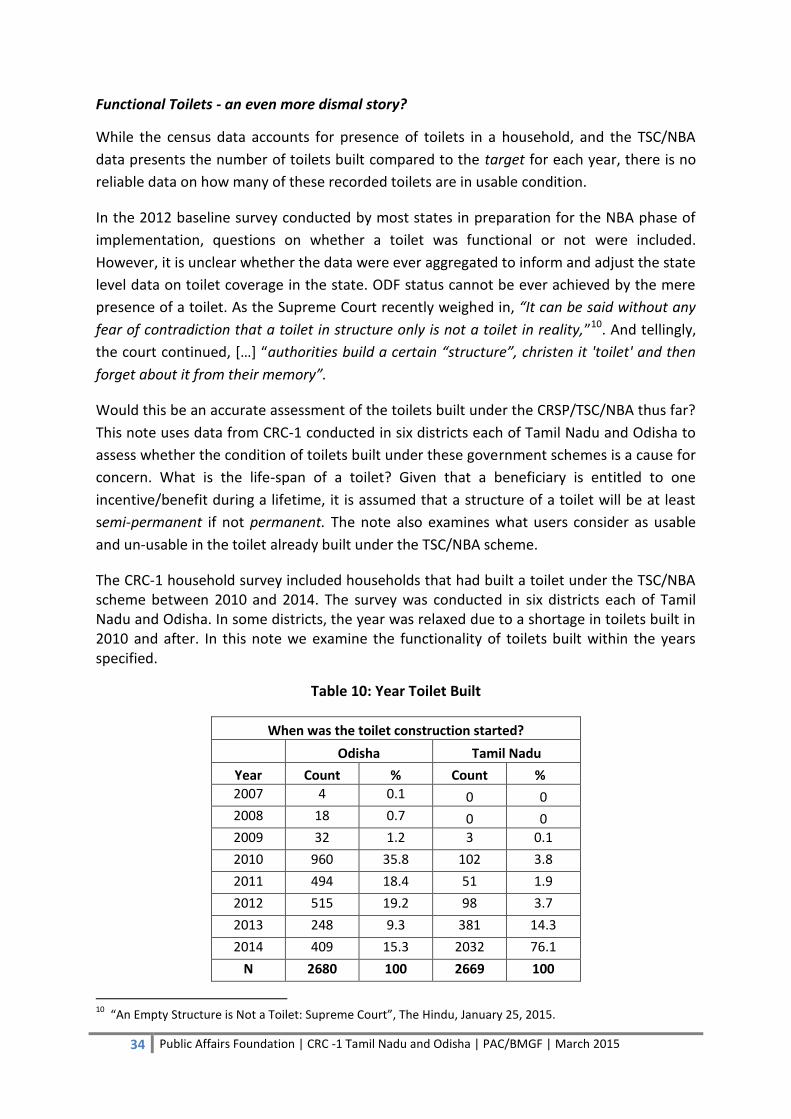
34 Public Affairs Foundation | CRC -1 Tamil Nadu and Odisha | PAC/BMGF | March 2015
Functional Toilets - an even more dismal story?
While the census data accounts for presence of toilets in a household, and the TSC/NBA
data presents the number of toilets built compared to the target for each year, there is no
reliable data on how many of these recorded toilets are in usable condition.
In the 2012 baseline survey conducted by most states in preparation for the NBA phase of
implementation, questions on whether a toilet was functional or not were included.
However, it is unclear whether the data were ever aggregated to inform and adjust the state
level data on toilet coverage in the state. ODF status cannot be ever achieved by the mere
presence of a toilet. As the Supreme Court recently weighed in, “It can be said without any
fear of contradiction that a toilet in structure only is not a toilet in reality,”10. And tellingly,
the court continued, […] “authorities build a certain “structure”, christen it 'toilet' and then
forget about it from their memory”.
Would this be an accurate assessment of the toilets built under the CRSP/TSC/NBA thus far?
This note uses data from CRC-1 conducted in six districts each of Tamil Nadu and Odisha to
assess whether the condition of toilets built under these government schemes is a cause for
concern. What is the life-span of a toilet? Given that a beneficiary is entitled to one
incentive/benefit during a lifetime, it is assumed that a structure of a toilet will be at least
semi-permanent if not permanent. The note also examines what users consider as usable
and un-usable in the toilet already built under the TSC/NBA scheme.
The CRC-1 household survey included households that had built a toilet under the TSC/NBA scheme between 2010 and 2014. The survey was conducted in six districts each of Tamil Nadu and Odisha. In some districts, the year was relaxed due to a shortage in toilets built in 2010 and after. In this note we examine the functionality of toilets built within the years specified.
Table 10: Year Toilet Built
When was the toilet construction started?
Odisha Tamil Nadu
Year Count % Count %
2007 4 0.1 0 0
2008 18 0.7 0 0
2009 32 1.2 3 0.1
2010 960 35.8 102 3.8
2011 494 18.4 51 1.9
2012 515 19.2 98 3.7
2013 248 9.3 381 14.3
2014 409 15.3 2032 76.1
N 2680 100 2669 100
10
“An Empty Structure is Not a Toilet: Supreme Court”, The Hindu, January 25, 2015.
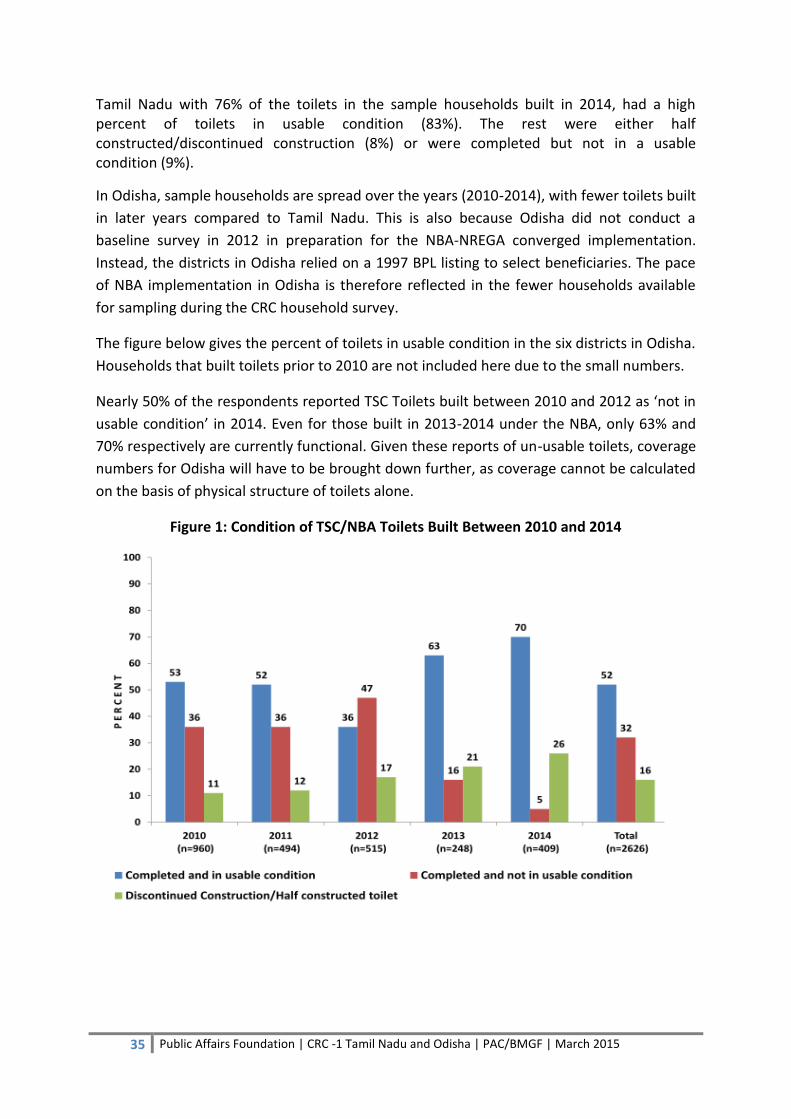
35 Public Affairs Foundation | CRC -1 Tamil Nadu and Odisha | PAC/BMGF | March 2015
Tamil Nadu with 76% of the toilets in the sample households built in 2014, had a high percent of toilets in usable condition (83%). The rest were either half constructed/discontinued construction (8%) or were completed but not in a usable condition (9%).
In Odisha, sample households are spread over the years (2010-2014), with fewer toilets built
in later years compared to Tamil Nadu. This is also because Odisha did not conduct a
baseline survey in 2012 in preparation for the NBA-NREGA converged implementation.
Instead, the districts in Odisha relied on a 1997 BPL listing to select beneficiaries. The pace
of NBA implementation in Odisha is therefore reflected in the fewer households available
for sampling during the CRC household survey.
The figure below gives the percent of toilets in usable condition in the six districts in Odisha.
Households that built toilets prior to 2010 are not included here due to the small numbers.
Nearly 50% of the respondents reported TSC Toilets built between 2010 and 2012 as ‘not in
usable condition’ in 2014. Even for those built in 2013-2014 under the NBA, only 63% and
70% respectively are currently functional. Given these reports of un-usable toilets, coverage
numbers for Odisha will have to be brought down further, as coverage cannot be calculated
on the basis of physical structure of toilets alone.
Figure 1: Condition of TSC/NBA Toilets Built Between 2010 and 2014
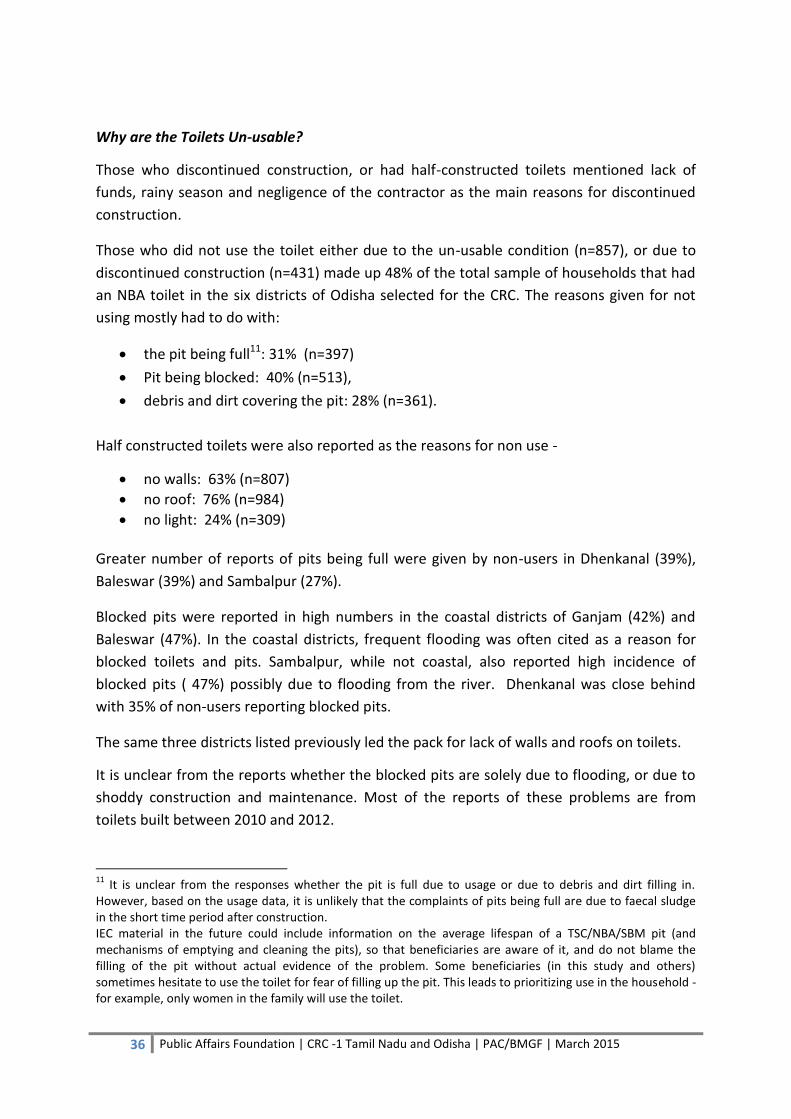
36 Public Affairs Foundation | CRC -1 Tamil Nadu and Odisha | PAC/BMGF | March 2015
Why are the Toilets Un-usable?
Those who discontinued construction, or had half-constructed toilets mentioned lack of
funds, rainy season and negligence of the contractor as the main reasons for discontinued
construction.
Those who did not use the toilet either due to the un-usable condition (n=857), or due to
discontinued construction (n=431) made up 48% of the total sample of households that had
an NBA toilet in the six districts of Odisha selected for the CRC. The reasons given for not
using mostly had to do with:
the pit being full11: 31% (n=397)
Pit being blocked: 40% (n=513),
debris and dirt covering the pit: 28% (n=361).
Half constructed toilets were also reported as the reasons for non use -
no walls: 63% (n=807)
no roof: 76% (n=984)
no light: 24% (n=309)
Greater number of reports of pits being full were given by non-users in Dhenkanal (39%),
Baleswar (39%) and Sambalpur (27%).
Blocked pits were reported in high numbers in the coastal districts of Ganjam (42%) and
Baleswar (47%). In the coastal districts, frequent flooding was often cited as a reason for
blocked toilets and pits. Sambalpur, while not coastal, also reported high incidence of
blocked pits ( 47%) possibly due to flooding from the river. Dhenkanal was close behind
with 35% of non-users reporting blocked pits.
The same three districts listed previously led the pack for lack of walls and roofs on toilets.
It is unclear from the reports whether the blocked pits are solely due to flooding, or due to
shoddy construction and maintenance. Most of the reports of these problems are from
toilets built between 2010 and 2012.
11
It is unclear from the responses whether the pit is full due to usage or due to debris and dirt filling in. However, based on the usage data, it is unlikely that the complaints of pits being full are due to faecal sludge in the short time period after construction. IEC material in the future could include information on the average lifespan of a TSC/NBA/SBM pit (and mechanisms of emptying and cleaning the pits), so that beneficiaries are aware of it, and do not blame the filling of the pit without actual evidence of the problem. Some beneficiaries (in this study and others) sometimes hesitate to use the toilet for fear of filling up the pit. This leads to prioritizing use in the household - for example, only women in the family will use the toilet.
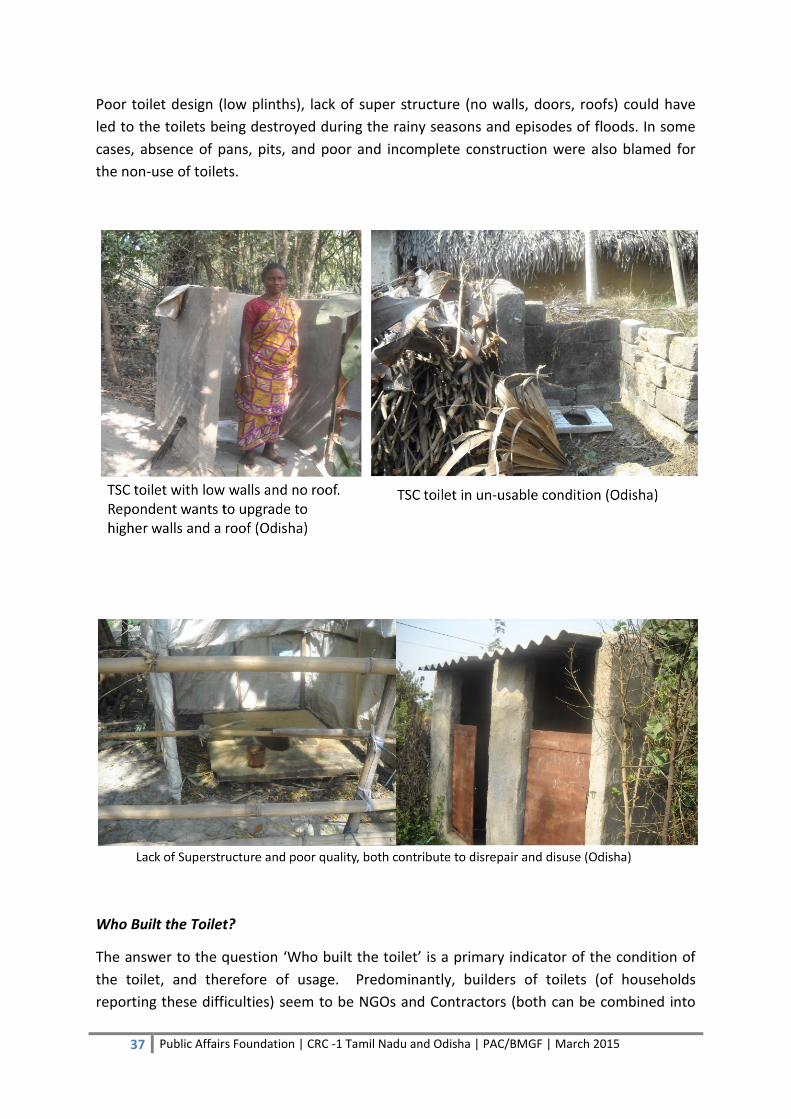
37 Public Affairs Foundation | CRC -1 Tamil Nadu and Odisha | PAC/BMGF | March 2015
Poor toilet design (low plinths), lack of super structure (no walls, doors, roofs) could have
led to the toilets being destroyed during the rainy seasons and episodes of floods. In some
cases, absence of pans, pits, and poor and incomplete construction were also blamed for
the non-use of toilets.
Who Built the Toilet?
The answer to the question ‘Who built the toilet’ is a primary indicator of the condition of
the toilet, and therefore of usage. Predominantly, builders of toilets (of households
reporting these difficulties) seem to be NGOs and Contractors (both can be combined into
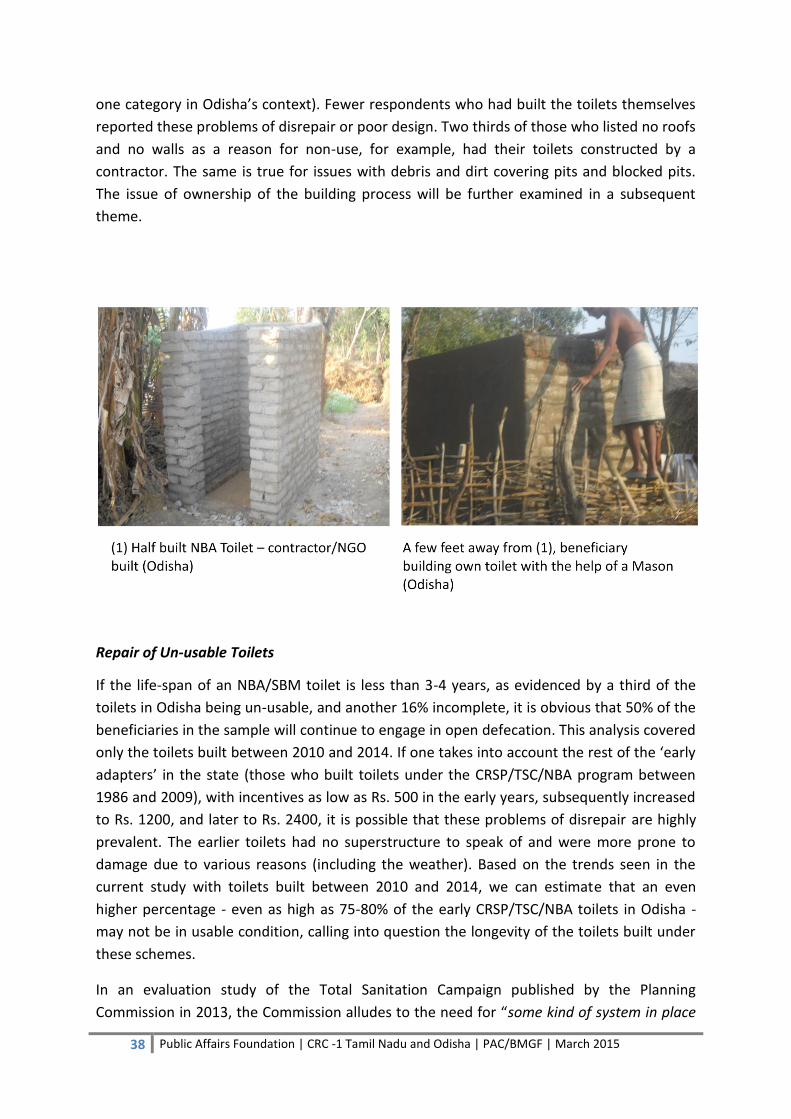
38 Public Affairs Foundation | CRC -1 Tamil Nadu and Odisha | PAC/BMGF | March 2015
one category in Odisha’s context). Fewer respondents who had built the toilets themselves
reported these problems of disrepair or poor design. Two thirds of those who listed no roofs
and no walls as a reason for non-use, for example, had their toilets constructed by a
contractor. The same is true for issues with debris and dirt covering pits and blocked pits.
The issue of ownership of the building process will be further examined in a subsequent
theme.
Repair of Un-usable Toilets
If the life-span of an NBA/SBM toilet is less than 3-4 years, as evidenced by a third of the
toilets in Odisha being un-usable, and another 16% incomplete, it is obvious that 50% of the
beneficiaries in the sample will continue to engage in open defecation. This analysis covered
only the toilets built between 2010 and 2014. If one takes into account the rest of the ‘early
adapters’ in the state (those who built toilets under the CRSP/TSC/NBA program between
1986 and 2009), with incentives as low as Rs. 500 in the early years, subsequently increased
to Rs. 1200, and later to Rs. 2400, it is possible that these problems of disrepair are highly
prevalent. The earlier toilets had no superstructure to speak of and were more prone to
damage due to various reasons (including the weather). Based on the trends seen in the
current study with toilets built between 2010 and 2014, we can estimate that an even
higher percentage - even as high as 75-80% of the early CRSP/TSC/NBA toilets in Odisha -
may not be in usable condition, calling into question the longevity of the toilets built under
these schemes.
In an evaluation study of the Total Sanitation Campaign published by the Planning
Commission in 2013, the Commission alludes to the need for “some kind of system in place
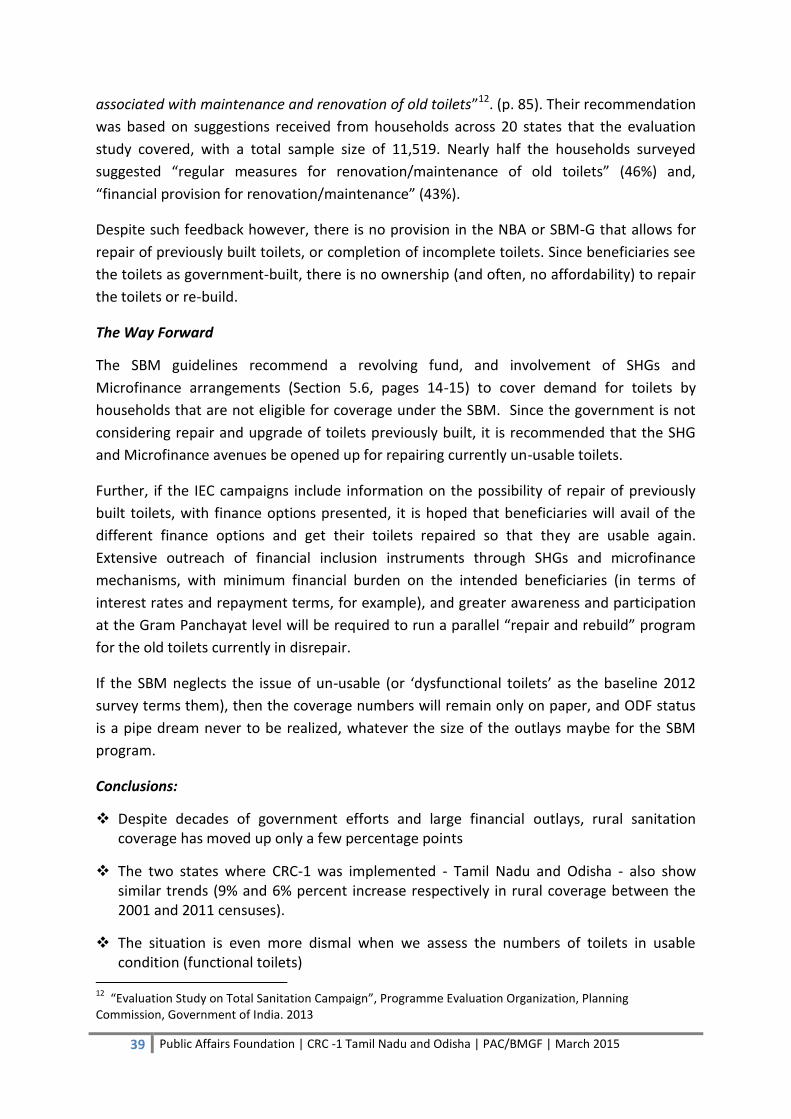
39 Public Affairs Foundation | CRC -1 Tamil Nadu and Odisha | PAC/BMGF | March 2015
associated with maintenance and renovation of old toilets”12. (p. 85). Their recommendation
was based on suggestions received from households across 20 states that the evaluation
study covered, with a total sample size of 11,519. Nearly half the households surveyed
suggested “regular measures for renovation/maintenance of old toilets” (46%) and,
“financial provision for renovation/maintenance” (43%).
Despite such feedback however, there is no provision in the NBA or SBM-G that allows for
repair of previously built toilets, or completion of incomplete toilets. Since beneficiaries see
the toilets as government-built, there is no ownership (and often, no affordability) to repair
the toilets or re-build.
The Way Forward
The SBM guidelines recommend a revolving fund, and involvement of SHGs and
Microfinance arrangements (Section 5.6, pages 14-15) to cover demand for toilets by
households that are not eligible for coverage under the SBM. Since the government is not
considering repair and upgrade of toilets previously built, it is recommended that the SHG
and Microfinance avenues be opened up for repairing currently un-usable toilets.
Further, if the IEC campaigns include information on the possibility of repair of previously
built toilets, with finance options presented, it is hoped that beneficiaries will avail of the
different finance options and get their toilets repaired so that they are usable again.
Extensive outreach of financial inclusion instruments through SHGs and microfinance
mechanisms, with minimum financial burden on the intended beneficiaries (in terms of
interest rates and repayment terms, for example), and greater awareness and participation
at the Gram Panchayat level will be required to run a parallel “repair and rebuild” program
for the old toilets currently in disrepair.
If the SBM neglects the issue of un-usable (or ‘dysfunctional toilets’ as the baseline 2012
survey terms them), then the coverage numbers will remain only on paper, and ODF status
is a pipe dream never to be realized, whatever the size of the outlays maybe for the SBM
program.
Conclusions:
Despite decades of government efforts and large financial outlays, rural sanitation coverage has moved up only a few percentage points
The two states where CRC-1 was implemented - Tamil Nadu and Odisha - also show similar trends (9% and 6% percent increase respectively in rural coverage between the 2001 and 2011 censuses).
The situation is even more dismal when we assess the numbers of toilets in usable condition (functional toilets)
12
“Evaluation Study on Total Sanitation Campaign”, Programme Evaluation Organization, Planning Commission, Government of India. 2013
40 Public Affairs Foundation | CRC -1 Tamil Nadu and Odisha | PAC/BMGF | March 2015
Toilets are un-usable for various environmental (flooding, cyclones) as well as man-made reasons (low quality, contractor-built, lack of superstructure (walls, roof, door), lack of money, contractor negligence.
The SBM-Gramin does not make any provisions for repair and rebuilding of the early adapters’ toilets.
Soft loans and favorable payment terms can be planned through SHGs and microfinance institutions to strengthen beneficiaries’ ability to repair and rebuild broken toilets
Hopes of achieving ODF targets rest on this yet to be planned strategy to repair and rebuild.
41 Public Affairs Foundation | CRC -1 Tamil Nadu and Odisha | PAC/BMGF | March 2015
Theme 2: Is Lack of Water an Impediment to Improving Toilet Usage?
Guidelines issued by the Government of India in October 2014 for the implementation of
Swachh Bharat Mission - Gramin (SBM-G) refer to the need for improving water supply to
aid the efforts of improving sanitation in the rural areas (section 3, page 4) :
Availability of water in the Villages is an important factor for sustaining sanitation facilities
created. Conjoint programmes may be prioritised at the District and GP levels under the SBM
(Gramin) and the National Rural Drinking Water Programme (NRDWP), to maximize the
availability of water for sanitary purposes.
Many studies have highlighted the close interrelation that exists between water and
sanitation. According to UN-Water the United Nations inter-agency coordination mechanism
for all freshwater and sanitation related matters, access to safe drinking water and
adequate sanitation services is vital to human health but has other important benefits
ranging from easily identifiable and quantifiable (costs avoided, time saved) to the more
intangible (convenience , well being, dignity, privacy and safety)13. The importance of water
and sanitation was further established when the United Nations General Assembly on 28th
July 2010, recognized the human right to water and sanitation. It acknowledged that clean
drinking water and sanitation are essential to the realization of human rights14.
In India it has been reported that nearly two-thirds of households now have access to
phones and LPG for cooking. But less than half the number of households have access to
basic toilet facilities, and over a third do not have access to safe drinking water15. Lack of
water is also one of the prime reasons cited as a cause of open defecation by households.
Alternative views have questioned this assertion - according to the SQUAT survey by RICE, in
the 2005 India Human Development Survey, rural households with piped water were only 9
percentage points less likely to defecate in the open than rural households without piped
water16.
Is lack of water an impediment to improving toilet usage under the NBA/SBM?
This note presents data from the CRCs in Tamil Nadu and Odisha and examines the notion of
water shortage as a reason for low toilet usage. Specifically, the analysis focuses on:
13
http://www.unwater.org/topics/water-sanitation-and-hygiene/en/ 14
Ibid. 15
The Hindu Business Line (2012) http://www.thehindubusinessline.com/industry-and-economy/article2991835.ece downloaded on 22nd January 2015 16
Coffey, Diane, Aashish Gupta, Payal Hathi, Nidhi Khurana, Dean Spears, Nikhil Srivastav, and Sangita Vyas. "Revealed preference for open defecation."Economic & Political Weekly 49, no. 38 (2014): 43.

42 Public Affairs Foundation | CRC -1 Tamil Nadu and Odisha | PAC/BMGF | March 2015
average water usage per day in the two states (six districts each that are included in the
study), as reported by respondents during the CRC
sources of water reported
average water use per day by those who state water as a reason for non usage of the
NBA toilet.
Water usage by households was measured by asking respondents to estimate the number of
pots or buckets of water (1 pot/bucket = 10 litres) they used for specific activities each day.
In addition to number of pots used for drinking water, the survey also recorded amount of
water used for domestic purposes such as bathing, cooking, toilet use, washing clothes and
vessels and, washing and feeding cattle.
Similarly, the main sources of water for domestic use, as well as distance travelled to fetch
water were also recorded.
In the next few sections of this note, water usage data are analyzed in the context of non-
usage of toilets, with lack of water as a reason for non-usage.
Toilet Usage
There is a stark difference in reported toilet usage between the two states. While Tamil
Nadu reported a very high percentage of users (83%, n=2222), Odisha was considerably
behind with 48% (n=1293) reporting that all members of the household use the toilet all the
time. A small percentage report some members using the toilet some of the time (3% in
Odisha), or during some seasons (2% in Odisha). For the most part however, usage can be
seen as a binary variable:
Table 11: Reported Toilet Usage
Toilet Usage* Tamil Nadu Odisha
Yes 83% 48%
No 15% 47%
While the reasons for non usage of toilets will be elaborated on elsewhere, this note deals
with the lack of water as an impediment - do respondents report lack of water as a reason
for not using toilets?
In Odisha, of the 47% that do not use the toilet, 620 respondents (23% of the total sample)
mentioned lack of water as a reason for not using the toilet. In Tamil Nadu, of the 15% that
*By all members of the family all the time
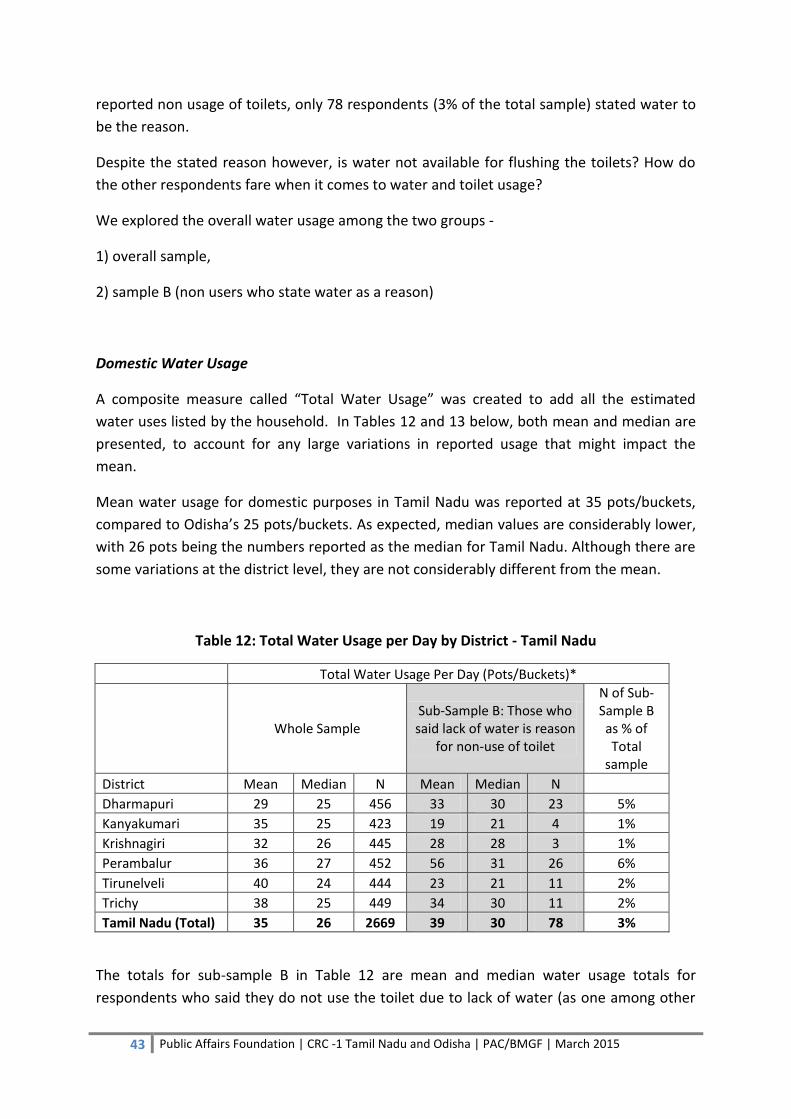
43 Public Affairs Foundation | CRC -1 Tamil Nadu and Odisha | PAC/BMGF | March 2015
reported non usage of toilets, only 78 respondents (3% of the total sample) stated water to
be the reason.
Despite the stated reason however, is water not available for flushing the toilets? How do
the other respondents fare when it comes to water and toilet usage?
We explored the overall water usage among the two groups -
1) overall sample,
2) sample B (non users who state water as a reason)
Domestic Water Usage
A composite measure called “Total Water Usage” was created to add all the estimated
water uses listed by the household. In Tables 12 and 13 below, both mean and median are
presented, to account for any large variations in reported usage that might impact the
mean.
Mean water usage for domestic purposes in Tamil Nadu was reported at 35 pots/buckets,
compared to Odisha’s 25 pots/buckets. As expected, median values are considerably lower,
with 26 pots being the numbers reported as the median for Tamil Nadu. Although there are
some variations at the district level, they are not considerably different from the mean.
Table 12: Total Water Usage per Day by District - Tamil Nadu
Total Water Usage Per Day (Pots/Buckets)*
Whole Sample Sub-Sample B: Those who said lack of water is reason
for non-use of toilet
N of Sub-Sample B as % of Total
sample
District Mean Median N Mean Median N
Dharmapuri 29 25 456 33 30 23 5%
Kanyakumari 35 25 423 19 21 4 1%
Krishnagiri 32 26 445 28 28 3 1%
Perambalur 36 27 452 56 31 26 6%
Tirunelveli 40 24 444 23 21 11 2%
Trichy 38 25 449 34 30 11 2%
Tamil Nadu (Total) 35 26 2669 39 30 78 3%
The totals for sub-sample B in Table 12 are mean and median water usage totals for
respondents who said they do not use the toilet due to lack of water (as one among other
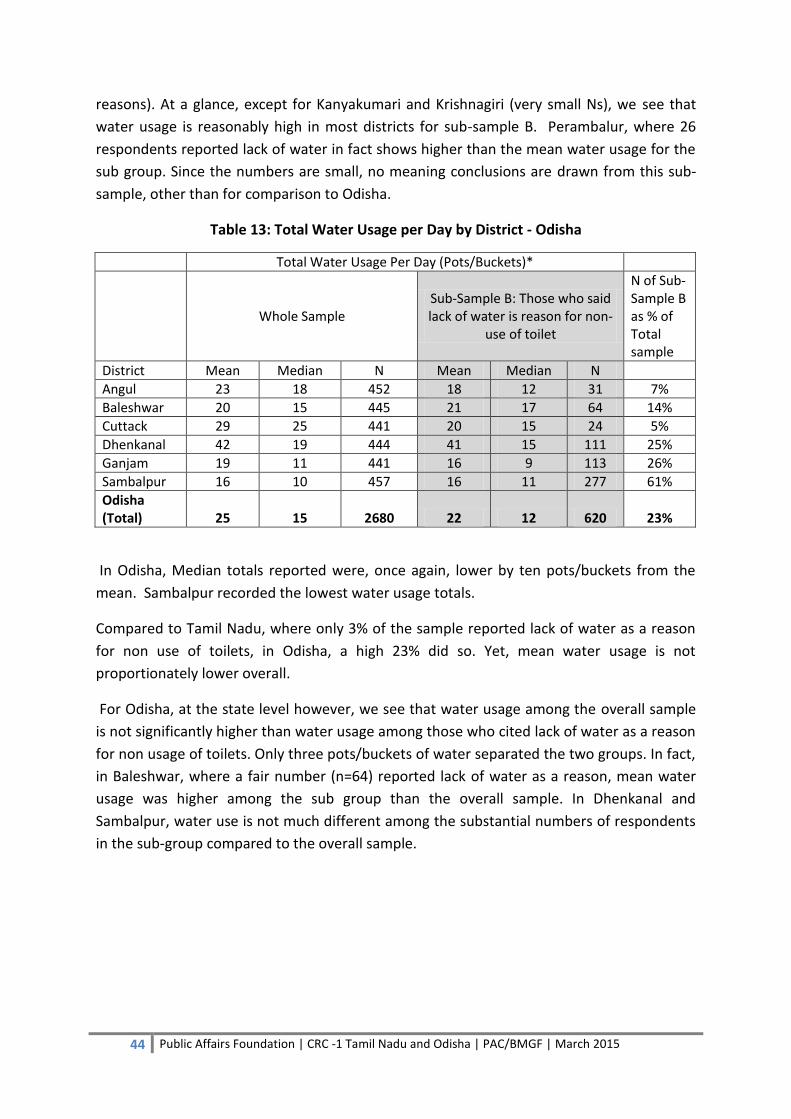
44 Public Affairs Foundation | CRC -1 Tamil Nadu and Odisha | PAC/BMGF | March 2015
reasons). At a glance, except for Kanyakumari and Krishnagiri (very small Ns), we see that
water usage is reasonably high in most districts for sub-sample B. Perambalur, where 26
respondents reported lack of water in fact shows higher than the mean water usage for the
sub group. Since the numbers are small, no meaning conclusions are drawn from this sub-
sample, other than for comparison to Odisha.
Table 13: Total Water Usage per Day by District - Odisha
Total Water Usage Per Day (Pots/Buckets)*
Whole Sample Sub-Sample B: Those who said lack of water is reason for non-
use of toilet
N of Sub-Sample B as % of Total sample
District Mean Median N Mean Median N
Angul 23 18 452 18 12 31 7%
Baleshwar 20 15 445 21 17 64 14%
Cuttack 29 25 441 20 15 24 5%
Dhenkanal 42 19 444 41 15 111 25%
Ganjam 19 11 441 16 9 113 26%
Sambalpur 16 10 457 16 11 277 61%
Odisha (Total) 25 15 2680 22 12 620 23%
In Odisha, Median totals reported were, once again, lower by ten pots/buckets from the
mean. Sambalpur recorded the lowest water usage totals.
Compared to Tamil Nadu, where only 3% of the sample reported lack of water as a reason
for non use of toilets, in Odisha, a high 23% did so. Yet, mean water usage is not
proportionately lower overall.
For Odisha, at the state level however, we see that water usage among the overall sample
is not significantly higher than water usage among those who cited lack of water as a reason
for non usage of toilets. Only three pots/buckets of water separated the two groups. In fact,
in Baleshwar, where a fair number (n=64) reported lack of water as a reason, mean water
usage was higher among the sub group than the overall sample. In Dhenkanal and
Sambalpur, water use is not much different among the substantial numbers of respondents
in the sub-group compared to the overall sample.
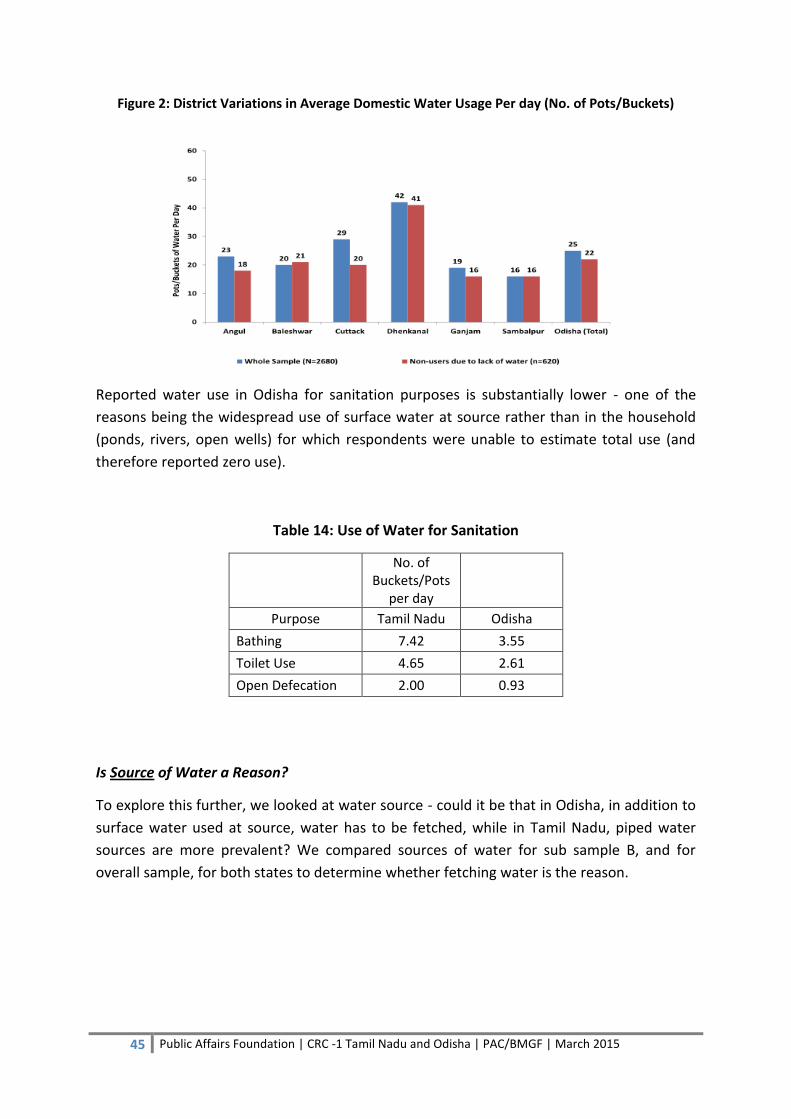
45 Public Affairs Foundation | CRC -1 Tamil Nadu and Odisha | PAC/BMGF | March 2015
Figure 2: District Variations in Average Domestic Water Usage Per day (No. of Pots/Buckets)
Reported water use in Odisha for sanitation purposes is substantially lower - one of the
reasons being the widespread use of surface water at source rather than in the household
(ponds, rivers, open wells) for which respondents were unable to estimate total use (and
therefore reported zero use).
Table 14: Use of Water for Sanitation
No. of Buckets/Pots
per day
Purpose Tamil Nadu Odisha
Bathing 7.42 3.55
Toilet Use 4.65 2.61
Open Defecation 2.00 0.93
Is Source of Water a Reason?
To explore this further, we looked at water source - could it be that in Odisha, in addition to
surface water used at source, water has to be fetched, while in Tamil Nadu, piped water
sources are more prevalent? We compared sources of water for sub sample B, and for
overall sample, for both states to determine whether fetching water is the reason.

46 Public Affairs Foundation | CRC -1 Tamil Nadu and Odisha | PAC/BMGF | March 2015
Table 15: Water Piped Into Dwelling or Yard - Odisha
District Total Sample
(N=2680)
Water stated as problem for non use of toilet
(n=620)
Percent Piped Water (Into Dwelling or Yard)
N Percent N Percent
Angul 226 50 5 16
Baleshwar 118 27 0 0
Cuttack 189 43 1 4
Dhenkenal 4 1 0 0
Ganjam 94 21 1 1
Sambalpur 27 6 10 4
Odisha 658 25 17 3
Although previous analyses showed fairly even water usage between the two samples, a
substantial difference is seen in the source of water. In Odisha, while the overall sample had
25% of the respondents reporting piped water (into either the dwelling or the yard), only 3%
of those who cited lack of water as an issue had piped water. All the others fetched water
from a public tap/standpost, borewell or covered/uncovered wells, or surface water such as
ponds, rivers and streams.
District variations are also quite prominent: in Angul while 50% had piped water, only 16%
of the sub sample of non-users of toilets had piped water. In Baleshwar, none of the non-
users had piped water.
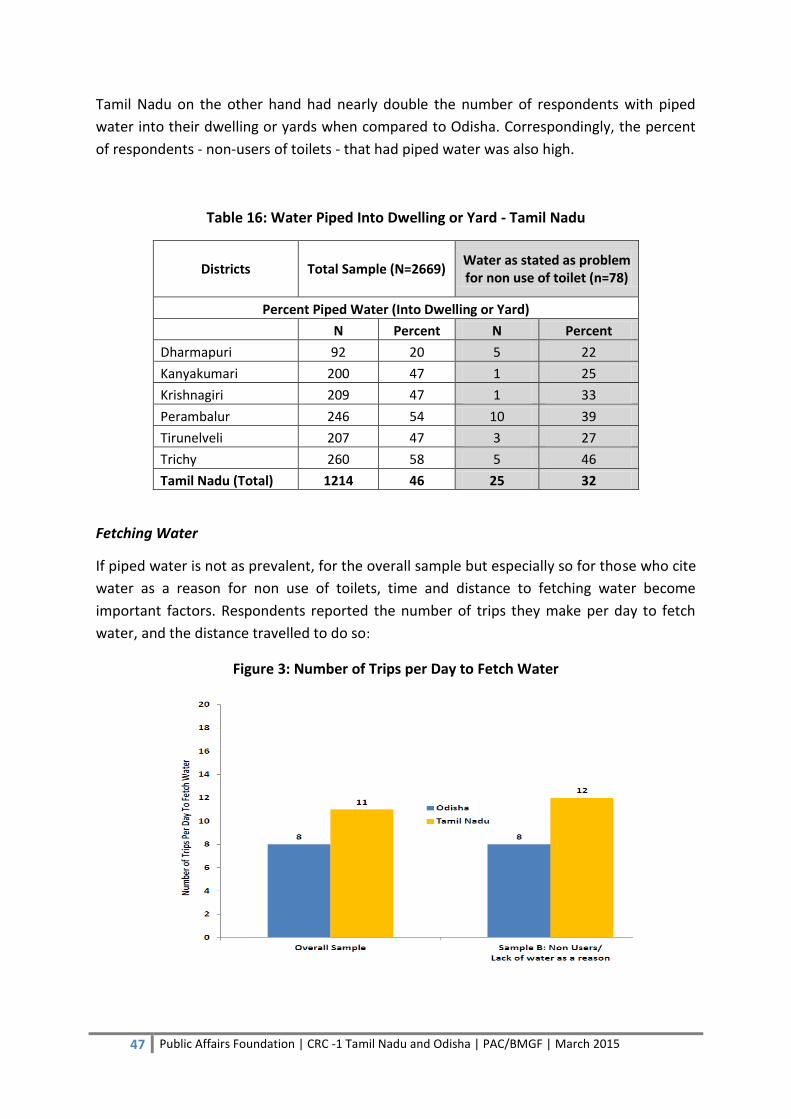
47 Public Affairs Foundation | CRC -1 Tamil Nadu and Odisha | PAC/BMGF | March 2015
Tamil Nadu on the other hand had nearly double the number of respondents with piped
water into their dwelling or yards when compared to Odisha. Correspondingly, the percent
of respondents - non-users of toilets - that had piped water was also high.
Table 16: Water Piped Into Dwelling or Yard - Tamil Nadu
Districts Total Sample (N=2669) Water as stated as problem for non use of toilet (n=78)
Percent Piped Water (Into Dwelling or Yard)
N Percent N Percent
Dharmapuri 92 20 5 22
Kanyakumari 200 47 1 25
Krishnagiri 209 47 1 33
Perambalur 246 54 10 39
Tirunelveli 207 47 3 27
Trichy 260 58 5 46
Tamil Nadu (Total) 1214 46 25 32
Fetching Water
If piped water is not as prevalent, for the overall sample but especially so for those who cite
water as a reason for non use of toilets, time and distance to fetching water become
important factors. Respondents reported the number of trips they make per day to fetch
water, and the distance travelled to do so:
Figure 3: Number of Trips per Day to Fetch Water

48 Public Affairs Foundation | CRC -1 Tamil Nadu and Odisha | PAC/BMGF | March 2015
In Odisha (Figure 3), the overall sample, as well as those who cited water as a reason both
reported the same number of trips per day to fetch water. In Tamil Nadu, the difference
between the two samples was marginal, with the sub sample reporting one trip more than
the overall sample. While comparing the two states however, it is obvious that respondents
in Tamil Nadu made more trips to fetch water than their counterparts in Odisha. Since
volume of water used is also higher in Tamil Nadu, the higher number of trips validates the
finding of high usage.
Figure 4: Distance Travelled Per Trip to Fetch Water
Those who cited lack of water as a reason for non-use of toilets travelled slightly longer
distances in Odisha (88 meters) per trip to fetch water from a source outside their home. In
Tamil Nadu, the reverse seemed to be true, although due to the small Ns (78 for the sub
sample), and the median being only 25 meters, it is prudent to surmise that the distance
travelled in Tamil Nadu per trip is not very high.
In summary, the number of trips per day to fetch water is similar for both the overall and
sub-samples, and the distance travelled is only marginally higher for non-users in Odisha.
Variations by Gender and Social Group
Across both states, gender of those fetching water showed uniform results: 95% of the
respondents in both states said that adult women mostly fetch water.
Finally, we looked at whether the experience of lack of water for toilet use varies by social
group. It appears that a higher percent of some groups - ST in Odisha and SC in Tamil Nadu -
reported lack of water as a reason compared to their proportion in the overall sample:

49 Public Affairs Foundation | CRC -1 Tamil Nadu and Odisha | PAC/BMGF | March 2015
Figure 5: Reports of Lack of Water as a Problem by Social Group
Conclusions
Usage of water is similar in the two groups: the overall sample and the sub sample of respondents who reported non-use of toilets due to lack of water (among other reasons).
Difference in water source - whether piped-in or fetched - seems to be a driver in deciding whether water is used for toilet flushing purposes. Those who cite lack of water are more likely to be fetching water from outside sources.
Availability of water, distance and trips being near constant, it appears that those who fetch water try to prioritize use due to the extra effort required in fetching the water when compared to those who have water piped into their dwelling or yard. Water for toilet purposes could be low on the priority list.
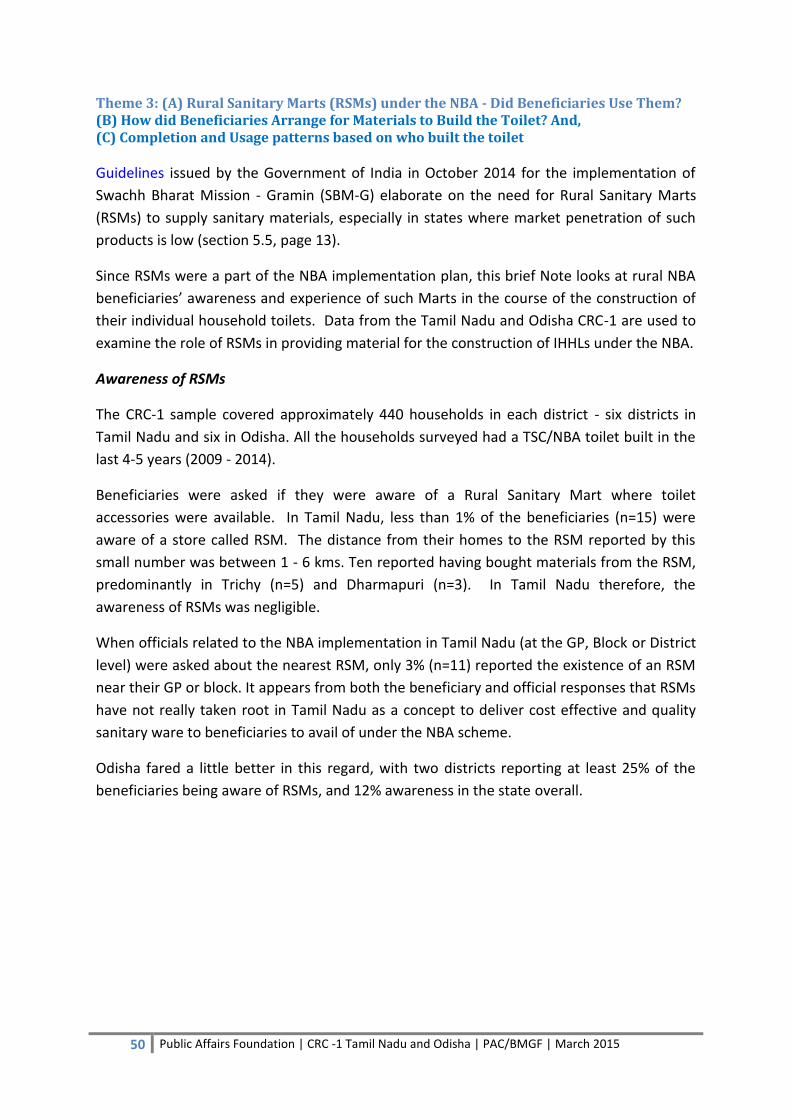
50 Public Affairs Foundation | CRC -1 Tamil Nadu and Odisha | PAC/BMGF | March 2015
Theme 3: (A) Rural Sanitary Marts (RSMs) under the NBA - Did Beneficiaries Use Them? (B) How did Beneficiaries Arrange for Materials to Build the Toilet? And, (C) Completion and Usage patterns based on who built the toilet
Guidelines issued by the Government of India in October 2014 for the implementation of
Swachh Bharat Mission - Gramin (SBM-G) elaborate on the need for Rural Sanitary Marts
(RSMs) to supply sanitary materials, especially in states where market penetration of such
products is low (section 5.5, page 13).
Since RSMs were a part of the NBA implementation plan, this brief Note looks at rural NBA
beneficiaries’ awareness and experience of such Marts in the course of the construction of
their individual household toilets. Data from the Tamil Nadu and Odisha CRC-1 are used to
examine the role of RSMs in providing material for the construction of IHHLs under the NBA.
Awareness of RSMs
The CRC-1 sample covered approximately 440 households in each district - six districts in
Tamil Nadu and six in Odisha. All the households surveyed had a TSC/NBA toilet built in the
last 4-5 years (2009 - 2014).
Beneficiaries were asked if they were aware of a Rural Sanitary Mart where toilet
accessories were available. In Tamil Nadu, less than 1% of the beneficiaries (n=15) were
aware of a store called RSM. The distance from their homes to the RSM reported by this
small number was between 1 - 6 kms. Ten reported having bought materials from the RSM,
predominantly in Trichy (n=5) and Dharmapuri (n=3). In Tamil Nadu therefore, the
awareness of RSMs was negligible.
When officials related to the NBA implementation in Tamil Nadu (at the GP, Block or District
level) were asked about the nearest RSM, only 3% (n=11) reported the existence of an RSM
near their GP or block. It appears from both the beneficiary and official responses that RSMs
have not really taken root in Tamil Nadu as a concept to deliver cost effective and quality
sanitary ware to beneficiaries to avail of under the NBA scheme.
Odisha fared a little better in this regard, with two districts reporting at least 25% of the
beneficiaries being aware of RSMs, and 12% awareness in the state overall.
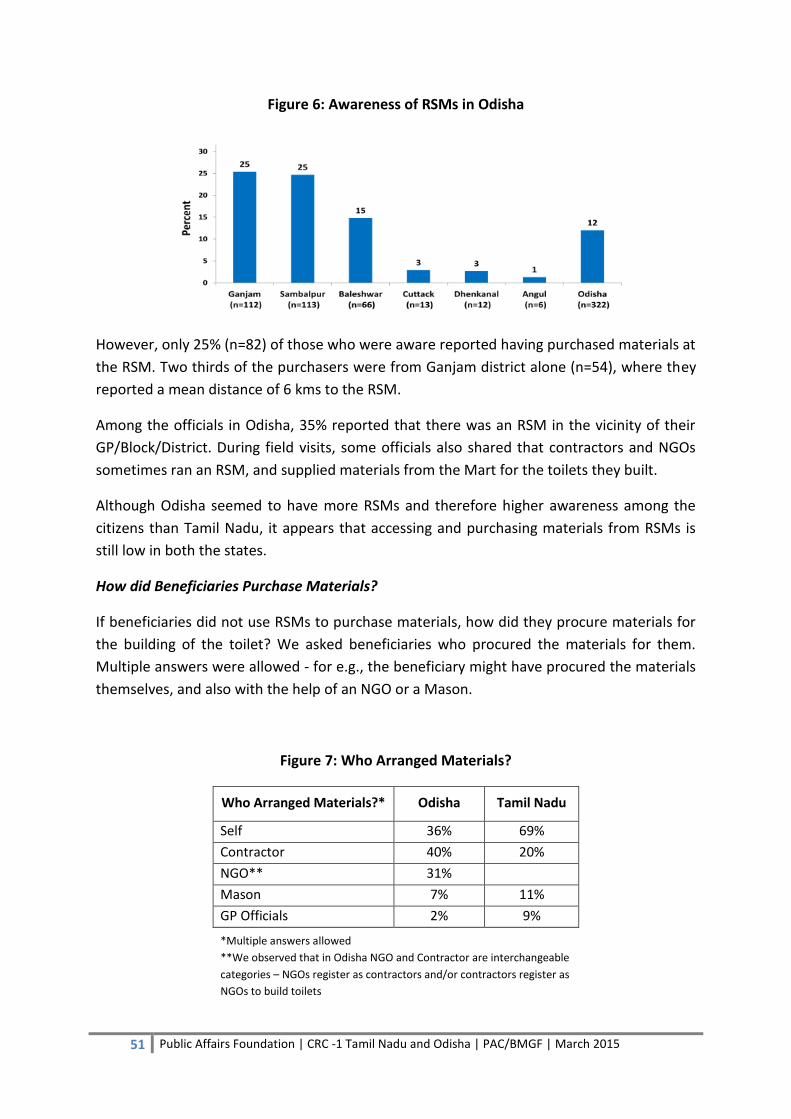
51 Public Affairs Foundation | CRC -1 Tamil Nadu and Odisha | PAC/BMGF | March 2015
Figure 6: Awareness of RSMs in Odisha
However, only 25% (n=82) of those who were aware reported having purchased materials at
the RSM. Two thirds of the purchasers were from Ganjam district alone (n=54), where they
reported a mean distance of 6 kms to the RSM.
Among the officials in Odisha, 35% reported that there was an RSM in the vicinity of their
GP/Block/District. During field visits, some officials also shared that contractors and NGOs
sometimes ran an RSM, and supplied materials from the Mart for the toilets they built.
Although Odisha seemed to have more RSMs and therefore higher awareness among the
citizens than Tamil Nadu, it appears that accessing and purchasing materials from RSMs is
still low in both the states.
How did Beneficiaries Purchase Materials?
If beneficiaries did not use RSMs to purchase materials, how did they procure materials for
the building of the toilet? We asked beneficiaries who procured the materials for them.
Multiple answers were allowed - for e.g., the beneficiary might have procured the materials
themselves, and also with the help of an NGO or a Mason.
Figure 7: Who Arranged Materials?
Who Arranged Materials?* Odisha Tamil Nadu
Self 36% 69%
Contractor 40% 20%
NGO** 31%
Mason 7% 11%
GP Officials 2% 9%
*Multiple answers allowed
**We observed that in Odisha NGO and Contractor are interchangeable
categories – NGOs register as contractors and/or contractors register as
NGOs to build toilets
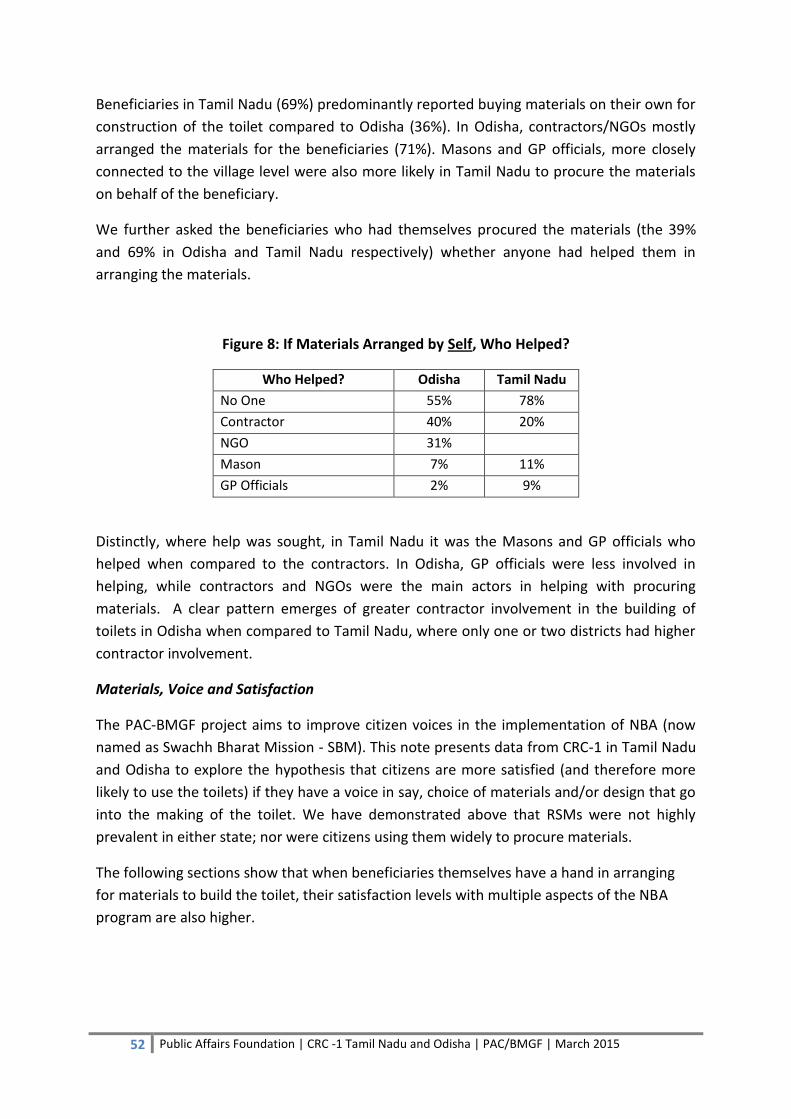
52 Public Affairs Foundation | CRC -1 Tamil Nadu and Odisha | PAC/BMGF | March 2015
Beneficiaries in Tamil Nadu (69%) predominantly reported buying materials on their own for
construction of the toilet compared to Odisha (36%). In Odisha, contractors/NGOs mostly
arranged the materials for the beneficiaries (71%). Masons and GP officials, more closely
connected to the village level were also more likely in Tamil Nadu to procure the materials
on behalf of the beneficiary.
We further asked the beneficiaries who had themselves procured the materials (the 39%
and 69% in Odisha and Tamil Nadu respectively) whether anyone had helped them in
arranging the materials.
Figure 8: If Materials Arranged by Self, Who Helped?
Who Helped? Odisha Tamil Nadu
No One 55% 78%
Contractor 40% 20%
NGO 31%
Mason 7% 11%
GP Officials 2% 9%
Distinctly, where help was sought, in Tamil Nadu it was the Masons and GP officials who
helped when compared to the contractors. In Odisha, GP officials were less involved in
helping, while contractors and NGOs were the main actors in helping with procuring
materials. A clear pattern emerges of greater contractor involvement in the building of
toilets in Odisha when compared to Tamil Nadu, where only one or two districts had higher
contractor involvement.
Materials, Voice and Satisfaction
The PAC-BMGF project aims to improve citizen voices in the implementation of NBA (now
named as Swachh Bharat Mission - SBM). This note presents data from CRC-1 in Tamil Nadu
and Odisha to explore the hypothesis that citizens are more satisfied (and therefore more
likely to use the toilets) if they have a voice in say, choice of materials and/or design that go
into the making of the toilet. We have demonstrated above that RSMs were not highly
prevalent in either state; nor were citizens using them widely to procure materials.
The following sections show that when beneficiaries themselves have a hand in arranging
for materials to build the toilet, their satisfaction levels with multiple aspects of the NBA
program are also higher.
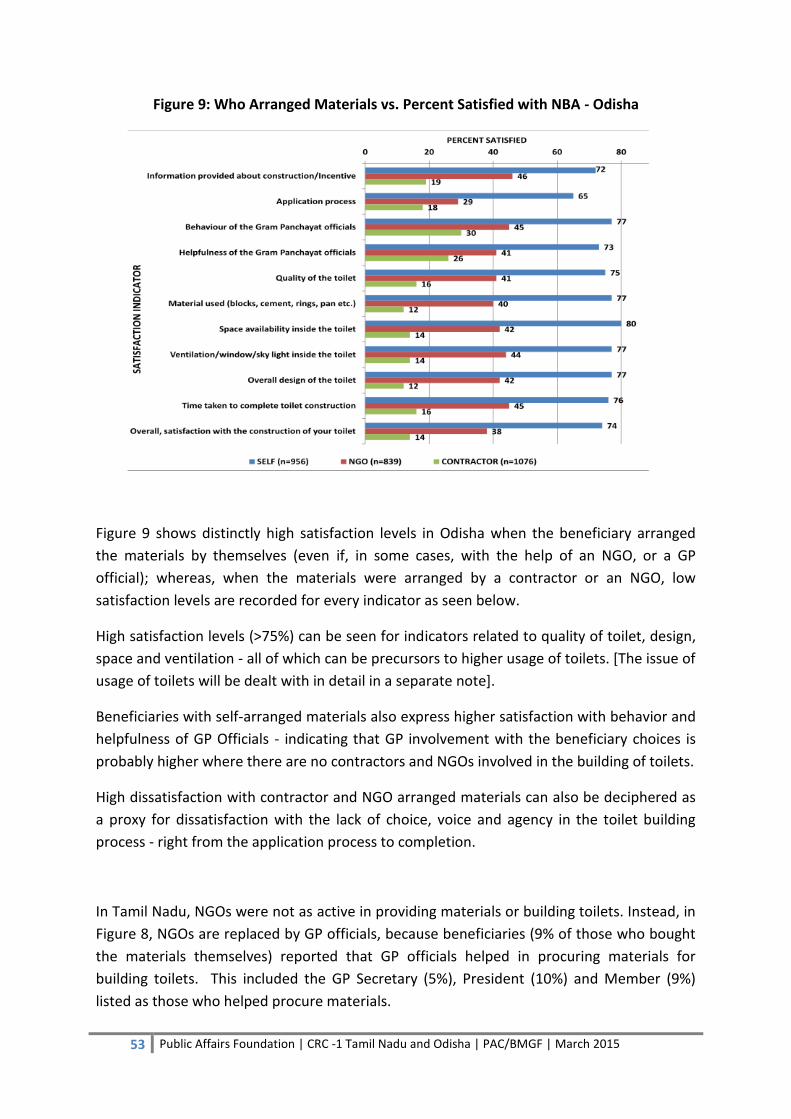
53 Public Affairs Foundation | CRC -1 Tamil Nadu and Odisha | PAC/BMGF | March 2015
Figure 9: Who Arranged Materials vs. Percent Satisfied with NBA - Odisha
Figure 9 shows distinctly high satisfaction levels in Odisha when the beneficiary arranged
the materials by themselves (even if, in some cases, with the help of an NGO, or a GP
official); whereas, when the materials were arranged by a contractor or an NGO, low
satisfaction levels are recorded for every indicator as seen below.
High satisfaction levels (>75%) can be seen for indicators related to quality of toilet, design,
space and ventilation - all of which can be precursors to higher usage of toilets. [The issue of
usage of toilets will be dealt with in detail in a separate note].
Beneficiaries with self-arranged materials also express higher satisfaction with behavior and
helpfulness of GP Officials - indicating that GP involvement with the beneficiary choices is
probably higher where there are no contractors and NGOs involved in the building of toilets.
High dissatisfaction with contractor and NGO arranged materials can also be deciphered as
a proxy for dissatisfaction with the lack of choice, voice and agency in the toilet building
process - right from the application process to completion.
In Tamil Nadu, NGOs were not as active in providing materials or building toilets. Instead, in
Figure 8, NGOs are replaced by GP officials, because beneficiaries (9% of those who bought
the materials themselves) reported that GP officials helped in procuring materials for
building toilets. This included the GP Secretary (5%), President (10%) and Member (9%)
listed as those who helped procure materials.
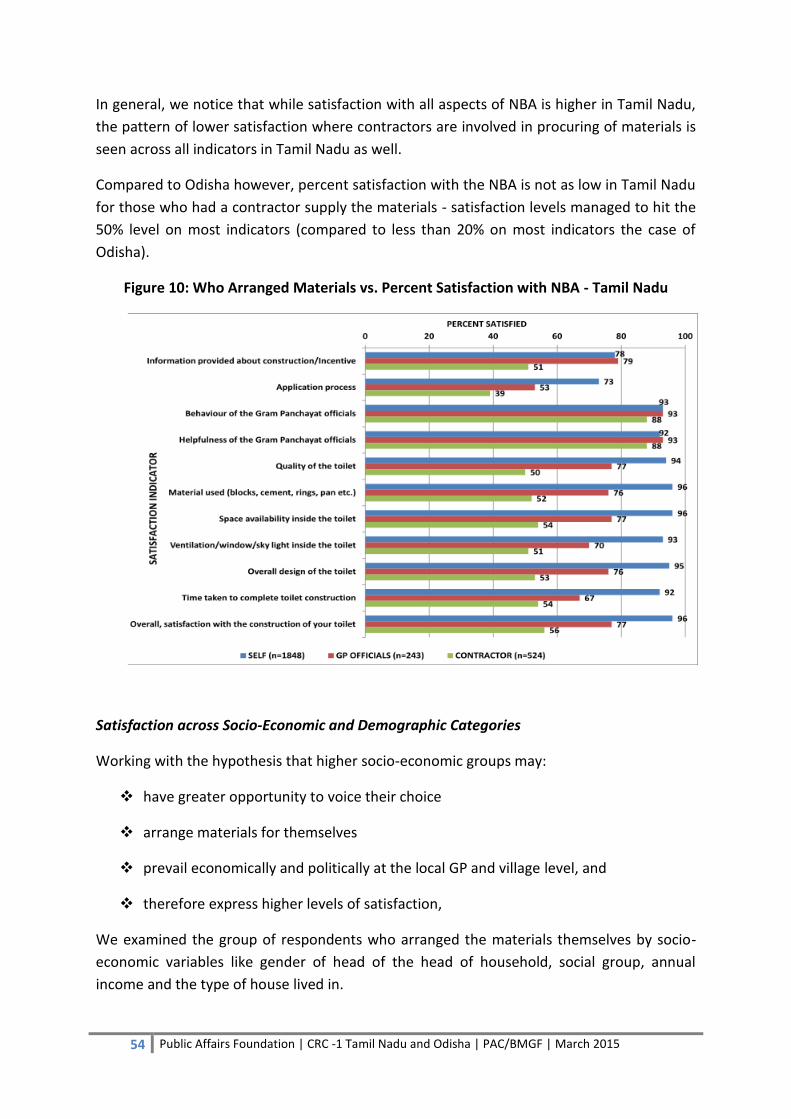
54 Public Affairs Foundation | CRC -1 Tamil Nadu and Odisha | PAC/BMGF | March 2015
In general, we notice that while satisfaction with all aspects of NBA is higher in Tamil Nadu,
the pattern of lower satisfaction where contractors are involved in procuring of materials is
seen across all indicators in Tamil Nadu as well.
Compared to Odisha however, percent satisfaction with the NBA is not as low in Tamil Nadu
for those who had a contractor supply the materials - satisfaction levels managed to hit the
50% level on most indicators (compared to less than 20% on most indicators the case of
Odisha).
Figure 10: Who Arranged Materials vs. Percent Satisfaction with NBA - Tamil Nadu
Satisfaction across Socio-Economic and Demographic Categories
Working with the hypothesis that higher socio-economic groups may:
have greater opportunity to voice their choice
arrange materials for themselves
prevail economically and politically at the local GP and village level, and
therefore express higher levels of satisfaction,
We examined the group of respondents who arranged the materials themselves by socio-
economic variables like gender of head of the head of household, social group, annual
income and the type of house lived in.
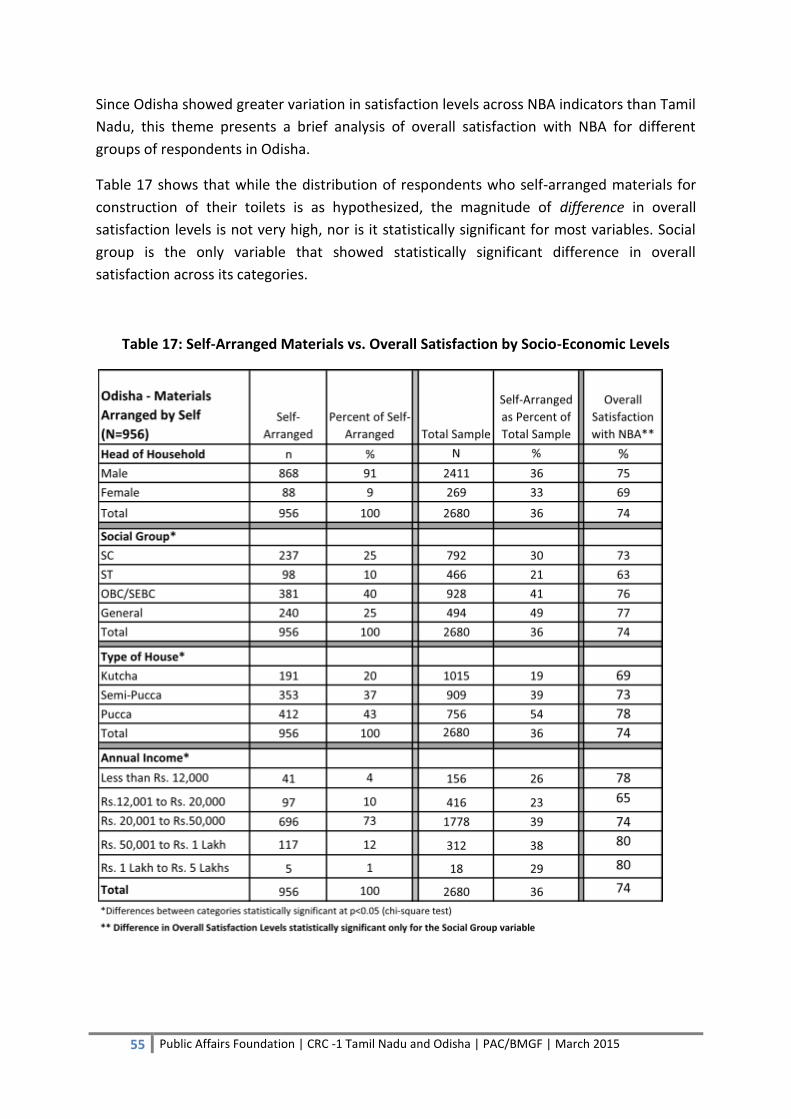
55 Public Affairs Foundation | CRC -1 Tamil Nadu and Odisha | PAC/BMGF | March 2015
Since Odisha showed greater variation in satisfaction levels across NBA indicators than Tamil
Nadu, this theme presents a brief analysis of overall satisfaction with NBA for different
groups of respondents in Odisha.
Table 17 shows that while the distribution of respondents who self-arranged materials for
construction of their toilets is as hypothesized, the magnitude of difference in overall
satisfaction levels is not very high, nor is it statistically significant for most variables. Social
group is the only variable that showed statistically significant difference in overall
satisfaction across its categories.
Table 17: Self-Arranged Materials vs. Overall Satisfaction by Socio-Economic Levels
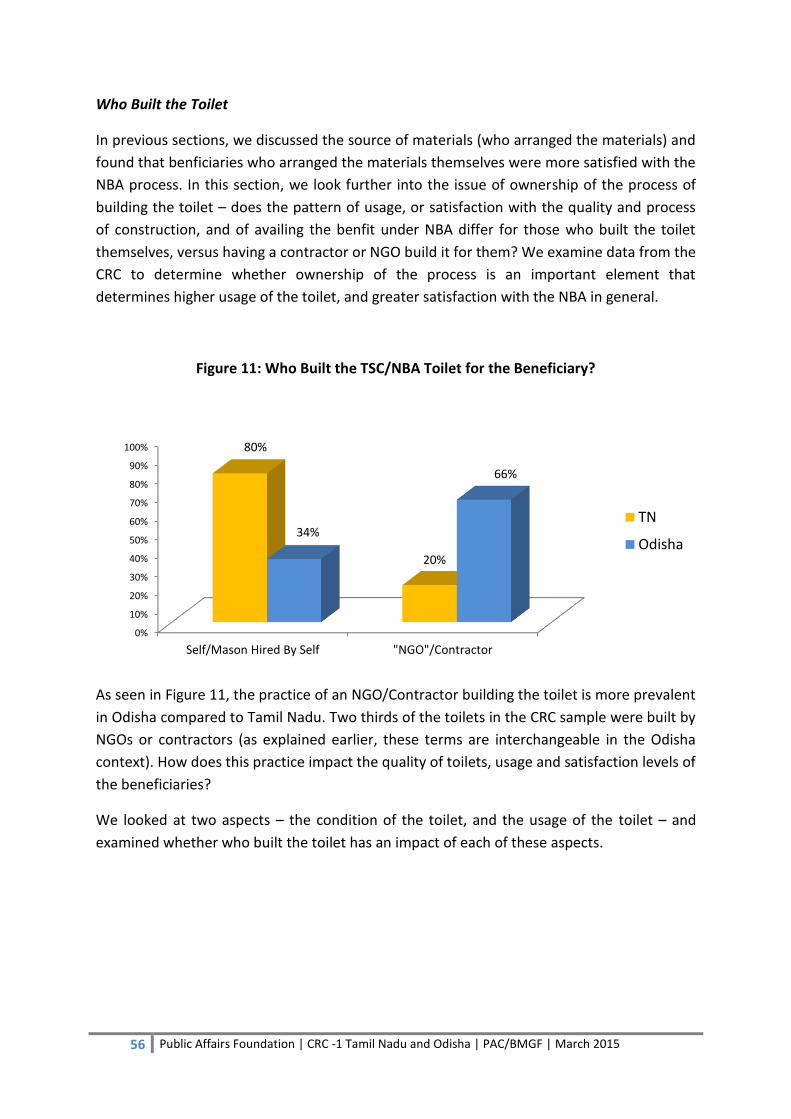
56 Public Affairs Foundation | CRC -1 Tamil Nadu and Odisha | PAC/BMGF | March 2015
Who Built the Toilet
In previous sections, we discussed the source of materials (who arranged the materials) and
found that benficiaries who arranged the materials themselves were more satisfied with the
NBA process. In this section, we look further into the issue of ownership of the process of
building the toilet – does the pattern of usage, or satisfaction with the quality and process
of construction, and of availing the benfit under NBA differ for those who built the toilet
themselves, versus having a contractor or NGO build it for them? We examine data from the
CRC to determine whether ownership of the process is an important element that
determines higher usage of the toilet, and greater satisfaction with the NBA in general.
Figure 11: Who Built the TSC/NBA Toilet for the Beneficiary?
As seen in Figure 11, the practice of an NGO/Contractor building the toilet is more prevalent
in Odisha compared to Tamil Nadu. Two thirds of the toilets in the CRC sample were built by
NGOs or contractors (as explained earlier, these terms are interchangeable in the Odisha
context). How does this practice impact the quality of toilets, usage and satisfaction levels of
the beneficiaries?
We looked at two aspects – the condition of the toilet, and the usage of the toilet – and
examined whether who built the toilet has an impact of each of these aspects.
0%
10%
20%
30%
40%
50%
60%
70%
80%
90%
100%
Self/Mason Hired By Self "NGO"/Contractor
80%
20%
34%
66%
TN
Odisha

57 Public Affairs Foundation | CRC -1 Tamil Nadu and Odisha | PAC/BMGF | March 2015
Condition of the Toilet
Beneficiaries were asked the condition of the toilet; whether it is:
Completed and in usable condition
Completed and not in usable condition
Discontinued construction/half constructed toilet
Table 18 clearly shows the relationship between the factors – both in Tamil Nadu and
Odisha, a significantly higher percentage of toilets built by the beneficiaries themselves (or
with the help of a Mason that they hired) were completed and in usable condition
compared to those built by NGO/Contractors. The difference in usabilty of toilets is
especially stark in Odisha where, as shown in Figure 11, a majority of toilets are built by
NGO/Contractors.
Table 18: Condition of the Toilet vs. Who Built the Toilet
In both the states, toilets being complete but unusable were considerably less (6% in Tamil
Nadu and 7% in Odisha) if the beneficiaries had constructed it themselves. In Odisha, 45% of
the toilets built by NGOs/contractors were completed but unusable.
In Tamil Nadu, discontinued construction or half constructed toilets were seen in more
number of cases (18% of toilets built by contractors) compared to own-built (5%). This
difference did not present itself in Odisha where discontinued construction was reported by
15% of households with own-built toilets.
Condition of the Toilet
Self/Mason Hired
By Self NGO/Contractor
Tamil Nadu
Completed and in usable condition 89% 61%
Completed and not in usable condition 6% 21%
Discontinued Construction/Half constructed toilet 5% 18%
Total (n=2119) (n=524)
Odisha
Completed and in usable condition 77% 40%
Completed and not in usable condition 7% 45%
Discontinued Construction/Half constructed toilet 16% 15%
Total (n=895) (n=1751)
Who Built The Toilet

58 Public Affairs Foundation | CRC -1 Tamil Nadu and Odisha | PAC/BMGF | March 2015
Usage of Toilets
Results of usage of toilets showed similar results as above when the builder of the toilet was
factored in. By a wide and statistically significant margin, beneficiaries who built the toilet
themselves reported higher usage than beneficiaries with toilets built by NGOs/contractors.
The association in both these 2x2 tables is statistically significant at the .05 level (chi-square
test).
Table 19: Usage of Toilet vs. Who Built the Toilet
The differences in usage are evident when the above table is broken down by district for
each state. Table 20 shows that some districts in Odisha reported against the trend – Angul
for example, with 55% contractor-built toilets still reported high usage. On the other
extreme, Sambalpur with 92% contractor-built toilets showed very poor usage, with only 5%
reporting that all the members in the family use the toilet all the time.
Table 20: Usage vs. Who Built the Toilet - by District (Odisha)
Tamil Nadu, albeit with higher usage numbers than Odisha overall, also showed similar
trends where districts with contractor-built toilets reported lower usage compared to own-
built toilets (Table 21). Two districts in Tamil Nadu – Kanyakumari and Tirunelveli, both in
Usage of ToiletSelf/Mason hired
by SelfNGO/Contractor
Yes, all members use all the time 89% 66%
Nobody uses the toilet 11% 34%
Total (Tamil Nadu) 100% (n=2093) 100% (n=511)
Yes, all members use all the time 78% 38%
Nobody uses the toilet 22% 62%
Total (Odisha) 100% (n=842) 100% (n=1678)
Who Built the Toilet
Self/Mason
Hired By
Self
NGO/
ContractorTotal n
Yes, all
members use
all the time
Nobody
uses the
toilet
Total n
Angul 45% 55% 450 89% 11% 440
Baleshwar 7% 93% 445 50% 50% 441
Cuttack 90% 10% 440 77% 23% 418
Dhenkanal 12% 88% 435 30% 70% 405
Ganjam 41% 59% 434 55% 45% 405
Sambalpur 8% 92% 442 5% 95% 443
Odisha 34% 66% 2646 51% 49% 2552
Who Built the Toilet Usage of Toilet

59 Public Affairs Foundation | CRC -1 Tamil Nadu and Odisha | PAC/BMGF | March 2015
the south of the state – were the only two districts to report more than 90% usage.
Significantly, both these districts had no reports of contractor involvement in the building of
the toilets. Overall for the state of Tamil Nadu, beneficiaries reporting own-built toilets
(80%) were remarkably close to those reporting usage of toilets by all members of the
household all the time (84%).
Table 21: Usage vs. Who Built the Toilet - By District (Tamil Nadu)
Conclusions
While RSMs were touted as a one stop shop for buying toilet accessories in the rural
areas, the concept has not really taken off yet. If the SBM wants to promote RSMs as
such outlets, penetration in rural areas needs to be high, citizen friendly, accessible and
economical.
Beneficiaries in both states have clearly indicated their high satisfaction levels with the
quality, design and spaciousness of the toilet, and their overall NBA experience, when
they have a voice and ownership in planning for the toilet in their home and procuring
materials.
Conversely, contractor driven mass building of sub-standard toilets, with limited or no
avenues for beneficiary engagement have not elicited high satisfaction levels among the
beneficiaries.
Although overall satisfaction levels with the NBA differed across socio-economic and
demographic categories, most differences were not statistically significant.
Completion and usage of toilets is also strongly related to who built the toilets for the
beneficiary. Those who built the toilet themselves (or hired a mason to build it for them)
showed higher completion and usage of toilets compared to households with
NGO/Contractor built toilets.
Self/Mason
Hired By Us
NGO/
ContractorTotal n
Yes, all
members use
all the time
Nobody
uses the
toilet
Total n
Dharmapuri 49% 51% 451 74% 26% 444
Krishnagiri 82% 18% 441 87% 13% 443
Kanyakumari 100% 421 97% 3% 423
Tirunelveli 100% 443 91% 9% 441
Perambalur 56% 44% 439 78% 22% 443
Trichy 96% 4% 448 81% 19% 435
Tamil Nadu 80% 20% 2643 84% 16% 2629
Who Built the Toilet Usage of Toilet
60 Public Affairs Foundation | CRC -1 Tamil Nadu and Odisha | PAC/BMGF | March 2015
Theme 4: Beneficiary experience of corruption while building a toilet
under the NBA One of the important components that a CRC measures in the course of studying
transparency and accountability in service delivery is corruption. It may be direct corruption
where a citizen has to pay extra money to access and use services provided by the
government, or indirect corruption where the citizen may not pay extra money, but is
impacted by poor or no service delivery due to corruption somewhere along the supply
route.
Since the CRC is based on citizen responses and feedback of experienced service delivery,
the tool is effective in measuring whether respondents/beneficiaries have paid extra money
to avail of services. The other forms of indirect corruption may or may not be known to the
citizens. Even if known, they may be unwilling to report, due to the adverse consequences
of reporting such incidents. Other CRCs have shown that both direct and indirect corruption
are often underreported. It is necessary therefore to get additional insights into this issue
through interactions during field work, monitoring, interviews and Focus Group Discussions.
This theme discusses citizen feedback on direct corruption In the current CRC covering the
Nirmal Bharat Abhiyan (NBA) in Tamil Nadu and Odisha, as well as insights into other forms
of indirect corruption that might have impacted the effective delivery of services under the
NBA in the two states. Data from household survey of beneficiaries in six districts each of
the two states, as well as interviews with service providers are used to present the findings
on corruption. In addition, observations from field interactions are presented to report on
different forms that corruption might take in the course of service delivery.
For obvious reasons, although comparisons are made at the state and district level, we have
endeavored to present examples without revealing identifying information at the GP or
block level.
Direct Corruption
Respondents were asked if, during the process of construction of the toilet, they had to pay
‘extra money’ to anyone to get their work done. Typically, the ‘extra money’ phrase is used
in the questionnaire, rather than ‘corruption’, to put the respondent at ease. If required, the
investigator conducting the interview is asked to elaborate on the ‘extra money’ that may
have been paid. If the respondent answered ‘yes’ to the question, then further questions
were asked to determine the stage of the NBA beneficiary process at which they had to pay
extra money. These include:
To be selected as a beneficiary
To get an application form
For the approval of the application
For arranging the materials
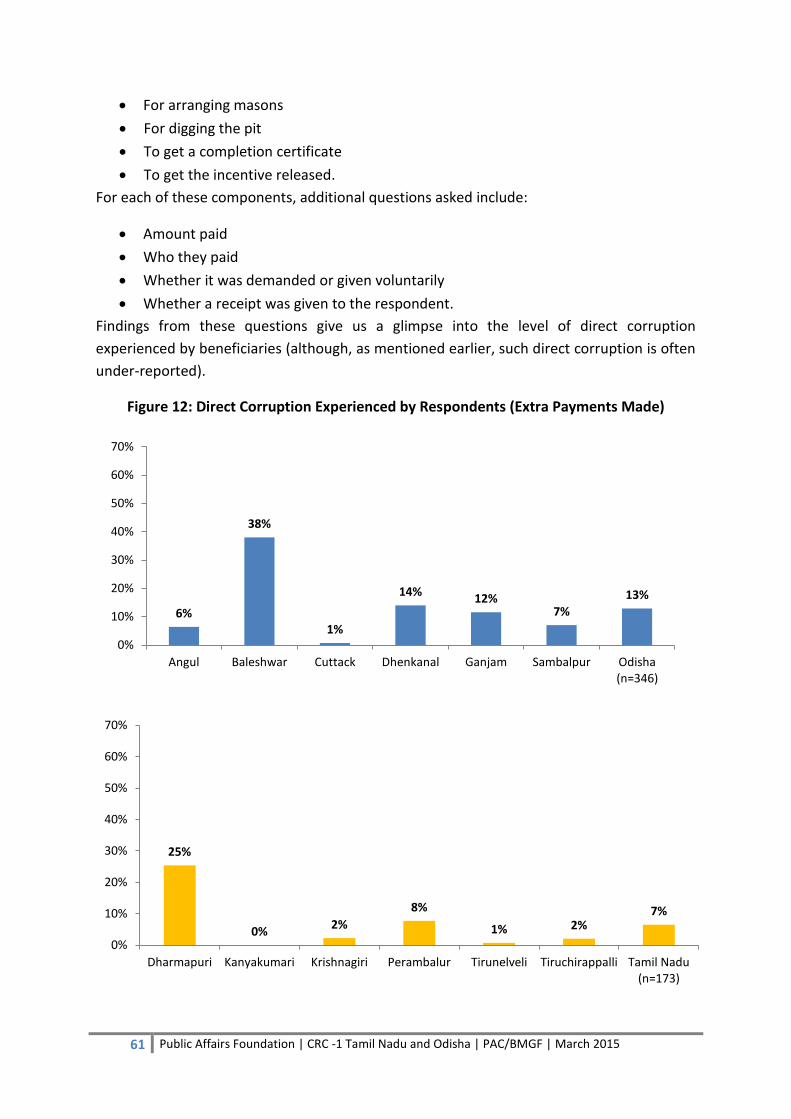
61 Public Affairs Foundation | CRC -1 Tamil Nadu and Odisha | PAC/BMGF | March 2015
For arranging masons
For digging the pit
To get a completion certificate
To get the incentive released.
For each of these components, additional questions asked include:
Amount paid
Who they paid
Whether it was demanded or given voluntarily
Whether a receipt was given to the respondent.
Findings from these questions give us a glimpse into the level of direct corruption
experienced by beneficiaries (although, as mentioned earlier, such direct corruption is often
under-reported).
Figure 12: Direct Corruption Experienced by Respondents (Extra Payments Made)
6%
38%
1%
14% 12%
7%
13%
0%
10%
20%
30%
40%
50%
60%
70%
Angul Baleshwar Cuttack Dhenkanal Ganjam Sambalpur Odisha (n=346)
25%
0% 2%
8%
1% 2% 7%
0%
10%
20%
30%
40%
50%
60%
70%
Dharmapuri Kanyakumari Krishnagiri Perambalur Tirunelveli Tiruchirappalli Tamil Nadu (n=173)
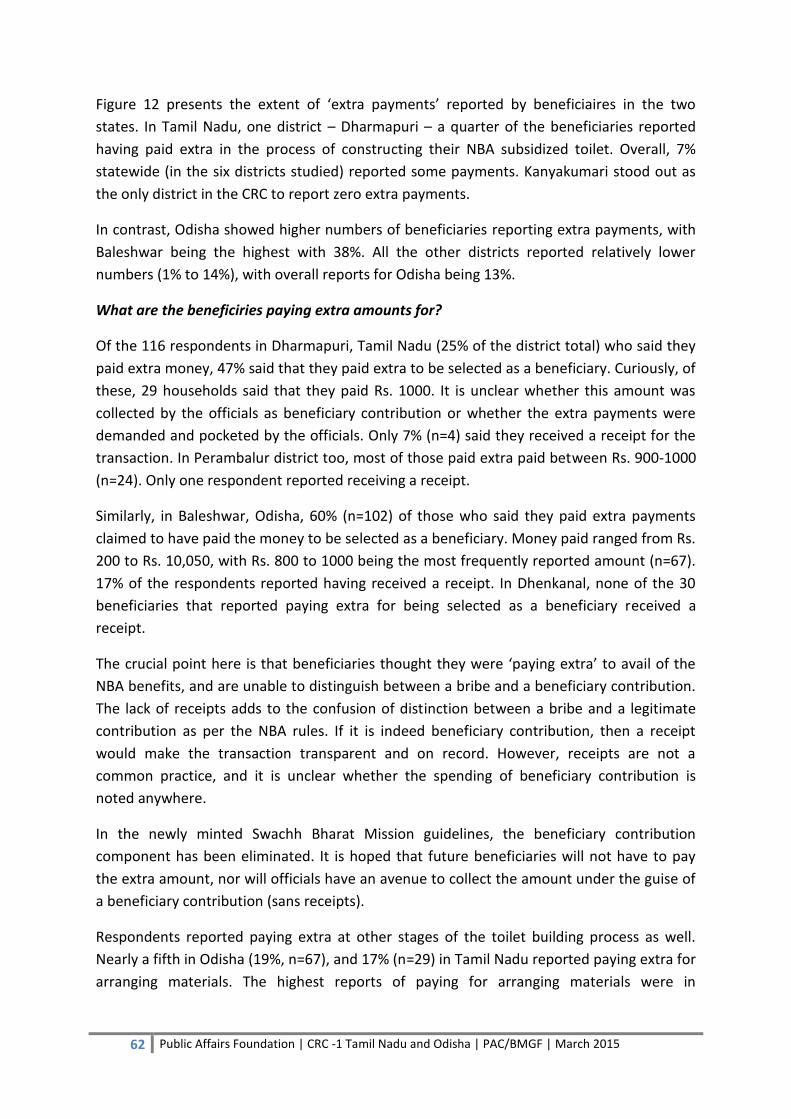
62 Public Affairs Foundation | CRC -1 Tamil Nadu and Odisha | PAC/BMGF | March 2015
Figure 12 presents the extent of ‘extra payments’ reported by beneficiaires in the two
states. In Tamil Nadu, one district – Dharmapuri – a quarter of the beneficiaries reported
having paid extra in the process of constructing their NBA subsidized toilet. Overall, 7%
statewide (in the six districts studied) reported some payments. Kanyakumari stood out as
the only district in the CRC to report zero extra payments.
In contrast, Odisha showed higher numbers of beneficiaries reporting extra payments, with
Baleshwar being the highest with 38%. All the other districts reported relatively lower
numbers (1% to 14%), with overall reports for Odisha being 13%.
What are the beneficiries paying extra amounts for?
Of the 116 respondents in Dharmapuri, Tamil Nadu (25% of the district total) who said they
paid extra money, 47% said that they paid extra to be selected as a beneficiary. Curiously, of
these, 29 households said that they paid Rs. 1000. It is unclear whether this amount was
collected by the officials as beneficiary contribution or whether the extra payments were
demanded and pocketed by the officials. Only 7% (n=4) said they received a receipt for the
transaction. In Perambalur district too, most of those paid extra paid between Rs. 900-1000
(n=24). Only one respondent reported receiving a receipt.
Similarly, in Baleshwar, Odisha, 60% (n=102) of those who said they paid extra payments
claimed to have paid the money to be selected as a beneficiary. Money paid ranged from Rs.
200 to Rs. 10,050, with Rs. 800 to 1000 being the most frequently reported amount (n=67).
17% of the respondents reported having received a receipt. In Dhenkanal, none of the 30
beneficiaries that reported paying extra for being selected as a beneficiary received a
receipt.
The crucial point here is that beneficiaries thought they were ‘paying extra’ to avail of the
NBA benefits, and are unable to distinguish between a bribe and a beneficiary contribution.
The lack of receipts adds to the confusion of distinction between a bribe and a legitimate
contribution as per the NBA rules. If it is indeed beneficiary contribution, then a receipt
would make the transaction transparent and on record. However, receipts are not a
common practice, and it is unclear whether the spending of beneficiary contribution is
noted anywhere.
In the newly minted Swachh Bharat Mission guidelines, the beneficiary contribution
component has been eliminated. It is hoped that future beneficiaries will not have to pay
the extra amount, nor will officials have an avenue to collect the amount under the guise of
a beneficiary contribution (sans receipts).
Respondents reported paying extra at other stages of the toilet building process as well.
Nearly a fifth in Odisha (19%, n=67), and 17% (n=29) in Tamil Nadu reported paying extra for
arranging materials. The highest reports of paying for arranging materials were in

63 Public Affairs Foundation | CRC -1 Tamil Nadu and Odisha | PAC/BMGF | March 2015
Baleshwar, Odisha (25%, n=42) and Dharmapuri, Tamil Nadu (n=26) – both districts that
reported the highest ‘extra payments’.
Dharmapuri, which had the highest instances of contractor-built toilets in Tamil Nadu, also
figured high in extra payments for arranging masons to build the toilets (41%, n=48). A
quarter of those who paid for arranging a mason paid Rs. 300 as extra payment. Others paid
between Rs. 100 to Rs. 4000. Only Dharmpuri, Trichy and Perambalur reported such
payments for arranging masons. In comparison, 8% of respondents in Odisha, with nearly
half of them from Baleshwar (n=15) reported such payments to arrange for masons.
Other instances of paying extra were small in number. For example, digging the pit,
certifying completion, release of the incentive – all were various instances where a very
small number reported paying extra. Other major activities for which beneficiaries in
Dharmapuri paid extra amounts were:
Arranging materials: 22% (n= 26 )
Arranging masons: 41% (n=48)
Digging the pit: 15% (n=18)
Amounts for each of these activities ranged from Rs. 100 to Rs. 3000. Again, receipts were
rarely given. Predominantly in Dharmapuri, a contractor, a GP Official or a Swachchata Doot
received the extra money paid by the respondent. In Perambalur too, GP officials and
contractors were the main recipients of the extra money. It is also possible that the GP
officials, Swachchata Doots and contractors are the point of contact for the villagers, and
therefore we see fewer instances of block or district officials directly receiving money from
the beneficiaries.
The additional theme weaving through the NBA implementation story in Tamil Nadu is that
of the role of contractors in some districts. Significantly, contractors building toilets under
the NBA is more prevalent in Dharmapuri and Permabalur than in the other districts in the
study. From the data, it seems apparent that districts where contractors had a bigger role in
building the toilets also had higher reports of extra payments by beneficiaries.
Indirect Corruption – Larger in Magnitude than Direct Corruption?
Respondents’ reports of having paid extra money, while substantial in districts like
Dharmapuri, seem to be smaller in magnitude when compared to other forms of corruption.
For example, 59% of the unusable or incomplete toilets in the state (n=451) were spread
across two districts: Dharmapuri (28%) and Perambalur (31%). The toilet in their households
not having a roof was reported widely in both the districts (Dharmapuri: 47% of those who
reported an unusable toilet; Perambalur: 26%). Sixteen respondents in Dharmapuri even
reported the absence of a pit! In Krishnagiri district, where 18% reported that contractors
64 Public Affairs Foundation | CRC -1 Tamil Nadu and Odisha | PAC/BMGF | March 2015
built the toilets, incomplete toilets, no doors, no walls, no roof and debris in the toilet were
the main reasons for un-usability of toilets.
Since the district or the block NBA officials hand over the incentive to the contractors for
construction of the toilets on behalf of the beneficiary, it is clear that incomplete toilets
allow for the contractors (and/or the officials) to keep a part of the unused incentive for
themselves. Profit margins increase by not putting roofs on the toilet, not putting in pits
(also reported by several beneficiaries), no doors (14% in Dharmapuri, 24% in Perambalur,
15% in Trichy) building lower walls than the regulation of 6 feet and building poor quality
toilets.
These indirect forms of corruption - of incomplete, partial or shoddy work also impacted the
beneficiaries’ ability to effectively utilize the incentive provided under the NBA for building
an IHHL.
NREGA Wages Routed to Contractors
During a Focus Group Discussion in a Gram Panchayat in Dharmapuri district, the research
team found out that NREGA wages were also given to the contractor, as ‘the money allotted
for materials is not sufficient’ according to the Swachchata Doot. Labor days put in by the
beneficiary were entered on to their job card, but the wages were given to the contractor to
pay for the materials. Mason costs were claimed to be expensive, and the NREGA
component has a skilled labor cost within the allotted amount. As a result, the entire
incentive amount - the NBA component as well as the NREGA component - amount to Rs.
10,000 was handed over to the contractor. It is unclear whether this is a widespread
practice, or restricted to one or two blocks.
The result of the above practice is that the beneficiaries have a double-loss: their job days
are subtracted on their job cards, and they are not paid wages for the days spent.
Figure 13: Respondents Reporting Receipt of Wages for NBA Related NREGA Work-Days on the
Job-Card - Tamil Nadu
65 Public Affairs Foundation | CRC -1 Tamil Nadu and Odisha | PAC/BMGF | March 2015
In Perambalur, the practice is to ask the beneficiary not to attend the NREGA work site.
Instead, the days are entered on the job card as toilet-building days, even if the beneficiary
does not actually help in building the toilet. The beneficiary may or may not receive wages.
Some of them complained that the resultant wage loss (due to not going to the work site)
for 10-15 days was tough. Although a toilet was built on their household premises, the wage
loss was not acceptable to them; however, the instructions given to them were to stay
home and not go to the NREGA job site. As figure 13 shows, just over half of the
respondents statewide reported receiving wages for NBA related NREGA days on their job
card. Dharmapuri reported the least - 42% said they received wages, while Kanyakumari
reported the highest (87%).
In the revamped Swachh Bharat Mission guidelines, the NREGA convergence has been
eliminated. The bottlenecks related to the NREGA wage flow, as well as problems such as
the above, where work was recorded but wages were not paid, will also be eliminated in the
new version of the scheme.
In the service provider/officials interviews, all officials reported that practices of taking
money or eliciting personal favors from beneficiaries was absent and neither had they or
other officials been involved in such practices. Yet, despite understandable claims of
absence of corruption, sixty three percent of officials interviewed felt that corrupt practices
can be reduced in the NBA implementation, and the main suggestion given was generating
public awareness. Other than this citizen oriented suggestion, 46% of officials did not know
offer any other suggestion on how to curb corruption in the NBA.
Missing Toilets
In Odisha, in addition to the types of issues described above (incomplete toilets, contractor
negligence, no roof, no wall), another significant issue detected during field visits was the
issue of toilets on paper. In many cases, physical toilets to match the entries on paper were
missing. In Baleshwar, for example, during a visit to Dehurda GP, Teghari village [further
described in Section 4 (Odisha)], the PAF team found that names of beneficiaries ‘verified’
by the Junior Engineer turned out to be on paper only. When the team went to the nearby
Teghari village, the residents were furious at the Junior Engineer for his assertion that toilets
had been built in the village. They demanded his phone number, so that they could confront
him. Beneficiary names and other information had been collected by the NBA officials
during a survey of the village. These names were entered onto an NBA completed list. But
there were no toilets on the ground.
This type of indirect corruption, where the beneficiary has not paid any amount directly – is
if anything, more dangerous for the beneficiary because now the beneficiary is no longer
eligible for an NBA incentive. The household has already been listed on the beneficiary list
fictitiously; the household ends up with no toilet and no future eligibility.
66 Public Affairs Foundation | CRC -1 Tamil Nadu and Odisha | PAC/BMGF | March 2015
Conclusions
Lack of awareness in the beneficiaries leads to confusion whether the ‘extra payments’
are beneficiary contributions or bribes.
Patchy implementation of best practices like receipts for beneficiary contributions leads
to such confusion.
Some districts in Tamil Nadu exhibited both direct and indirect forms of corruption.
Clear indications that districts with contractor led toilet building processes under the
NBA are prone to both direct and indirect corruption.
Indirect corruption often involved incomplete or poor/shoddy work, such as lack of a
roof or door on the newly built toilet.
NREGA convergence processes led to wage loss for beneficiaries.
Odisha had other indirect forms of corruption – such as missing toilets where the
beneficiary’s name appears on the TSC/NBA completed list, but there is no toilet on the
ground.
Such indirect correction deprives the citizens of NBA incentives, and renders them
ineligible for the incentive in future.

67 Public Affairs Foundation | CRC -1 Tamil Nadu and Odisha | PAC/BMGF | March 2015
Theme 5: Vulnerability of Socially and Economically Disadvantaged Groups - Do
Different Groups Experience the NBA Process Differently?
The TSC/NBA program started out targeting Below Poverty Line (BPL) residents to
encourage uptake of IHHLs in the rural areas. Eventually, in 2012, some IAPL households
(Identified APL based on certain criteria) were included in the eligibility list. Considering the
socio-economic diversity of the population however, it is expected (and commonly seen)
that different sections of the population will experience service delivery differently. Social
group and economic inequalities continue to exist and are reflected in the layout of villages,
and in the level of access to services enjoyed by various groups.
This theme examines the CRC data to explore if there are any differences in the way
different social and economic groups availed of the NBA incentive while building a toilet in
their homes. Some of the questions we consider are:
Were all groups equally aware of the incentive under the NBA program;
did they all receive the benefits equally;
did some groups pay extra money to get the benefits;
did all the beneficiaries use the incentive, complete the toilets, and start using the
toilet?
do the satisfaction levels with the NBA program differ by social or economic group?
We consider four Socio-economic variables in order to study the differences in experience
(if any) in the NBA experience among them:
Gender of the head of household
Social Group
Income17
Type of House (as a proxy for economic level of the household)
Religion was not included as a variable due to the small numbers of beneficiaries belonging
to various religious groups (other than Hindu) that emerged in the sample in both the
states. Since the sample was not originally planned to stratify at this level, and the spread of
the NBA beneficiaries was insufficient to begin with in most districts, it would have been
impractical to follow a quota sample by religion within the geographic scope of this study.
As a result, religion is not included in this analysis.
Respondents – all from households that were beneficiaries under the TSC/NBA program –
were asked if they were aware of an incentive given by the Government under the NBA/TSC
17
Income is often underreported in surveys of households. As a result, it is not the most robust variable to examine in this analysis. We have therefore included Type of House as a proxy for economic level of the household.
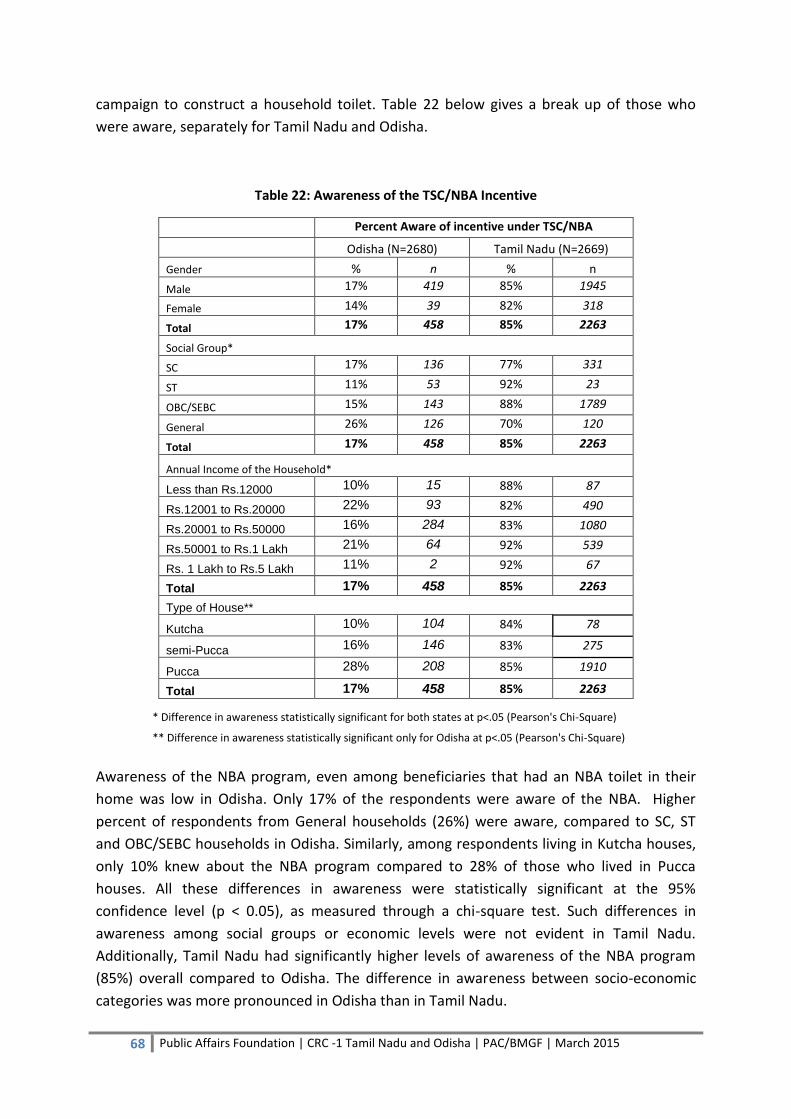
68 Public Affairs Foundation | CRC -1 Tamil Nadu and Odisha | PAC/BMGF | March 2015
campaign to construct a household toilet. Table 22 below gives a break up of those who
were aware, separately for Tamil Nadu and Odisha.
Table 22: Awareness of the TSC/NBA Incentive
Percent Aware of incentive under TSC/NBA
Odisha (N=2680) Tamil Nadu (N=2669)
Gender % n % n
Male 17% 419 85% 1945
Female 14% 39 82% 318
Total 17% 458 85% 2263
Social Group*
SC 17% 136 77% 331
ST 11% 53 92% 23
OBC/SEBC 15% 143 88% 1789
General 26% 126 70% 120
Total 17% 458 85% 2263
Annual Income of the Household*
Less than Rs.12000 10% 15 88% 87
Rs.12001 to Rs.20000 22% 93 82% 490
Rs.20001 to Rs.50000 16% 284 83% 1080
Rs.50001 to Rs.1 Lakh 21% 64 92% 539
Rs. 1 Lakh to Rs.5 Lakh 11% 2 92% 67
Total 17% 458 85% 2263
Type of House**
Kutcha 10% 104 84% 78
semi-Pucca 16% 146 83% 275
Pucca 28% 208 85% 1910
Total 17% 458 85% 2263
Awareness of the NBA program, even among beneficiaries that had an NBA toilet in their
home was low in Odisha. Only 17% of the respondents were aware of the NBA. Higher
percent of respondents from General households (26%) were aware, compared to SC, ST
and OBC/SEBC households in Odisha. Similarly, among respondents living in Kutcha houses,
only 10% knew about the NBA program compared to 28% of those who lived in Pucca
houses. All these differences in awareness were statistically significant at the 95%
confidence level (p < 0.05), as measured through a chi-square test. Such differences in
awareness among social groups or economic levels were not evident in Tamil Nadu.
Additionally, Tamil Nadu had significantly higher levels of awareness of the NBA program
(85%) overall compared to Odisha. The difference in awareness between socio-economic
categories was more pronounced in Odisha than in Tamil Nadu.
* Difference in awareness statistically significant for both states at p<.05 (Pearson's Chi-Square)
** Difference in awareness statistically significant only for Odisha at p<.05 (Pearson's Chi-Square)
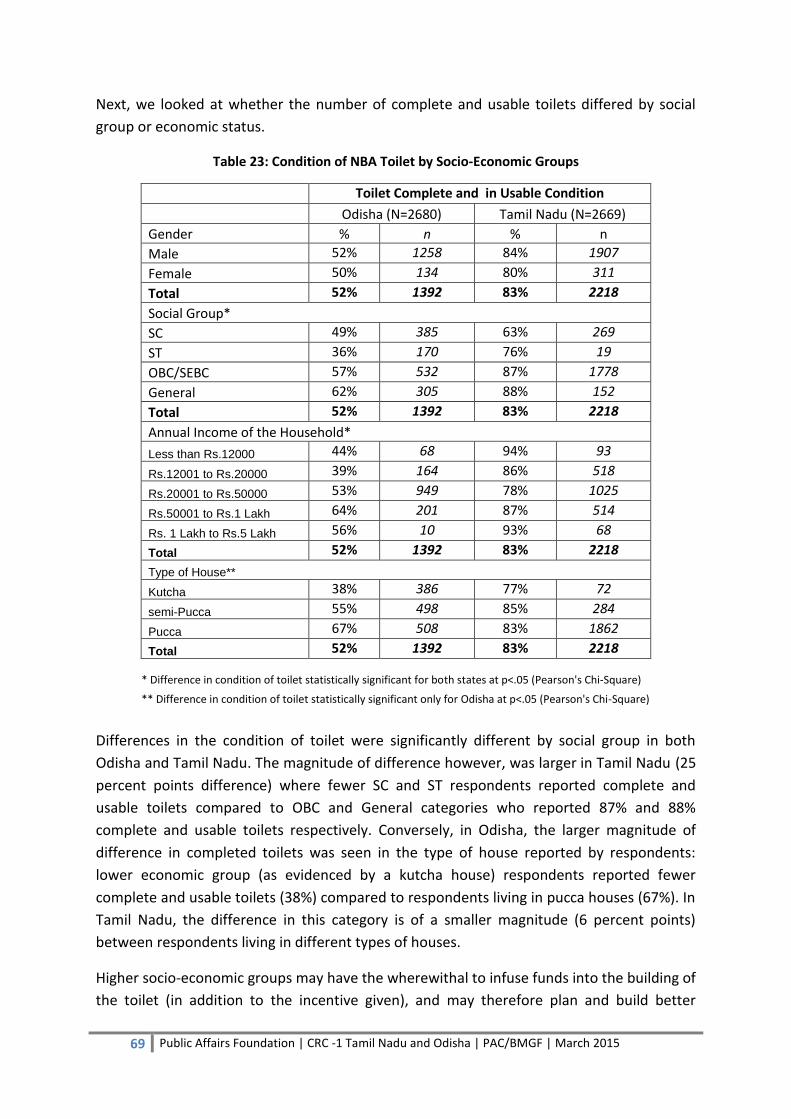
69 Public Affairs Foundation | CRC -1 Tamil Nadu and Odisha | PAC/BMGF | March 2015
Next, we looked at whether the number of complete and usable toilets differed by social
group or economic status.
Table 23: Condition of NBA Toilet by Socio-Economic Groups
Toilet Complete and in Usable Condition
Odisha (N=2680) Tamil Nadu (N=2669)
Gender % n % n
Male 52% 1258 84% 1907
Female 50% 134 80% 311
Total 52% 1392 83% 2218
Social Group*
SC 49% 385 63% 269
ST 36% 170 76% 19
OBC/SEBC 57% 532 87% 1778
General 62% 305 88% 152
Total 52% 1392 83% 2218
Annual Income of the Household*
Less than Rs.12000 44% 68 94% 93
Rs.12001 to Rs.20000 39% 164 86% 518
Rs.20001 to Rs.50000 53% 949 78% 1025
Rs.50001 to Rs.1 Lakh 64% 201 87% 514
Rs. 1 Lakh to Rs.5 Lakh 56% 10 93% 68
Total 52% 1392 83% 2218
Type of House**
Kutcha 38% 386 77% 72
semi-Pucca 55% 498 85% 284
Pucca 67% 508 83% 1862
Total 52% 1392 83% 2218
Differences in the condition of toilet were significantly different by social group in both
Odisha and Tamil Nadu. The magnitude of difference however, was larger in Tamil Nadu (25
percent points difference) where fewer SC and ST respondents reported complete and
usable toilets compared to OBC and General categories who reported 87% and 88%
complete and usable toilets respectively. Conversely, in Odisha, the larger magnitude of
difference in completed toilets was seen in the type of house reported by respondents:
lower economic group (as evidenced by a kutcha house) respondents reported fewer
complete and usable toilets (38%) compared to respondents living in pucca houses (67%). In
Tamil Nadu, the difference in this category is of a smaller magnitude (6 percent points)
between respondents living in different types of houses.
Higher socio-economic groups may have the wherewithal to infuse funds into the building of
the toilet (in addition to the incentive given), and may therefore plan and build better
* Difference in condition of toilet statistically significant for both states at p<.05 (Pearson's Chi-Square)
** Difference in condition of toilet statistically significant only for Odisha at p<.05 (Pearson's Chi-Square)

70 Public Affairs Foundation | CRC -1 Tamil Nadu and Odisha | PAC/BMGF | March 2015
quality toilets. This capacity to spend more on the toilet and build the toilet themselves may
have a direct correlation to the conditon and usability of the NBA toilet. We therefore
examined whether higher socio-economic groups are more likely to build the toilet
themselves, rather than have a contractor or NGO build it for them.
Table 24: Who Built the Toilet by Socio-Economic Groups
Respondents Who Built the Toilet Themselves/With the Help of a Mason
Odisha
(N=2680) Tamil Nadu (N=2669)
Gender % n % n
Male 34% 807 80% 1813
Female 33% 88 79% 306
Total 34% 895 80% 2119
Social Group*
SC 31% 238 68% 290
ST 13% 62 100% 25
OBC/SEBC 38% 349 84% 1694
General 50% 246 65% 110
Total 34% 895 80% 2119
Annual Income of the Household*
Less than Rs.12000 24% 37 89% 88
Rs.12001 to Rs.20000 25% 101 83% 493
Rs.20001 to Rs.50000 37% 654 77% 998
Rs.50001 to Rs.1 Lakh 32% 99 82% 478
Rs. 1 Lakh to Rs.5 Lakh 22% 4 86% 62
Total 34% 895 80% 2119
Type of House*
Kutcha 19% 191 63% 57
semi-Pucca 35% 313 66% 218
Pucca 52% 391 83% 1844
Total 34% 895 80% 2119
* Difference in who builds the toilet statistically significant for both states at p<.05 (Pearson's Chi-Square)
As expected, while income is still not a good indicator to explore this theme of vulnerability,
other socio economic categories, such as social group and type of house, continue to exhibit
the vulnerability of lower socio-economic strata to poor quality and service delivery. As seen
in Table 24, fewer SC and ST respondents built the toilet themselves or through a mason.
The same result was seen for respondents by type of house wherein, fewer respondents
living in kutcha houses reported building the toilets themselves. This was seen in both
states.
As discussed in earlier themes, who built the toilet has implications on completeness and
usability of toilets, as well as longevity and usage. If there are significant differences by socio
economic groups in who builds the toilets, then it follows that longevity, completeness and
usage also differ by these groups. In most cases, as noted, the differences are statistically
significant.
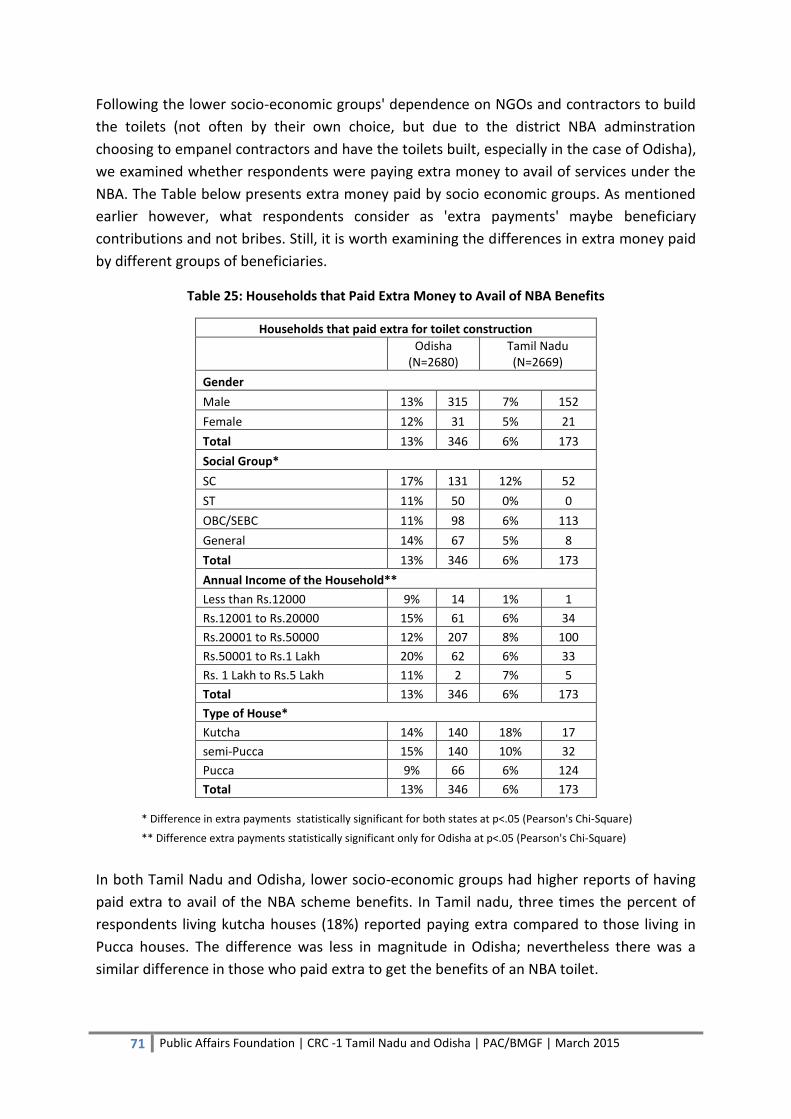
71 Public Affairs Foundation | CRC -1 Tamil Nadu and Odisha | PAC/BMGF | March 2015
Following the lower socio-economic groups' dependence on NGOs and contractors to build
the toilets (not often by their own choice, but due to the district NBA adminstration
choosing to empanel contractors and have the toilets built, especially in the case of Odisha),
we examined whether respondents were paying extra money to avail of services under the
NBA. The Table below presents extra money paid by socio economic groups. As mentioned
earlier however, what respondents consider as 'extra payments' maybe beneficiary
contributions and not bribes. Still, it is worth examining the differences in extra money paid
by different groups of beneficiaries.
Table 25: Households that Paid Extra Money to Avail of NBA Benefits
Households that paid extra for toilet construction
Odisha
(N=2680) Tamil Nadu (N=2669)
Gender
Male 13% 315 7% 152
Female 12% 31 5% 21
Total 13% 346 6% 173
Social Group*
SC 17% 131 12% 52
ST 11% 50 0% 0
OBC/SEBC 11% 98 6% 113
General 14% 67 5% 8
Total 13% 346 6% 173
Annual Income of the Household**
Less than Rs.12000 9% 14 1% 1
Rs.12001 to Rs.20000 15% 61 6% 34
Rs.20001 to Rs.50000 12% 207 8% 100
Rs.50001 to Rs.1 Lakh 20% 62 6% 33
Rs. 1 Lakh to Rs.5 Lakh 11% 2 7% 5
Total 13% 346 6% 173
Type of House*
Kutcha 14% 140 18% 17
semi-Pucca 15% 140 10% 32
Pucca 9% 66 6% 124
Total 13% 346 6% 173
In both Tamil Nadu and Odisha, lower socio-economic groups had higher reports of having
paid extra to avail of the NBA scheme benefits. In Tamil nadu, three times the percent of
respondents living kutcha houses (18%) reported paying extra compared to those living in
Pucca houses. The difference was less in magnitude in Odisha; nevertheless there was a
similar difference in those who paid extra to get the benefits of an NBA toilet.
* Difference in extra payments statistically significant for both states at p<.05 (Pearson's Chi-Square)
** Difference extra payments statistically significant only for Odisha at p<.05 (Pearson's Chi-Square)
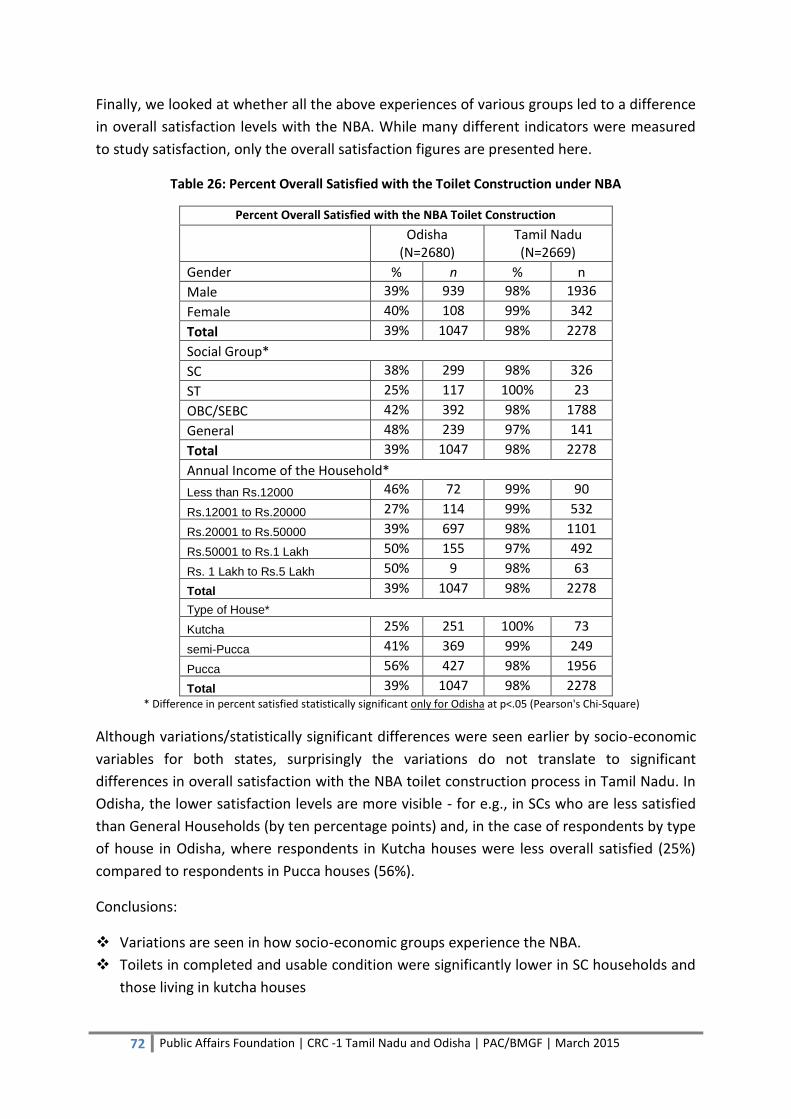
72 Public Affairs Foundation | CRC -1 Tamil Nadu and Odisha | PAC/BMGF | March 2015
Finally, we looked at whether all the above experiences of various groups led to a difference
in overall satisfaction levels with the NBA. While many different indicators were measured
to study satisfaction, only the overall satisfaction figures are presented here.
Table 26: Percent Overall Satisfied with the Toilet Construction under NBA
Percent Overall Satisfied with the NBA Toilet Construction
Odisha
(N=2680) Tamil Nadu (N=2669)
Gender % n % n
Male 39% 939 98% 1936
Female 40% 108 99% 342
Total 39% 1047 98% 2278
Social Group*
SC 38% 299 98% 326
ST 25% 117 100% 23
OBC/SEBC 42% 392 98% 1788
General 48% 239 97% 141
Total 39% 1047 98% 2278
Annual Income of the Household*
Less than Rs.12000 46% 72 99% 90
Rs.12001 to Rs.20000 27% 114 99% 532
Rs.20001 to Rs.50000 39% 697 98% 1101
Rs.50001 to Rs.1 Lakh 50% 155 97% 492
Rs. 1 Lakh to Rs.5 Lakh 50% 9 98% 63
Total 39% 1047 98% 2278
Type of House*
Kutcha 25% 251 100% 73
semi-Pucca 41% 369 99% 249
Pucca 56% 427 98% 1956
Total 39% 1047 98% 2278 * Difference in percent satisfied statistically significant only for Odisha at p<.05 (Pearson's Chi-Square)
Although variations/statistically significant differences were seen earlier by socio-economic
variables for both states, surprisingly the variations do not translate to significant
differences in overall satisfaction with the NBA toilet construction process in Tamil Nadu. In
Odisha, the lower satisfaction levels are more visible - for e.g., in SCs who are less satisfied
than General Households (by ten percentage points) and, in the case of respondents by type
of house in Odisha, where respondents in Kutcha houses were less overall satisfied (25%)
compared to respondents in Pucca houses (56%).
Conclusions:
Variations are seen in how socio-economic groups experience the NBA.
Toilets in completed and usable condition were significantly lower in SC households and
those living in kutcha houses

73 Public Affairs Foundation | CRC -1 Tamil Nadu and Odisha | PAC/BMGF | March 2015
Lower socio-economic groups also were more likely to have toilets built by
contractors/NGOs compared to higher socio economic groups
Along the same lines, lower socio-economic groups had higher reports of paying extra
money to avail of the NBA benefits
Surprisingly, all these factors did not show a difference in overall satisfaction in Tamil
Nadu. In Odisha, some variation in overall satisfaction was visible among the lower
socio- economic groups.
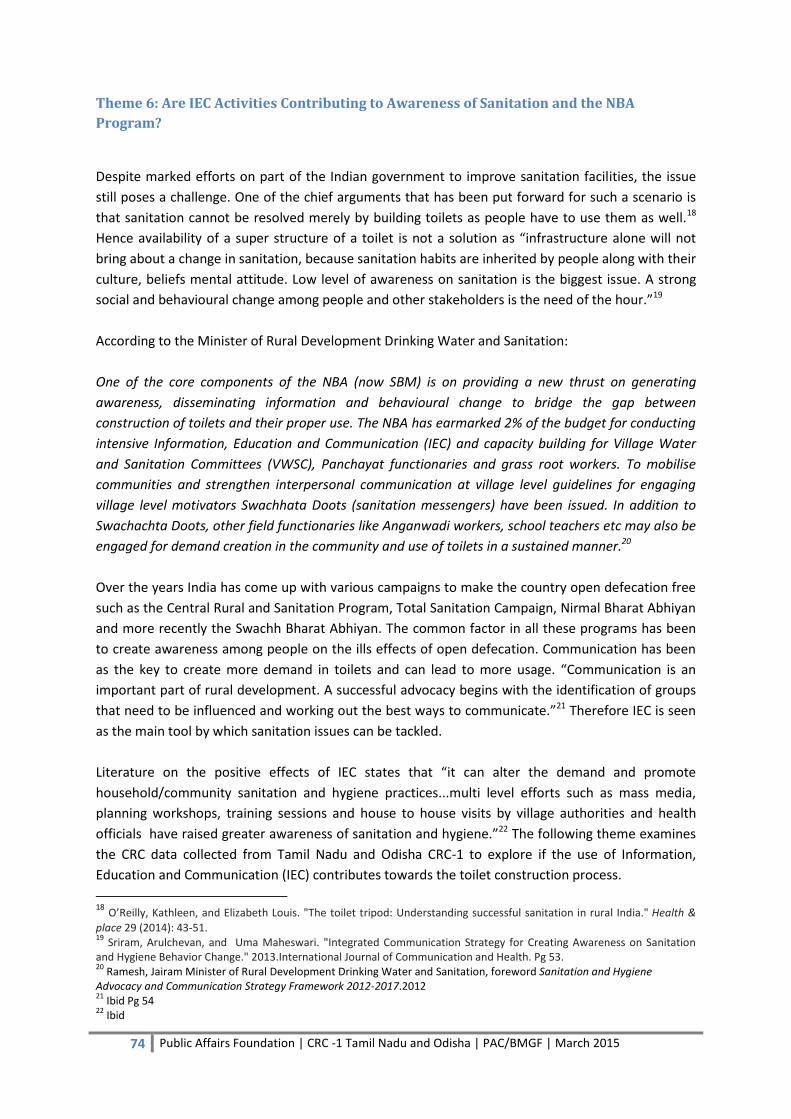
74 Public Affairs Foundation | CRC -1 Tamil Nadu and Odisha | PAC/BMGF | March 2015
Theme 6: Are IEC Activities Contributing to Awareness of Sanitation and the NBA
Program?
Despite marked efforts on part of the Indian government to improve sanitation facilities, the issue
still poses a challenge. One of the chief arguments that has been put forward for such a scenario is
that sanitation cannot be resolved merely by building toilets as people have to use them as well.18
Hence availability of a super structure of a toilet is not a solution as “infrastructure alone will not
bring about a change in sanitation, because sanitation habits are inherited by people along with their
culture, beliefs mental attitude. Low level of awareness on sanitation is the biggest issue. A strong
social and behavioural change among people and other stakeholders is the need of the hour.”19
According to the Minister of Rural Development Drinking Water and Sanitation:
One of the core components of the NBA (now SBM) is on providing a new thrust on generating
awareness, disseminating information and behavioural change to bridge the gap between
construction of toilets and their proper use. The NBA has earmarked 2% of the budget for conducting
intensive Information, Education and Communication (IEC) and capacity building for Village Water
and Sanitation Committees (VWSC), Panchayat functionaries and grass root workers. To mobilise
communities and strengthen interpersonal communication at village level guidelines for engaging
village level motivators Swachhata Doots (sanitation messengers) have been issued. In addition to
Swachachta Doots, other field functionaries like Anganwadi workers, school teachers etc may also be
engaged for demand creation in the community and use of toilets in a sustained manner.20
Over the years India has come up with various campaigns to make the country open defecation free
such as the Central Rural and Sanitation Program, Total Sanitation Campaign, Nirmal Bharat Abhiyan
and more recently the Swachh Bharat Abhiyan. The common factor in all these programs has been
to create awareness among people on the ills effects of open defecation. Communication has been
as the key to create more demand in toilets and can lead to more usage. “Communication is an
important part of rural development. A successful advocacy begins with the identification of groups
that need to be influenced and working out the best ways to communicate.”21 Therefore IEC is seen
as the main tool by which sanitation issues can be tackled.
Literature on the positive effects of IEC states that “it can alter the demand and promote
household/community sanitation and hygiene practices...multi level efforts such as mass media,
planning workshops, training sessions and house to house visits by village authorities and health
officials have raised greater awareness of sanitation and hygiene.”22 The following theme examines
the CRC data collected from Tamil Nadu and Odisha CRC-1 to explore if the use of Information,
Education and Communication (IEC) contributes towards the toilet construction process.
18
O’Reilly, Kathleen, and Elizabeth Louis. "The toilet tripod: Understanding successful sanitation in rural India." Health &
place 29 (2014): 43-51. 19
Sriram, Arulchevan, and Uma Maheswari. "Integrated Communication Strategy for Creating Awareness on Sanitation and Hygiene Behavior Change." 2013.International Journal of Communication and Health. Pg 53. 20
Ramesh, Jairam Minister of Rural Development Drinking Water and Sanitation, foreword Sanitation and Hygiene Advocacy and Communication Strategy Framework 2012-2017.2012 21
Ibid Pg 54 22
Ibid

75 Public Affairs Foundation | CRC -1 Tamil Nadu and Odisha | PAC/BMGF | March 2015
Main sources of information on toilet construction
One of the initial steps for bringing about effective IEC on sanitation are the main sources via which
people come in contact with information on toilet construction. In the two states under study it was
observed that there is a difference in reported sources of information. While Tamil Nadu reported
Gram Panchayat (GP) members (55%), Gram Panchayat officials (44%), and Swachchata Doots (23%)
as most trusted source of information, Odisha showed a different picture. According to 34% of
respondents in Odisha the main sources of information on the toilet construction process under NBA
were NGOs followed by GP officials (33%) and GP members (21%). (Figure 1). One of the reasons
which could explain more people reporting NGO as one of the main sources of information on toilet
construction is that in Odisha according to 29% (N=786) of respondents it is NGOs who get toilets
built in the villages which were surveyed. Swachchata Doots (negligible in Odisha), health workers,
SHG members reached a very small proportion of people.
Table 27: Sources of Information
Source Tamil Nadu
(n=2669)
Orissa
(n=2680)
% %
Gram Panchayat officials 44 33
Gram Panchayat member 55 21
NGOs 0.4 34
Swachchata Doot 23 0.5
Health worker (ANM/Nurse/ Doctor) 6 0.1
Anganwadi staff 0.3 8
ASHA worker 0 3
Self Help Group 2 0.5
Bharat Nirman Volunteer (BVN) 0 0.5
BRCC/CRCC 0 0.2
Variations are also visible at the district level in Tamil Nadu where 78% of respondents in Krishnagiri
and 26% respondents in Tirunelveli said that the Gram Panchayat officials were the main source of
information on toilet construction. On the other hand in Dharmapuri Swachchata Doots were
reported to the main source.
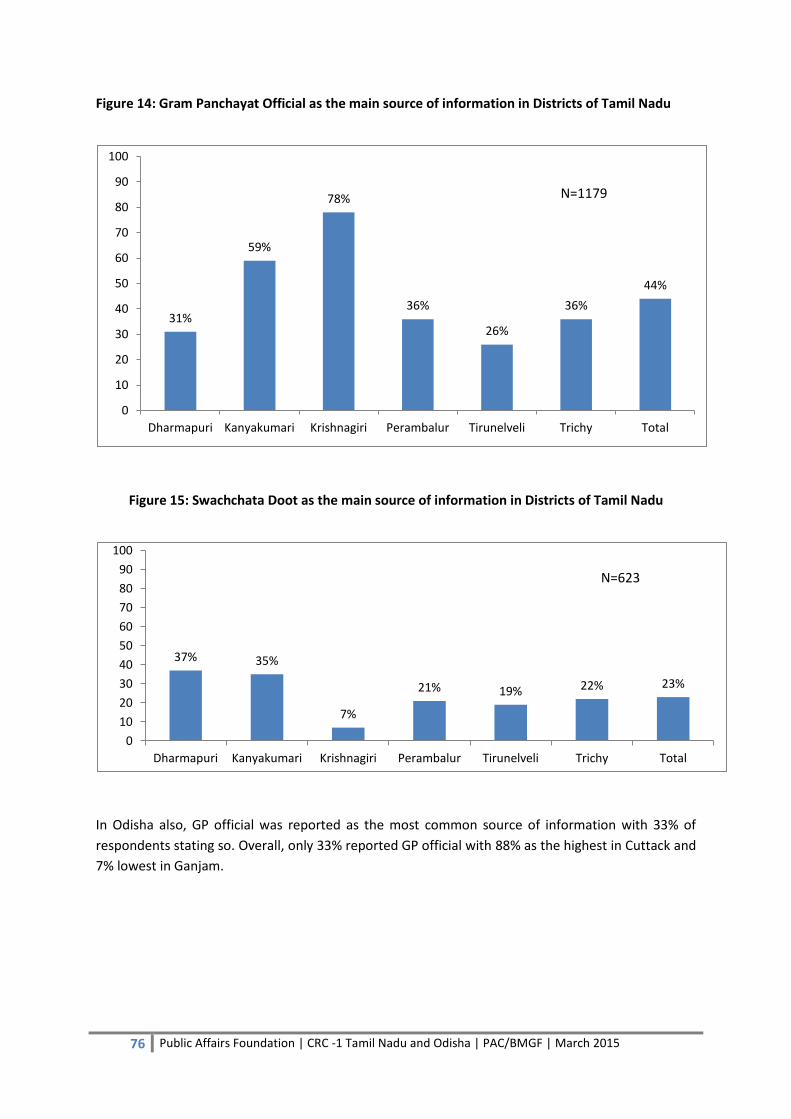
76 Public Affairs Foundation | CRC -1 Tamil Nadu and Odisha | PAC/BMGF | March 2015
Figure 14: Gram Panchayat Official as the main source of information in Districts of Tamil Nadu
Figure 15: Swachchata Doot as the main source of information in Districts of Tamil Nadu
In Odisha also, GP official was reported as the most common source of information with 33% of
respondents stating so. Overall, only 33% reported GP official with 88% as the highest in Cuttack and
7% lowest in Ganjam.
31%
59%
78%
36%
26%
36%
44%
0
10
20
30
40
50
60
70
80
90
100
Dharmapuri Kanyakumari Krishnagiri Perambalur Tirunelveli Trichy Total
N=1179
37% 35%
7%
21% 19% 22% 23%
0
10
20
30
40
50
60
70
80
90
100
Dharmapuri Kanyakumari Krishnagiri Perambalur Tirunelveli Trichy Total
N=623
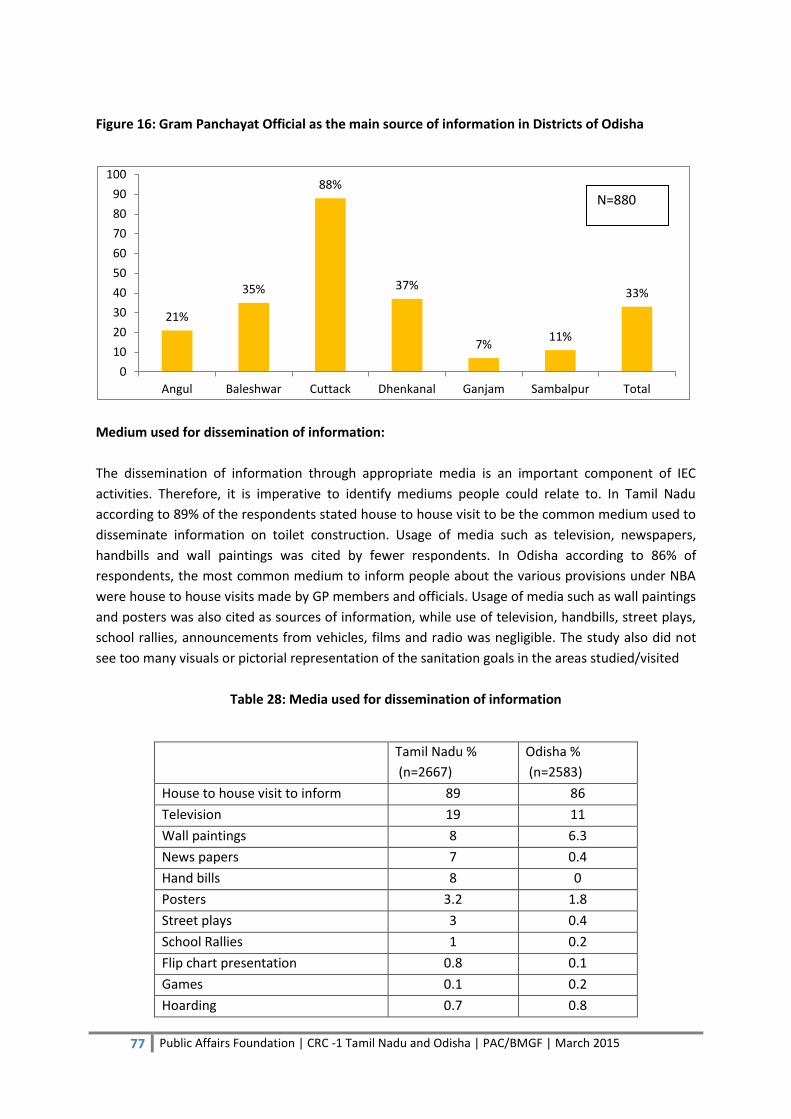
77 Public Affairs Foundation | CRC -1 Tamil Nadu and Odisha | PAC/BMGF | March 2015
Figure 16: Gram Panchayat Official as the main source of information in Districts of Odisha
Medium used for dissemination of information:
The dissemination of information through appropriate media is an important component of IEC
activities. Therefore, it is imperative to identify mediums people could relate to. In Tamil Nadu
according to 89% of the respondents stated house to house visit to be the common medium used to
disseminate information on toilet construction. Usage of media such as television, newspapers,
handbills and wall paintings was cited by fewer respondents. In Odisha according to 86% of
respondents, the most common medium to inform people about the various provisions under NBA
were house to house visits made by GP members and officials. Usage of media such as wall paintings
and posters was also cited as sources of information, while use of television, handbills, street plays,
school rallies, announcements from vehicles, films and radio was negligible. The study also did not
see too many visuals or pictorial representation of the sanitation goals in the areas studied/visited
Table 28: Media used for dissemination of information
Tamil Nadu %
(n=2667)
Odisha %
(n=2583)
House to house visit to inform 89 86
Television 19 11
Wall paintings 8 6.3
News papers 7 0.4
Hand bills 8 0
Posters 3.2 1.8
Street plays 3 0.4
School Rallies 1 0.2
Flip chart presentation 0.8 0.1
Games 0.1 0.2
Hoarding 0.7 0.8
21%
35%
88%
37%
7% 11%
33%
0
10
20
30
40
50
60
70
80
90
100
Angul Baleshwar Cuttack Dhenkanal Ganjam Sambalpur Total
N=880

78 Public Affairs Foundation | CRC -1 Tamil Nadu and Odisha | PAC/BMGF | March 2015
Announcements from vehicles 0.2 0.2
Film 0.3 0.2
Exhibitions/Melas 0.1 0.1
Radio 0.3 0
Others 4.6 4.8
Frequency of exposure to IEC activities:
Poor exposure to information on toilet construction is often stated as a reason for open defecation
hence it becomes imperative to focus on issues such as:
What respondents saw or heard on toilet construction;
How often did they hear or see the information
In Odisha with regard to the frequency of information on toilet construction, 43% of respondents
said that they were exposed to it once in a few months, whereas others stated that they saw/heard
about NBA once in a week (16%) and once in a month (18%).In Tamil Nadu more than half of
respondents (58%) said that they saw or heard information on toilet construction once a week,
followed by 22% who were exposed to the information daily.
Usefulness of information provided on toilet construction via IEC
It becomes imperative to know if IEC activities were able to bring about change in the attitude of
people when it came to toilet construction and sanitation in general. In Tamil Nadu, all respondents
found the information useful, 69% reported that it helped them to know about the benefits of
having a toilet while 47% found it helpful to know about the ill effects of open defecation. In Odisha
when respondents were asked whether the information provided by NBA was useful, 96% reported
it to be useful. Of those who did find it useful, 51% reported that it helped them know about the
benefits of having a toilet while 41% found it helpful to know about the ill effects of open
defecation.
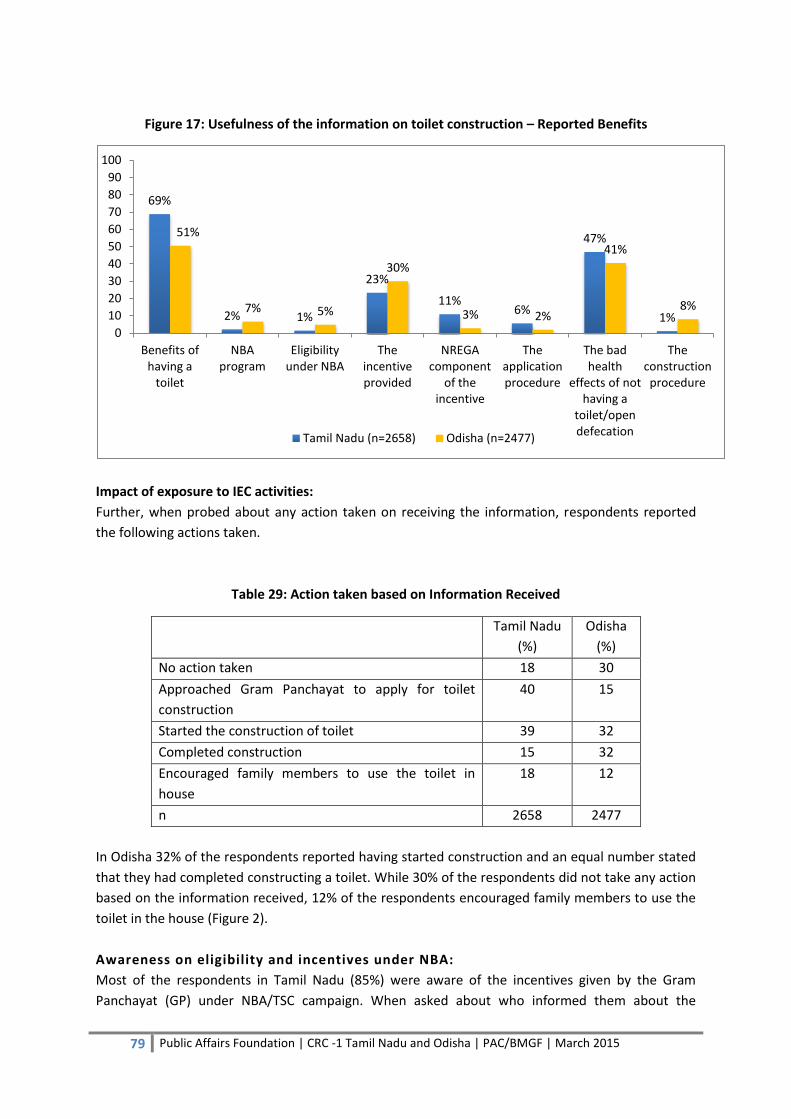
79 Public Affairs Foundation | CRC -1 Tamil Nadu and Odisha | PAC/BMGF | March 2015
Figure 17: Usefulness of the information on toilet construction – Reported Benefits
Impact of exposure to IEC activities:
Further, when probed about any action taken on receiving the information, respondents reported
the following actions taken.
Table 29: Action taken based on Information Received
Tamil Nadu
(%)
Odisha
(%)
No action taken 18 30
Approached Gram Panchayat to apply for toilet
construction
40 15
Started the construction of toilet 39 32
Completed construction 15 32
Encouraged family members to use the toilet in
house
18 12
n 2658 2477
In Odisha 32% of the respondents reported having started construction and an equal number stated
that they had completed constructing a toilet. While 30% of the respondents did not take any action
based on the information received, 12% of the respondents encouraged family members to use the
toilet in the house (Figure 2).
Awareness on eligibility and incentives under NBA:
Most of the respondents in Tamil Nadu (85%) were aware of the incentives given by the Gram
Panchayat (GP) under NBA/TSC campaign. When asked about who informed them about the
69%
2% 1%
23%
11% 6%
47%
1%
51%
7% 5%
30%
3% 2%
41%
8%
0
10
20
30
40
50
60
70
80
90
100
Benefits of having a
toilet
NBA program
Eligibility under NBA
The incentive provided
NREGA component
of the incentive
The application procedure
The bad health
effects of not having a
toilet/open defecation
The construction procedure
Tamil Nadu (n=2658) Odisha (n=2477)
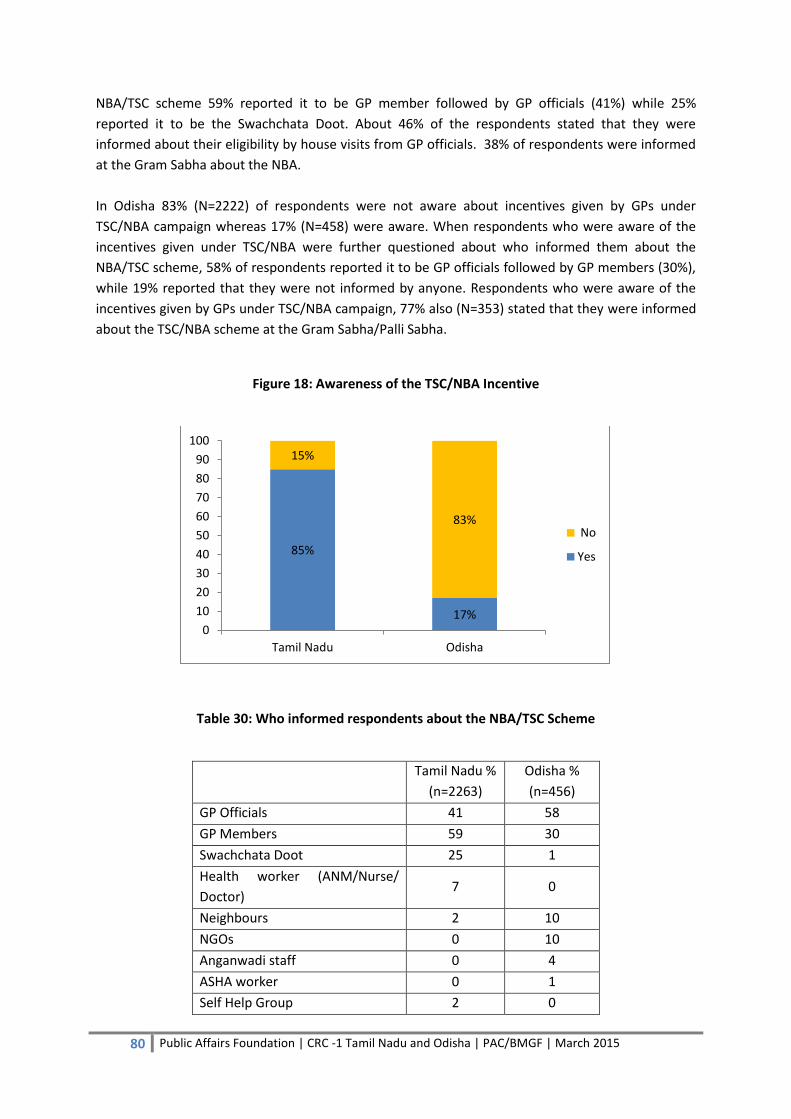
80 Public Affairs Foundation | CRC -1 Tamil Nadu and Odisha | PAC/BMGF | March 2015
NBA/TSC scheme 59% reported it to be GP member followed by GP officials (41%) while 25%
reported it to be the Swachchata Doot. About 46% of the respondents stated that they were
informed about their eligibility by house visits from GP officials. 38% of respondents were informed
at the Gram Sabha about the NBA.
In Odisha 83% (N=2222) of respondents were not aware about incentives given by GPs under
TSC/NBA campaign whereas 17% (N=458) were aware. When respondents who were aware of the
incentives given under TSC/NBA were further questioned about who informed them about the
NBA/TSC scheme, 58% of respondents reported it to be GP officials followed by GP members (30%),
while 19% reported that they were not informed by anyone. Respondents who were aware of the
incentives given by GPs under TSC/NBA campaign, 77% also (N=353) stated that they were informed
about the TSC/NBA scheme at the Gram Sabha/Palli Sabha.
Figure 18: Awareness of the TSC/NBA Incentive
Table 30: Who informed respondents about the NBA/TSC Scheme
Tamil Nadu %
(n=2263)
Odisha %
(n=456)
GP Officials 41 58
GP Members 59 30
Swachchata Doot 25 1
Health worker (ANM/Nurse/
Doctor) 7 0
Neighbours 2 10
NGOs 0 10
Anganwadi staff 0 4
ASHA worker 0 1
Self Help Group 2 0
85%
17%
15%
83%
0
10
20
30
40
50
60
70
80
90
100
Tamil Nadu Odisha
No
Yes
81 Public Affairs Foundation | CRC -1 Tamil Nadu and Odisha | PAC/BMGF | March 2015
Bharat Nirman Volunteers(BNV) 0 1
Friends 0 2
None 3 19
Table 31: Who informed respondents on Eligibility under NBA/TSC Scheme
Tamil Nadu %
(n=2263 )
Odisha %
(n= 458)
Gram Panchayat officials 39 58
Gram Panchayat members 58 30
Swachchata Doot 24 1
Neighbours 2 10
None 2 19
NBA/TSC Co coordinators 1 0
Health worker (ANM/Nurse/ Doctor) 5 0
Anganwadi staff 0 3
ASHA worker 0 1
Self Help Group 2 0
NGOs 1 10
Bharat Nirman volunteers(BNV) 0 1
Friends 1 2
Conclusions:
There is a difference in reported sources of information in the two states covered. While
Tamil Nadu reported Gram Panchayat (GP) members as most trusted source of information,
Odisha showed a different picture with NGOs.
The dissemination of the message through appropriate media is an important component of
the IEC activities.
In both the states, house to house visits were reported to be a common medium to
disseminate information on toilet construction.
Eligibility is an important part of the construction process because it helps in receiving the
incentive under the scheme. In cases where they are not aware of their eligibility, citizens
continue to engage in open defecation.

82 Public Affairs Foundation | CRC-1 Tamil Nadu and Odisha| PAC/BMGF | March 2015
Section 4a: Salient findings from Household Survey of TSC/NBA
Beneficiaries in Tamil Nadu
In order to assess citizen participation at the household level with regard to NBA, a CRC was
conducted across six districts in Tamil Nadu-Dharmapuri, Krishnagiri, Perambalur, Kanyakumari,
Tiruchirappalli (also referred to as Trichy) and Tirunelveli (Map 1). In all, 2669 households (HHs) were
covered during the study (Table 27). The information so collected provides us with a detailed insight
into the socio-economic profile of the HHs, information about NBA and experience of building a
toilet under the scheme, toilet usage, various problems faced, corruption and HH attitude towards
sanitation.
Map1: Geographic areas under study in Tamil Nadu

83 Public Affairs Foundation | CRC-1 Tamil Nadu and Odisha| PAC/BMGF | March 2015
Table 32: Sample size of the areas under study in Tamil Nadu
Districts Number of households
Number of blocks
covered
Number of Gram
Panchayats (GPs)
covered
Number of villages covered
Dharmapuri 456 3 24 41
Krishnagiri 445 3 21 55
Perambalur 452 3 20 23
Kanyakumari 423 4 24 146
Tiruchirappalli 449 3 20 53
Tirunelveli 444 3 22 33
Total 2669 19 131 351
1. Socio- Economic Profile of Households
Household composition/caste/religion/gender/age:
Households in the sample had an average of four adult family members (18+ years old) and one child
between the ages of zero to 17 years. Of the households surveyed, 5% had differently abled family
members.
About 77% of respondents were from OBC/SEBC (92% of respondents in Tirunelveli and 90% in
Kanyakumari). About 16% and 6% overall were from SC and general category respectively with less
than 1% belonging to ST category (Figure 14).
In all, 91% of HHs were Hindu, 1% were Muslim and 8% belonged to Christianity. With regard to
social mobility, 43% of HHs reported a family member currently being a member of a self help group
in the village.
Figure 19: Caste wise distribution
77%
16%
6% 1%
0
20
40
60
80
100
OBC/SEBC SC General ST
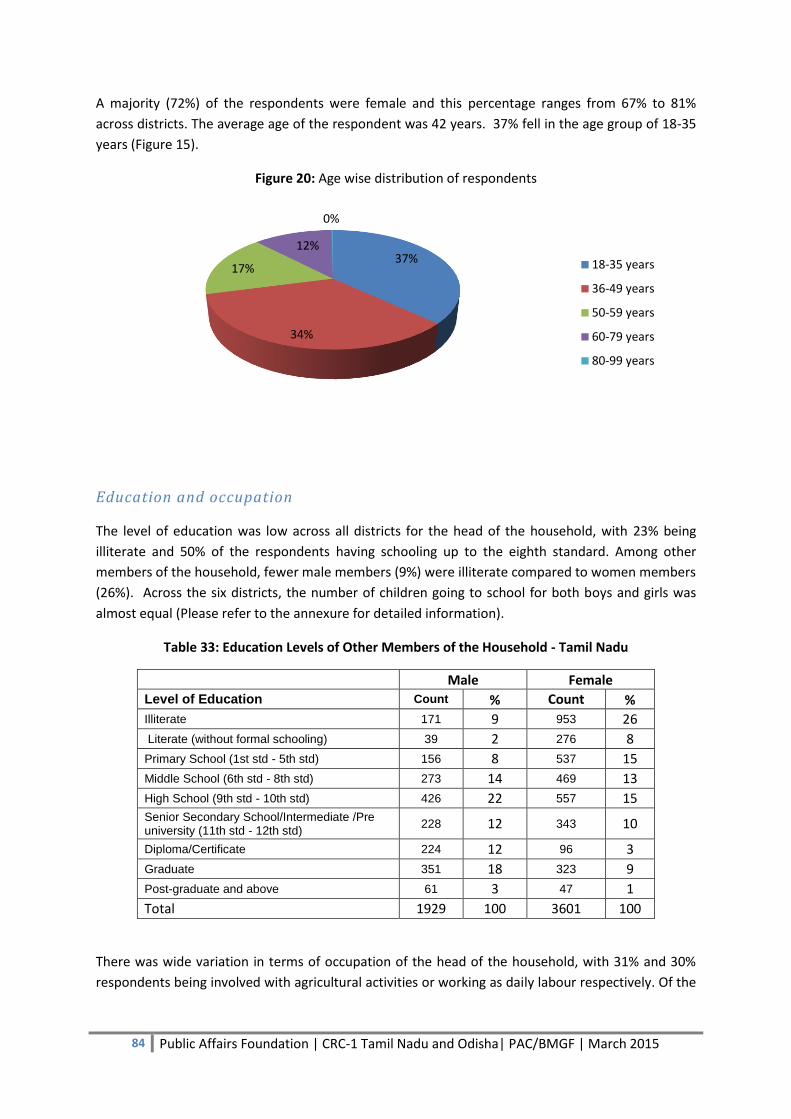
84 Public Affairs Foundation | CRC-1 Tamil Nadu and Odisha| PAC/BMGF | March 2015
A majority (72%) of the respondents were female and this percentage ranges from 67% to 81%
across districts. The average age of the respondent was 42 years. 37% fell in the age group of 18-35
years (Figure 15).
Figure 20: Age wise distribution of respondents
Education and occupation
The level of education was low across all districts for the head of the household, with 23% being
illiterate and 50% of the respondents having schooling up to the eighth standard. Among other
members of the household, fewer male members (9%) were illiterate compared to women members
(26%). Across the six districts, the number of children going to school for both boys and girls was
almost equal (Please refer to the annexure for detailed information).
Table 33: Education Levels of Other Members of the Household - Tamil Nadu
Male Female
Level of Education Count % Count %
Illiterate 171 9 953 26
Literate (without formal schooling) 39 2 276 8
Primary School (1st std - 5th std) 156 8 537 15
Middle School (6th std - 8th std) 273 14 469 13
High School (9th std - 10th std) 426 22 557 15 Senior Secondary School/Intermediate /Pre university (11th std - 12th std)
228 12 343 10
Diploma/Certificate 224 12 96 3
Graduate 351 18 323 9
Post-graduate and above 61 3 47 1
Total 1929 100 3601 100
There was wide variation in terms of occupation of the head of the household, with 31% and 30%
respondents being involved with agricultural activities or working as daily labour respectively. Of the
37%
34%
17%
12%
0%
18-35 years
36-49 years
50-59 years
60-79 years
80-99 years

85 Public Affairs Foundation | CRC-1 Tamil Nadu and Odisha| PAC/BMGF | March 2015
six districts, Perambalur at 43% reported highest agricultural activity as the main occupation for the
head of the household.
Household Assets
Of the households interviewed in Tamil Nadu, 63% of respondents did not own any agricultural land.
Kanyakumari stood at the bottom, with only 2% of respondents stating that they owned agricultural
land; out of these, land holding is less than 5 acres. The members of the households themselves
cultivated almost all of the land owned. Despite low numbers owning agricultural land, a very high
proportion (99%) of HHs reported ownership of the house they were living in.
With regard to household assets, more than 90% of HHs had a television. Distributed as a part of
electoral sops in the state, ownership of a Television set is not indicative of the high purchasing
power within Tamil Nadu. Mobile phone penetration in the state among the respondents was also
high at 92%. Less than 3% had internet connection, car, tractor, and landline connection. Nearly two-
thirds (65%) had an LPG connection but the proportion varied across districts, with the lowest
percentage in Kanyakumari (41%) and highest in Tirunelveli (86%) [Please refer to Figure 16 for a full
list of household assets reported in each household].
98% of respondents reported having a functional electricity connection.
Figure 21: Household ownership of assets
0.3%
0.3%
1%
1%
2%
2%
2%
5%
9%
10%
11%
16%
43%
45%
65%
92%
94%
0 10 20 30 40 50 60 70 80 90 100
Thresher
Fishing boat
Tractor
Car
Internet access
Landline
Animal-drawn cart
Computer
Water pump
Dish Antenna
Radio/Transistor
Refrigerator
Motorcycle/scooter
Bicycle
LPG Gas Connection
Mobile telephone
Television
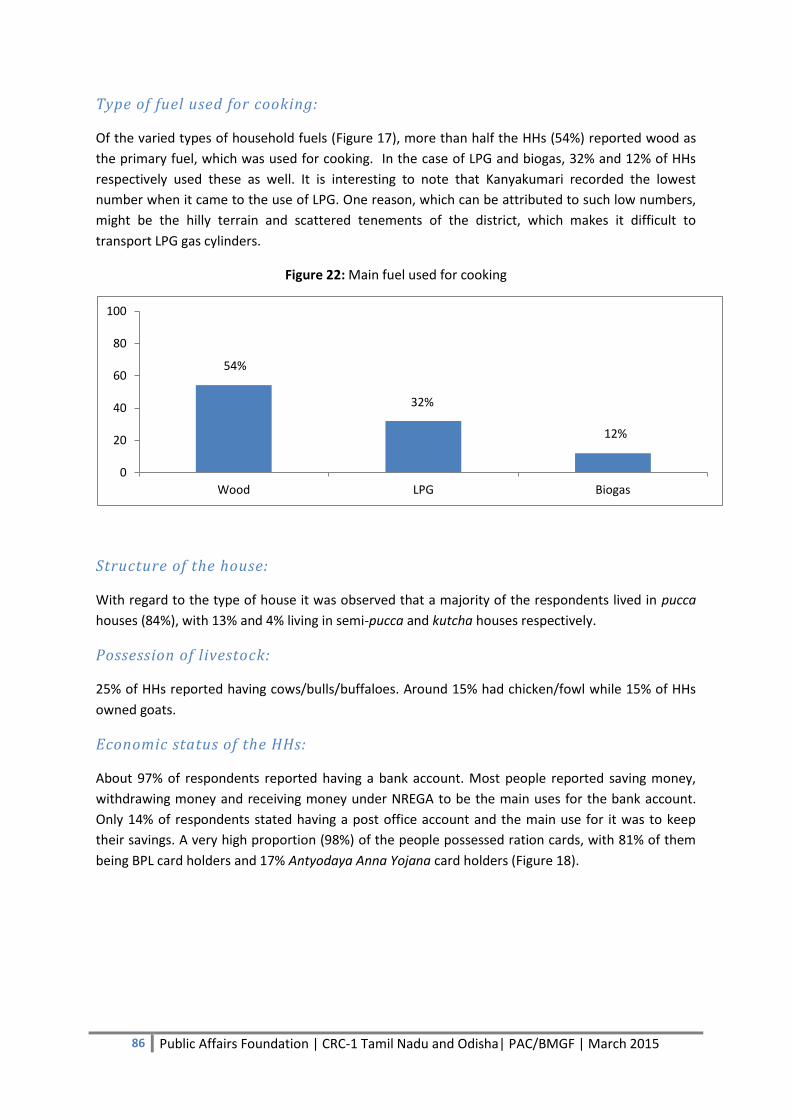
86 Public Affairs Foundation | CRC-1 Tamil Nadu and Odisha| PAC/BMGF | March 2015
Type of fuel used for cooking:
Of the varied types of household fuels (Figure 17), more than half the HHs (54%) reported wood as
the primary fuel, which was used for cooking. In the case of LPG and biogas, 32% and 12% of HHs
respectively used these as well. It is interesting to note that Kanyakumari recorded the lowest
number when it came to the use of LPG. One reason, which can be attributed to such low numbers,
might be the hilly terrain and scattered tenements of the district, which makes it difficult to
transport LPG gas cylinders.
Figure 22: Main fuel used for cooking
Structure of the house:
With regard to the type of house it was observed that a majority of the respondents lived in pucca
houses (84%), with 13% and 4% living in semi-pucca and kutcha houses respectively.
Possession of livestock:
25% of HHs reported having cows/bulls/buffaloes. Around 15% had chicken/fowl while 15% of HHs
owned goats.
Economic status of the HHs:
About 97% of respondents reported having a bank account. Most people reported saving money,
withdrawing money and receiving money under NREGA to be the main uses for the bank account.
Only 14% of respondents stated having a post office account and the main use for it was to keep
their savings. A very high proportion (98%) of the people possessed ration cards, with 81% of them
being BPL card holders and 17% Antyodaya Anna Yojana card holders (Figure 18).
54%
32%
12%
0
20
40
60
80
100
Wood LPG Biogas

87 Public Affairs Foundation | CRC-1 Tamil Nadu and Odisha| PAC/BMGF | March 2015
Figure 23: Economic Status of HHs
In terms of household wealth nearly 49% of HHs reported annual income between Rs. 20,001 and
Rs. 50,000 (Figure 18). Monthly expenditure per household was below Rs.5000 for 85% of the HHs
and was between Rs.5000 and Rs. 10,000 for another 14%.
Figure 24: Household Annual Income
Water source, collection and usage:
One finds a close relation between the availability and accessibility of water to sanitation. Hence
obtaining this data was of prime importance during the study. HHs were therefore interviewed on
their experience with regard to the various water resources which were available to them.
Data shows that more than half the respondents (54%) obtain drinking water from a public tap, a
third of the HHs (33%) from piped water in their dwelling and a further 9% obtain water through
piped water in the yard (Figure 20). Half the respondents obtain water for domestic purposes from a
public tap, whereas 36% obtained water which is piped into their dwelling, and 10% get water piped
into their yard. (Figure 21)
1%
81%
17%
1%
APL
BPL
Antyodaya Anna Yojana (AAY)
Anna Poorna
49%
22%
22%
4% 3%
Rs.20001 to Rs.50000
Rs.12001 to Rs.20000
Rs.50001 to Rs.1 Lakh
Less than Rs.12000
Rs. 1 Lakh to Rs.5 Lakh

88 Public Affairs Foundation | CRC-1 Tamil Nadu and Odisha| PAC/BMGF | March 2015
Figure 25: Sources of water: Drinking purposes*
Figure 26: Sources of water: Domestic purposes*
*Please note that the totals have been rounded off
Adult women members of the household in more than 95% of the households fetch both drinking
water and water for domestic purposes. Respondents were also questioned about the amount of
time and distance they had to travel to get water during normal times and in times of scarcity. 63%
of the respondents had to travel less than 50 meters to fetch drinking water during normal and 47%
reported this distance during scarcity times. For domestic purposes, 63% and 48% respondents had
to travel 50 meters during normal times and scarcity times to collect water respectively. On average
respondents said, they had to make 12 trips in a day to fetch water. During normal times 80% of
respondents had to spend around 15 minutes to fetch water and wait at the source, whereas in
scarcity times it was between 16 to 30 minutes according to 48% of respondents for drinking water.
As for domestic water 79 % of respondents stated that they had to spend 15 minutes and during
0.1%
0.4%
1%
1%
1%
9%
33%
54%
0 20 40 60 80 100
Surface water
Tanker truck
Other sources
Uncovered well
Covered well
Household piped water piped into yard
Household piped water piped into …
Public Tap/Standpost
1%
1%
1%
1%
10%
36%
50%
0 20 40 60 80 100
Uncovered well
Tubewell or borewell
Covered well
Tanker truck
Household piped water piped into yard
Household piped water piped into dwelling
Public Tap/Standpost
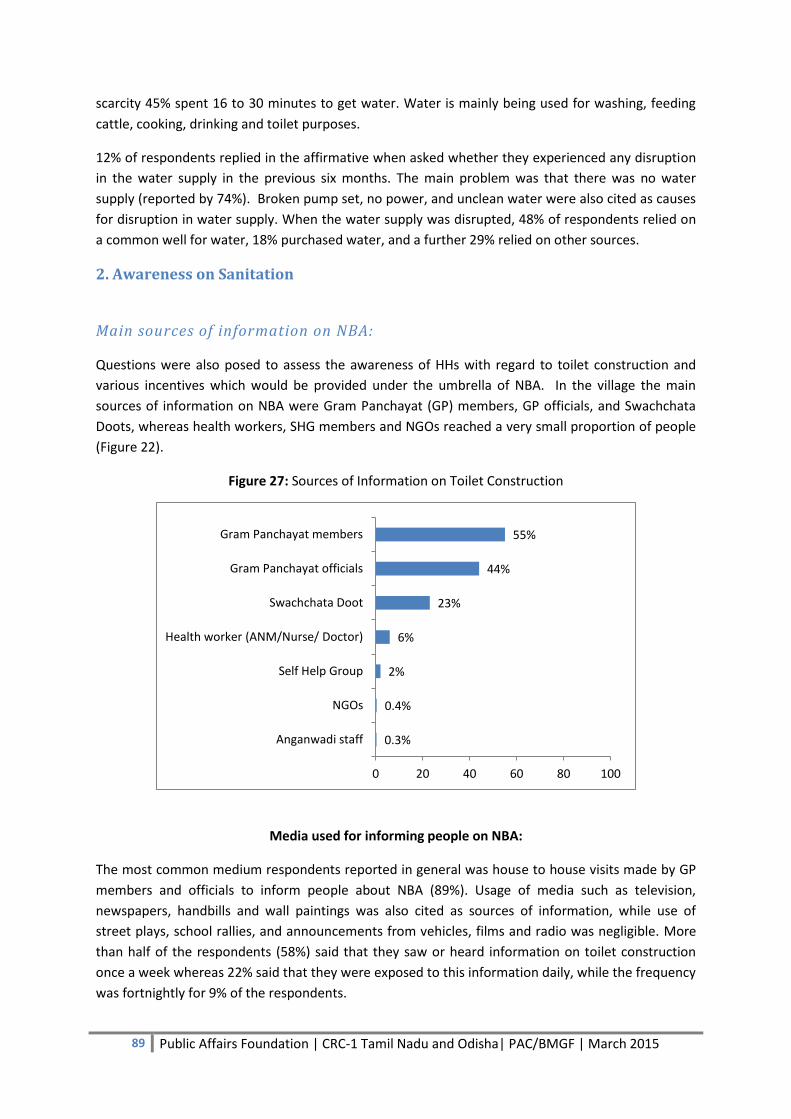
89 Public Affairs Foundation | CRC-1 Tamil Nadu and Odisha| PAC/BMGF | March 2015
scarcity 45% spent 16 to 30 minutes to get water. Water is mainly being used for washing, feeding
cattle, cooking, drinking and toilet purposes.
12% of respondents replied in the affirmative when asked whether they experienced any disruption
in the water supply in the previous six months. The main problem was that there was no water
supply (reported by 74%). Broken pump set, no power, and unclean water were also cited as causes
for disruption in water supply. When the water supply was disrupted, 48% of respondents relied on
a common well for water, 18% purchased water, and a further 29% relied on other sources.
2. Awareness on Sanitation
Main sources of information on NBA:
Questions were also posed to assess the awareness of HHs with regard to toilet construction and
various incentives which would be provided under the umbrella of NBA. In the village the main
sources of information on NBA were Gram Panchayat (GP) members, GP officials, and Swachchata
Doots, whereas health workers, SHG members and NGOs reached a very small proportion of people
(Figure 22).
Figure 27: Sources of Information on Toilet Construction
Media used for informing people on NBA:
The most common medium respondents reported in general was house to house visits made by GP
members and officials to inform people about NBA (89%). Usage of media such as television,
newspapers, handbills and wall paintings was also cited as sources of information, while use of
street plays, school rallies, and announcements from vehicles, films and radio was negligible. More
than half of the respondents (58%) said that they saw or heard information on toilet construction
once a week whereas 22% said that they were exposed to this information daily, while the frequency
was fortnightly for 9% of the respondents.
0.3%
0.4%
2%
6%
23%
44%
55%
0 20 40 60 80 100
Anganwadi staff
NGOs
Self Help Group
Health worker (ANM/Nurse/ Doctor)
Swachchata Doot
Gram Panchayat officials
Gram Panchayat members
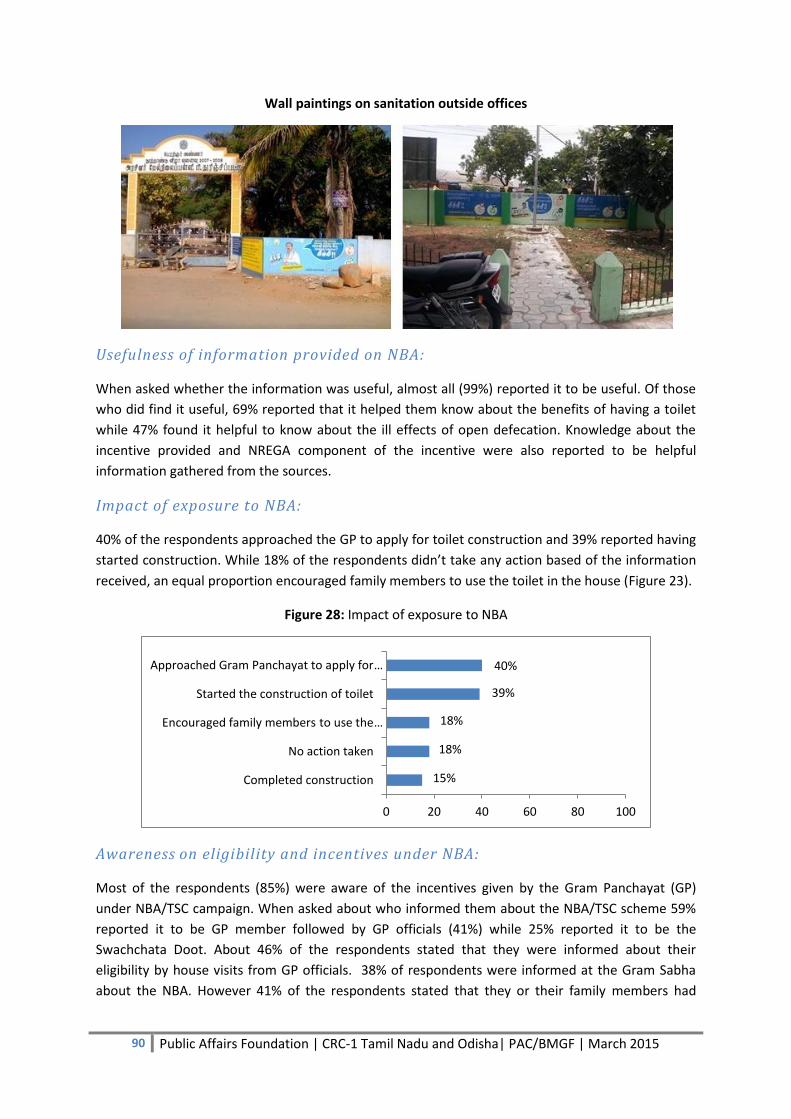
90 Public Affairs Foundation | CRC-1 Tamil Nadu and Odisha| PAC/BMGF | March 2015
Wall paintings on sanitation outside offices
Usefulness of information provided on NBA:
When asked whether the information was useful, almost all (99%) reported it to be useful. Of those
who did find it useful, 69% reported that it helped them know about the benefits of having a toilet
while 47% found it helpful to know about the ill effects of open defecation. Knowledge about the
incentive provided and NREGA component of the incentive were also reported to be helpful
information gathered from the sources.
Impact of exposure to NBA:
40% of the respondents approached the GP to apply for toilet construction and 39% reported having
started construction. While 18% of the respondents didn’t take any action based of the information
received, an equal proportion encouraged family members to use the toilet in the house (Figure 23).
Figure 28: Impact of exposure to NBA
Awareness on eligibility and incentives under NBA:
Most of the respondents (85%) were aware of the incentives given by the Gram Panchayat (GP)
under NBA/TSC campaign. When asked about who informed them about the NBA/TSC scheme 59%
reported it to be GP member followed by GP officials (41%) while 25% reported it to be the
Swachchata Doot. About 46% of the respondents stated that they were informed about their
eligibility by house visits from GP officials. 38% of respondents were informed at the Gram Sabha
about the NBA. However 41% of the respondents stated that they or their family members had
15%
18%
18%
39%
40%
0 20 40 60 80 100
Completed construction
No action taken
Encouraged family members to use the …
Started the construction of toilet
Approached Gram Panchayat to apply for …

91 Public Affairs Foundation | CRC-1 Tamil Nadu and Odisha| PAC/BMGF | March 2015
attended a Gram Sabha which was conducted mostly by GP officials where the scheme was
discussed.
3. Access, usage, quality and reliability of services provided under TSC/NBA
One of the key objectives of the study was to understand the users’ awareness, access, usage,
quality, reliability, responsiveness and satisfaction with construction of a toilet under NBA and also
identify the key constraints faced by citizens, especially the poor and underserved.
Year and month of construction and complet ion of the toilet:
Among the HHs which were surveyed 76% of construction commenced in 2014 and 14% stated it
began in 2013 (Table 29). Toilet construction was completed in 2014 itself according to 79% of
respondents.
Table 34: Commencement of toilet construction
When was the toilet construction started?
Tamil Nadu
Year Count %
2007 0 0
2008 0 0
2009 3 0.1
2010 102 3.8
2011 51 1.9
2012 97 3.6
2013 381 14.3
2014 2031 76.2
N 2666 100
The toilet construction started on an average 68 days after the application was submitted. This
average was lowest for Perambalur (13 days) and highest for Krishnagiri (167 days).
Status of toilets:
83% of the respondents stated that their toilet was completed and in usable condition (Figure 24).
Of those who said the toilet was not usable, 28% cited the lack of a roof as the reason. Out of the
190 respondents who stated that they did not have a completed toilet 95% of them had not received
the incentive amount.23 Of the respondents who did not have a completed toilet, 50% were SCs and
44% were OBC/SEBC.
23
It is to be noted here that the households who stated that they did not have a completed toilet and did not receive the incentive amount may never receive it if the construction process in the area is being handled by contractors. In such a case the contractors would be getting the money directly to construct and the household might never receive the amount.
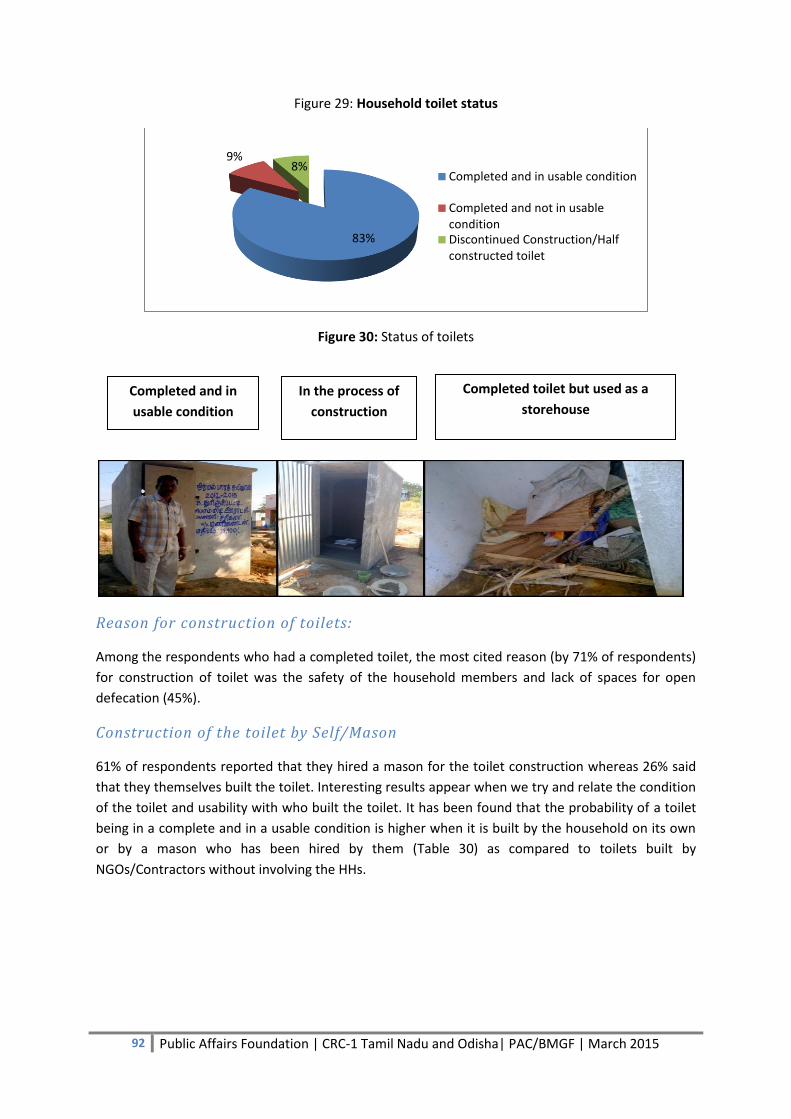
92 Public Affairs Foundation | CRC-1 Tamil Nadu and Odisha| PAC/BMGF | March 2015
Figure 29: Household toilet status
Figure 30: Status of toilets
Reason for construction of toilets:
Among the respondents who had a completed toilet, the most cited reason (by 71% of respondents)
for construction of toilet was the safety of the household members and lack of spaces for open
defecation (45%).
Construction of the toilet by Self/Mason
61% of respondents reported that they hired a mason for the toilet construction whereas 26% said
that they themselves built the toilet. Interesting results appear when we try and relate the condition
of the toilet and usability with who built the toilet. It has been found that the probability of a toilet
being in a complete and in a usable condition is higher when it is built by the household on its own
or by a mason who has been hired by them (Table 30) as compared to toilets built by
NGOs/Contractors without involving the HHs.
83%
9% 8%
Completed and in usable condition
Completed and not in usable condition Discontinued Construction/Half constructed toilet
Completed and in
usable condition
In the process of
construction
Completed toilet but used as a
storehouse
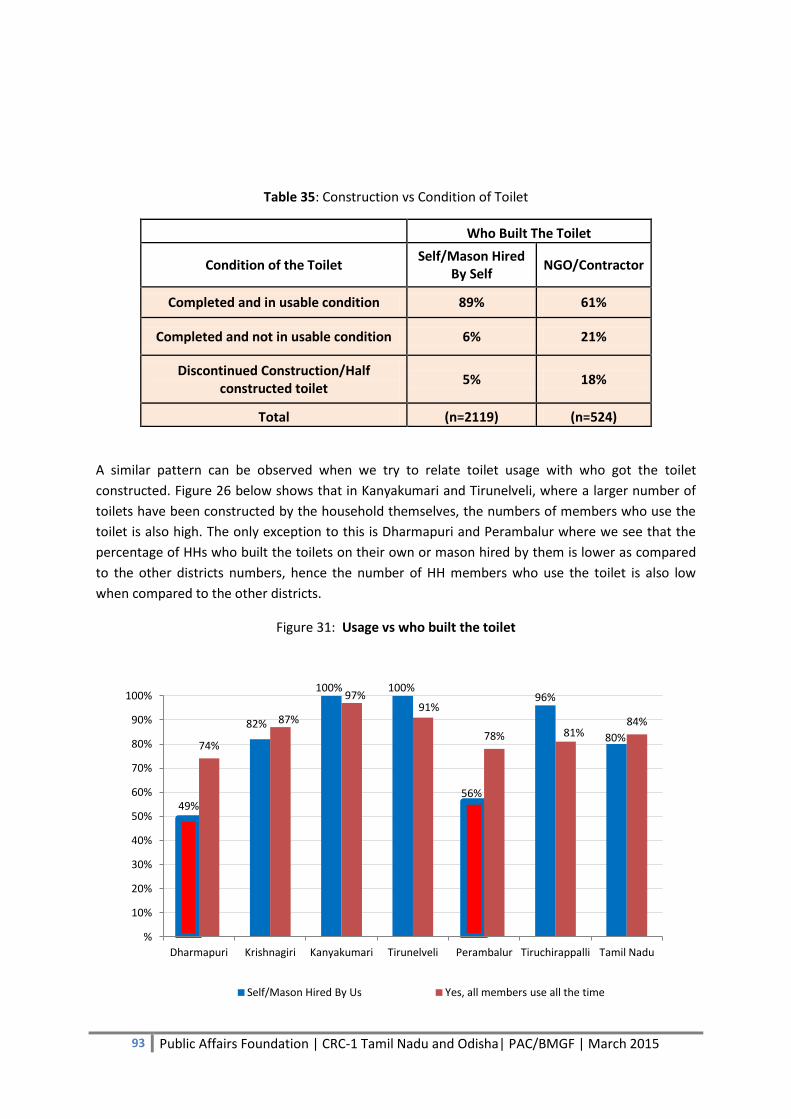
93 Public Affairs Foundation | CRC-1 Tamil Nadu and Odisha| PAC/BMGF | March 2015
Table 35: Construction vs Condition of Toilet
Who Built The Toilet
Condition of the Toilet Self/Mason Hired
By Self NGO/Contractor
Completed and in usable condition 89% 61%
Completed and not in usable condition 6% 21%
Discontinued Construction/Half constructed toilet
5% 18%
Total (n=2119) (n=524)
A similar pattern can be observed when we try to relate toilet usage with who got the toilet
constructed. Figure 26 below shows that in Kanyakumari and Tirunelveli, where a larger number of
toilets have been constructed by the household themselves, the numbers of members who use the
toilet is also high. The only exception to this is Dharmapuri and Perambalur where we see that the
percentage of HHs who built the toilets on their own or mason hired by them is lower as compared
to the other districts numbers, hence the number of HH members who use the toilet is also low
when compared to the other districts.
Figure 31: Usage vs who built the toilet
49%
82%
100% 100%
56%
96%
80% 74%
87%
97% 91%
78% 81% 84%
%
10%
20%
30%
40%
50%
60%
70%
80%
90%
100%
Dharmapuri Krishnagiri Kanyakumari Tirunelveli Perambalur Tiruchirappalli Tamil Nadu
Self/Mason Hired By Us Yes, all members use all the time
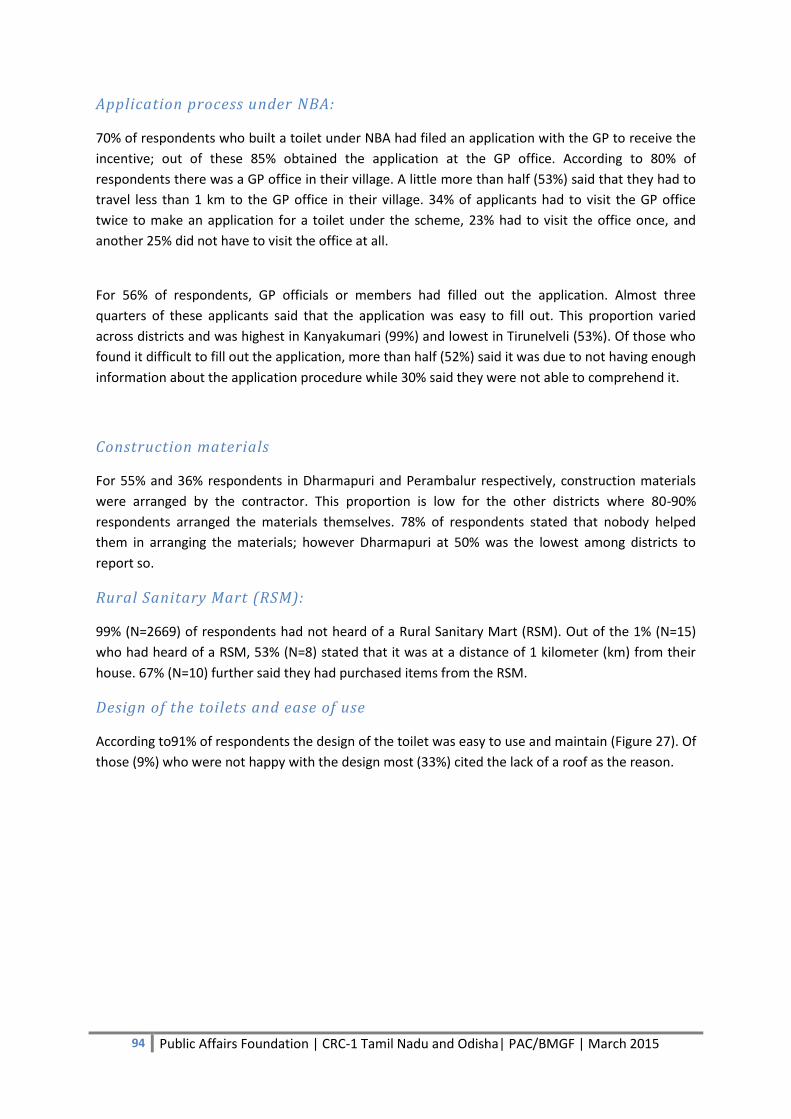
94 Public Affairs Foundation | CRC-1 Tamil Nadu and Odisha| PAC/BMGF | March 2015
Application process under NBA:
70% of respondents who built a toilet under NBA had filed an application with the GP to receive the
incentive; out of these 85% obtained the application at the GP office. According to 80% of
respondents there was a GP office in their village. A little more than half (53%) said that they had to
travel less than 1 km to the GP office in their village. 34% of applicants had to visit the GP office
twice to make an application for a toilet under the scheme, 23% had to visit the office once, and
another 25% did not have to visit the office at all.
For 56% of respondents, GP officials or members had filled out the application. Almost three
quarters of these applicants said that the application was easy to fill out. This proportion varied
across districts and was highest in Kanyakumari (99%) and lowest in Tirunelveli (53%). Of those who
found it difficult to fill out the application, more than half (52%) said it was due to not having enough
information about the application procedure while 30% said they were not able to comprehend it.
Construction materials
For 55% and 36% respondents in Dharmapuri and Perambalur respectively, construction materials
were arranged by the contractor. This proportion is low for the other districts where 80-90%
respondents arranged the materials themselves. 78% of respondents stated that nobody helped
them in arranging the materials; however Dharmapuri at 50% was the lowest among districts to
report so.
Rural Sanitary Mart (RSM):
99% (N=2669) of respondents had not heard of a Rural Sanitary Mart (RSM). Out of the 1% (N=15)
who had heard of a RSM, 53% (N=8) stated that it was at a distance of 1 kilometer (km) from their
house. 67% (N=10) further said they had purchased items from the RSM.
Design of the toilets and ease of use
According to91% of respondents the design of the toilet was easy to use and maintain (Figure 27). Of
those (9%) who were not happy with the design most (33%) cited the lack of a roof as the reason.
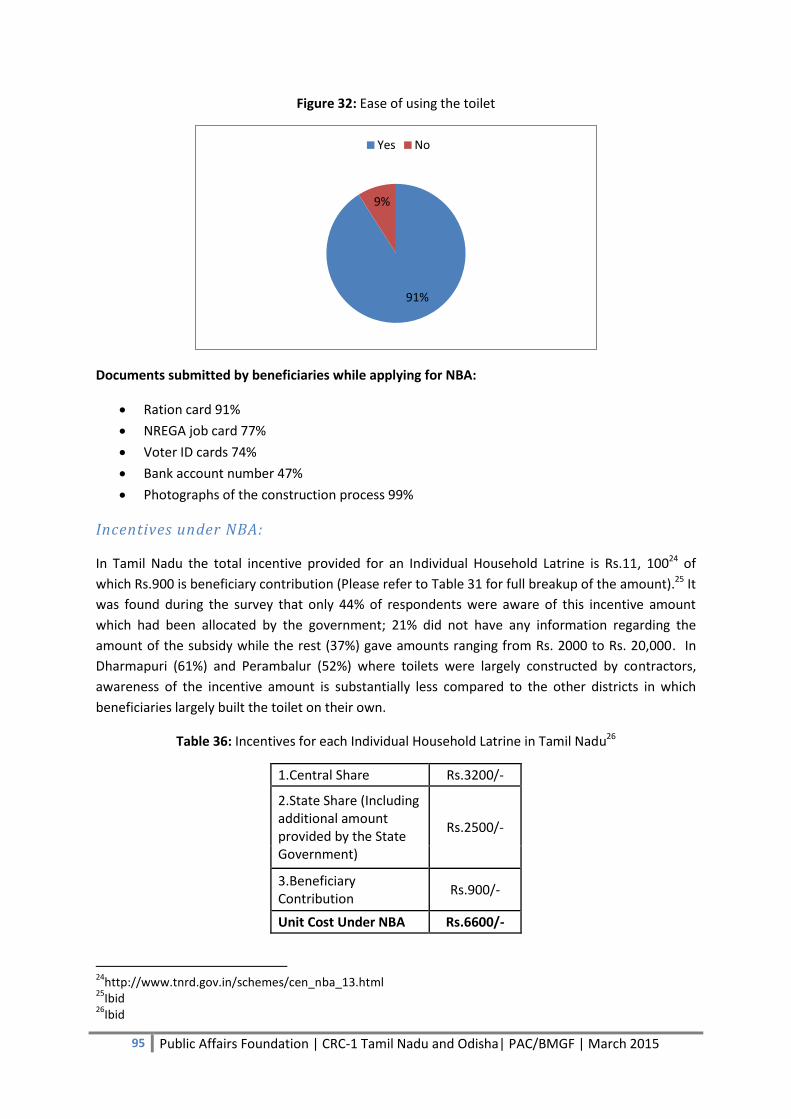
95 Public Affairs Foundation | CRC-1 Tamil Nadu and Odisha| PAC/BMGF | March 2015
Figure 32: Ease of using the toilet
Documents submitted by beneficiaries while applying for NBA:
Ration card 91%
NREGA job card 77%
Voter ID cards 74%
Bank account number 47%
Photographs of the construction process 99%
Incentives under NBA:
In Tamil Nadu the total incentive provided for an Individual Household Latrine is Rs.11, 10024 of
which Rs.900 is beneficiary contribution (Please refer to Table 31 for full breakup of the amount).25 It
was found during the survey that only 44% of respondents were aware of this incentive amount
which had been allocated by the government; 21% did not have any information regarding the
amount of the subsidy while the rest (37%) gave amounts ranging from Rs. 2000 to Rs. 20,000. In
Dharmapuri (61%) and Perambalur (52%) where toilets were largely constructed by contractors,
awareness of the incentive amount is substantially less compared to the other districts in which
beneficiaries largely built the toilet on their own.
Table 36: Incentives for each Individual Household Latrine in Tamil Nadu26
1.Central Share Rs.3200/-
2.State Share (Including additional amount provided by the State Government)
Rs.2500/-
3.Beneficiary Contribution
Rs.900/-
Unit Cost Under NBA Rs.6600/-
24
http://www.tnrd.gov.in/schemes/cen_nba_13.html 25
Ibid 26
Ibid
91%
9%
Yes No

96 Public Affairs Foundation | CRC-1 Tamil Nadu and Odisha| PAC/BMGF | March 2015
4.Assistance from MGNREGS
Rs.4500/-
Total Unit Cost Rs.11,100/-
Total cost and extra expenses incurred by beneficiaries for toilet construction:
According to 80% of respondents, they spent more than the incentive for toilet construction. Table
32 shows that Tirunelveli stands out, as the expenses incurred by a household both in terms of extra
money spent (at Rs.26, 189) and total cost (at Rs. 33,202) is very high when compared to the other
five districts. District officials mentioned during conversations that Tirunelveli residents preferred
Septic toilets as opposed to pit toilets. This could be one of the reasons for the higher cost of the
toilets in Tirunelveli.
Table 37: Extra money spent and total cost of toilet construction
How much extra did you spend
(Rupees)? What was the total cost of the toilet?
(Rupees)
District N Mean Median N Mean Median
Dharmapuri 333 7652 5000 454 10944 12000
Kanyakumari 392 12807 10000 423 19775 18000
Krishnagiri 372 13694 10000 407 19764 19100
Perambalur 241 14825 10000 449 13631 10200
Tirunelveli 416 26189 25000 424 33202 30000
Trichy 373 14360 13000 445 21319 20000
Tamil Nadu 2127 15273 12000 2602 19624 18000
When we examine the six districts together it was found that on an average HHs had to spend Rs.15,
273 more on toilet construction than the incentive which they were eligible. On average the total
cost which was incurred by HHs on toilet construction was Rs.19, 624.
Borrowing money for toilet construction
When respondents were asked if they had to borrow money for toilet construction, 68% said yes.
41% borrowed from money lenders, 26% from pawn brokers, and 20% from relatives; only 7%
borrowed from banks. On being questioned if they were able to repay the loan, 40% stated that they
were not able to do so, whereas 45% said they partially repaid the loan.
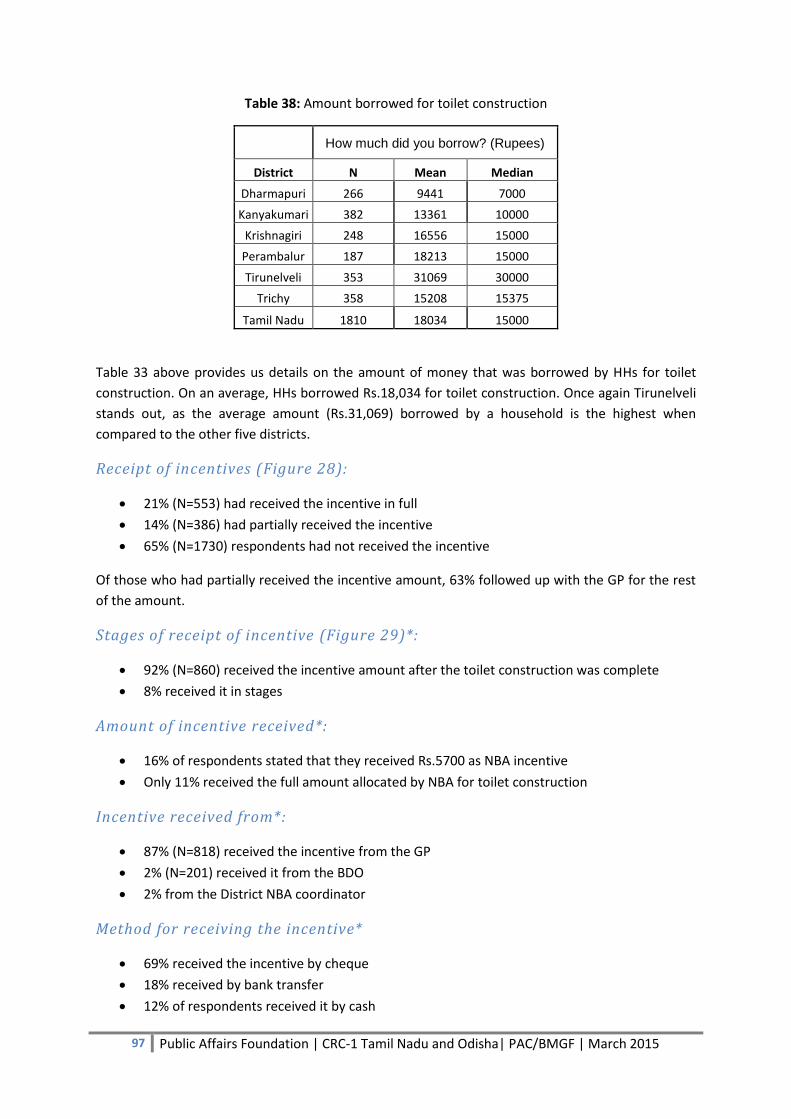
97 Public Affairs Foundation | CRC-1 Tamil Nadu and Odisha| PAC/BMGF | March 2015
Table 38: Amount borrowed for toilet construction
How much did you borrow? (Rupees)
District N Mean Median
Dharmapuri 266 9441 7000
Kanyakumari 382 13361 10000
Krishnagiri 248 16556 15000
Perambalur 187 18213 15000
Tirunelveli 353 31069 30000
Trichy 358 15208 15375
Tamil Nadu 1810 18034 15000
Table 33 above provides us details on the amount of money that was borrowed by HHs for toilet
construction. On an average, HHs borrowed Rs.18,034 for toilet construction. Once again Tirunelveli
stands out, as the average amount (Rs.31,069) borrowed by a household is the highest when
compared to the other five districts.
Receipt of incentives (Figure 28):
21% (N=553) had received the incentive in full
14% (N=386) had partially received the incentive
65% (N=1730) respondents had not received the incentive
Of those who had partially received the incentive amount, 63% followed up with the GP for the rest
of the amount.
Stages of receipt of incentive (Figure 29)*:
92% (N=860) received the incentive amount after the toilet construction was complete
8% received it in stages
Amount of incentive received*:
16% of respondents stated that they received Rs.5700 as NBA incentive
Only 11% received the full amount allocated by NBA for toilet construction
Incentive received from*:
87% (N=818) received the incentive from the GP
2% (N=201) received it from the BDO
2% from the District NBA coordinator
Method for receiving the incentive*
69% received the incentive by cheque
18% received by bank transfer
12% of respondents received it by cash

98 Public Affairs Foundation | CRC-1 Tamil Nadu and Odisha| PAC/BMGF | March 2015
*This is only for those HHs who received the incentive amount
Figure 33: Receiving the incentive
Figure 34: Stage of receiving the incentive
NREGA and NBA:
NREGA job cards were present with 92% of HHs 81%of HHs stated that NBA officials informed them
that possession of an NREGA job card was necessary for applying for a subsidy under NBA. 71% of
respondents reported that they or their family members had worked at an NREGA job site in the
previous year. A little more than half (54%) said that they or their family members had put in labour
for building their toilet. 84% of respondents were aware that the work days spent in construction of
their toilet had to be entered in their job card. In 72% of cases the mate had entered the work days
in the job card. In 42% of cases the household members did not get paid for the toilet construction
work and those who got paid (58%) got the money by bank transfer. 95% of respondents said other
people in the village using their job card had not worked on the respondent’s toilet construction.
65%
21% 14%
0
10
20
30
40
50
60
70
80
90
100
Not received Yes fully Yes partially
92%
8%
0
10
20
30
40
50
60
70
80
90
100
After the toilet was fully constructed In between stages
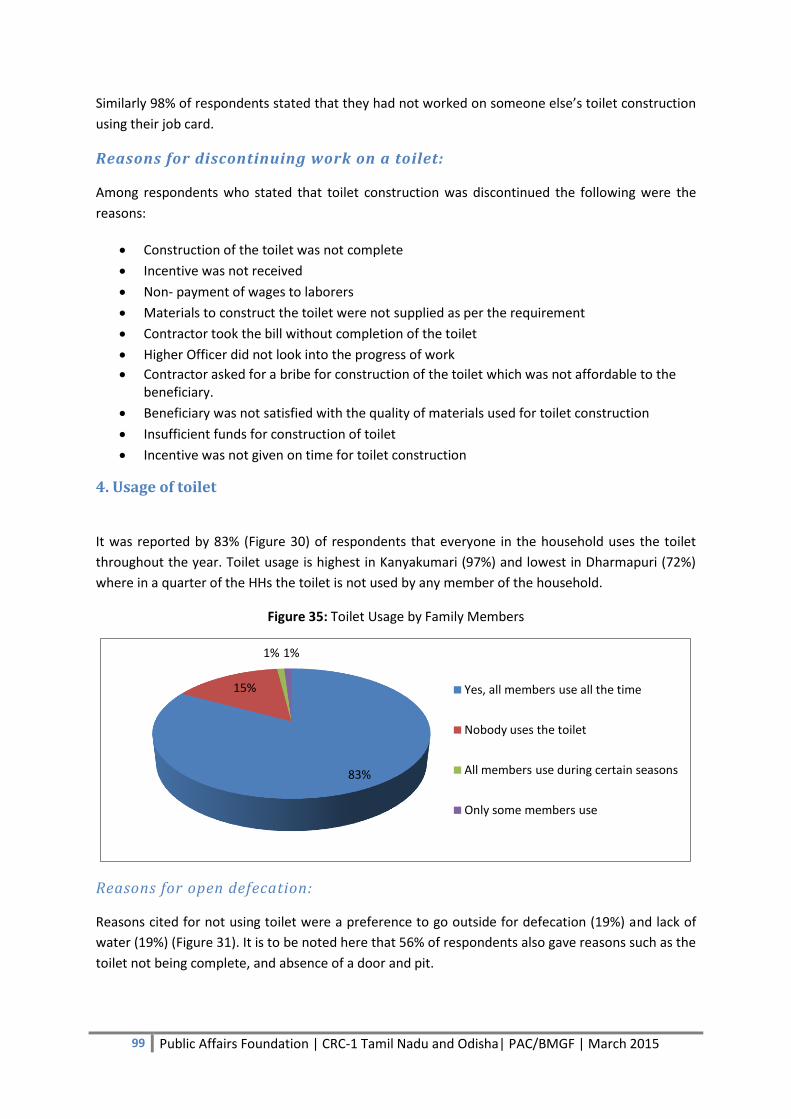
99 Public Affairs Foundation | CRC-1 Tamil Nadu and Odisha| PAC/BMGF | March 2015
Similarly 98% of respondents stated that they had not worked on someone else’s toilet construction
using their job card.
Reasons for discontinuing work on a toilet:
Among respondents who stated that toilet construction was discontinued the following were the
reasons:
Construction of the toilet was not complete
Incentive was not received
Non- payment of wages to laborers
Materials to construct the toilet were not supplied as per the requirement
Contractor took the bill without completion of the toilet
Higher Officer did not look into the progress of work
Contractor asked for a bribe for construction of the toilet which was not affordable to the beneficiary.
Beneficiary was not satisfied with the quality of materials used for toilet construction
Insufficient funds for construction of toilet
Incentive was not given on time for toilet construction
4. Usage of toilet
It was reported by 83% (Figure 30) of respondents that everyone in the household uses the toilet
throughout the year. Toilet usage is highest in Kanyakumari (97%) and lowest in Dharmapuri (72%)
where in a quarter of the HHs the toilet is not used by any member of the household.
Figure 35: Toilet Usage by Family Members
Reasons for open defecation:
Reasons cited for not using toilet were a preference to go outside for defecation (19%) and lack of
water (19%) (Figure 31). It is to be noted here that 56% of respondents also gave reasons such as the
toilet not being complete, and absence of a door and pit.
83%
15%
1% 1%
Yes, all members use all the time
Nobody uses the toilet
All members use during certain seasons
Only some members use
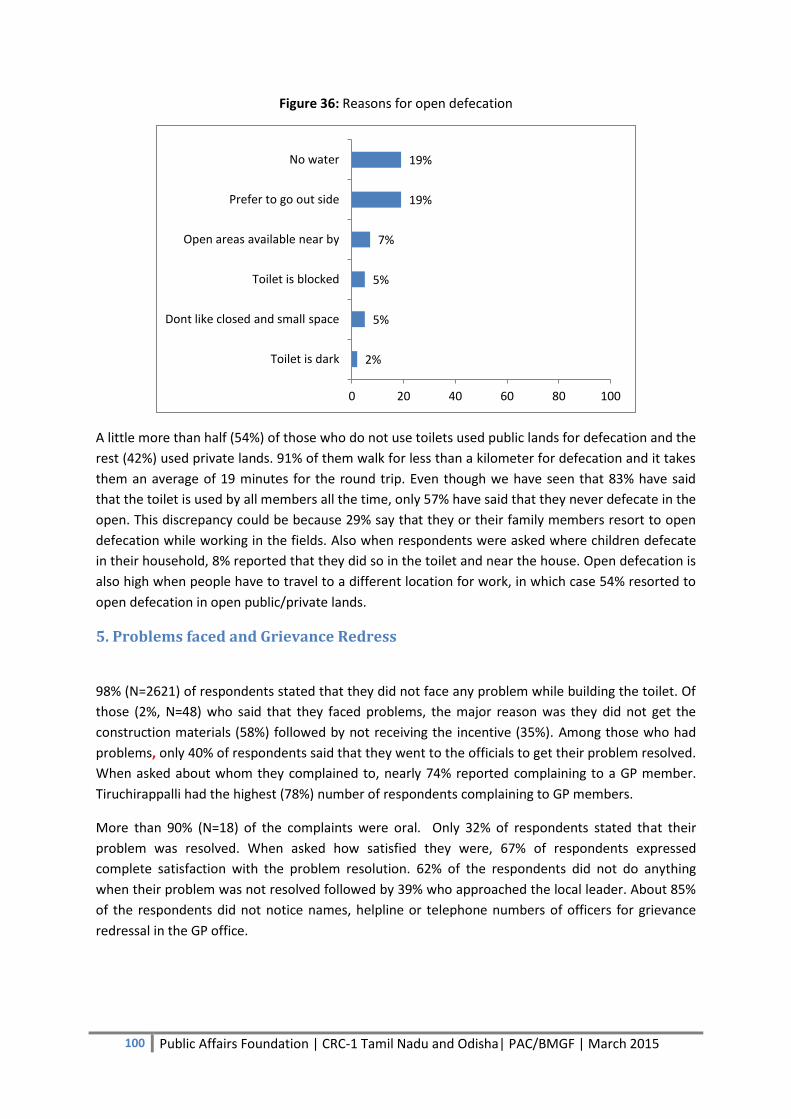
100 Public Affairs Foundation | CRC-1 Tamil Nadu and Odisha| PAC/BMGF | March 2015
Figure 36: Reasons for open defecation
A little more than half (54%) of those who do not use toilets used public lands for defecation and the
rest (42%) used private lands. 91% of them walk for less than a kilometer for defecation and it takes
them an average of 19 minutes for the round trip. Even though we have seen that 83% have said
that the toilet is used by all members all the time, only 57% have said that they never defecate in the
open. This discrepancy could be because 29% say that they or their family members resort to open
defecation while working in the fields. Also when respondents were asked where children defecate
in their household, 8% reported that they did so in the toilet and near the house. Open defecation is
also high when people have to travel to a different location for work, in which case 54% resorted to
open defecation in open public/private lands.
5. Problems faced and Grievance Redress
98% (N=2621) of respondents stated that they did not face any problem while building the toilet. Of
those (2%, N=48) who said that they faced problems, the major reason was they did not get the
construction materials (58%) followed by not receiving the incentive (35%). Among those who had
problems, only 40% of respondents said that they went to the officials to get their problem resolved.
When asked about whom they complained to, nearly 74% reported complaining to a GP member.
Tiruchirappalli had the highest (78%) number of respondents complaining to GP members.
More than 90% (N=18) of the complaints were oral. Only 32% of respondents stated that their
problem was resolved. When asked how satisfied they were, 67% of respondents expressed
complete satisfaction with the problem resolution. 62% of the respondents did not do anything
when their problem was not resolved followed by 39% who approached the local leader. About 85%
of the respondents did not notice names, helpline or telephone numbers of officers for grievance
redressal in the GP office.
2%
5%
5%
7%
19%
19%
0 20 40 60 80 100
Toilet is dark
Dont like closed and small space
Toilet is blocked
Open areas available near by
Prefer to go out side
No water
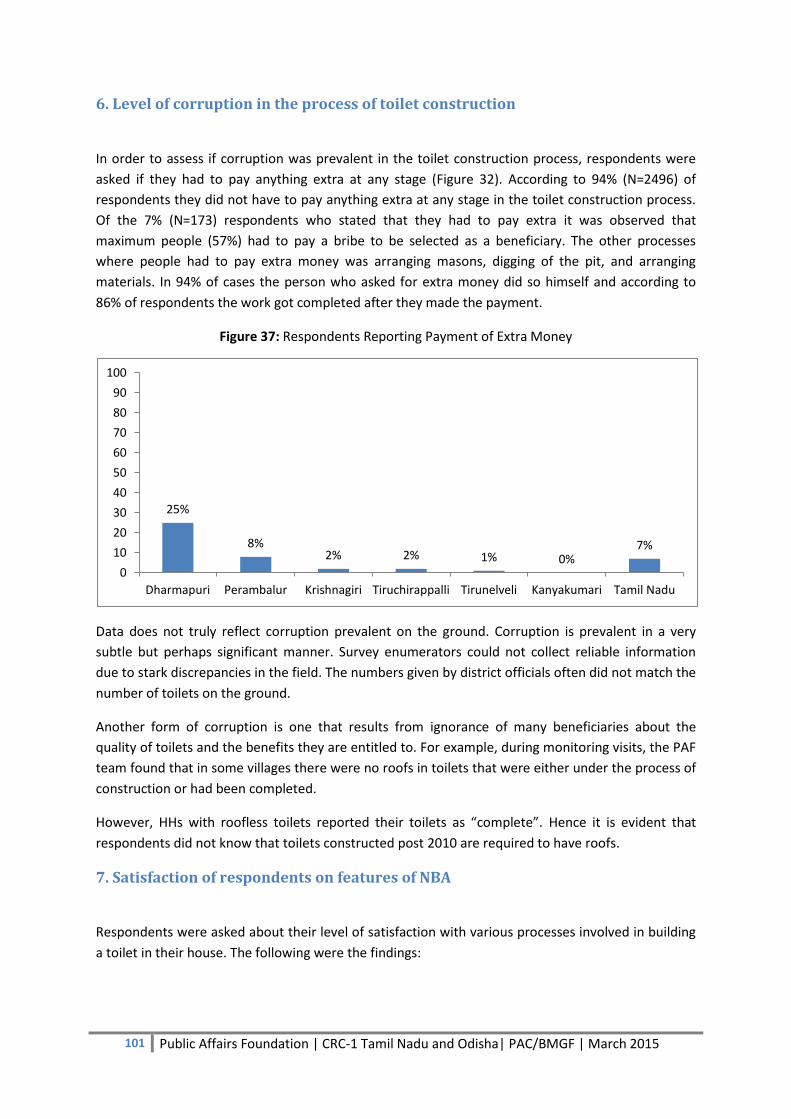
101 Public Affairs Foundation | CRC-1 Tamil Nadu and Odisha| PAC/BMGF | March 2015
6. Level of corruption in the process of toilet construction
In order to assess if corruption was prevalent in the toilet construction process, respondents were
asked if they had to pay anything extra at any stage (Figure 32). According to 94% (N=2496) of
respondents they did not have to pay anything extra at any stage in the toilet construction process.
Of the 7% (N=173) respondents who stated that they had to pay extra it was observed that
maximum people (57%) had to pay a bribe to be selected as a beneficiary. The other processes
where people had to pay extra money was arranging masons, digging of the pit, and arranging
materials. In 94% of cases the person who asked for extra money did so himself and according to
86% of respondents the work got completed after they made the payment.
Figure 37: Respondents Reporting Payment of Extra Money
Data does not truly reflect corruption prevalent on the ground. Corruption is prevalent in a very
subtle but perhaps significant manner. Survey enumerators could not collect reliable information
due to stark discrepancies in the field. The numbers given by district officials often did not match the
number of toilets on the ground.
Another form of corruption is one that results from ignorance of many beneficiaries about the
quality of toilets and the benefits they are entitled to. For example, during monitoring visits, the PAF
team found that in some villages there were no roofs in toilets that were either under the process of
construction or had been completed.
However, HHs with roofless toilets reported their toilets as “complete”. Hence it is evident that
respondents did not know that toilets constructed post 2010 are required to have roofs.
7. Satisfaction of respondents on features of NBA
Respondents were asked about their level of satisfaction with various processes involved in building
a toilet in their house. The following were the findings:
25%
8% 2% 2% 1% 0%
7%
0
10
20
30
40
50
60
70
80
90
100
Dharmapuri Perambalur Krishnagiri Tiruchirappalli Tirunelveli Kanyakumari Tamil Nadu
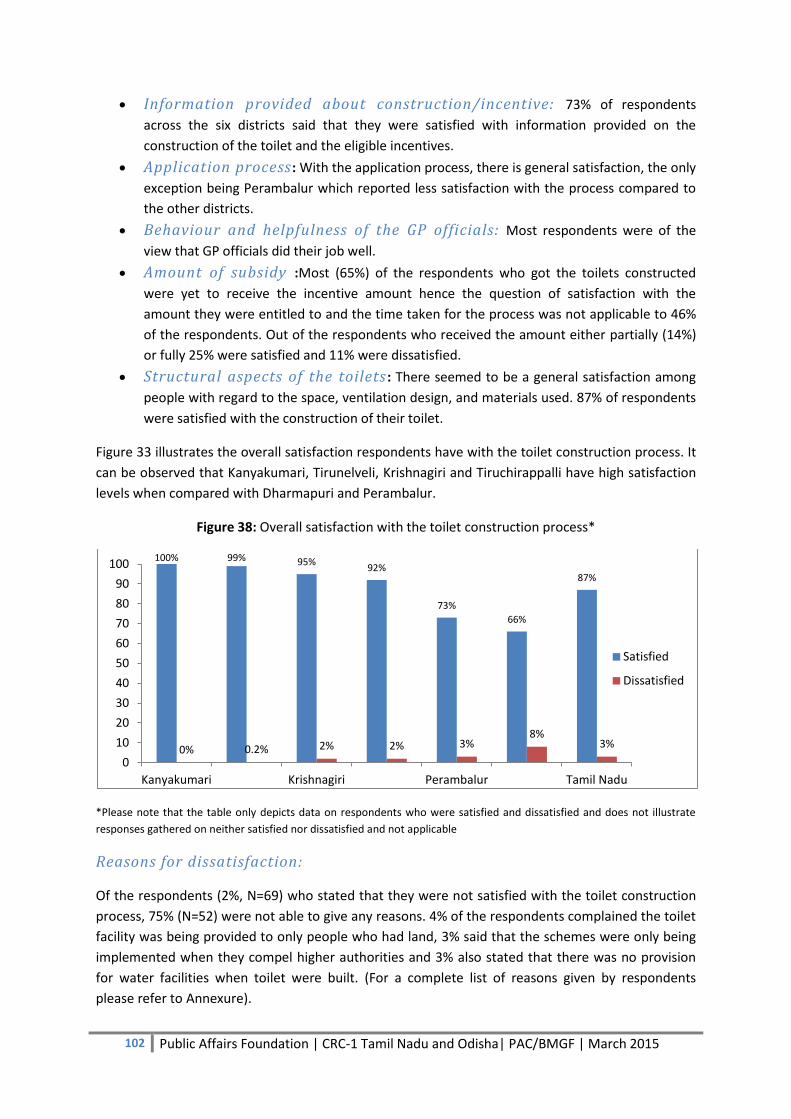
102 Public Affairs Foundation | CRC-1 Tamil Nadu and Odisha| PAC/BMGF | March 2015
Information provided about construction/incentive: 73% of respondents
across the six districts said that they were satisfied with information provided on the
construction of the toilet and the eligible incentives.
Application process : With the application process, there is general satisfaction, the only
exception being Perambalur which reported less satisfaction with the process compared to
the other districts.
Behaviour and helpfulness of the GP officials: Most respondents were of the
view that GP officials did their job well.
Amount of subsidy :Most (65%) of the respondents who got the toilets constructed
were yet to receive the incentive amount hence the question of satisfaction with the
amount they were entitled to and the time taken for the process was not applicable to 46%
of the respondents. Out of the respondents who received the amount either partially (14%)
or fully 25% were satisfied and 11% were dissatisfied.
Structural aspects of the toilets : There seemed to be a general satisfaction among
people with regard to the space, ventilation design, and materials used. 87% of respondents
were satisfied with the construction of their toilet.
Figure 33 illustrates the overall satisfaction respondents have with the toilet construction process. It
can be observed that Kanyakumari, Tirunelveli, Krishnagiri and Tiruchirappalli have high satisfaction
levels when compared with Dharmapuri and Perambalur.
Figure 38: Overall satisfaction with the toilet construction process*
*Please note that the table only depicts data on respondents who were satisfied and dissatisfied and does not illustrate
responses gathered on neither satisfied nor dissatisfied and not applicable
Reasons for dissatisfaction:
Of the respondents (2%, N=69) who stated that they were not satisfied with the toilet construction
process, 75% (N=52) were not able to give any reasons. 4% of the respondents complained the toilet
facility was being provided to only people who had land, 3% said that the schemes were only being
implemented when they compel higher authorities and 3% also stated that there was no provision
for water facilities when toilet were built. (For a complete list of reasons given by respondents
please refer to Annexure).
100% 99% 95% 92%
73%
66%
87%
0% 0.2% 2% 2% 3% 8%
3%
0
10
20
30
40
50
60
70
80
90
100
Kanyakumari Krishnagiri Perambalur Tamil Nadu
Satisfied
Dissatisfied
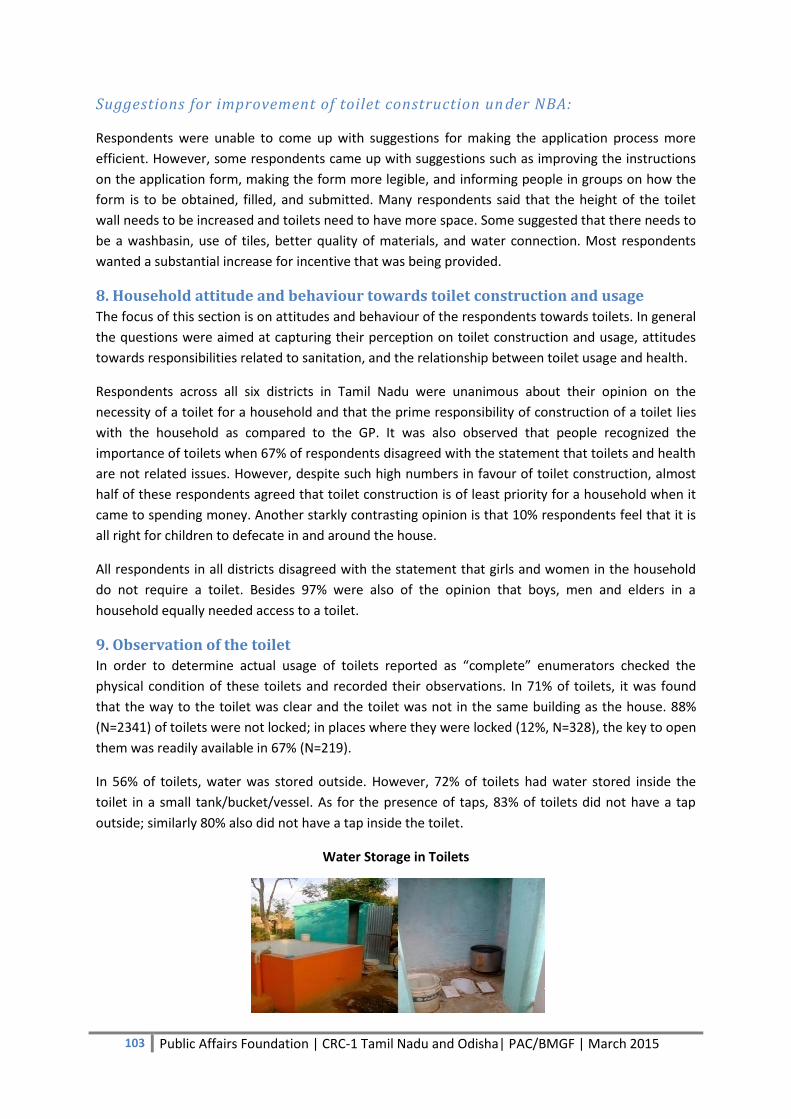
103 Public Affairs Foundation | CRC-1 Tamil Nadu and Odisha| PAC/BMGF | March 2015
Suggestions for improvement of toilet construction un der NBA:
Respondents were unable to come up with suggestions for making the application process more
efficient. However, some respondents came up with suggestions such as improving the instructions
on the application form, making the form more legible, and informing people in groups on how the
form is to be obtained, filled, and submitted. Many respondents said that the height of the toilet
wall needs to be increased and toilets need to have more space. Some suggested that there needs to
be a washbasin, use of tiles, better quality of materials, and water connection. Most respondents
wanted a substantial increase for incentive that was being provided.
8. Household attitude and behaviour towards toilet construction and usage
The focus of this section is on attitudes and behaviour of the respondents towards toilets. In general
the questions were aimed at capturing their perception on toilet construction and usage, attitudes
towards responsibilities related to sanitation, and the relationship between toilet usage and health.
Respondents across all six districts in Tamil Nadu were unanimous about their opinion on the
necessity of a toilet for a household and that the prime responsibility of construction of a toilet lies
with the household as compared to the GP. It was also observed that people recognized the
importance of toilets when 67% of respondents disagreed with the statement that toilets and health
are not related issues. However, despite such high numbers in favour of toilet construction, almost
half of these respondents agreed that toilet construction is of least priority for a household when it
came to spending money. Another starkly contrasting opinion is that 10% respondents feel that it is
all right for children to defecate in and around the house.
All respondents in all districts disagreed with the statement that girls and women in the household
do not require a toilet. Besides 97% were also of the opinion that boys, men and elders in a
household equally needed access to a toilet.
9. Observation of the toilet
In order to determine actual usage of toilets reported as “complete” enumerators checked the
physical condition of these toilets and recorded their observations. In 71% of toilets, it was found
that the way to the toilet was clear and the toilet was not in the same building as the house. 88%
(N=2341) of toilets were not locked; in places where they were locked (12%, N=328), the key to open
them was readily available in 67% (N=219).
In 56% of toilets, water was stored outside. However, 72% of toilets had water stored inside the
toilet in a small tank/bucket/vessel. As for the presence of taps, 83% of toilets did not have a tap
outside; similarly 80% also did not have a tap inside the toilet.
Water Storage in Toilets
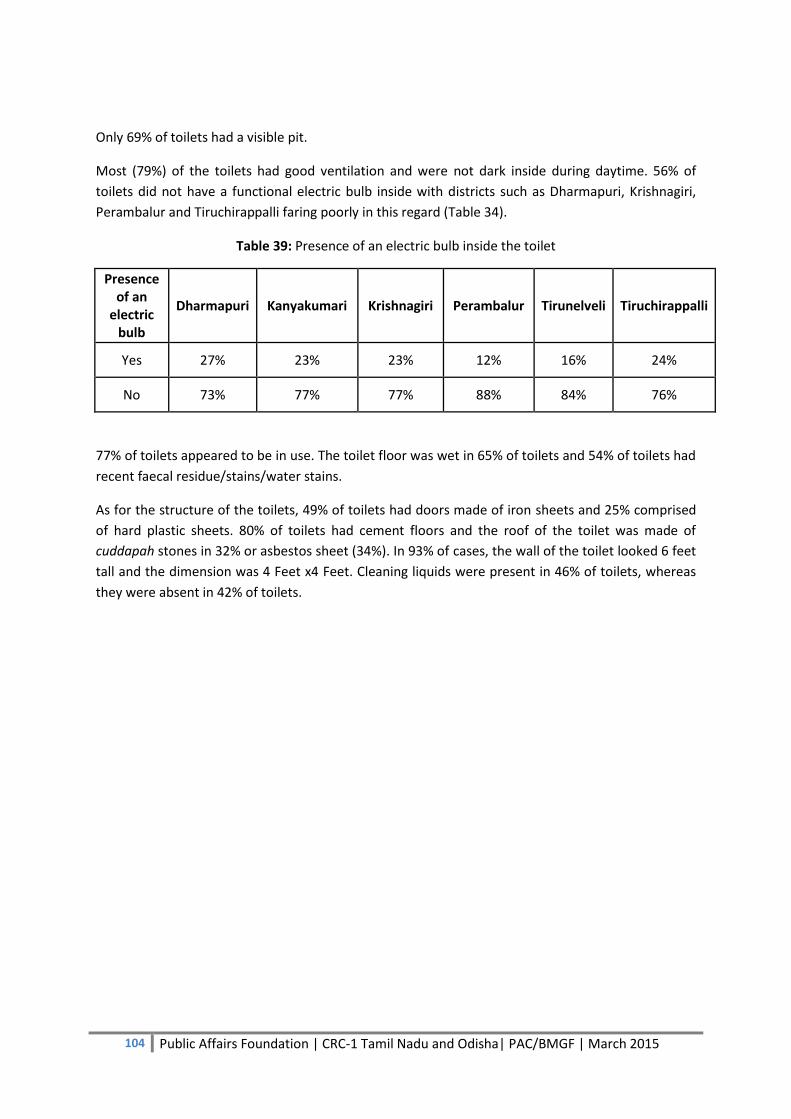
104 Public Affairs Foundation | CRC-1 Tamil Nadu and Odisha| PAC/BMGF | March 2015
Only 69% of toilets had a visible pit.
Most (79%) of the toilets had good ventilation and were not dark inside during daytime. 56% of
toilets did not have a functional electric bulb inside with districts such as Dharmapuri, Krishnagiri,
Perambalur and Tiruchirappalli faring poorly in this regard (Table 34).
Table 39: Presence of an electric bulb inside the toilet
Presence of an
electric bulb
Dharmapuri Kanyakumari Krishnagiri Perambalur Tirunelveli Tiruchirappalli
Yes 27% 23% 23% 12% 16% 24%
No 73% 77% 77% 88% 84% 76%
77% of toilets appeared to be in use. The toilet floor was wet in 65% of toilets and 54% of toilets had
recent faecal residue/stains/water stains.
As for the structure of the toilets, 49% of toilets had doors made of iron sheets and 25% comprised
of hard plastic sheets. 80% of toilets had cement floors and the roof of the toilet was made of
cuddapah stones in 32% or asbestos sheet (34%). In 93% of cases, the wall of the toilet looked 6 feet
tall and the dimension was 4 Feet x4 Feet. Cleaning liquids were present in 46% of toilets, whereas
they were absent in 42% of toilets.
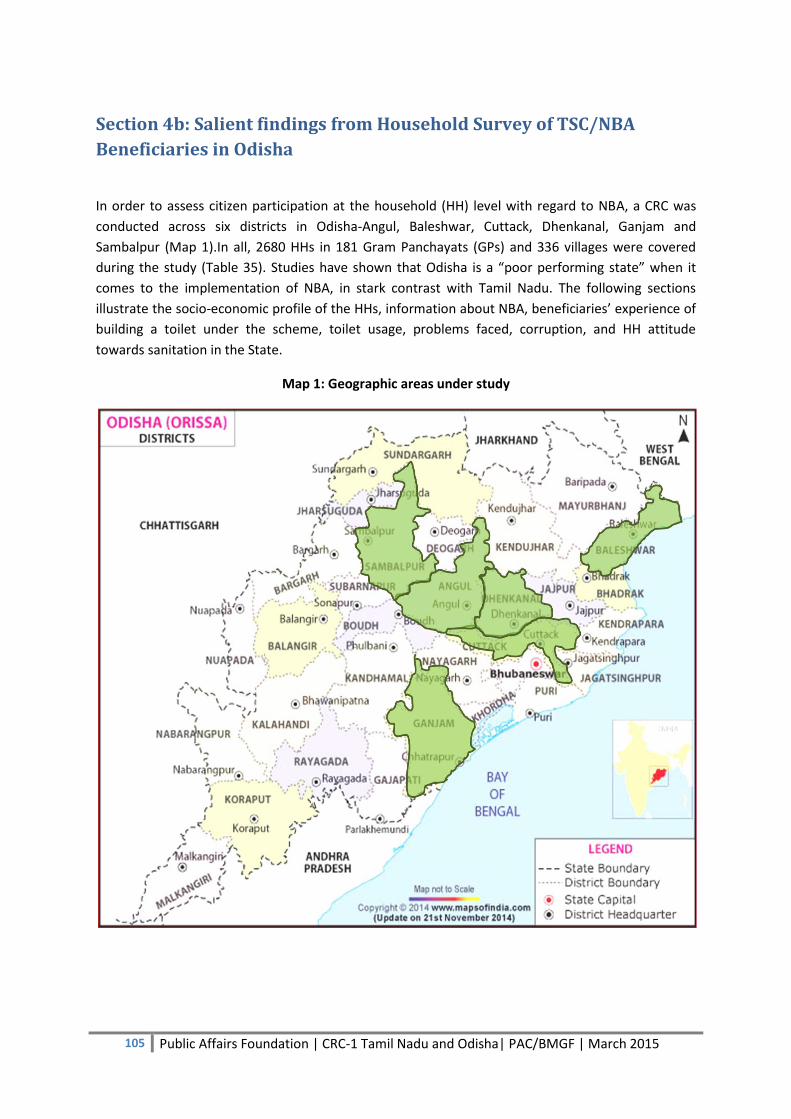
105 Public Affairs Foundation | CRC-1 Tamil Nadu and Odisha| PAC/BMGF | March 2015
Section 4b: Salient findings from Household Survey of TSC/NBA
Beneficiaries in Odisha
In order to assess citizen participation at the household (HH) level with regard to NBA, a CRC was
conducted across six districts in Odisha-Angul, Baleshwar, Cuttack, Dhenkanal, Ganjam and
Sambalpur (Map 1).In all, 2680 HHs in 181 Gram Panchayats (GPs) and 336 villages were covered
during the study (Table 35). Studies have shown that Odisha is a “poor performing state” when it
comes to the implementation of NBA, in stark contrast with Tamil Nadu. The following sections
illustrate the socio-economic profile of the HHs, information about NBA, beneficiaries’ experience of
building a toilet under the scheme, toilet usage, problems faced, corruption, and HH attitude
towards sanitation in the State.
Map 1: Geographic areas under study
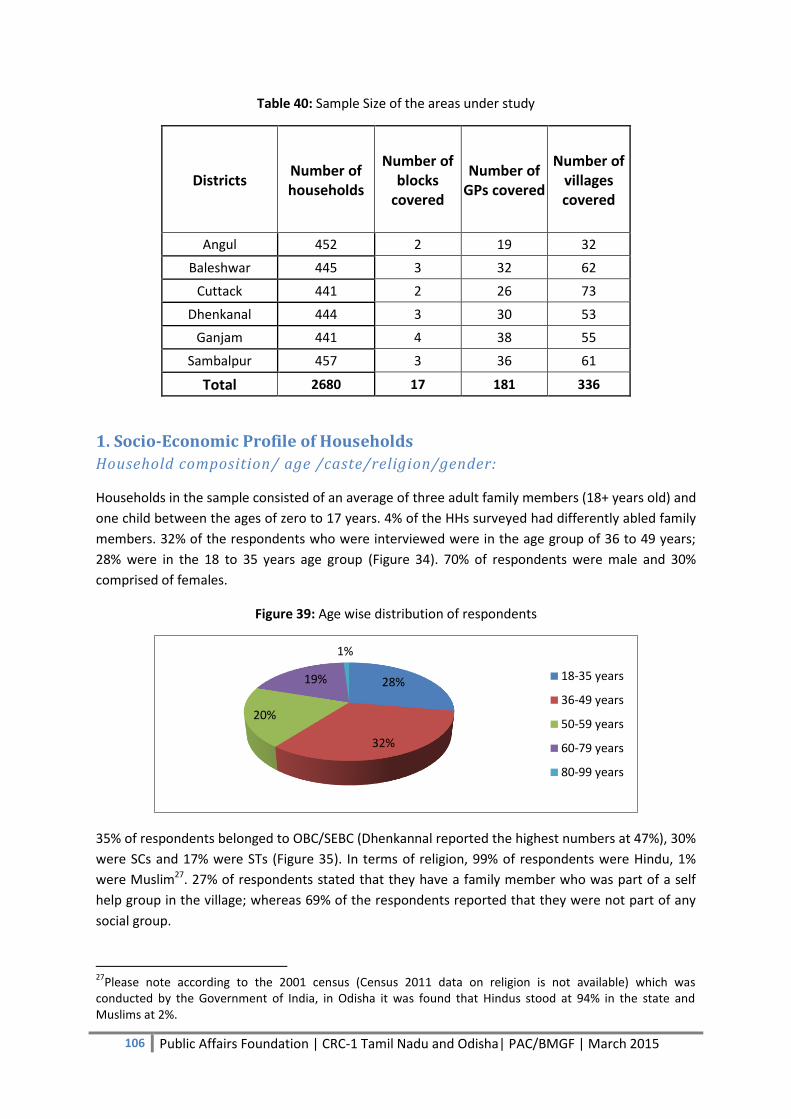
106 Public Affairs Foundation | CRC-1 Tamil Nadu and Odisha| PAC/BMGF | March 2015
Table 40: Sample Size of the areas under study
Districts Number of households
Number of blocks
covered
Number of GPs covered
Number of villages covered
Angul 452 2 19 32
Baleshwar 445 3 32 62
Cuttack 441 2 26 73
Dhenkanal 444 3 30 53
Ganjam 441 4 38 55
Sambalpur 457 3 36 61
Total 2680 17 181 336
1. Socio-Economic Profile of Households
Household composition/ age /caste/religion/gender:
Households in the sample consisted of an average of three adult family members (18+ years old) and
one child between the ages of zero to 17 years. 4% of the HHs surveyed had differently abled family
members. 32% of the respondents who were interviewed were in the age group of 36 to 49 years;
28% were in the 18 to 35 years age group (Figure 34). 70% of respondents were male and 30%
comprised of females.
Figure 39: Age wise distribution of respondents
35% of respondents belonged to OBC/SEBC (Dhenkannal reported the highest numbers at 47%), 30%
were SCs and 17% were STs (Figure 35). In terms of religion, 99% of respondents were Hindu, 1%
were Muslim27. 27% of respondents stated that they have a family member who was part of a self
help group in the village; whereas 69% of the respondents reported that they were not part of any
social group.
27
Please note according to the 2001 census (Census 2011 data on religion is not available) which was conducted by the Government of India, in Odisha it was found that Hindus stood at 94% in the state and Muslims at 2%.
28%
32%
20%
19%
1%
18-35 years
36-49 years
50-59 years
60-79 years
80-99 years
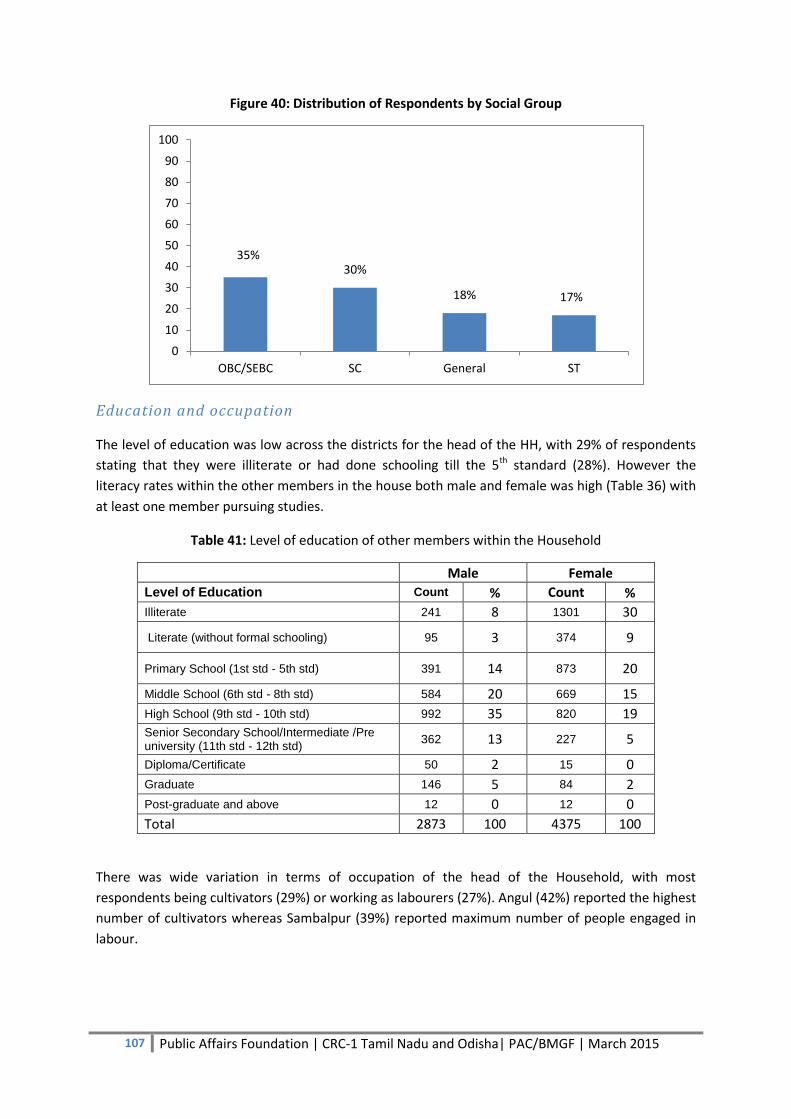
107 Public Affairs Foundation | CRC-1 Tamil Nadu and Odisha| PAC/BMGF | March 2015
Figure 40: Distribution of Respondents by Social Group
Education and occupation
The level of education was low across the districts for the head of the HH, with 29% of respondents
stating that they were illiterate or had done schooling till the 5th standard (28%). However the
literacy rates within the other members in the house both male and female was high (Table 36) with
at least one member pursuing studies.
Table 41: Level of education of other members within the Household
Male Female
Level of Education Count % Count %
Illiterate 241 8 1301 30
Literate (without formal schooling) 95 3 374 9
Primary School (1st std - 5th std) 391 14 873 20
Middle School (6th std - 8th std) 584 20 669 15
High School (9th std - 10th std) 992 35 820 19 Senior Secondary School/Intermediate /Pre university (11th std - 12th std)
362 13 227 5
Diploma/Certificate 50 2 15 0
Graduate 146 5 84 2
Post-graduate and above 12 0 12 0
Total 2873 100 4375 100
There was wide variation in terms of occupation of the head of the Household, with most
respondents being cultivators (29%) or working as labourers (27%). Angul (42%) reported the highest
number of cultivators whereas Sambalpur (39%) reported maximum number of people engaged in
labour.
35% 30%
18% 17%
0
10
20
30
40
50
60
70
80
90
100
OBC/SEBC SC General ST
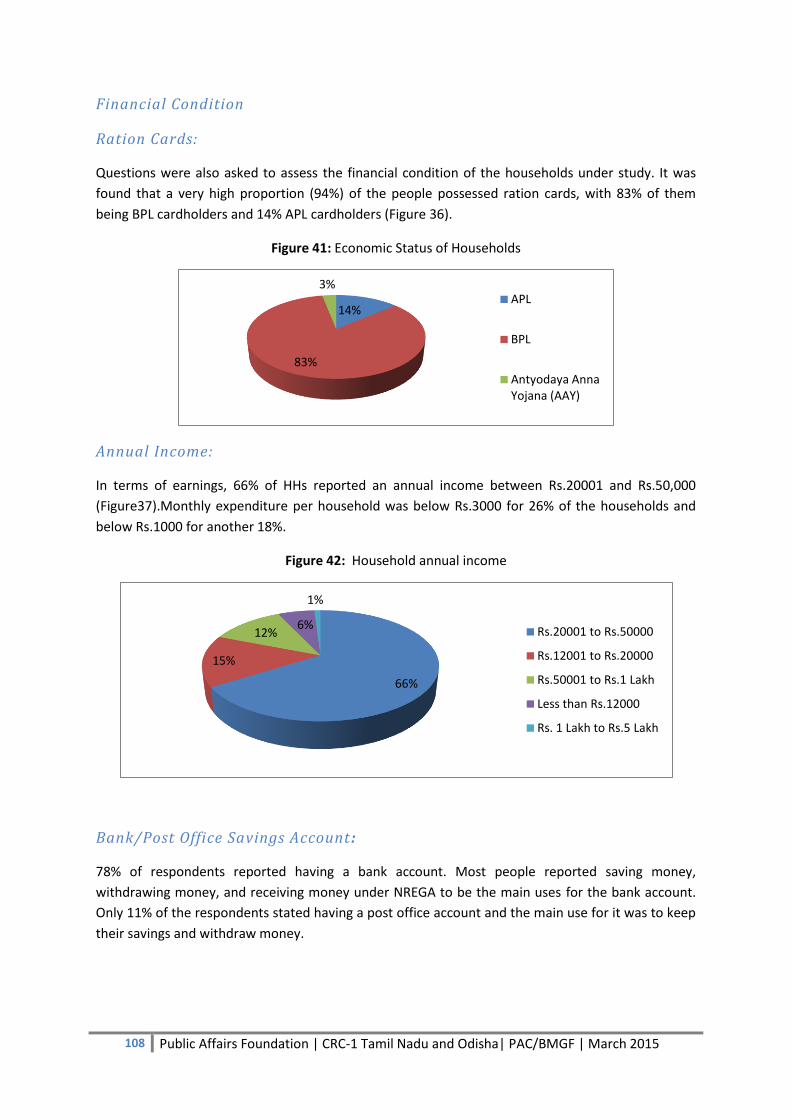
108 Public Affairs Foundation | CRC-1 Tamil Nadu and Odisha| PAC/BMGF | March 2015
Financial Condition
Ration Cards:
Questions were also asked to assess the financial condition of the households under study. It was
found that a very high proportion (94%) of the people possessed ration cards, with 83% of them
being BPL cardholders and 14% APL cardholders (Figure 36).
Figure 41: Economic Status of Households
Annual Income:
In terms of earnings, 66% of HHs reported an annual income between Rs.20001 and Rs.50,000
(Figure37).Monthly expenditure per household was below Rs.3000 for 26% of the households and
below Rs.1000 for another 18%.
Figure 42: Household annual income
Bank/Post Office Savings Account :
78% of respondents reported having a bank account. Most people reported saving money,
withdrawing money, and receiving money under NREGA to be the main uses for the bank account.
Only 11% of the respondents stated having a post office account and the main use for it was to keep
their savings and withdraw money.
14%
83%
3% APL
BPL
Antyodaya Anna Yojana (AAY)
66%
15%
12% 6%
1%
Rs.20001 to Rs.50000
Rs.12001 to Rs.20000
Rs.50001 to Rs.1 Lakh
Less than Rs.12000
Rs. 1 Lakh to Rs.5 Lakh
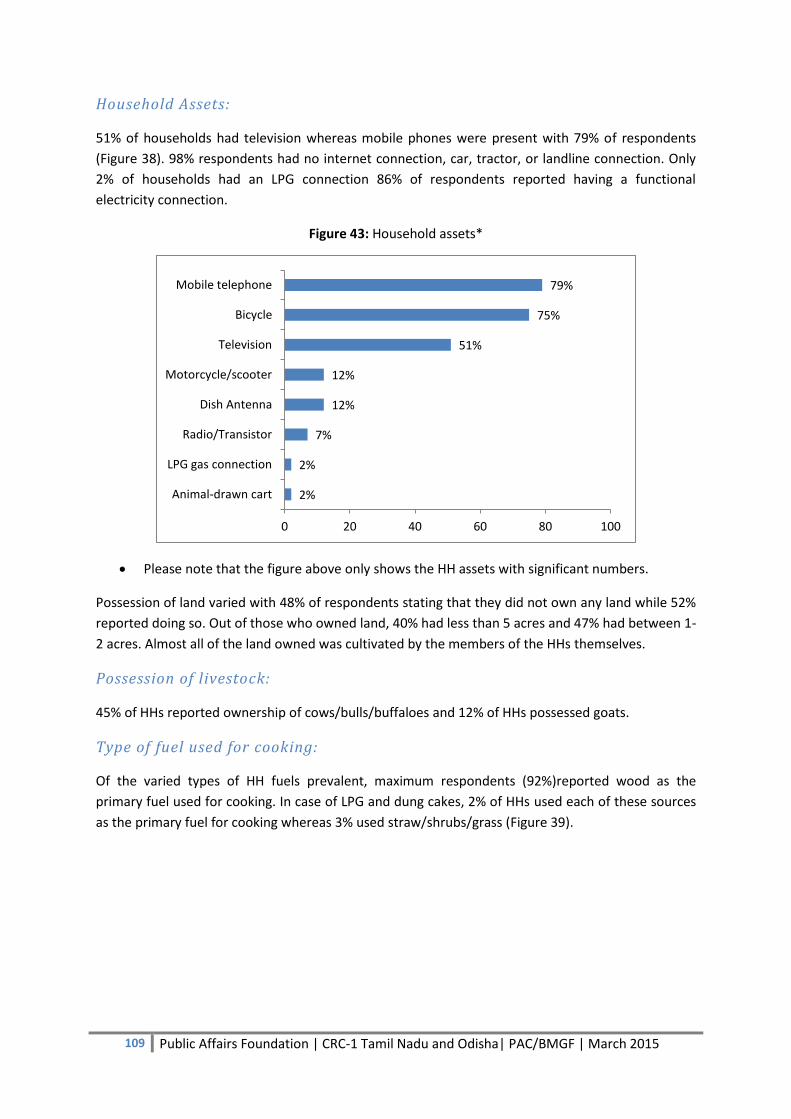
109 Public Affairs Foundation | CRC-1 Tamil Nadu and Odisha| PAC/BMGF | March 2015
Household Assets:
51% of households had television whereas mobile phones were present with 79% of respondents
(Figure 38). 98% respondents had no internet connection, car, tractor, or landline connection. Only
2% of households had an LPG connection 86% of respondents reported having a functional
electricity connection.
Figure 43: Household assets*
Please note that the figure above only shows the HH assets with significant numbers.
Possession of land varied with 48% of respondents stating that they did not own any land while 52%
reported doing so. Out of those who owned land, 40% had less than 5 acres and 47% had between 1-
2 acres. Almost all of the land owned was cultivated by the members of the HHs themselves.
Possession of livestock:
45% of HHs reported ownership of cows/bulls/buffaloes and 12% of HHs possessed goats.
Type of fuel used for cooking:
Of the varied types of HH fuels prevalent, maximum respondents (92%)reported wood as the
primary fuel used for cooking. In case of LPG and dung cakes, 2% of HHs used each of these sources
as the primary fuel for cooking whereas 3% used straw/shrubs/grass (Figure 39).
2%
2%
7%
12%
12%
51%
75%
79%
0 20 40 60 80 100
Animal-drawn cart
LPG gas connection
Radio/Transistor
Dish Antenna
Motorcycle/scooter
Television
Bicycle
Mobile telephone
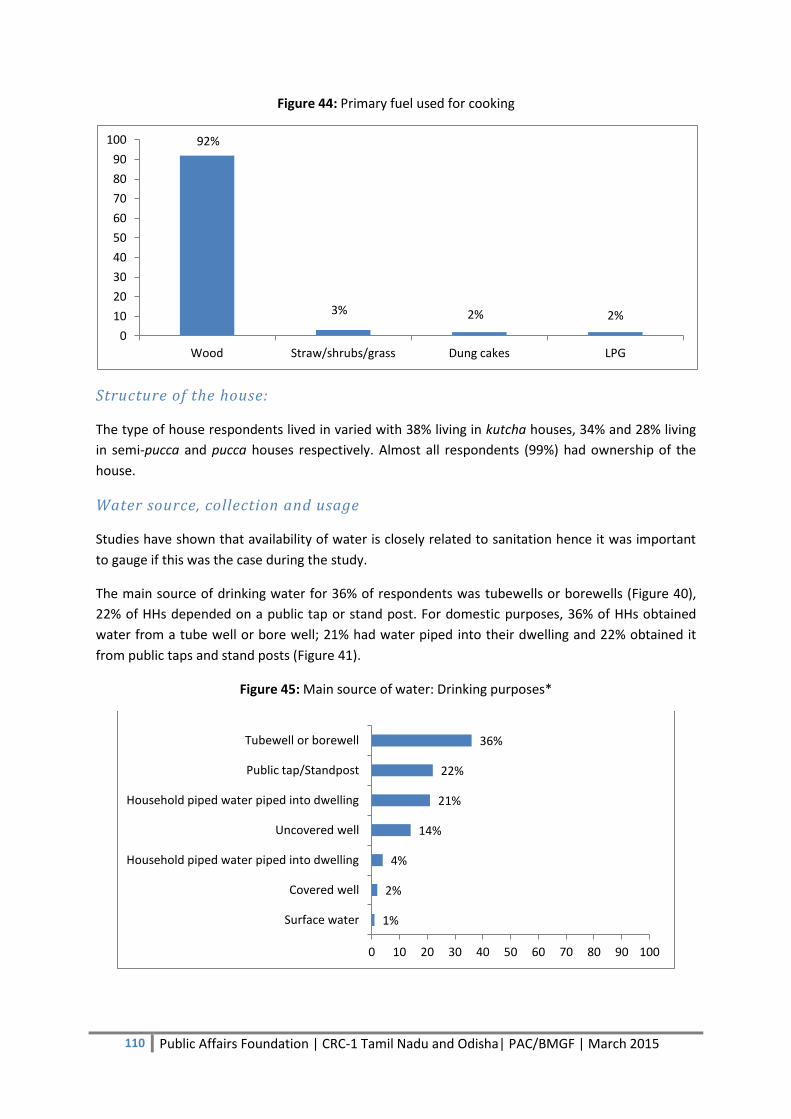
110 Public Affairs Foundation | CRC-1 Tamil Nadu and Odisha| PAC/BMGF | March 2015
Figure 44: Primary fuel used for cooking
Structure of the house:
The type of house respondents lived in varied with 38% living in kutcha houses, 34% and 28% living
in semi-pucca and pucca houses respectively. Almost all respondents (99%) had ownership of the
house.
Water source, collection and usage
Studies have shown that availability of water is closely related to sanitation hence it was important
to gauge if this was the case during the study.
The main source of drinking water for 36% of respondents was tubewells or borewells (Figure 40),
22% of HHs depended on a public tap or stand post. For domestic purposes, 36% of HHs obtained
water from a tube well or bore well; 21% had water piped into their dwelling and 22% obtained it
from public taps and stand posts (Figure 41).
Figure 45: Main source of water: Drinking purposes*
92%
3% 2% 2%
0
10
20
30
40
50
60
70
80
90
100
Wood Straw/shrubs/grass Dung cakes LPG
1%
2%
4%
14%
21%
22%
36%
0 10 20 30 40 50 60 70 80 90 100
Surface water
Covered well
Household piped water piped into dwelling
Uncovered well
Household piped water piped into dwelling
Public tap/Standpost
Tubewell or borewell
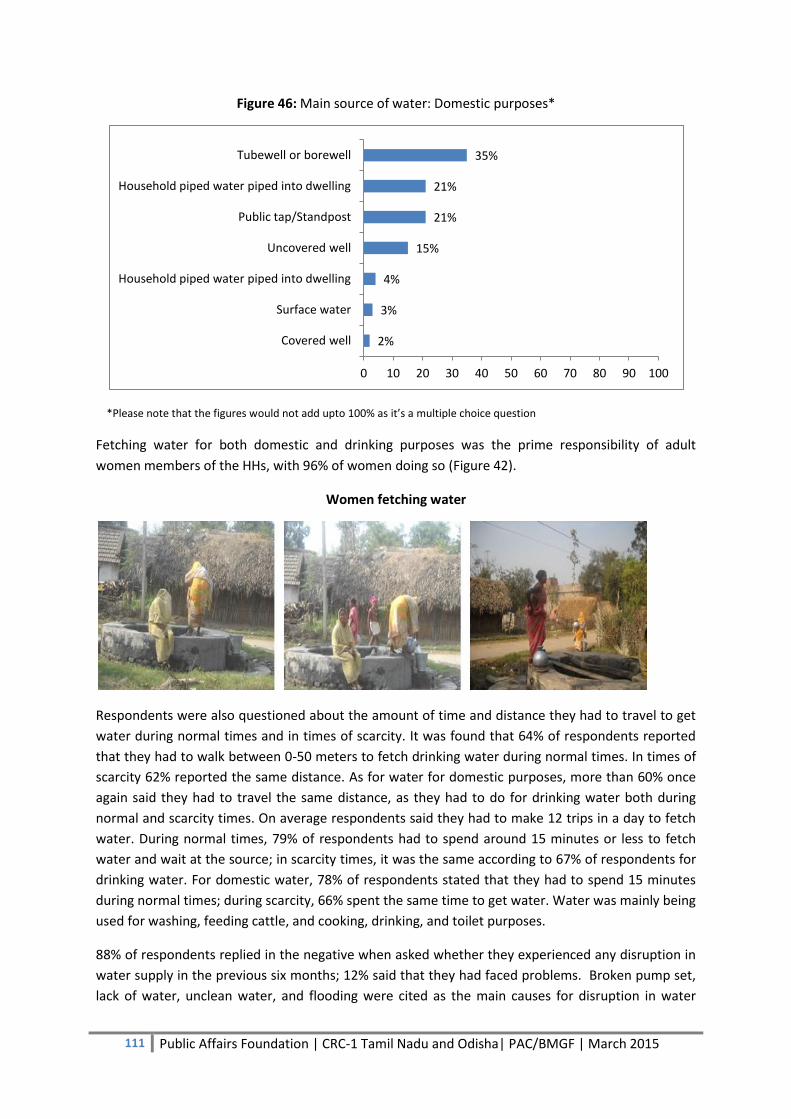
111 Public Affairs Foundation | CRC-1 Tamil Nadu and Odisha| PAC/BMGF | March 2015
Figure 46: Main source of water: Domestic purposes*
*Please note that the figures would not add upto 100% as it’s a multiple choice question
Fetching water for both domestic and drinking purposes was the prime responsibility of adult
women members of the HHs, with 96% of women doing so (Figure 42).
Women fetching water
Respondents were also questioned about the amount of time and distance they had to travel to get
water during normal times and in times of scarcity. It was found that 64% of respondents reported
that they had to walk between 0-50 meters to fetch drinking water during normal times. In times of
scarcity 62% reported the same distance. As for water for domestic purposes, more than 60% once
again said they had to travel the same distance, as they had to do for drinking water both during
normal and scarcity times. On average respondents said they had to make 12 trips in a day to fetch
water. During normal times, 79% of respondents had to spend around 15 minutes or less to fetch
water and wait at the source; in scarcity times, it was the same according to 67% of respondents for
drinking water. For domestic water, 78% of respondents stated that they had to spend 15 minutes
during normal times; during scarcity, 66% spent the same time to get water. Water was mainly being
used for washing, feeding cattle, and cooking, drinking, and toilet purposes.
88% of respondents replied in the negative when asked whether they experienced any disruption in
water supply in the previous six months; 12% said that they had faced problems. Broken pump set,
lack of water, unclean water, and flooding were cited as the main causes for disruption in water
2%
3%
4%
15%
21%
21%
35%
0 10 20 30 40 50 60 70 80 90 100
Covered well
Surface water
Household piped water piped into dwelling
Uncovered well
Public tap/Standpost
Household piped water piped into dwelling
Tubewell or borewell

112 Public Affairs Foundation | CRC-1 Tamil Nadu and Odisha| PAC/BMGF | March 2015
supply. When the water supply was disrupted, 67% relied on a common well for water, 14% got it
from other sources, 12% got water from a neighbour, and 11% got it from a pond.
2. Awareness on sanitation
Main sources of information on NBA:
In the villages covered, the main sources of information on the toilet construction process under
NBA were NGOs according to 34% respondents followed by GP officials (33%) and GP members
(21%) (Figure 42). Swachchata Doots, health workers, SHG members reached a very small proportion
of people.
Figure 47: Sources of information on toilet construction
Media used for informing people on NBA:
According to 86% of respondents, the most common medium to inform people about the various
provisions under NBA were house to house visits made by GP members and officials. Usage of media
such as wall paintings and posters was also cited as sources of information, while use of television,
handbills, street plays, school rallies, announcements from vehicles, films and radio was negligible. It
is to be noted here that the level of visibility in terms of pictorial representation of issues related to
toilet construction and use was far lesser in Odisha as compared to Tamil Nadu. The various
paintings such as the one in Figure 43 were mainly concentrated in offices related to sanitation.
34% 33%
21%
8% 3%
0
10
20
30
40
50
60
70
80
90
100
NGOs Gram Panchayat officials
Gram Panchayat members
Anganwadi staff ASHA worker
PER
CEN
T
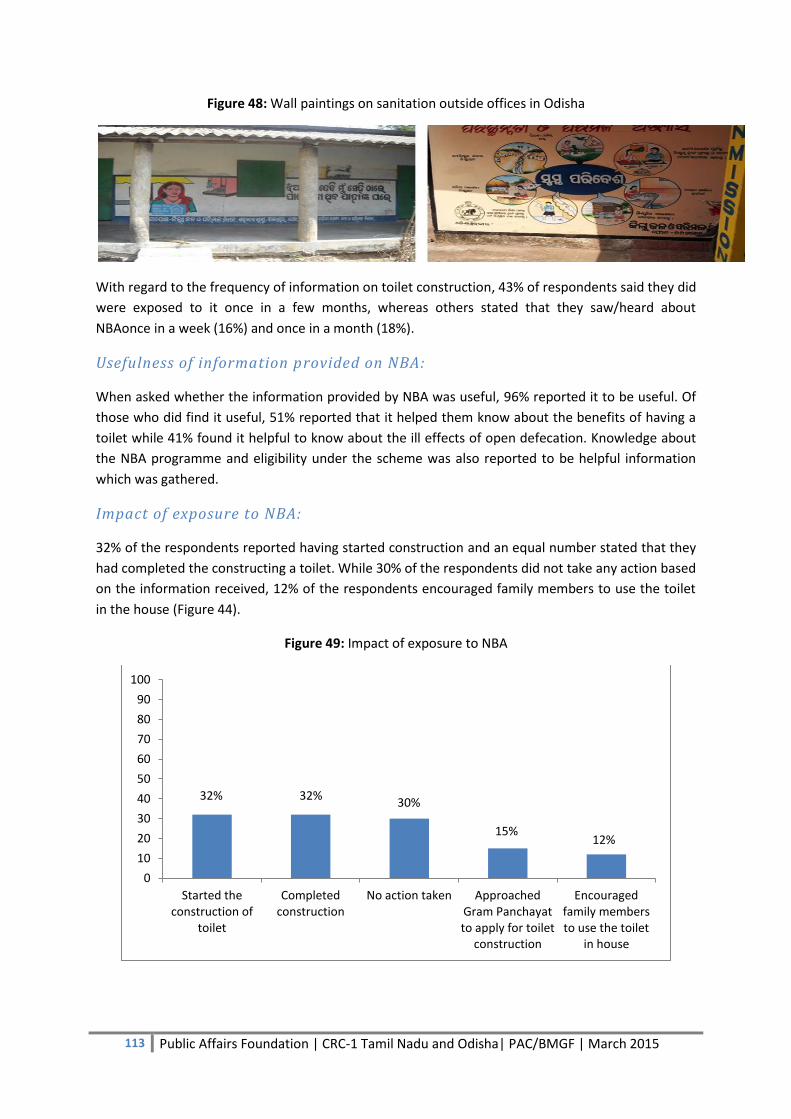
113 Public Affairs Foundation | CRC-1 Tamil Nadu and Odisha| PAC/BMGF | March 2015
Figure 48: Wall paintings on sanitation outside offices in Odisha
With regard to the frequency of information on toilet construction, 43% of respondents said they did
were exposed to it once in a few months, whereas others stated that they saw/heard about
NBAonce in a week (16%) and once in a month (18%).
Usefulness of information provided on NBA:
When asked whether the information provided by NBA was useful, 96% reported it to be useful. Of
those who did find it useful, 51% reported that it helped them know about the benefits of having a
toilet while 41% found it helpful to know about the ill effects of open defecation. Knowledge about
the NBA programme and eligibility under the scheme was also reported to be helpful information
which was gathered.
Impact of exposure to NBA:
32% of the respondents reported having started construction and an equal number stated that they
had completed the constructing a toilet. While 30% of the respondents did not take any action based
on the information received, 12% of the respondents encouraged family members to use the toilet
in the house (Figure 44).
Figure 49: Impact of exposure to NBA
32% 32% 30%
15% 12%
0
10
20
30
40
50
60
70
80
90
100
Started the construction of
toilet
Completed construction
No action taken Approached Gram Panchayat to apply for toilet
construction
Encouraged family members to use the toilet
in house
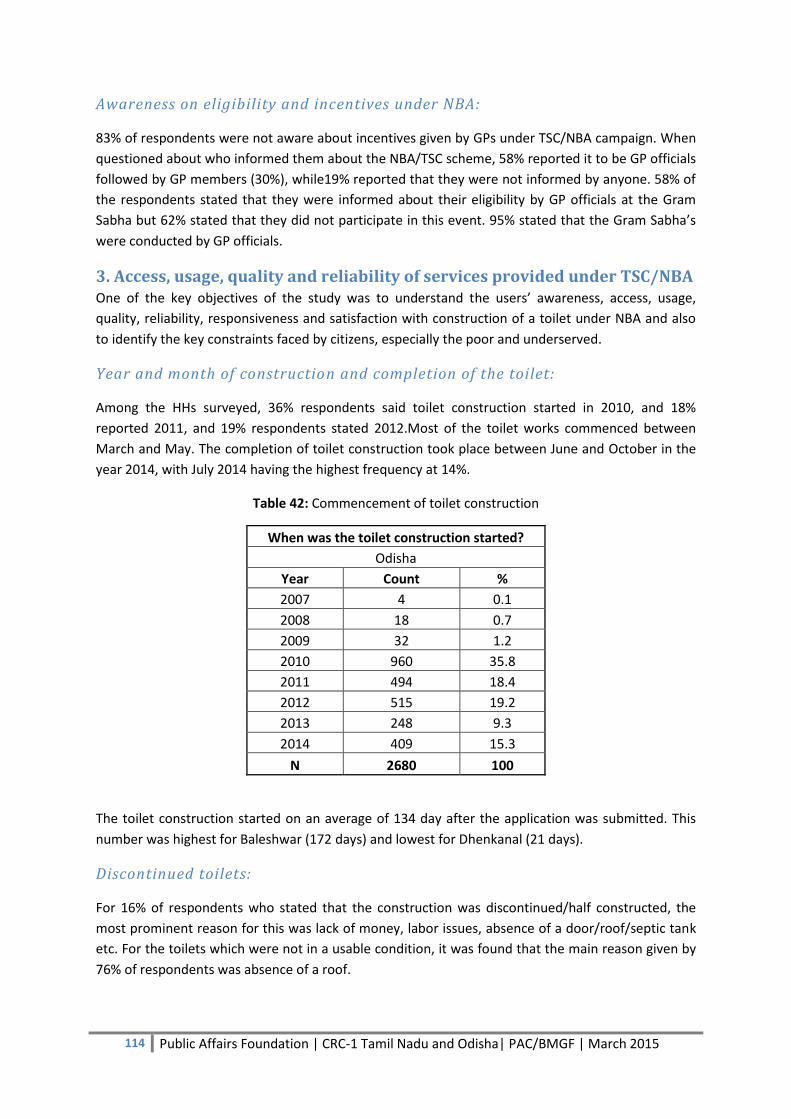
114 Public Affairs Foundation | CRC-1 Tamil Nadu and Odisha| PAC/BMGF | March 2015
Awareness on eligibility and incentives under NBA:
83% of respondents were not aware about incentives given by GPs under TSC/NBA campaign. When
questioned about who informed them about the NBA/TSC scheme, 58% reported it to be GP officials
followed by GP members (30%), while19% reported that they were not informed by anyone. 58% of
the respondents stated that they were informed about their eligibility by GP officials at the Gram
Sabha but 62% stated that they did not participate in this event. 95% stated that the Gram Sabha’s
were conducted by GP officials.
3. Access, usage, quality and reliability of services provided under TSC/NBA One of the key objectives of the study was to understand the users’ awareness, access, usage,
quality, reliability, responsiveness and satisfaction with construction of a toilet under NBA and also
to identify the key constraints faced by citizens, especially the poor and underserved.
Year and month of construction and completion of the toilet:
Among the HHs surveyed, 36% respondents said toilet construction started in 2010, and 18%
reported 2011, and 19% respondents stated 2012.Most of the toilet works commenced between
March and May. The completion of toilet construction took place between June and October in the
year 2014, with July 2014 having the highest frequency at 14%.
Table 42: Commencement of toilet construction
When was the toilet construction started?
Odisha
Year Count %
2007 4 0.1
2008 18 0.7
2009 32 1.2
2010 960 35.8
2011 494 18.4
2012 515 19.2
2013 248 9.3
2014 409 15.3
N 2680 100
The toilet construction started on an average of 134 day after the application was submitted. This
number was highest for Baleshwar (172 days) and lowest for Dhenkanal (21 days).
Discontinued toilets:
For 16% of respondents who stated that the construction was discontinued/half constructed, the
most prominent reason for this was lack of money, labor issues, absence of a door/roof/septic tank
etc. For the toilets which were not in a usable condition, it was found that the main reason given by
76% of respondents was absence of a roof.
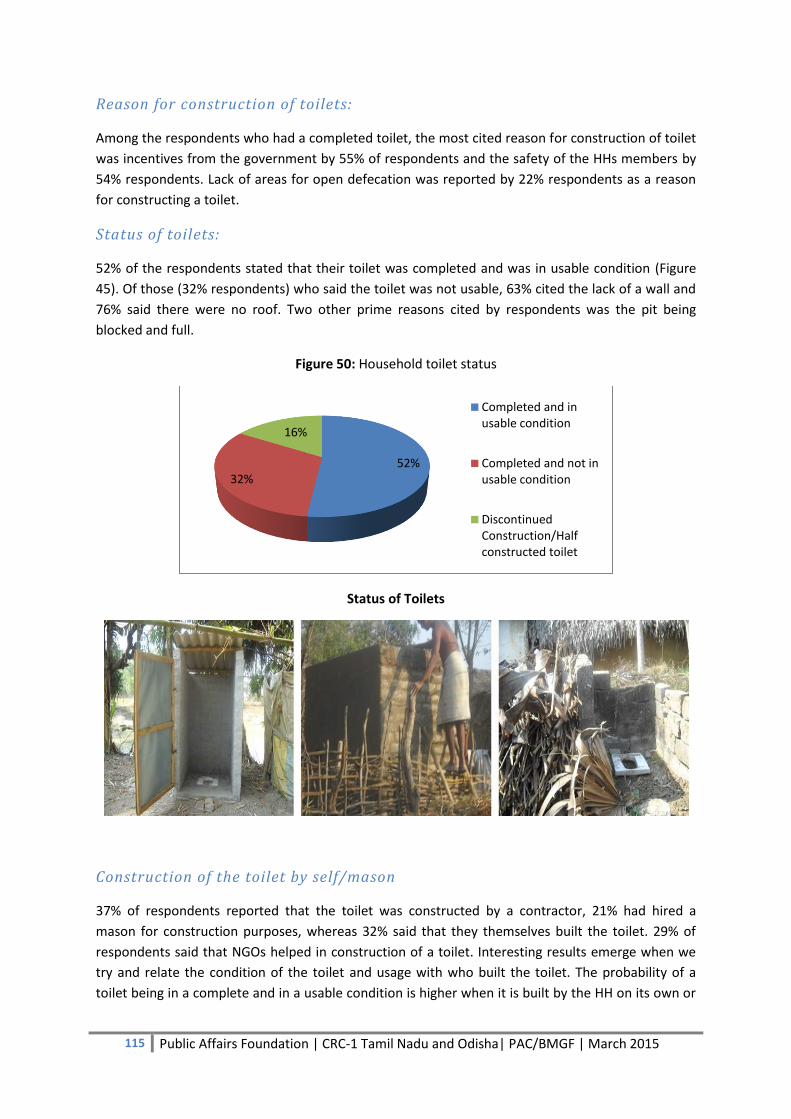
115 Public Affairs Foundation | CRC-1 Tamil Nadu and Odisha| PAC/BMGF | March 2015
Reason for construction of toilets:
Among the respondents who had a completed toilet, the most cited reason for construction of toilet
was incentives from the government by 55% of respondents and the safety of the HHs members by
54% respondents. Lack of areas for open defecation was reported by 22% respondents as a reason
for constructing a toilet.
Status of toilets:
52% of the respondents stated that their toilet was completed and was in usable condition (Figure
45). Of those (32% respondents) who said the toilet was not usable, 63% cited the lack of a wall and
76% said there were no roof. Two other prime reasons cited by respondents was the pit being
blocked and full.
Figure 50: Household toilet status
Status of Toilets
Construction of the toilet by self/mason
37% of respondents reported that the toilet was constructed by a contractor, 21% had hired a
mason for construction purposes, whereas 32% said that they themselves built the toilet. 29% of
respondents said that NGOs helped in construction of a toilet. Interesting results emerge when we
try and relate the condition of the toilet and usage with who built the toilet. The probability of a
toilet being in a complete and in a usable condition is higher when it is built by the HH on its own or
52% 32%
16%
Completed and in usable condition
Completed and not in usable condition
Discontinued Construction/Half constructed toilet

116 Public Affairs Foundation | CRC-1 Tamil Nadu and Odisha| PAC/BMGF | March 2015
by a mason who has been hired by them as compared to toilets built by the NGOs/Contractors
without involving HHs (Table 38).
Table 43: Construction vs Condition of Toilet
Who Built the Toilet
Condition of the Toilet Self/Mason Hired
By Self NGO/Contractor
Completed and in usable
condition 77% 40%
Completed and not in
usable condition 7% 45%
Discontinued
Construction/Half
constructed toilet
16% 15%
Total (n=895) (n=1751)
A similar pattern can be observed when we try to relate toilet usage with who got the toilet
constructed. Figure 46 shows that in Cuttack where toilets have been constructed by beneficiaries
themselves or by masons hired by them, toilet usage by HHs members is also high. However, Angul
is an exception where, although toilets have not been constructed by beneficiaries themselves,
usage is highest compared to the other districts.
Figure 51: Usage vs who built the toilet
45%
7%
90%
12%
41%
8%
34%
89%
50%
77%
30%
55%
5%
51%
%
10%
20%
30%
40%
50%
60%
70%
80%
90%
100%
Angul Baleshwar Cuttack Dhenkanal Ganjam Sambalpur Odisha
Self/Mason Hired By Us Yes, all members use all the time
117 Public Affairs Foundation | CRC-1 Tamil Nadu and Odisha| PAC/BMGF | March 2015
Application process under NBA:
69% of respondents stated that they had neither filled out an application nor written a letter to
receive the incentive amount under NBA. 21% (N=555) of respondents who had filled out an
application, 75% (N=418) stated that they obtained the application at the GP office. 44% stated that
they had to travel between 1-3 kilometers to the GP office in their village to apply for a toilet
whereas 58% of applicants never had to visit the GP office and another 13% had to visit the office
once. For 39% (N=1051) of respondents an NGO representative filled out the application form for
them. Applicants who had filled up an application form, 71% (N=1890) of these applicants said that
the application was not easy to fill. Difficulty in comprehending the applications was cited by 36% of
respondents and 56% said they did not have enough information about the application procedure.
Construction materials:
For 40% and 36% respondents the materials were arranged by themselves and the contractor
respectively and another 31% stated it was done by an NGO. 55% said that they had no help in
arranging the materials.
Rural Sanitary Mart (RSM):
88% (N=2358) of respondents had not heard of a Rural Sanitary Mart (RSM). 12% (N=322) of people
who heard about the RSM said that the nearest RSM was 10 km from their house. 25% (N=240) of
respondents had bought some item from there.
Design of the toilets and ease of use
According to 53% of respondents the design of the toilet built was easy to use and maintain; 47%
said it was not so. 76% of respondents (N=1271) who were not happy with the design cited the lack
of a roof as the reason whereas 48% cited absence of walls as another reason.

118 Public Affairs Foundation | CRC-1 Tamil Nadu and Odisha| PAC/BMGF | March 2015
Reasons for dissatisfaction with the design of the toilet:
Documents submitted by beneficiaries while applying for NBA:
Ration card 49%
Voter ID cards 60%
NREGA job card 10%
Bank account number 9%
Photographs of the construction process 84%
Incentives under NBA:
In Odisha the total incentive provided for an Individual HHs Latrine from June 2011 was Rs.3500 with
the beneficiary contribution being Rs.300. However in 2012 the amount was revised to Rs.10,000
where the beneficiary contribution was Rs.900 (For further details on the breakup please refer to
Table 39).28
Table 44: Unit Cost of IHHL in Odisha (Rupees)
Month of effect Government of
India Share
Government of
Odisha Share
Beneficiary
Contribution Total Amount
December 1999 375 125 125 625
April 2006 900 300 300 1500
August 2008 1500 700 300 2500
June 2011 2200 1000 300 3500
April 2012 3200 1400 900 5500
28
http://www.rdodisha.in/download/Annual_Report_2011-12.pdf
Lack of walls Lack of a door
Low walls No space

119 Public Affairs Foundation | CRC-1 Tamil Nadu and Odisha| PAC/BMGF | March 2015
In the HHs surveyed it was found that 65% of respondents did not know how much they were
entitled to as incentives and only 12% were aware of this amount. In Odisha 68% of toilets were
constructed by NGOs, contractors and by other sources and incentives were received by them;
hence the level of awareness about the incentive amount is less especially in Angul, Baleshwar and
Ganjam where the construction process is dominated by contractors.
Total cost and extra expenses incurred by beneficiaries for toilet construction:
51% said they spent more than the incentive amount they received under NBA for toilet
construction. Table 40 shows that Ganjam stands out, as the expenses incurred by a household in
terms of extra money spent is at Rs. 11,506 which is high compared to the other districts. Angul and
Cuttack also show similar patterns (Table 41). The total cost incurred by a HH in Ganjam for toilet
construction is at Rs. 13,590 which is higher than the rest of the districts.
Table 45: Extra money and total money spent on toilet construction
How much extra did you spend (Rupees)? What was the total cost of the toilet?
(Rupees)
District N Mean Median N Mean Median
Angul 333 9965 10000 365 13860 13000
Baleshwar 72 2306 1000 124 4150 2600
Cuttack 356 8580 6000 440 12885 14000
Dhenkanal 151 3296 800 444 2189 0
Ganjam 333 11506 10000 339 13590 10000
Sambalpur 50 2468 500 188 4090 3200
Odisha 1295 8488 6000 1900 9258 8000
When we examine the six districts together it was found that on an average HHs had to spend
Rs.8488 extra on toilet construction than the incentive for which they were eligible. As for the total
cost which was incurred by HHs on toilet construction it seen that on average HHs had to spend
Rs.9258.
Borrowing money for toilet construction
76% of respondents stated that they did not borrow money for toilet construction. Out of 24%
(N=646) respondents who borrowed money for toilet construction, 58% (N=375) did so from
relatives and friends. Only 49% were able to partially repay the loan.
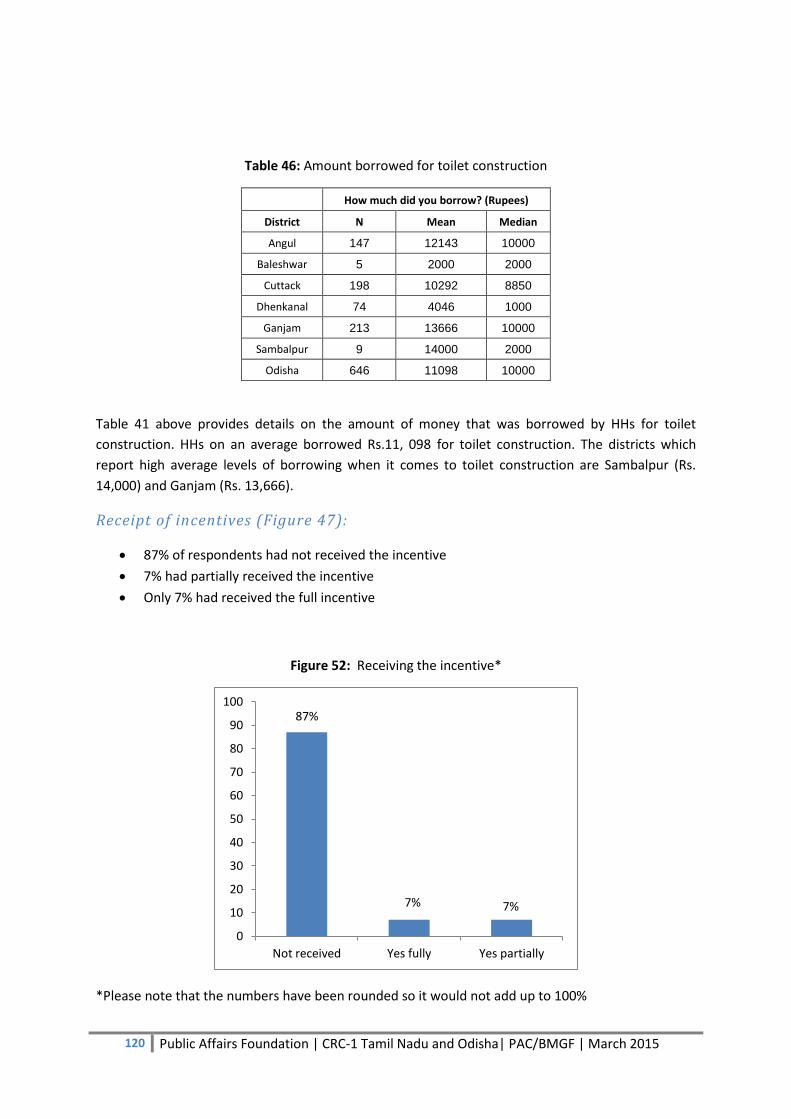
120 Public Affairs Foundation | CRC-1 Tamil Nadu and Odisha| PAC/BMGF | March 2015
Table 46: Amount borrowed for toilet construction
How much did you borrow? (Rupees)
District N Mean Median
Angul 147 12143 10000
Baleshwar 5 2000 2000
Cuttack 198 10292 8850
Dhenkanal 74 4046 1000
Ganjam 213 13666 10000
Sambalpur 9 14000 2000
Odisha 646 11098 10000
Table 41 above provides details on the amount of money that was borrowed by HHs for toilet
construction. HHs on an average borrowed Rs.11, 098 for toilet construction. The districts which
report high average levels of borrowing when it comes to toilet construction are Sambalpur (Rs.
14,000) and Ganjam (Rs. 13,666).
Receipt of incentives (Figure 47):
87% of respondents had not received the incentive
7% had partially received the incentive
Only 7% had received the full incentive
Figure 52: Receiving the incentive*
*Please note that the numbers have been rounded so it would not add up to 100%
87%
7% 7%
0
10
20
30
40
50
60
70
80
90
100
Not received Yes fully Yes partially
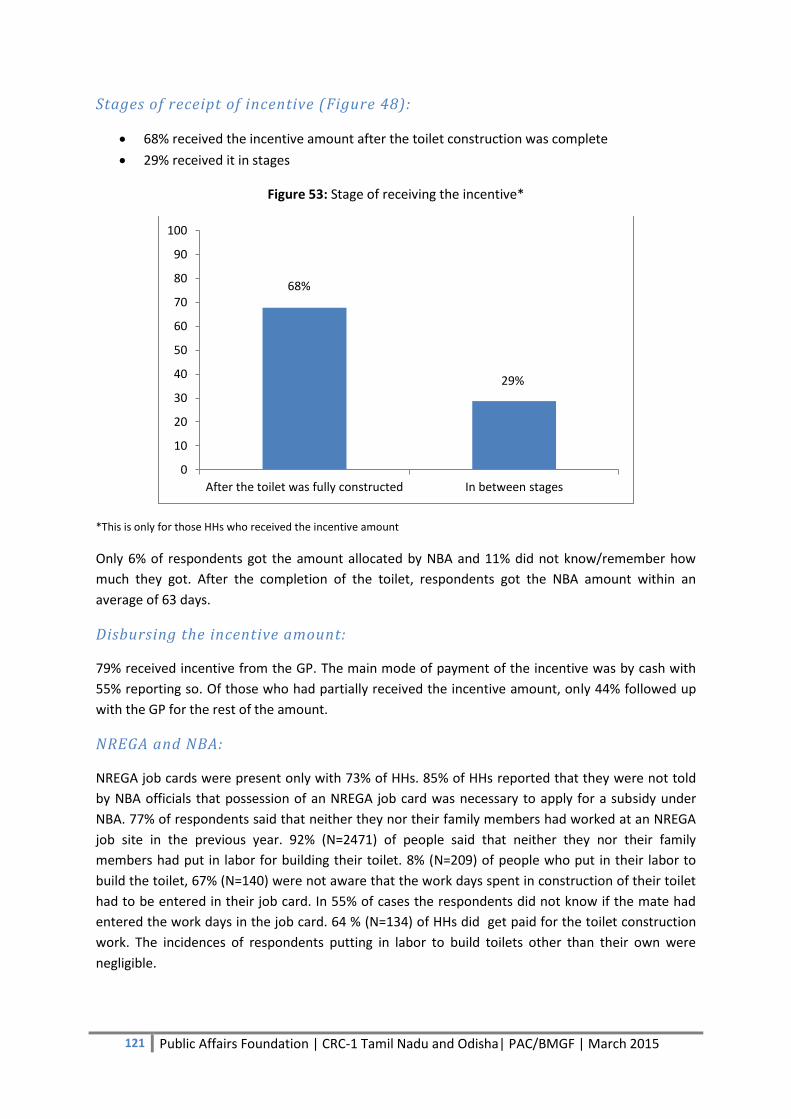
121 Public Affairs Foundation | CRC-1 Tamil Nadu and Odisha| PAC/BMGF | March 2015
Stages of receipt of incentive (Figure 48):
68% received the incentive amount after the toilet construction was complete
29% received it in stages
Figure 53: Stage of receiving the incentive*
*This is only for those HHs who received the incentive amount
Only 6% of respondents got the amount allocated by NBA and 11% did not know/remember how
much they got. After the completion of the toilet, respondents got the NBA amount within an
average of 63 days.
Disbursing the incentive amount:
79% received incentive from the GP. The main mode of payment of the incentive was by cash with
55% reporting so. Of those who had partially received the incentive amount, only 44% followed up
with the GP for the rest of the amount.
NREGA and NBA:
NREGA job cards were present only with 73% of HHs. 85% of HHs reported that they were not told
by NBA officials that possession of an NREGA job card was necessary to apply for a subsidy under
NBA. 77% of respondents said that neither they nor their family members had worked at an NREGA
job site in the previous year. 92% (N=2471) of people said that neither they nor their family
members had put in labor for building their toilet. 8% (N=209) of people who put in their labor to
build the toilet, 67% (N=140) were not aware that the work days spent in construction of their toilet
had to be entered in their job card. In 55% of cases the respondents did not know if the mate had
entered the work days in the job card. 64 % (N=134) of HHs did get paid for the toilet construction
work. The incidences of respondents putting in labor to build toilets other than their own were
negligible.
68%
29%
0
10
20
30
40
50
60
70
80
90
100
After the toilet was fully constructed In between stages
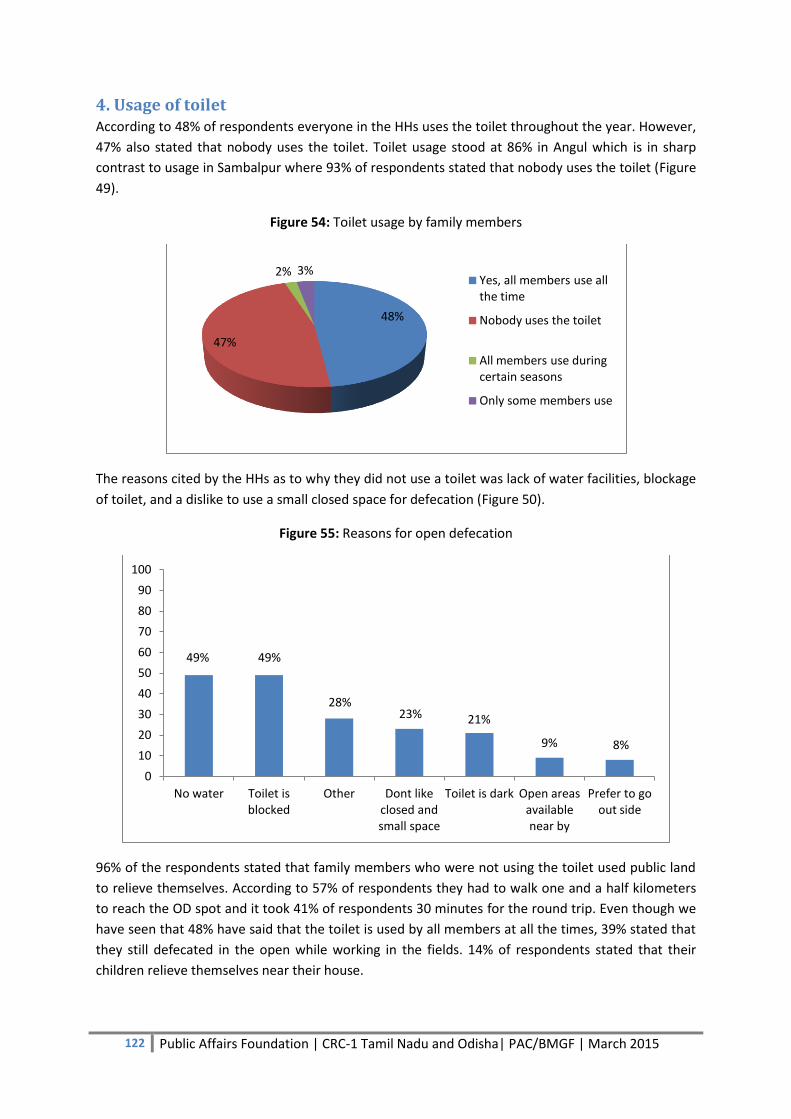
122 Public Affairs Foundation | CRC-1 Tamil Nadu and Odisha| PAC/BMGF | March 2015
4. Usage of toilet According to 48% of respondents everyone in the HHs uses the toilet throughout the year. However,
47% also stated that nobody uses the toilet. Toilet usage stood at 86% in Angul which is in sharp
contrast to usage in Sambalpur where 93% of respondents stated that nobody uses the toilet (Figure
49).
Figure 54: Toilet usage by family members
The reasons cited by the HHs as to why they did not use a toilet was lack of water facilities, blockage
of toilet, and a dislike to use a small closed space for defecation (Figure 50).
Figure 55: Reasons for open defecation
96% of the respondents stated that family members who were not using the toilet used public land
to relieve themselves. According to 57% of respondents they had to walk one and a half kilometers
to reach the OD spot and it took 41% of respondents 30 minutes for the round trip. Even though we
have seen that 48% have said that the toilet is used by all members at all the times, 39% stated that
they still defecated in the open while working in the fields. 14% of respondents stated that their
children relieve themselves near their house.
48%
47%
2% 3% Yes, all members use all the time
Nobody uses the toilet
All members use during certain seasons
Only some members use
49% 49%
28% 23% 21%
9% 8%
0
10
20
30
40
50
60
70
80
90
100
No water Toilet is blocked
Other Dont like closed and small space
Toilet is dark Open areas available near by
Prefer to go out side
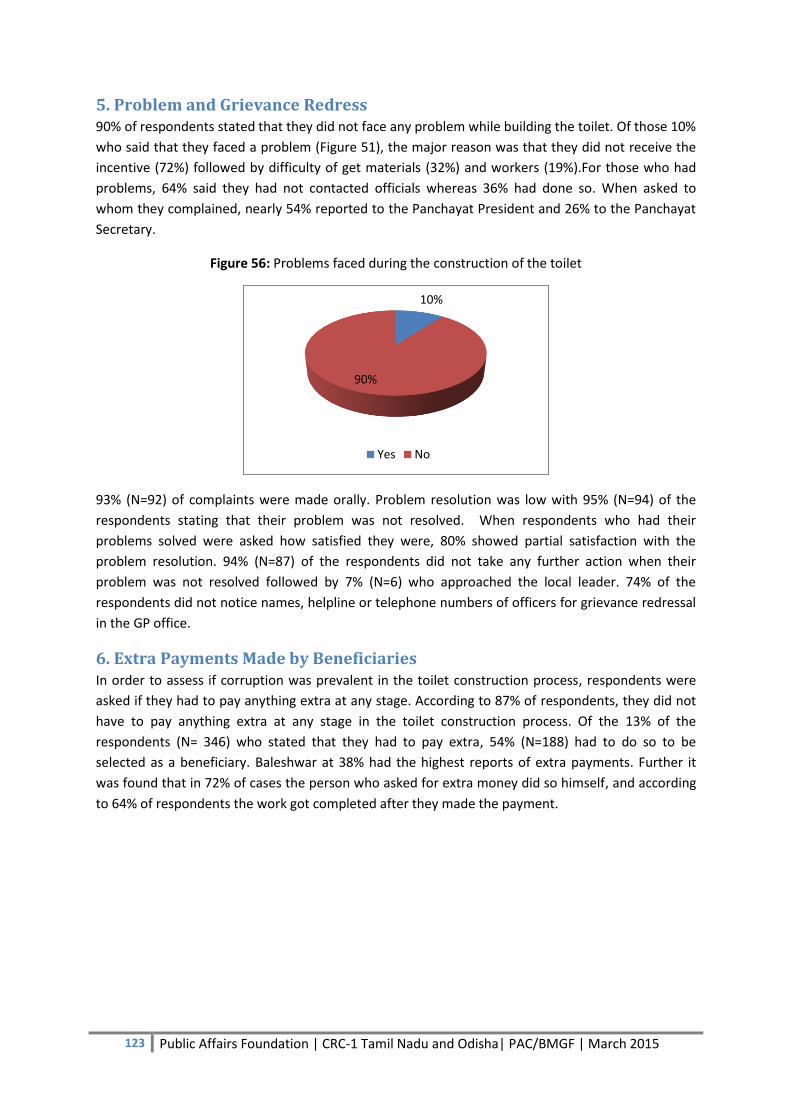
123 Public Affairs Foundation | CRC-1 Tamil Nadu and Odisha| PAC/BMGF | March 2015
5. Problem and Grievance Redress 90% of respondents stated that they did not face any problem while building the toilet. Of those 10%
who said that they faced a problem (Figure 51), the major reason was that they did not receive the
incentive (72%) followed by difficulty of get materials (32%) and workers (19%).For those who had
problems, 64% said they had not contacted officials whereas 36% had done so. When asked to
whom they complained, nearly 54% reported to the Panchayat President and 26% to the Panchayat
Secretary.
Figure 56: Problems faced during the construction of the toilet
93% (N=92) of complaints were made orally. Problem resolution was low with 95% (N=94) of the
respondents stating that their problem was not resolved. When respondents who had their
problems solved were asked how satisfied they were, 80% showed partial satisfaction with the
problem resolution. 94% (N=87) of the respondents did not take any further action when their
problem was not resolved followed by 7% (N=6) who approached the local leader. 74% of the
respondents did not notice names, helpline or telephone numbers of officers for grievance redressal
in the GP office.
6. Extra Payments Made by Beneficiaries In order to assess if corruption was prevalent in the toilet construction process, respondents were
asked if they had to pay anything extra at any stage. According to 87% of respondents, they did not
have to pay anything extra at any stage in the toilet construction process. Of the 13% of the
respondents (N= 346) who stated that they had to pay extra, 54% (N=188) had to do so to be
selected as a beneficiary. Baleshwar at 38% had the highest reports of extra payments. Further it
was found that in 72% of cases the person who asked for extra money did so himself, and according
to 64% of respondents the work got completed after they made the payment.
10%
90%
Yes No
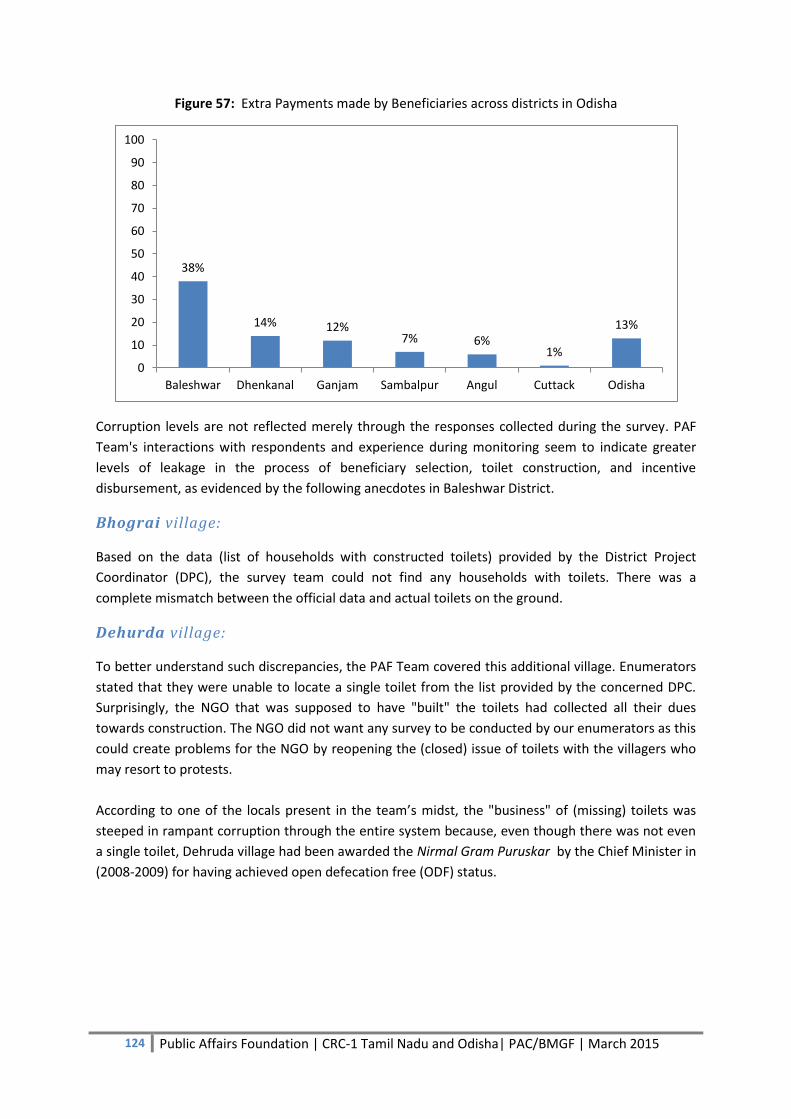
124 Public Affairs Foundation | CRC-1 Tamil Nadu and Odisha| PAC/BMGF | March 2015
Figure 57: Extra Payments made by Beneficiaries across districts in Odisha
Corruption levels are not reflected merely through the responses collected during the survey. PAF
Team's interactions with respondents and experience during monitoring seem to indicate greater
levels of leakage in the process of beneficiary selection, toilet construction, and incentive
disbursement, as evidenced by the following anecdotes in Baleshwar District.
Bhograi village:
Based on the data (list of households with constructed toilets) provided by the District Project
Coordinator (DPC), the survey team could not find any households with toilets. There was a
complete mismatch between the official data and actual toilets on the ground.
Dehurda village:
To better understand such discrepancies, the PAF Team covered this additional village. Enumerators
stated that they were unable to locate a single toilet from the list provided by the concerned DPC.
Surprisingly, the NGO that was supposed to have "built" the toilets had collected all their dues
towards construction. The NGO did not want any survey to be conducted by our enumerators as this
could create problems for the NGO by reopening the (closed) issue of toilets with the villagers who
may resort to protests.
According to one of the locals present in the team’s midst, the "business" of (missing) toilets was
steeped in rampant corruption through the entire system because, even though there was not even
a single toilet, Dehruda village had been awarded the Nirmal Gram Puruskar by the Chief Minister in
(2008-2009) for having achieved open defecation free (ODF) status.
38%
14% 12% 7% 6%
1%
13%
0
10
20
30
40
50
60
70
80
90
100
Baleshwar Dhenkanal Ganjam Sambalpur Angul Cuttack Odisha

125 Public Affairs Foundation | CRC-1 Tamil Nadu and Odisha| PAC/BMGF | March 2015
Photo showing Dehurda GP awarded the Nirmal Gram Puruskar for zero OD
Kosabakamarda Panchayat Office:
En route to Dehruda, the PAF Team spoke to an official in charge of the NREGA scheme. He said that
no toilets had been built in this area during the previous four years. According to some locals who
had by then gathered around the team, an NGO had (in the past) installed some rings in pits meant
for toilets but had left without actually building any toilets, alleging thereby that the NGO and a
Junior Engineer were "involved" in the "business" The locals rued that although sanitation is an
important issue, no actions had been taken to address the concerns of people, especially the
disabled, who continued to suffer.
Teghari village:
The Junior Engineer provided the PAF Team a list of beneficiaries who had completed toilets in this
village, adding that he had personally verified every toilet built.
This village is truly backward; it seemed as if time had stood still and that the village had missed any
form of development.

126 Public Affairs Foundation | CRC-1 Tamil Nadu and Odisha| PAC/BMGF | March 2015
Walk to Teghari village
The locals were shocked to learn that the PAF Team had come to see the toilets built and demanded
to know who had provided the "information". One of the elderly locals emphatically stated that in
all the years that he had lived in the village, not a single toilet had been built. Because of some
construction, he said people had lost access to the only open nearby space available for open
defecation, and that the poor locals always suffered, especially so during the monsoons when
drinking water gets contaminated due to OD.
Women expressed anguish at the risks they had to take to relieve themselves. They accused the
officials for misleading PAF with "false" lists of toilets and reiterated that there were absolutely no
toilets in the village. A ward member concurred with these views.
Having a conversation with villagers on the state of toilet construction in Teghhari
From these incidents, it appears that one cannot always rely upon the data provided by local
officials.

127 Public Affairs Foundation | CRC-1 Tamil Nadu and Odisha| PAC/BMGF | March 2015
7. Level of Satisfaction of respondents on the features of NBA
Respondents' level of satisfaction with various processes which were involved in building a toilet in
their house and their reactions were as follows:
Information provided about construction/incentive: 43% of respondents
across the 6 districts were not satisfied with the level of information provided on the
construction of the toilet and the eligible incentive.
Application process : The level of satisfaction and dissatisfaction among respondents
was almost equal with Dhenkanal (at 49%) reporting high levels of dissatisfaction.
Behaviour and helpfulness of the GP officials: There was a mixed response with
very little difference between people who were satisfied and dissatisfied.
Amount of subsidy: 57% of respondents expressed their dissatisfaction with the subsidy
amount and the time taken to disemburse the same.
Structural aspects of the toilets : There seemed to be a general dissatisfaction
among people with regard to the space, ventilation, design and materials used.
Figure 58: Overall satisfaction with the toilet construction process
Reasons for dissatisfaction:
The main reasons cited by the respondents for not being satisfied with the toilet construction
process were absence of roof/ walls/lack of money.
Suggestions for improvement:
Most respondents could not come up with suggestions for improvement. On what could make the
application process smoother some respondents suggested making the whole process quick or
provision of a door, quicker release of the incentive amount, increase in the incentive amount and
having an attached bathroom.
58%
7%
79%
25%
59%
7%
39%
23%
62%
12%
64%
39%
76%
46%
0
10
20
30
40
50
60
70
80
90
100
Angul Baleshwar Cuttack Dhenkanal Ganjam Sambalpur Odisha
Satisfied
Dissatisfied

128 Public Affairs Foundation | CRC-1 Tamil Nadu and Odisha| PAC/BMGF | March 2015
Comments received by PAF’s monitoring team
In Arakhpur GP one respondent was very dissatisfied with the toilet constructed by an NGO because:
The toilet did not have any walls
No privacy
The toilet quality was poor
The toilet constructed had been destroyed by cyclone Phalin
Her neighbours toilet also did not have walls and was hardly being used
Enumerator conducting an interview with a respondent in Arakhpur GP
Unused toilets in Arakhpur destroyed by Phailin
8. Household attitude and behaviour towards toilet construction and usage
The focus of this section is on attitudes and behaviour of respondents towards toilets. In general, the
questions were aimed at capturing their perception on toilet construction and usage, attitudes
towards responsibilities related to sanitation and the relationship between toilet usage and health.
All respondents across the six districts Odisha acknowledged the need of a toilet for a HH and that
the prime responsibility for its construction lies with the HH as opposed to GP. People recognized
the importance of toilets when 89% of respondents disagreed with the statement that toilets and
health are not related issues. Despite such high numbers in favour of toilet construction, 71% of
respondents stated that toilet construction is of least priority for a HH when it came to spending
money. Another contrasting opinion of people was when they stated that if it is alright for children
129 Public Affairs Foundation | CRC-1 Tamil Nadu and Odisha| PAC/BMGF | March 2015
to defecate in and around the house by 86% of respondents. 93% respondents in all districts
disagreed with the statement that girls and women in the HHs do not require a toilet; 93% of HHs
were of the opinion that boys, men and elders in a HH equally needed access to a toilet.
9. Observation of the toilet In order to determine the condition of toilets which were reported as complete by the respondents
enumerators visited these HHs and recorded their observations.
Structural aspects of toilets:
40% of toilets had a clear path
90% of toilets were not in the same building as the house
95% of toilets were not locked and in 5% of cases where it was the key was readily available
to open them
69% of toilets did not have a visible pit
Proper ventilation was present in 56% of toilets and 77% were not dark during daytime
Electric light bulbs were absent in 86% of toilets
49% had no doors
Toilets which had doors were made of iron or asbestos sheets
Toilet floor was made of cement in 85% of toilets
52% of toilets had no roofs
The dimensions of the toilets in 53% of toilets did not meet the NBA specifications
Cleaning materials were absent in 72% of toilets
Water availability for toilet purposes:
78% toilets did not have water stored outside, 21% did
72% had no water stored inside the toilet
Taps were absent both outside and inside in 86% and 82% toilets respectively

130 Public Affairs Foundation | CRC-1 Tamil Nadu and Odisha| PAC/BMGF | March 2015
Section 5a: Findings from Officials’ interviews in Tamil Nadu
Officials at various levels (GP, Block, and District) are involved in administrating the IHHL subsidy
under NBA. A separate questionnaire was designed and administered to 381 officials (Table 42) to
understand their experience of the programme, its bottlenecks, their concerns, resolutions of the
problems and their suggestions.
Table 47: Officials' interviewed by District - Tamil Nadu
District Level
Block District GP Total
Dharmapuri 10 2 60 72
Kanyakumari 7 3 63 73
Krishnagiri 8 3 42 53
Perambalur 9 1 48 58
Tirunelveli 9 3 52 64
Tiruchirappalli 9 2 50 61
Total 52 14 315 381
During the scoping visits the team collected the organograms of NBA implementation bodies. Figure 54 shows the organization chart in Kanyakumari involving various offices:

131 Public Affairs Foundation | CRC-1 Tamil Nadu and Odisha| PAC/BMGF | March 2015
Figure 59: Organogram for Kanyakumari29
1. Beneficiary Selection:
62% of officials stated that beneficiaries were selected during the Gram Sabha meetings and
according to 45% of officials, they were chosen by house to house visits. Beneficiary selection in
Kanyakumari (at 75%) was via Gram Sabha which stands in stark contrast with Perambalur (at 60%)
where house to house visits was a more prevalent method of selecting beneficiaries.
According to 78% of officials GP President was in-charge of contacting the potential beneficiary,
whereas 38% reported SDs [SDs were highest in Tiruchirappalli with 82% (N=50) of officials stating
so]. GP members and GP officials were also seen to share this responsibility according to 37% and
34% of officials respectively.
62% of officials stated that if a citizen was interested in availing the scheme under NBA he/she
would first contact the GP President followed by the GP member (Figure 55).
29
Meeting notes District Coordinator Kanyakumari District. January 21st
, 2014
Collector
A.P.O District Coordinator
Block Panchayat BDO Village Panchayat BDO
NREGA Deputy
BDO ADW Deputy BDO
NBA Block Coordinator
Panchayat
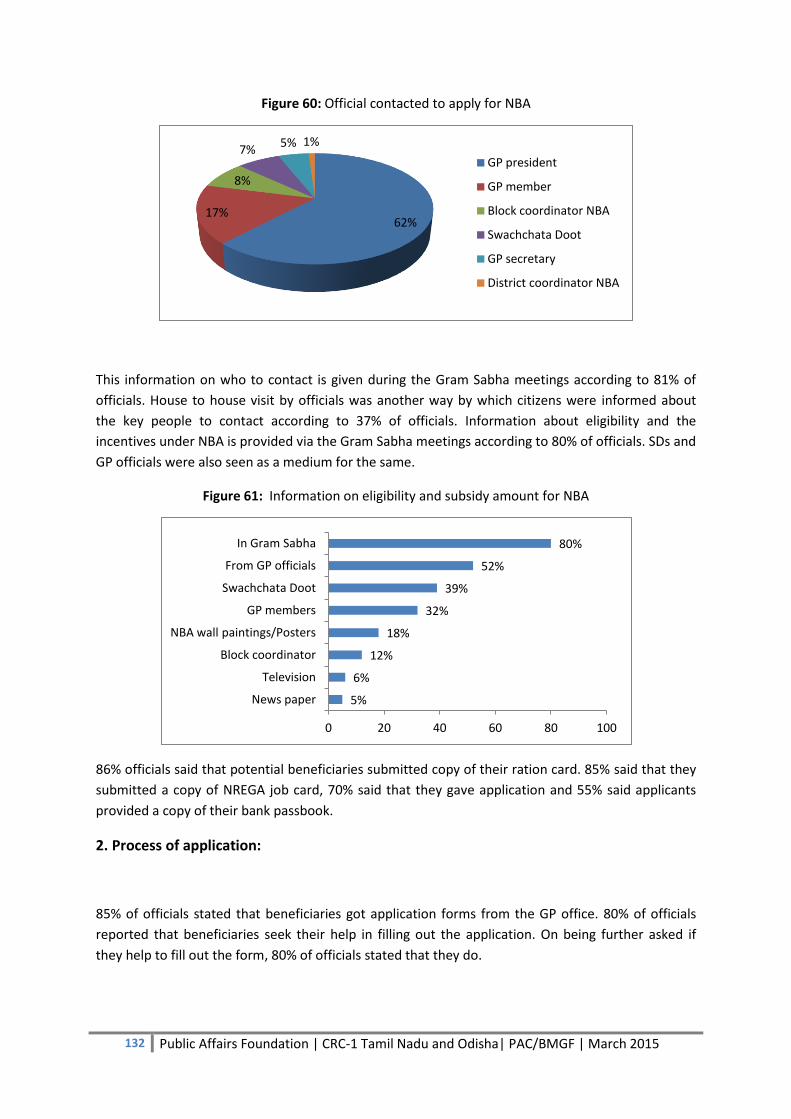
132 Public Affairs Foundation | CRC-1 Tamil Nadu and Odisha| PAC/BMGF | March 2015
Figure 60: Official contacted to apply for NBA
This information on who to contact is given during the Gram Sabha meetings according to 81% of
officials. House to house visit by officials was another way by which citizens were informed about
the key people to contact according to 37% of officials. Information about eligibility and the
incentives under NBA is provided via the Gram Sabha meetings according to 80% of officials. SDs and
GP officials were also seen as a medium for the same.
Figure 61: Information on eligibility and subsidy amount for NBA
86% officials said that potential beneficiaries submitted copy of their ration card. 85% said that they
submitted a copy of NREGA job card, 70% said that they gave application and 55% said applicants
provided a copy of their bank passbook.
2. Process of application:
85% of officials stated that beneficiaries got application forms from the GP office. 80% of officials
reported that beneficiaries seek their help in filling out the application. On being further asked if
they help to fill out the form, 80% of officials stated that they do.
62% 17%
8%
7% 5% 1%
GP president
GP member
Block coordinator NBA
Swachchata Doot
GP secretary
District coordinator NBA
5%
6%
12%
18%
32%
39%
52%
80%
0 20 40 60 80 100
News paper
Television
Block coordinator
NBA wall paintings/Posters
GP members
Swachchata Doot
From GP officials
In Gram Sabha
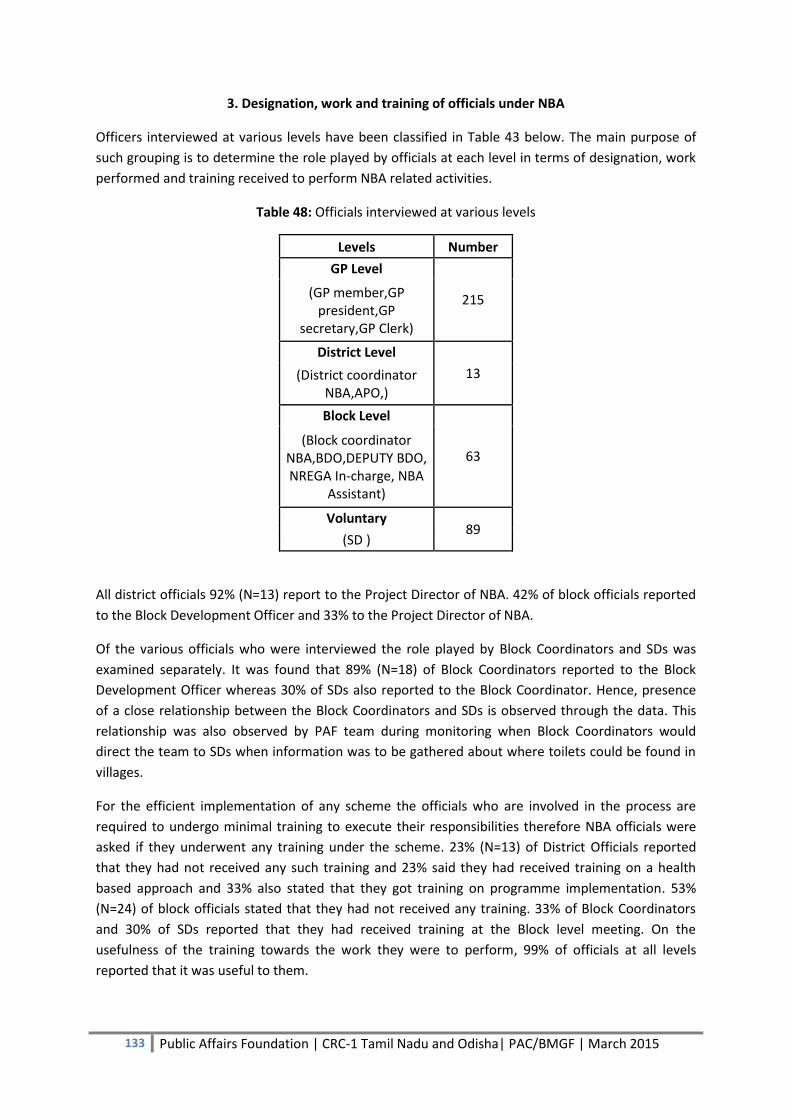
133 Public Affairs Foundation | CRC-1 Tamil Nadu and Odisha| PAC/BMGF | March 2015
3. Designation, work and training of officials under NBA
Officers interviewed at various levels have been classified in Table 43 below. The main purpose of
such grouping is to determine the role played by officials at each level in terms of designation, work
performed and training received to perform NBA related activities.
Table 48: Officials interviewed at various levels
Levels Number
GP Level
215 (GP member,GP president,GP
secretary,GP Clerk)
District Level
13 (District coordinator NBA,APO,)
Block Level
63 (Block coordinator
NBA,BDO,DEPUTY BDO, NREGA In-charge, NBA
Assistant)
Voluntary 89
(SD )
All district officials 92% (N=13) report to the Project Director of NBA. 42% of block officials reported
to the Block Development Officer and 33% to the Project Director of NBA.
Of the various officials who were interviewed the role played by Block Coordinators and SDs was
examined separately. It was found that 89% (N=18) of Block Coordinators reported to the Block
Development Officer whereas 30% of SDs also reported to the Block Coordinator. Hence, presence
of a close relationship between the Block Coordinators and SDs is observed through the data. This
relationship was also observed by PAF team during monitoring when Block Coordinators would
direct the team to SDs when information was to be gathered about where toilets could be found in
villages.
For the efficient implementation of any scheme the officials who are involved in the process are
required to undergo minimal training to execute their responsibilities therefore NBA officials were
asked if they underwent any training under the scheme. 23% (N=13) of District Officials reported
that they had not received any such training and 23% said they had received training on a health
based approach and 33% also stated that they got training on programme implementation. 53%
(N=24) of block officials stated that they had not received any training. 33% of Block Coordinators
and 30% of SDs reported that they had received training at the Block level meeting. On the
usefulness of the training towards the work they were to perform, 99% of officials at all levels
reported that it was useful to them.
134 Public Affairs Foundation | CRC-1 Tamil Nadu and Odisha| PAC/BMGF | March 2015
According to officials the main tasks which were assigned to officials were creation of items such as
booklets (17%), generation of lists of HHs which are eligible for NBA (16%), making applications
(11%) and identifying HHS without toilets (9%).
77% of district officials, 53% of block officials and 97% of SDs stated that it did. With regard to
making visits to the toilet construction sites, 99% of officials stated they did.
4. Jurisdiction of areas and dissemination of information on NBA
Officials were asked about the number of blocks/GPs/villages that were under their jurisdiction for
NBA related work.
On an average at district level 2000 villages and more than 2 lakh HHs were under the charge of
officials for NBA related work. As for GPs and Blocks, on an average more than 200 GPs and more
than 20 Blocks were under officials for NBA related work. In order to motivate HHs to build toilets
more than 7000 HHs and around 102 villages were covered by officials in the last six months. For
processing of paperwork related to NBA, again on an average more than 7000 HHs and 96 villages
had been covered by officials.
At the block level officials stated that on an average more than 100 villages and 10,000 HHs were
under their charge in relation to NBA. Also on an average 50 GPs and 32 Blocks were also under their
charge under NBA. Officials further stated that in the past six months they had covered on an
average 4466 HHs and 80 villages to motivate people to build toilets. In order to process paperwork
on an average 3455 HHs and 85 villages had been covered by officials.
At the GP level on an average 20 villages and 3089 HHs were under the charge of officials. On an
average 3 GPs and 34 Blocks came under officials. 1849 HHs and 36 villages had been covered to be
motivated to build toilets under NBA during the last six months. Similarly 2016 HHs and 37 villages
had been covered for processing paper work related to NBA.
Here it is also important to assess the role played by Block Coordinators and SDs as they work at the
lowest tier of the NBA process and are in close proximity of HHs. It was found that on an average 208
villages and more than 20000 HHs came under the charge of Block Coordinators so did 27 GPs and
12 Blocks. The Block Coordinators’ had been able to cover 12754 HHs and 94 villages on an average
to motivate people to build toilets and had covered 12522 HHs and 96 villages to process documents
on NBA.
It was found that the reach and charge of SDs was low as compared to officials at other levels in the
NBA structure. On average 9 villages, 2144 HHs, 1 GP and 30 Blocks were under their charge on NBA.
In the last six t months they had been able to cover 581 HHs and 6 villages to motivate people to
build toilets under NBA.
5. Problems faced by beneficiaries:
The common problems that officials came across which plagued beneficiaries were, lack of space
(38%),lack of funds (35%), lack of water (25%), lack of awareness on the toilet construction process
(15%), NREGA money not being disbursed (18%), and incentives not being received (10%). However
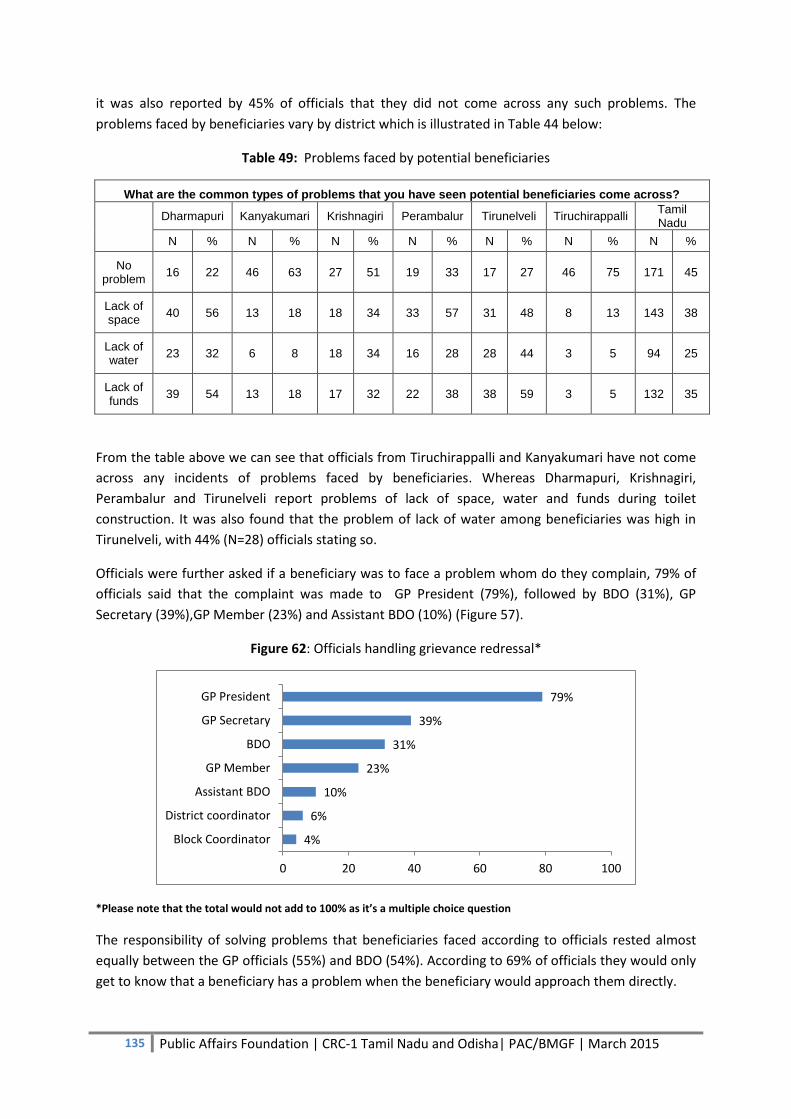
135 Public Affairs Foundation | CRC-1 Tamil Nadu and Odisha| PAC/BMGF | March 2015
it was also reported by 45% of officials that they did not come across any such problems. The
problems faced by beneficiaries vary by district which is illustrated in Table 44 below:
Table 49: Problems faced by potential beneficiaries
What are the common types of problems that you have seen potential beneficiaries come across?
Dharmapuri Kanyakumari Krishnagiri Perambalur Tirunelveli Tiruchirappalli Tamil Nadu
N % N % N % N % N % N % N %
No problem
16 22 46 63 27 51 19 33 17 27 46 75 171 45
Lack of space
40 56 13 18 18 34 33 57 31 48 8 13 143 38
Lack of water
23 32 6 8 18 34 16 28 28 44 3 5 94 25
Lack of funds
39 54 13 18 17 32 22 38 38 59 3 5 132 35
From the table above we can see that officials from Tiruchirappalli and Kanyakumari have not come
across any incidents of problems faced by beneficiaries. Whereas Dharmapuri, Krishnagiri,
Perambalur and Tirunelveli report problems of lack of space, water and funds during toilet
construction. It was also found that the problem of lack of water among beneficiaries was high in
Tirunelveli, with 44% (N=28) officials stating so.
Officials were further asked if a beneficiary was to face a problem whom do they complain, 79% of
officials said that the complaint was made to GP President (79%), followed by BDO (31%), GP
Secretary (39%),GP Member (23%) and Assistant BDO (10%) (Figure 57).
Figure 62: Officials handling grievance redressal*
*Please note that the total would not add to 100% as it’s a multiple choice question
The responsibility of solving problems that beneficiaries faced according to officials rested almost
equally between the GP officials (55%) and BDO (54%). According to 69% of officials they would only
get to know that a beneficiary has a problem when the beneficiary would approach them directly.
4%
6%
10%
23%
31%
39%
79%
0 20 40 60 80 100
Block Coordinator
District coordinator
Assistant BDO
GP Member
BDO
GP Secretary
GP President
136 Public Affairs Foundation | CRC-1 Tamil Nadu and Odisha| PAC/BMGF | March 2015
50% of officials said that they report a problem which they come across during the implementation
of NBA, to the BDO whereas 48% said they report this to the GP President. 55% of officials stated
that they had not reported problems that they came across during implementation. Of the 45%
officials who had reported a problem, the main issues reported were “problems in disbursing the
NBA incentive (45%)”, “not being given enough remuneration for the work being done (44%)”,
“creating awareness among people (42%)” and “issues of disbursing the NREGA money (42%)”.
Other problems were “getting money released from the higher authorities (26%)”, “difficulty in
finding construction materials (18%)” and “difficulty in finding contractors (16%).”
62% of officials in stated that some of them the issues reported by them were resolved. According to
68% of officials the problem was resolved by the GP president followed by the BDO (65%) and the
GP Secretary (17%).
Satisfaction levels with problem resolution were high with 65% of officials reporting that they were
completely satisfied and 34% said they were partially satisfied. According to 73% of officials there
were no bottlenecks with the implementation of the NBA whereas around 14% stated that
disbursing the NBA incentives and NREGA money were the main issues.
6. NBA Implementation:
In order to assess efficiency with which NBA was implemented and the reach of the scheme officials
were asked to provide details on time taken to disburse the funds, time taken to complete the
construction, number of HHs who have built a toilet, toilet usage, processing the application, and
time taken to receive the NREGA wages under the scheme.
It was found that out of 381 official responses, 99 officials state that it took 15 days for the funds to
be released to the beneficiary or contractor once the construction was complete. Also officials
stated that construction had to be completed within 30 days from when the construction
commenced and the application was approved.
7% of officials were unaware of the number of HHs who had built a toilet under the NBA in their
block/GP/Village. 7% also reported that 30 houses had built toilets. In terms of usage, it was found
that 9% did not know the number of HHs who used the toilets whereas 5% reported that 40 HHs
used the toilet.
The number of applications which had been processed in the last one year in their village/block/GP,
out of 381 official responses 31 stated that they were not aware, 26 stated that 100 applications had
been processed.
About the time period within which a beneficiary received the incentive amount, 27% of officials
stated that it comes in 7 days, whereas 17% stated that it is received within 66 days. 9% of officials
also stated that the beneficiary does not receive anything. As for the NREGA wages received under
NBA 26% of officials stated that it is received within 15 days.
7. Knowledge of specifications of a toilet under NBA:

137 Public Affairs Foundation | CRC-1 Tamil Nadu and Odisha| PAC/BMGF | March 2015
The questionnaire also examined the knowledge officials had on a toilet built under NBA. 63% of
officials stated that the roof should be made of concrete, 96% stated that the toilet needed a
window. 32% stated that the toilet length should be 6 feet, 59% said width should be 4 feet and 41%
said the height should be 6 feet. 67% thought toilets should have brick walls. An NBA toilet should
have a single pit according to 69% of officials and the toilet was to have three rings according to 30%
of officials. 74% of officials said pit toilets were usually constructed in their district under NBA. 58%
stated that toilets with septic tanks were also constructed in their area.
Rural Sanitary Mart
The presence of a Rural Sanitary Mart was almost absent with 97% of officials stating that none were
present in the areas under their jurisdiction. Of the officials (3%), who stated that a RSM was present
said it was located more than 10 kms from their district.
8. IEC activities for NBA:
Officials were also interviewed to ascertain the level of IEC activities which were conducted in their
respective village/Block/GPs to generate awareness amongst people on the various provisions under
NBA scheme. It was found that almost all (99%) officials replied in the affirmative when asked
whether everybody in their block/GP/village was aware of the incentives given under NBA.
About the specific activities officials had seen or implemented in their Block/GP/Village in the
previous six months to create awareness among the people under the NBA, responses were varied.
The various mediums which were utilized according to officials were house to house visits (82%),
distribution of handbills (45%), rallies (41%), display of NBA posters (37%) and street plays (27%)
(Figure 58).
Figure 63: Medium Used for IEC activities
27%
37%
41%
45%
82%
0 20 40 60 80 100
Street plays
Display of NBA posters
Rallies
Distributed handbills
House to house visits
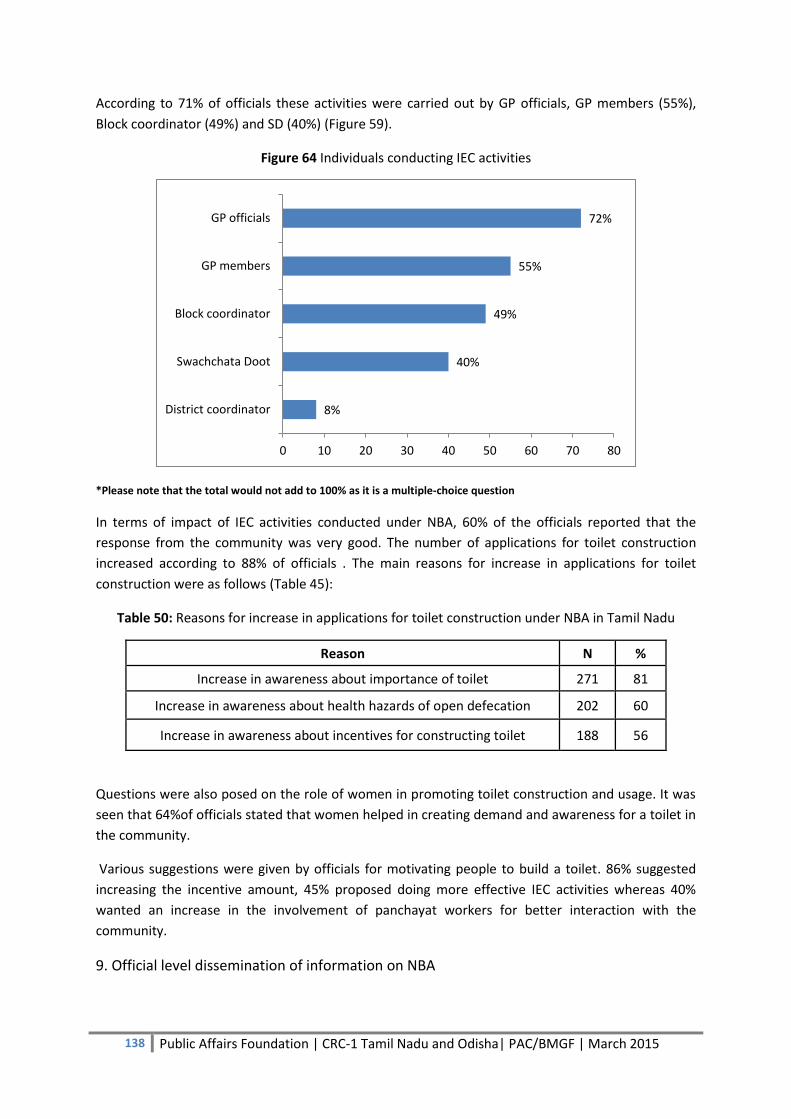
138 Public Affairs Foundation | CRC-1 Tamil Nadu and Odisha| PAC/BMGF | March 2015
According to 71% of officials these activities were carried out by GP officials, GP members (55%),
Block coordinator (49%) and SD (40%) (Figure 59).
Figure 64 Individuals conducting IEC activities
*Please note that the total would not add to 100% as it is a multiple-choice question
In terms of impact of IEC activities conducted under NBA, 60% of the officials reported that the
response from the community was very good. The number of applications for toilet construction
increased according to 88% of officials . The main reasons for increase in applications for toilet
construction were as follows (Table 45):
Table 50: Reasons for increase in applications for toilet construction under NBA in Tamil Nadu
Reason N %
Increase in awareness about importance of toilet 271 81
Increase in awareness about health hazards of open defecation 202 60
Increase in awareness about incentives for constructing toilet 188 56
Questions were also posed on the role of women in promoting toilet construction and usage. It was
seen that 64%of officials stated that women helped in creating demand and awareness for a toilet in
the community.
Various suggestions were given by officials for motivating people to build a toilet. 86% suggested
increasing the incentive amount, 45% proposed doing more effective IEC activities whereas 40%
wanted an increase in the involvement of panchayat workers for better interaction with the
community.
9. Official level dissemination of information on NBA
8%
40%
49%
55%
72%
0 10 20 30 40 50 60 70 80
District coordinator
Swachchata Doot
Block coordinator
GP members
GP officials
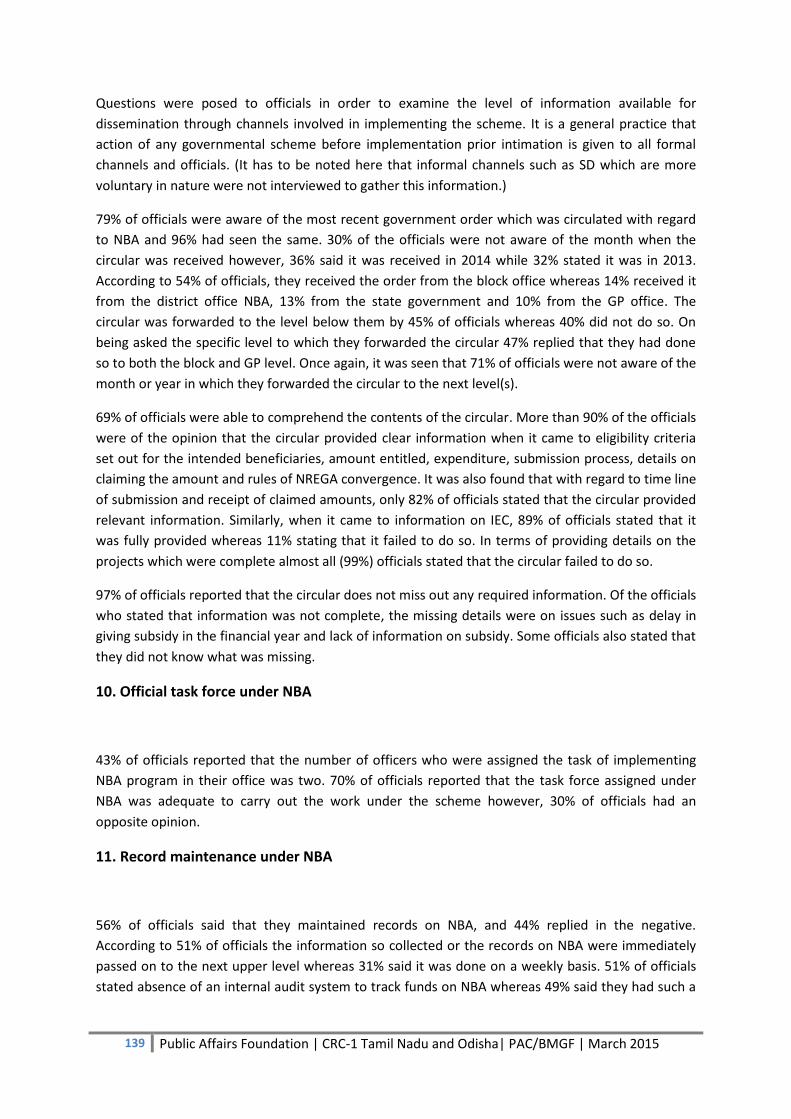
139 Public Affairs Foundation | CRC-1 Tamil Nadu and Odisha| PAC/BMGF | March 2015
Questions were posed to officials in order to examine the level of information available for
dissemination through channels involved in implementing the scheme. It is a general practice that
action of any governmental scheme before implementation prior intimation is given to all formal
channels and officials. (It has to be noted here that informal channels such as SD which are more
voluntary in nature were not interviewed to gather this information.)
79% of officials were aware of the most recent government order which was circulated with regard
to NBA and 96% had seen the same. 30% of the officials were not aware of the month when the
circular was received however, 36% said it was received in 2014 while 32% stated it was in 2013.
According to 54% of officials, they received the order from the block office whereas 14% received it
from the district office NBA, 13% from the state government and 10% from the GP office. The
circular was forwarded to the level below them by 45% of officials whereas 40% did not do so. On
being asked the specific level to which they forwarded the circular 47% replied that they had done
so to both the block and GP level. Once again, it was seen that 71% of officials were not aware of the
month or year in which they forwarded the circular to the next level(s).
69% of officials were able to comprehend the contents of the circular. More than 90% of the officials
were of the opinion that the circular provided clear information when it came to eligibility criteria
set out for the intended beneficiaries, amount entitled, expenditure, submission process, details on
claiming the amount and rules of NREGA convergence. It was also found that with regard to time line
of submission and receipt of claimed amounts, only 82% of officials stated that the circular provided
relevant information. Similarly, when it came to information on IEC, 89% of officials stated that it
was fully provided whereas 11% stating that it failed to do so. In terms of providing details on the
projects which were complete almost all (99%) officials stated that the circular failed to do so.
97% of officials reported that the circular does not miss out any required information. Of the officials
who stated that information was not complete, the missing details were on issues such as delay in
giving subsidy in the financial year and lack of information on subsidy. Some officials also stated that
they did not know what was missing.
10. Official task force under NBA
43% of officials reported that the number of officers who were assigned the task of implementing
NBA program in their office was two. 70% of officials reported that the task force assigned under
NBA was adequate to carry out the work under the scheme however, 30% of officials had an
opposite opinion.
11. Record maintenance under NBA
56% of officials said that they maintained records on NBA, and 44% replied in the negative.
According to 51% of officials the information so collected or the records on NBA were immediately
passed on to the next upper level whereas 31% said it was done on a weekly basis. 51% of officials
stated absence of an internal audit system to track funds on NBA whereas 49% said they had such a
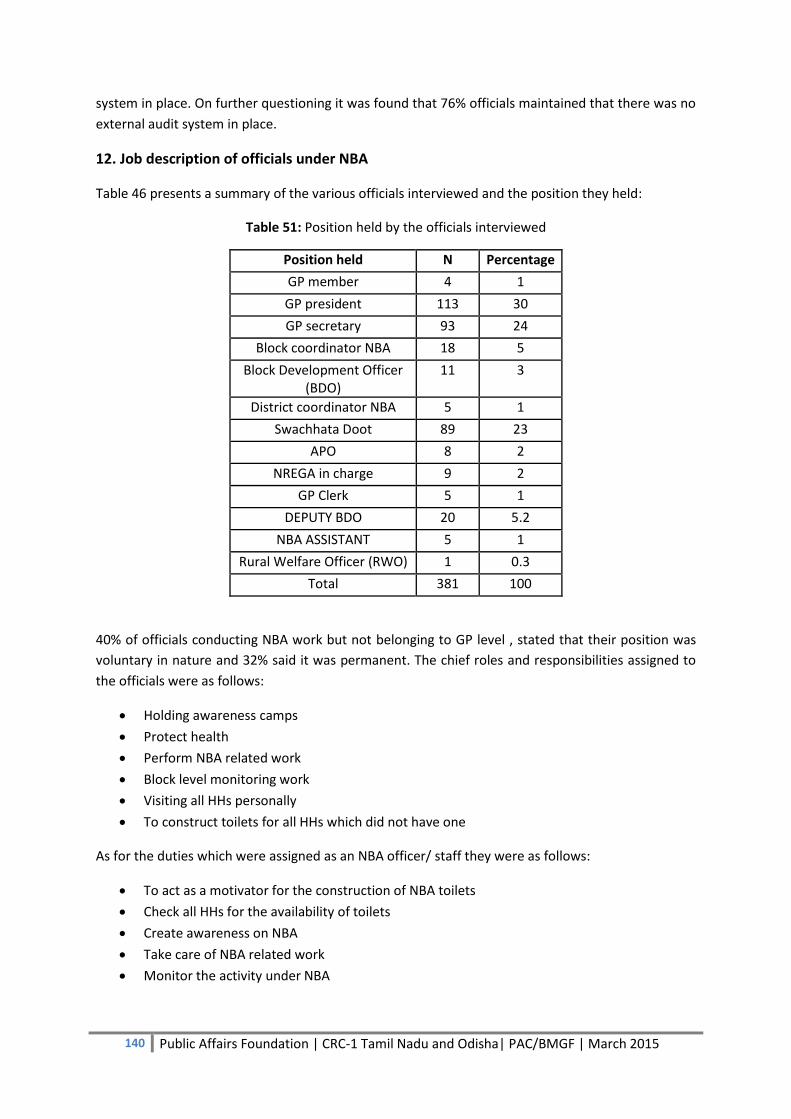
140 Public Affairs Foundation | CRC-1 Tamil Nadu and Odisha| PAC/BMGF | March 2015
system in place. On further questioning it was found that 76% officials maintained that there was no
external audit system in place.
12. Job description of officials under NBA
Table 46 presents a summary of the various officials interviewed and the position they held:
Table 51: Position held by the officials interviewed
Position held N Percentage
GP member 4 1
GP president 113 30
GP secretary 93 24
Block coordinator NBA 18 5
Block Development Officer (BDO)
11 3
District coordinator NBA 5 1
Swachhata Doot 89 23
APO 8 2
NREGA in charge 9 2
GP Clerk 5 1
DEPUTY BDO 20 5.2
NBA ASSISTANT 5 1
Rural Welfare Officer (RWO) 1 0.3
Total 381 100
40% of officials conducting NBA work but not belonging to GP level , stated that their position was
voluntary in nature and 32% said it was permanent. The chief roles and responsibilities assigned to
the officials were as follows:
Holding awareness camps
Protect health
Perform NBA related work
Block level monitoring work
Visiting all HHs personally
To construct toilets for all HHs which did not have one
As for the duties which were assigned as an NBA officer/ staff they were as follows:
To act as a motivator for the construction of NBA toilets
Check all HHs for the availability of toilets
Create awareness on NBA
Take care of NBA related work
Monitor the activity under NBA
141 Public Affairs Foundation | CRC-1 Tamil Nadu and Odisha| PAC/BMGF | March 2015
13. Problems faced during discharging duties for NBA
80% of officials said that they did not face any problems while discharging their duties under NBA
and 20% stated that they had faced issues. The main problems being lack of awareness among
people on NBA, non-willingness to construct the toilet as per the contract, negative response on the
work done by SDs, non-cooperation by councillor and delays when it came to people receiving the
subsidy amount.
65% of officials reported that they are able to comfortably discharge their duties with the staff that
was currently available to them whereas 23% said they could do so but with difficulty. The changes
which were suggested so that officials could perform their tasks more efficiently was need for
compulsory remuneration. It is to be noted here that 28% of officials did not know what changes
were to be brought about.
43% officials felt their NBA work was appreciated and 57% stated its absence. 67% did not know
what kind of formal appreciation they had received. However, when it came to informal
appreciation, 58% of officials stated that they had got public acknowledgment for the work they had
performed. 94% of officials also reported that they were receiving support from their higher officers
towards their work.
14. Corruption
According to 95% of officials, they had not faced/come across any kind of influence while discharging
their duties. Of the officials (4%) who had faced such issues, 57% said it came from local politicians
and public (29%). 97% of the respondents stated that had not seen their higher officers being
affected by interference. All respondents reported that any practice of taking money or eliciting
personal favors from beneficiaries was absent and neither had they been involved in such practices.
63% of officials felt that corrupt practices can be reduced in the implementation of NBA by
generating public awareness. However it is to be noted here that 46% of officials did not know how
to curb corruption.
15. NBA NREGA convergence
82% of officials stated that NBA’s convergence with NREGA was a success while 12% claimed that it
was not.
No departmental changes had been experienced by 67% of officials in two years since NBA was
launched. 33% of officials who had seen changes stated that there was an increase in the
construction of toilets and sanitation.
16. Satisfaction Levels on Services of NBA
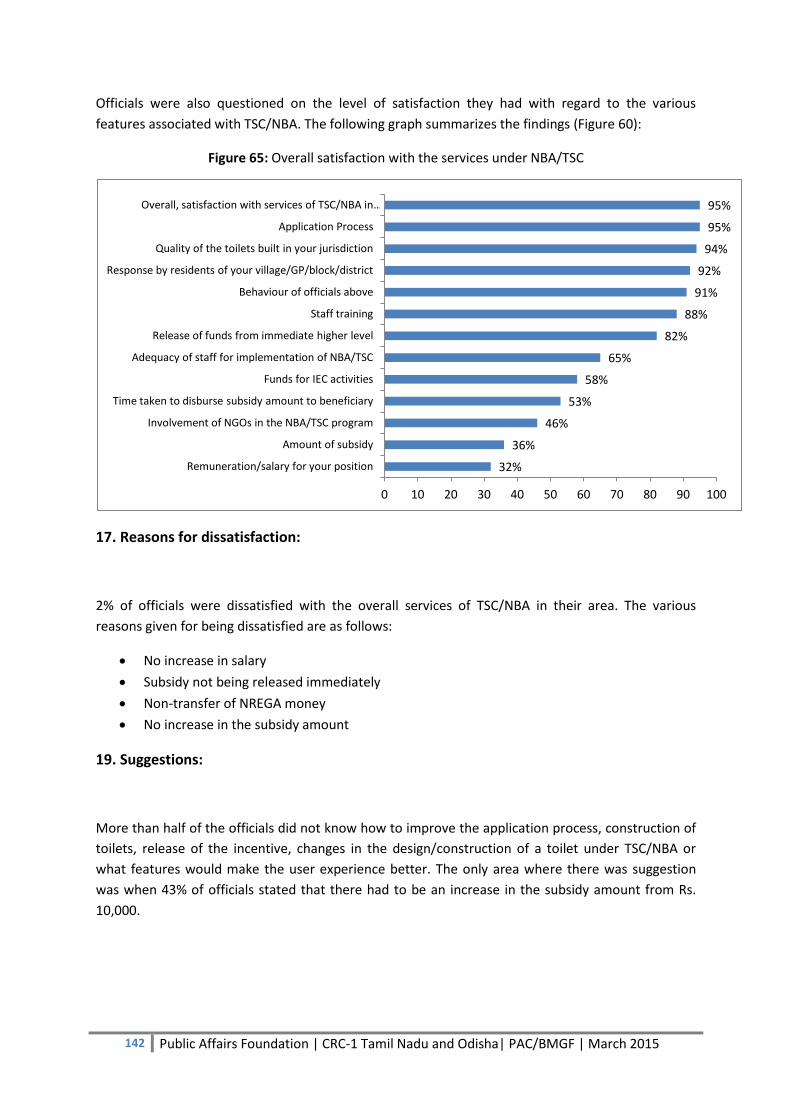
142 Public Affairs Foundation | CRC-1 Tamil Nadu and Odisha| PAC/BMGF | March 2015
Officials were also questioned on the level of satisfaction they had with regard to the various
features associated with TSC/NBA. The following graph summarizes the findings (Figure 60):
Figure 65: Overall satisfaction with the services under NBA/TSC
17. Reasons for dissatisfaction:
2% of officials were dissatisfied with the overall services of TSC/NBA in their area. The various
reasons given for being dissatisfied are as follows:
No increase in salary
Subsidy not being released immediately
Non-transfer of NREGA money
No increase in the subsidy amount
19. Suggestions:
More than half of the officials did not know how to improve the application process, construction of
toilets, release of the incentive, changes in the design/construction of a toilet under TSC/NBA or
what features would make the user experience better. The only area where there was suggestion
was when 43% of officials stated that there had to be an increase in the subsidy amount from Rs.
10,000.
32%
36%
46%
53%
58%
65%
82%
88%
91%
92%
94%
95%
95%
0 10 20 30 40 50 60 70 80 90 100
Remuneration/salary for your position
Amount of subsidy
Involvement of NGOs in the NBA/TSC program
Time taken to disburse subsidy amount to beneficiary
Funds for IEC activities
Adequacy of staff for implementation of NBA/TSC
Release of funds from immediate higher level
Staff training
Behaviour of officials above
Response by residents of your village/GP/block/district
Quality of the toilets built in your jurisdiction
Application Process
Overall, satisfaction with services of TSC/NBA in …
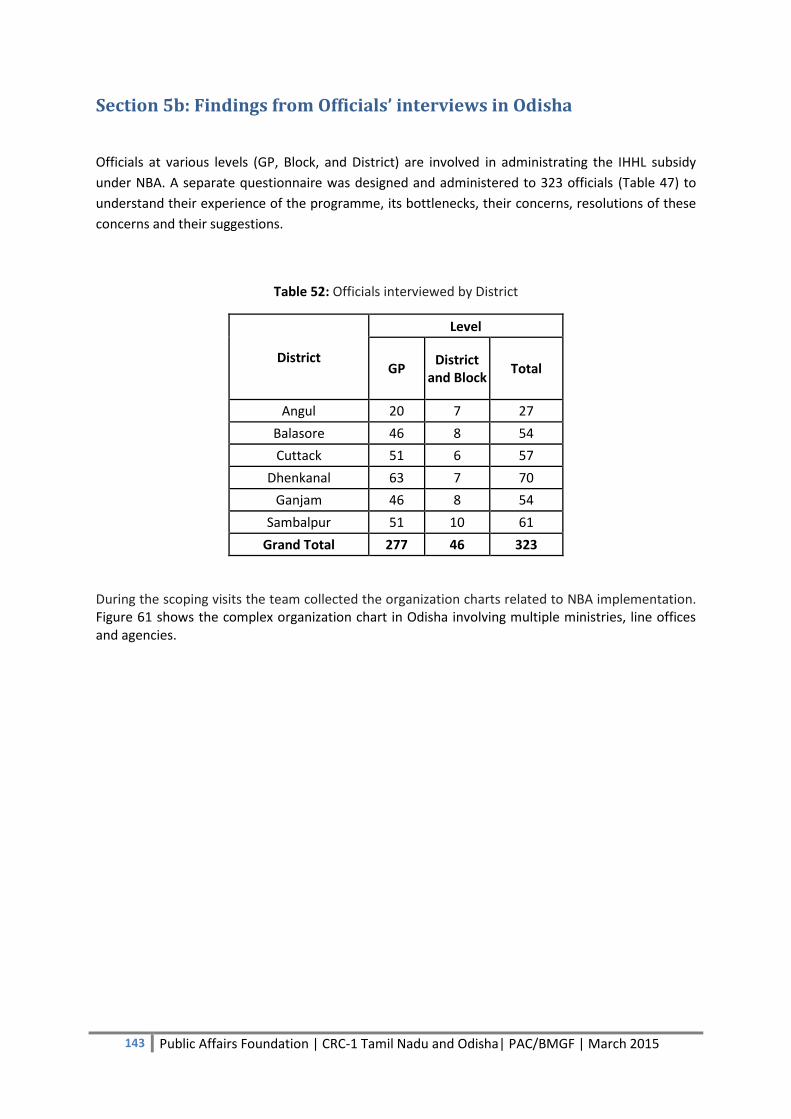
143 Public Affairs Foundation | CRC-1 Tamil Nadu and Odisha| PAC/BMGF | March 2015
Section 5b: Findings from Officials’ interviews in Odisha
Officials at various levels (GP, Block, and District) are involved in administrating the IHHL subsidy
under NBA. A separate questionnaire was designed and administered to 323 officials (Table 47) to
understand their experience of the programme, its bottlenecks, their concerns, resolutions of these
concerns and their suggestions.
Table 52: Officials interviewed by District
District
Level
GP District
and Block Total
Angul 20 7 27
Balasore 46 8 54
Cuttack 51 6 57
Dhenkanal 63 7 70
Ganjam 46 8 54
Sambalpur 51 10 61
Grand Total 277 46 323
During the scoping visits the team collected the organization charts related to NBA implementation. Figure 61 shows the complex organization chart in Odisha involving multiple ministries, line offices and agencies.
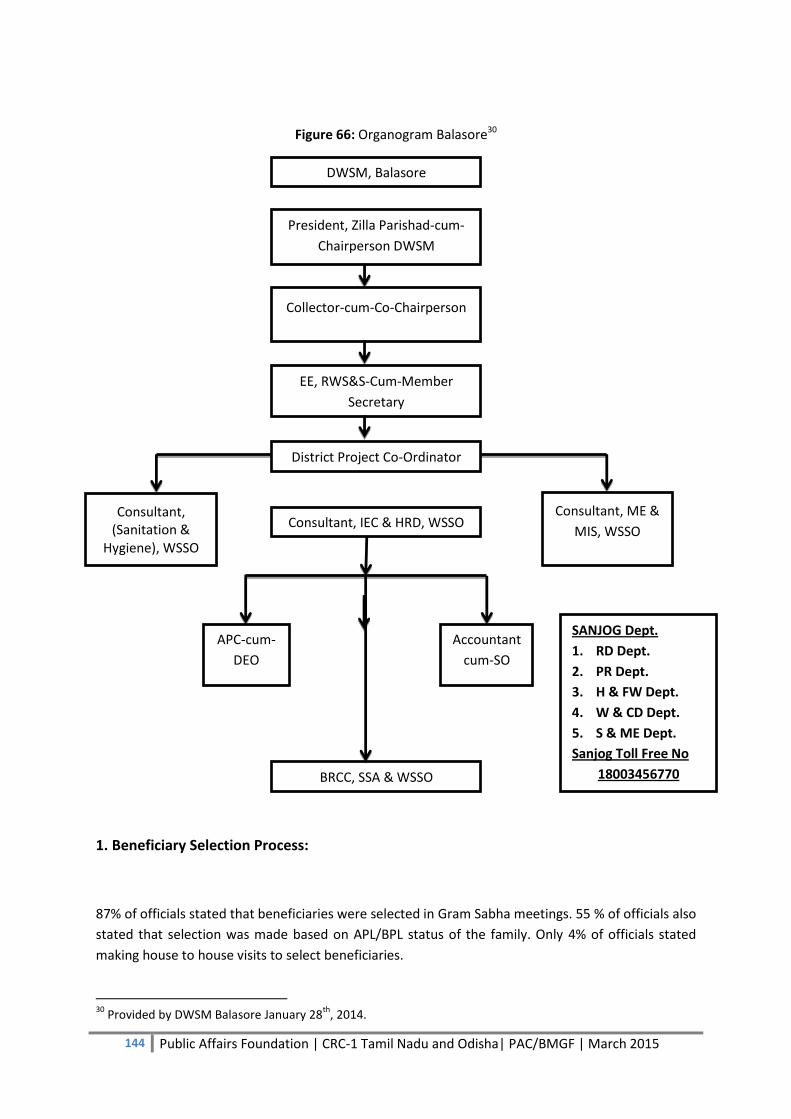
144 Public Affairs Foundation | CRC-1 Tamil Nadu and Odisha| PAC/BMGF | March 2015
Figure 66: Organogram Balasore30
1. Beneficiary Selection Process:
87% of officials stated that beneficiaries were selected in Gram Sabha meetings. 55 % of officials also
stated that selection was made based on APL/BPL status of the family. Only 4% of officials stated
making house to house visits to select beneficiaries.
30
Provided by DWSM Balasore January 28th
, 2014.
SANJOG Dept.
1. RD Dept.
2. PR Dept.
3. H & FW Dept.
4. W & CD Dept.
5. S & ME Dept.
Sanjog Toll Free No
18003456770
DWSM, Balasore
President, Zilla Parishad-cum-
Chairperson DWSM
Collector-cum-Co-Chairperson
EE, RWS&S-Cum-Member
Secretary
District Project Co-Ordinator
Consultant, IEC & HRD, WSSO Consultant,
(Sanitation & Hygiene), WSSO
Consultant, ME &
MIS, WSSO
APC-cum-
DEO
Accountant
cum-SO
BRCC, SSA & WSSO
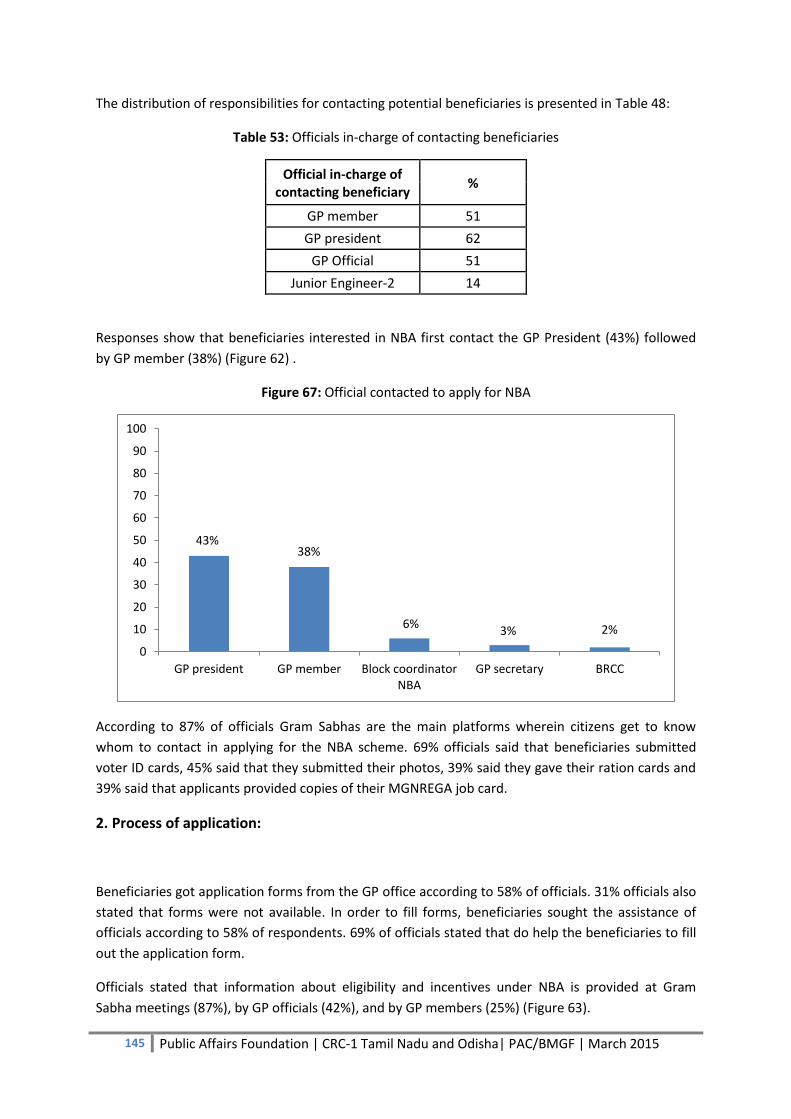
145 Public Affairs Foundation | CRC-1 Tamil Nadu and Odisha| PAC/BMGF | March 2015
The distribution of responsibilities for contacting potential beneficiaries is presented in Table 48:
Table 53: Officials in-charge of contacting beneficiaries
Official in-charge of contacting beneficiary
%
GP member 51
GP president 62
GP Official 51
Junior Engineer-2 14
Responses show that beneficiaries interested in NBA first contact the GP President (43%) followed
by GP member (38%) (Figure 62) .
Figure 67: Official contacted to apply for NBA
According to 87% of officials Gram Sabhas are the main platforms wherein citizens get to know
whom to contact in applying for the NBA scheme. 69% officials said that beneficiaries submitted
voter ID cards, 45% said that they submitted their photos, 39% said they gave their ration cards and
39% said that applicants provided copies of their MGNREGA job card.
2. Process of application:
Beneficiaries got application forms from the GP office according to 58% of officials. 31% officials also
stated that forms were not available. In order to fill forms, beneficiaries sought the assistance of
officials according to 58% of respondents. 69% of officials stated that do help the beneficiaries to fill
out the application form.
Officials stated that information about eligibility and incentives under NBA is provided at Gram
Sabha meetings (87%), by GP officials (42%), and by GP members (25%) (Figure 63).
43% 38%
6% 3% 2%
0
10
20
30
40
50
60
70
80
90
100
GP president GP member Block coordinator NBA
GP secretary BRCC
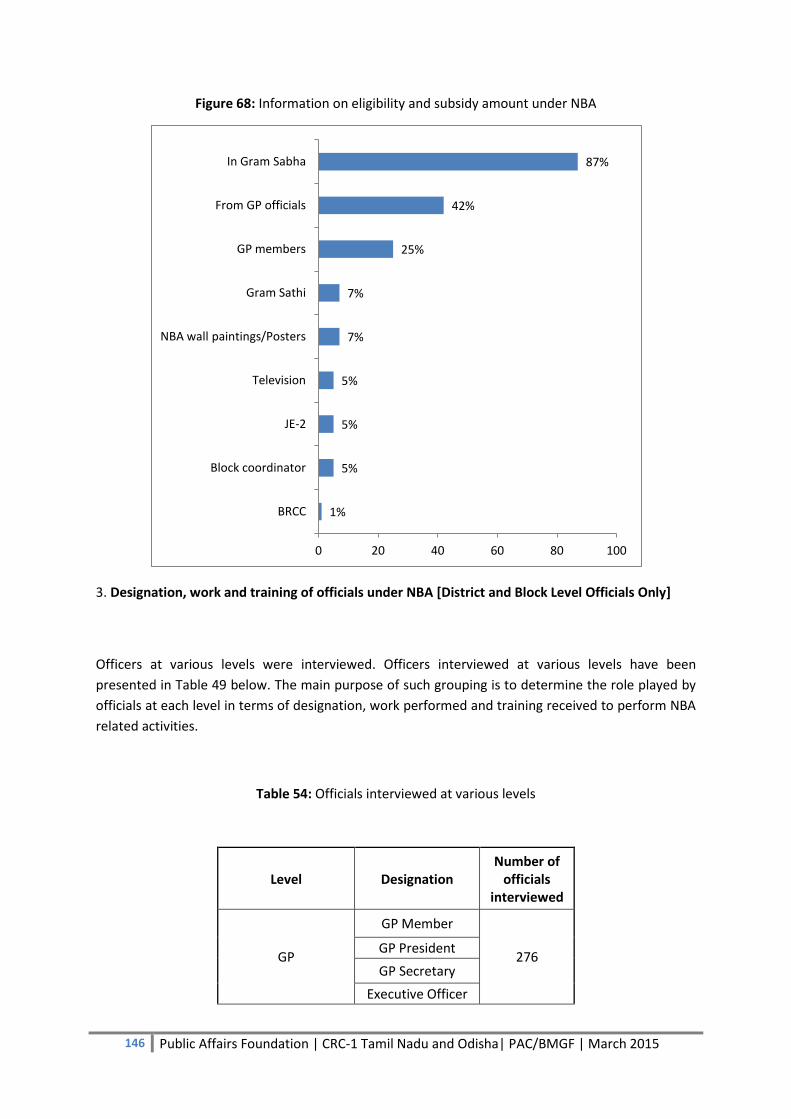
146 Public Affairs Foundation | CRC-1 Tamil Nadu and Odisha| PAC/BMGF | March 2015
Figure 68: Information on eligibility and subsidy amount under NBA
3. Designation, work and training of officials under NBA [District and Block Level Officials Only]
Officers at various levels were interviewed. Officers interviewed at various levels have been
presented in Table 49 below. The main purpose of such grouping is to determine the role played by
officials at each level in terms of designation, work performed and training received to perform NBA
related activities.
Table 54: Officials interviewed at various levels
Level Designation Number of
officials interviewed
GP
GP Member
276 GP President
GP Secretary
Executive Officer
1%
5%
5%
5%
7%
7%
25%
42%
87%
0 20 40 60 80 100
BRCC
Block coordinator
JE-2
Television
NBA wall paintings/Posters
Gram Sathi
GP members
From GP officials
In Gram Sabha
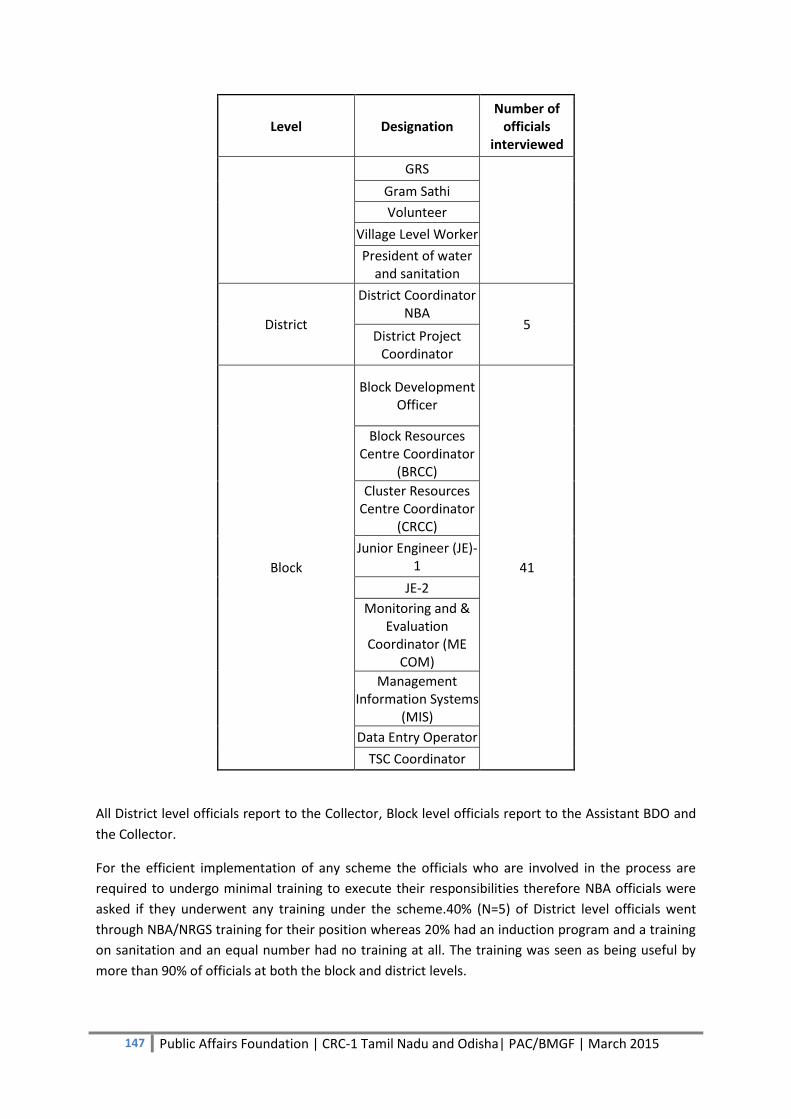
147 Public Affairs Foundation | CRC-1 Tamil Nadu and Odisha| PAC/BMGF | March 2015
Level Designation Number of
officials interviewed
GRS
Gram Sathi
Volunteer
Village Level Worker
President of water and sanitation
District
District Coordinator NBA
5 District Project
Coordinator
Block
Block Development Officer
41
Block Resources Centre Coordinator
(BRCC)
Cluster Resources Centre Coordinator
(CRCC)
Junior Engineer (JE)-1
JE-2
Monitoring and & Evaluation
Coordinator (ME COM)
Management Information Systems
(MIS)
Data Entry Operator
TSC Coordinator
All District level officials report to the Collector, Block level officials report to the Assistant BDO and
the Collector.
For the efficient implementation of any scheme the officials who are involved in the process are
required to undergo minimal training to execute their responsibilities therefore NBA officials were
asked if they underwent any training under the scheme.40% (N=5) of District level officials went
through NBA/NRGS training for their position whereas 20% had an induction program and a training
on sanitation and an equal number had no training at all. The training was seen as being useful by
more than 90% of officials at both the block and district levels.
148 Public Affairs Foundation | CRC-1 Tamil Nadu and Odisha| PAC/BMGF | March 2015
45% of officials were not aware of the paperwork/targets/plans that was given by the officer above
them regarding NBA. 14% also stated that they had not been given any target.
Field visits were reported by 80% of officials both at the District and Block level. Officials at both
levels also reported that they visited the toilet construction sites to monitor the work.
4. Jurisdiction of areas and dissemination of information for NBA
Officials were asked about the number of blocks/GPs/villages which were under their jurisdiction for
NBA related work.
At district level, on an average, 27 blocks, 145 GPs and 238 villages were under the charge of
officials. In order to motivate HHs to build toilets more than 288 HHs and 83 villages were covered
by officials in the last six months. For processing of paperwork related to NBA, on an average more
than 1139 HHs and 353 villages had been covered by officials.
At the block level, on an average more than 170 villages, zero HHs, 34 GPs and 29 Blocks were under
the charge of officials. In the past six months they had covered, on an average 650 HHs and 76
villages to motivate people to build toilets and in order to process paperwork 712 HHs and 99
villages.
At the GP level, on an average 48 Blocks, 25 GPs and 23 villages and zero HHs were under the charge
of officials. 319 HHs and 37 villages were covered by them to motivate people to build toilets and
190 HHs, 38 villages had been covered for processing paper work related to NBA in the last six
months.
5. Problems faced by beneficiaries:
The common problems that beneficiaries faced, according to officials, were lack of funds (33%),
incentives not being received (18%), and NREGA money not being received (14%). 40% of officials
reported that beneficiaries did not come across any such problems. For problems if any faced by
beneficiaries, 71% officials said that beneficiaries complained to the GP President, 42% officials
stated that complaints were made to the GP Secretary, 38% said it was to the BDO and 17% said
complaints were made to JE-2 (17%) (Figure 64).

149 Public Affairs Foundation | CRC-1 Tamil Nadu and Odisha| PAC/BMGF | March 2015
Figure 69: Officials handling grievance redressal
The responsibility of solving problems according to 73% of officials rests with the BDO with GP
officials (40%) and GP Members (20%). 69% of officials reported that they get to know about a
problem only when the beneficiary approached them directly.
40% of officials said that they report a problem which they come across during the implementation
of NBA to the BDO, 25% said that they report this to the GP member. 87% stated that they had
never reported a problem faced during implementation. Of the 13% officials who had reported a
problem, the main issues reported were “not enough remuneration (31%)”, “difficulty in choosing a
beneficiary (19%)”, “getting money released from the higher authorities (21%)”, “difficulty in finding
construction materials (18%)”, and “creating awareness among people on NBA (18%)”.
Problem resolution showed a mixed response, 38% of officials stated that none of the problems they
had reported were resolved, 33% said all of the problems were taken care of and a further 29%
stated that only some of the problems were resolved. According to 65% of officials, the problem was
resolved by the BDO (65%) while 23% said that this was by the GP President. Satisfaction levels with
problem resolution was low with 62% of officials reporting that they were partially satisfied with the
manner in which the problem was resolved and only 39% saying that they were completely
satisfied. 44% of officials reported that there were no problems in implementation whereas 20%
stated that disbursing NREGA money and creating awareness among people on NBA are the main
problems they have faced during their work.
6. NBA Implementation:
In order to assess the speed by which NBA was implemented and the reach of the scheme, officials
were asked to provide details of the on time taken to disburse funds, time taken to complete toilet
construction, number of HHs who have built a toilet, toilet usage, processing the application, and
time taken to receive the NREGA wages under the scheme.
In Odisha out of 323 official responses, 110 officials (34%) were not aware as to when the funds
were to be released to the beneficiary or contractor. 25% and 31% of officials reported that they
71%
42% 38% 38%
17% 9%
0
20
40
60
80
100
GP president GP Secretary BDO GP Member JE-2 GRS
150 Public Affairs Foundation | CRC-1 Tamil Nadu and Odisha| PAC/BMGF | March 2015
were not aware of the number of days within which the toilet construction was to be completed and
the application was to be approved. 24% of officials reported that they were not aware of how many
HHs had built toilets under NBA; 16% said that there were no toilets built in the previous one year in
their area. Knowledge about number of HHs using toilets was low with 25% of officials stating that
they were not aware; 9% reported that no one was using the toilets built under NBA. 31% of officials
were not aware of the number of the number of applications processed in the previous year in their
village/Block/GP; 14% stated that no applications had been processed.
With regard to the time period within which a beneficiary receives the incentive amount, 42% of
officials stated that the beneficiary does not receive any incentive amount, 32% said that the
beneficiary received this within 15 days. 35% of officials said the beneficiary receives wages under
NREGA for working on a toilet under NBA within 7 days; 37% of officials said wages are not
applicable.
7. Knowledge of specifications of a toilet under NBA:
In order to assess the level of information officials had on NBA questions were posed on the
specifications of a toilet, 53% of officials stated that the toilet roof should be asbestos, 86% stated
that the toilet did not need a window. 32% stated that the toilet length should be 4 feet, 41% said
width should be 4 feet, 49% said height should be 6 feet and 71% thought toilets should have brick
walls.
An NBA toilet should have a single pit according to 82% of officials and the toilet was to have three
rings according to 74% of officials. 96% of officials said pit toilets were usually constructed in their
district under NBA. 65% of officials claimed that there were no Rural Sanitary Marts in their region.
Of the officials (35%) who said it was present in their region, 53% said it was located less than 5 kms
from their block/GP/Village.
8. IEC activities for NBA:
Officials were also interviewed to ascertain the level of IEC activities conducted in their respective
village/Block/GPs to generate awareness among people on the various provisions under NBA/TSC
scheme. Awareness on the incentive available under NBA was low with 63% of officials reporting so.
About the specific activities, officials had seen or implemented in their Block/GP/Village in the
previous six months to create awareness among the people under NBA, responses were varied. 41%
of officials had seen street plays, 29% said there were display of NBA posters (Figure 65).
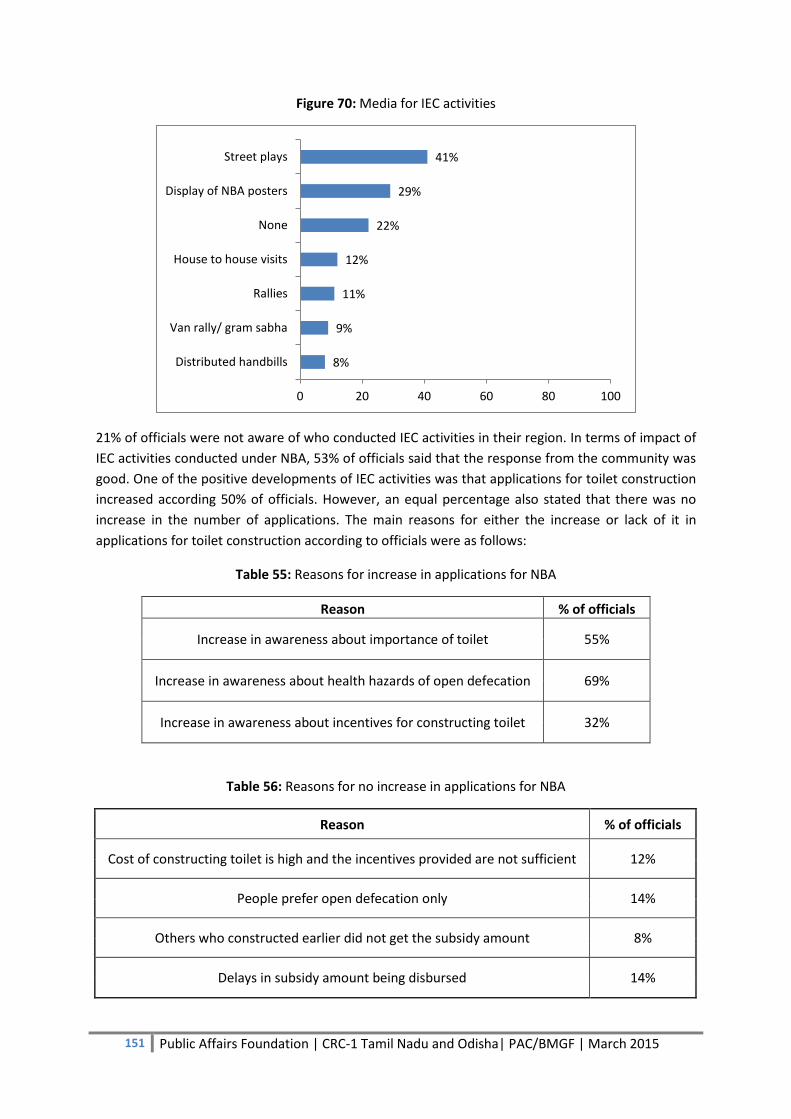
151 Public Affairs Foundation | CRC-1 Tamil Nadu and Odisha| PAC/BMGF | March 2015
Figure 70: Media for IEC activities
21% of officials were not aware of who conducted IEC activities in their region. In terms of impact of
IEC activities conducted under NBA, 53% of officials said that the response from the community was
good. One of the positive developments of IEC activities was that applications for toilet construction
increased according 50% of officials. However, an equal percentage also stated that there was no
increase in the number of applications. The main reasons for either the increase or lack of it in
applications for toilet construction according to officials were as follows:
Table 55: Reasons for increase in applications for NBA
Reason % of officials
Increase in awareness about importance of toilet 55%
Increase in awareness about health hazards of open defecation 69%
Increase in awareness about incentives for constructing toilet 32%
Table 56: Reasons for no increase in applications for NBA
Reason % of officials
Cost of constructing toilet is high and the incentives provided are not sufficient 12%
People prefer open defecation only 14%
Others who constructed earlier did not get the subsidy amount 8%
Delays in subsidy amount being disbursed 14%
8%
9%
11%
12%
22%
29%
41%
0 20 40 60 80 100
Distributed handbills
Van rally/ gram sabha
Rallies
House to house visits
None
Display of NBA posters
Street plays

152 Public Affairs Foundation | CRC-1 Tamil Nadu and Odisha| PAC/BMGF | March 2015
Questions were also posed on the role of women in promoting toilet construction and usage. In
Odisha 39% officials stated that they were not aware how women were contributing to the toilet
construction process, whereas 27% said women helped in creating awareness/demand among the
community for toilets. 20% of officials said that women aided the implementing agency in identifying
the right beneficiaries and 18% said they helped beneficiaries in filling the forms and applying for
NBA.
Various suggestions were given by officials for motivating people to build a toilet 56% suggested
increasing the incentive amount, 39% proposed more effective IEC activities, 21% wanted
involvement of Panchayat workers for better interaction with the community.
9. Official level dissemination of information on NBA
Questions were also asked to gauge the level of information available for dissemination through
official channels involved in implementing the scheme. It has to be noted here that informal
channels which are more voluntary in nature would not be interviewed to gather this information.
It is a general practice that before implementation of any governmental scheme prior intimation is
given to all formal channels and officials. Inspite of this 43% of officials were not aware of the most
recent governmental order circulated with regard to NBA and 65% had seen the same. 36 % of
officials were not aware of the month and year when the circular was received; 36% said it was
received in 2014, while 18% said it was in 2013. According to 51% of officials, they received the
order from the block office whereas 28% said that they received it from the state government. The
circular was forwarded to the level below them by 66% of officials whereas 28% did not do so. On
being asked the specific level to which they forwarded the circular, 84% replied that they had not
done so to both the block level and the GP level. 78% of officials were not aware of the month or
year in which they forwarded the circular to the next level(s).
74% of officials were able to comprehend content of the circular. More than 80% of officials were of
the opinion that the circular provided clear information when it came to eligibility criteria set out for
the intended beneficiaries, amount entitled, expenditure, submission process, details on claiming
the amount, and rules of NREGA convergence.
90% of officials reported that the circular does not miss out any required information. Of the officials
who stated that information was not complete, the missing detail was on NREGA JE-2. 25% of
officials also stated that they did not know what was missing.
10. Official task force under NBA
68% of officials reported that no officers were assigned with the task of implementing NBA program
in their office. 54% of officials reported that the task force assigned for NBA was adequate to
address the implementation tasks efficiently under NBA, however 46% of officials had an opposite
opinion.
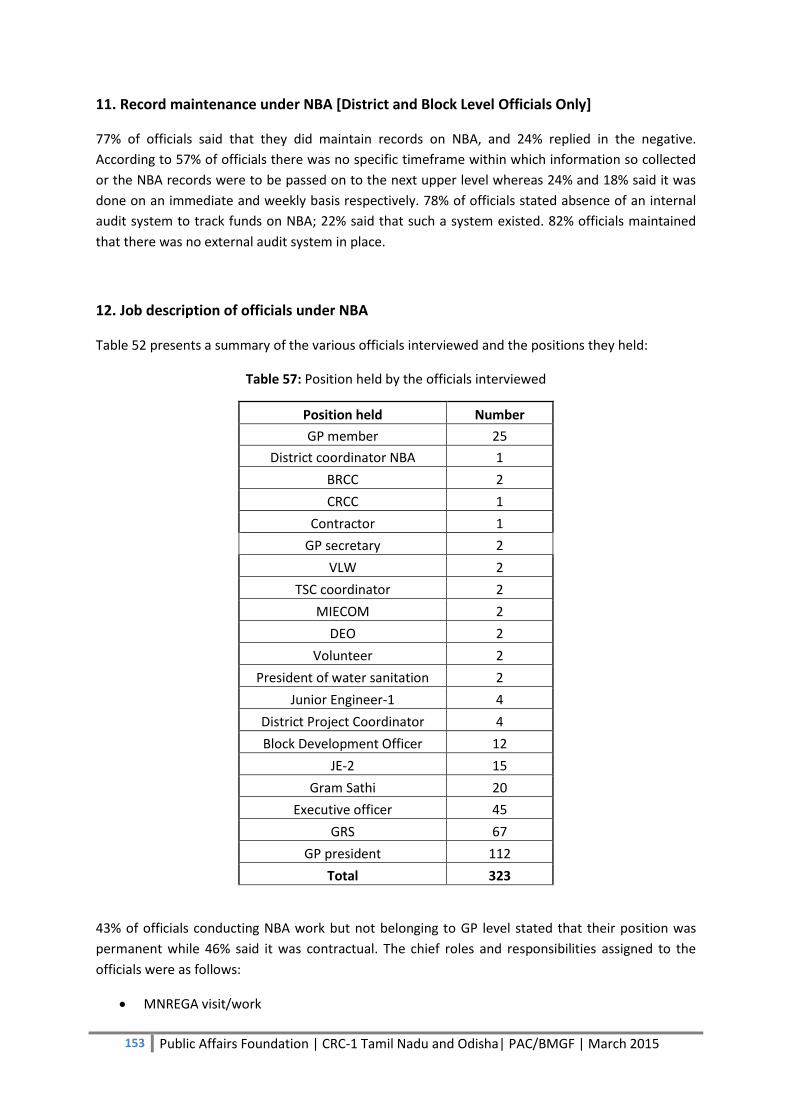
153 Public Affairs Foundation | CRC-1 Tamil Nadu and Odisha| PAC/BMGF | March 2015
11. Record maintenance under NBA [District and Block Level Officials Only]
77% of officials said that they did maintain records on NBA, and 24% replied in the negative.
According to 57% of officials there was no specific timeframe within which information so collected
or the NBA records were to be passed on to the next upper level whereas 24% and 18% said it was
done on an immediate and weekly basis respectively. 78% of officials stated absence of an internal
audit system to track funds on NBA; 22% said that such a system existed. 82% officials maintained
that there was no external audit system in place.
12. Job description of officials under NBA
Table 52 presents a summary of the various officials interviewed and the positions they held:
Table 57: Position held by the officials interviewed
Position held Number
GP member 25
District coordinator NBA 1
BRCC 2
CRCC 1
Contractor 1
GP secretary 2
VLW 2
TSC coordinator 2
MIECOM 2
DEO 2
Volunteer 2
President of water sanitation 2
Junior Engineer-1 4
District Project Coordinator 4
Block Development Officer 12
JE-2 15
Gram Sathi 20
Executive officer 45
GRS 67
GP president 112
Total 323
43% of officials conducting NBA work but not belonging to GP level stated that their position was
permanent while 46% said it was contractual. The chief roles and responsibilities assigned to the
officials were as follows:
MNREGA visit/work
154 Public Affairs Foundation | CRC-1 Tamil Nadu and Odisha| PAC/BMGF | March 2015
Supervise official works in the blocks
Door to door visits on NBA
Help panchayat officials in the selection of beneficiaries
Motivate people to construct toilets
NBA officers/staff stated that duties assigned to them were:
Creating awareness among people in GP about NBA
Door to door visits for NBA work
Supervise official works under NBA
No duty was assigned
Were not aware of their duty
13. Problems faced while discharging duties for NBA
89% of officials said that they did not face any problems while discharging their duties under NBA,
and 11% stated that they had faced some issues, the main problems being release of money to the
beneficiaries, overload of work due to less staff, communication problems, and pressure from local
politicians. 38% of officials reported that they did not know what problems they were facing.
67% of respondents reported that they are able to comfortably discharge their duties with the staff
that was currently available to them whereas 21% said they could do so but with difficulty. 43%
officers did not know what changes could be brought about so that they could perform their tasks
more efficiently.
89% felt their NBA work was not appreciated; only 11% said their work was recognised. 68% did not
know what kind of formal appreciation they had received. However, when it came to informal
appreciation, 88% of officials stated that they were praised by a superior officer and 13 % talked of
public acknowledgment for the work they had done. 76% of officials reported that they received
support for the work being done by them from their higher officers.
14. Corruption
According to 66% of officials they had not faced/come across any kind of influence while discharging
their duties. Of the officials (34%) who had faced such issues, 77% said it came from local
politicians, 60% said it was from NGOs and government officers of other departments. 72% of
respondents were not aware of any higher officers being affected by interference. All officials
reported they were not aware of any practice of taking money or eliciting personal favours from
beneficiaries nor had they been involved in such practices. 40% of officials felt that corrupt practices
can be reduced in the NBA implementation but they did not have any specific suggestions as to how
this could be done.
15. NBA NREGA convergence
37% of officials stated that NBA’s convergence with NREGA was not a success as its a time
consuming activity, and 27% claimed that they were in the process of figuring out how to converge
NREGA and NBA, and 21% stated that it was a success.
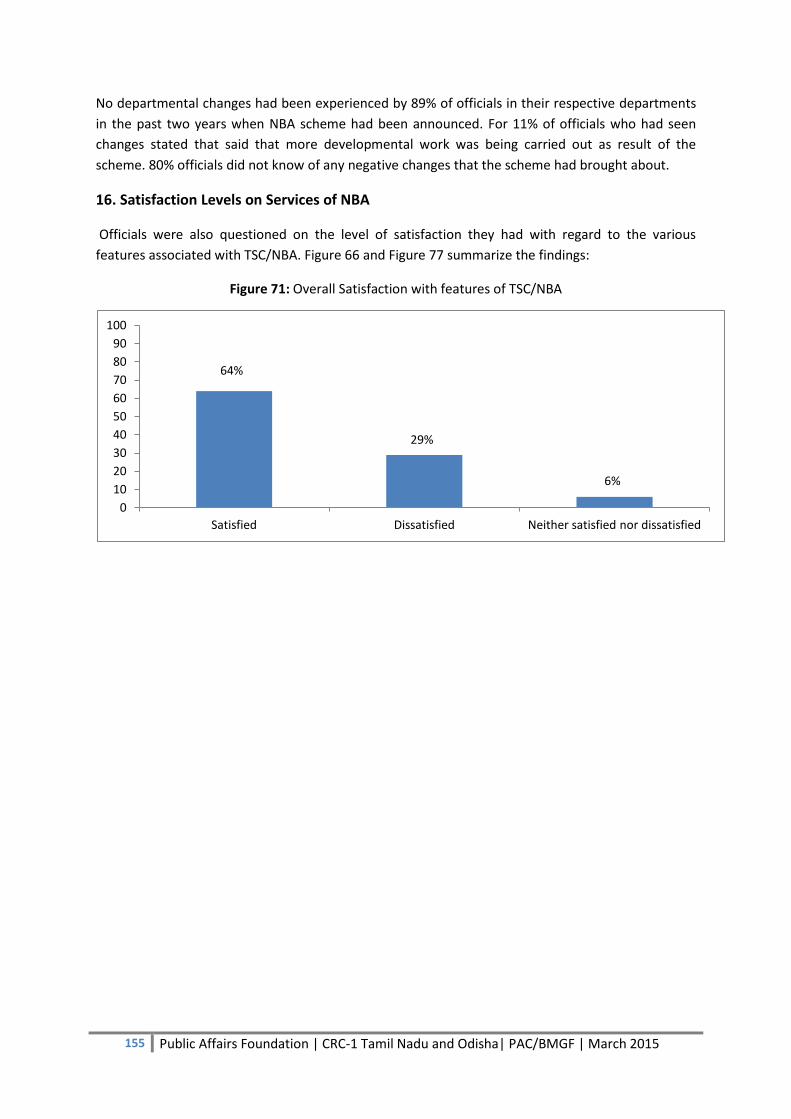
155 Public Affairs Foundation | CRC-1 Tamil Nadu and Odisha| PAC/BMGF | March 2015
No departmental changes had been experienced by 89% of officials in their respective departments
in the past two years when NBA scheme had been announced. For 11% of officials who had seen
changes stated that said that more developmental work was being carried out as result of the
scheme. 80% officials did not know of any negative changes that the scheme had brought about.
16. Satisfaction Levels on Services of NBA
Officials were also questioned on the level of satisfaction they had with regard to the various
features associated with TSC/NBA. Figure 66 and Figure 77 summarize the findings:
Figure 71: Overall Satisfaction with features of TSC/NBA
64%
29%
6%
0
10
20
30
40
50
60
70
80
90
100
Satisfied Dissatisfied Neither satisfied nor dissatisfied
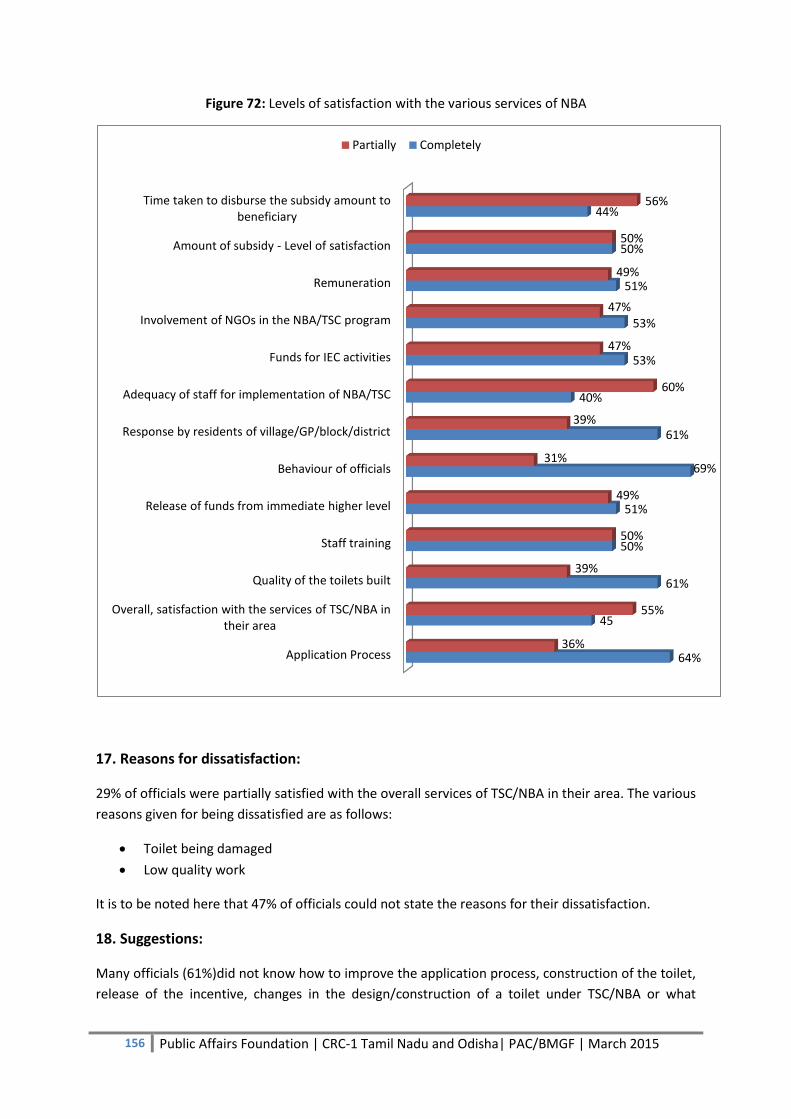
156 Public Affairs Foundation | CRC-1 Tamil Nadu and Odisha| PAC/BMGF | March 2015
Figure 72: Levels of satisfaction with the various services of NBA
17. Reasons for dissatisfaction:
29% of officials were partially satisfied with the overall services of TSC/NBA in their area. The various
reasons given for being dissatisfied are as follows:
Toilet being damaged
Low quality work
It is to be noted here that 47% of officials could not state the reasons for their dissatisfaction.
18. Suggestions:
Many officials (61%)did not know how to improve the application process, construction of the toilet,
release of the incentive, changes in the design/construction of a toilet under TSC/NBA or what
Application Process
Overall, satisfaction with the services of TSC/NBA in their area
Quality of the toilets built
Staff training
Release of funds from immediate higher level
Behaviour of officials
Response by residents of village/GP/block/district
Adequacy of staff for implementation of NBA/TSC
Funds for IEC activities
Involvement of NGOs in the NBA/TSC program
Remuneration
Amount of subsidy - Level of satisfaction
Time taken to disburse the subsidy amount to beneficiary
64%
45
61%
50%
51%
69%
61%
40%
53%
53%
51%
50%
44%
36%
55%
39%
50%
49%
31%
39%
60%
47%
47%
49%
50%
56%
Partially Completely
157 Public Affairs Foundation | CRC-1 Tamil Nadu and Odisha| PAC/BMGF | March 2015
features would make the user experience better. Some of the suggestions, which were made, were
change in the design of the toilet, need to provide more incentive, subsidy to be directly paid to the
beneficiary and quick release of the money.


