

NPL REPORT AS 65 CPEA 28: Airborne Particulate Concentrations and Numbers in the United Kingdom (phase 2) Annual report 2010 SONYA BECCACECI DHARSHENI MUHUNTHAN DIMITRIS SARANTARIDIS JORDAN TOMPKINS DAVID BUTTERFIELD PAUL QUINCEY RICHARD BROWN DAVID GREEN ANDREW GRIEVE GARY FULLER ALAN JONES AUGUST 2011


NPL Report AS 65
CPEA 28: Airborne Particulate Concentrations and Numbers in the United Kingdom (phase 2)
Annual report 2010
S. Beccaceci, D. Muhunthan, D. Sarantaridis, J. Tompkins, D. Butterfield, P. Quincey, R. Brown
Analytical Science, NPL
D. Green, A. Grieve, G. Fuller Environmental Research Group, King’s College London
A. Jones
University of Birmingham
NPL Report AS 65
© Queen’s Printer and Controller of HMSO, 2011
ISSN 1754-2928
National Physical Laboratory Hampton Road, Teddington, Middlesex, TW11 0LW
Extracts from this report may be reproduced provided the source is acknowledged and the extract is not taken out of context.
Approved on behalf of NPLML by Martyn Sené, Operations Director

NPL Report AS 65
CONTENTS EXECUTIVE SUMMARY..................................................................................................................1
1 INTRODUCTION ........................................................................................................................2
2 NETWORK OPERATION..........................................................................................................2 2.1 OVERVIEW...............................................................................................................................2 2.2 NETWORK STRUCTURE............................................................................................................2 2.3 INSTRUMENTATION.................................................................................................................3
2.3.1 Particle counting and sizing analysers ...............................................................................3 2.3.2 NPL drying units .................................................................................................................3 2.3.3 R&P 8400N Automated Nitrate Analyser (PM2.5) ...............................................................4 2.3.4 Daily Sulphate, Nitrate and Chloride (PM10 ) ....................................................................4 2.3.5 Elemental Carbon and Organic carbon (PM10) ..................................................................5 2.3.6 Aethalometer (PM2.5)...........................................................................................................5
3 DATA QUALITY .........................................................................................................................6 3.1 SCHEDULED INSTRUMENT SERVICE AND CALIBRATION .........................................................6
4 NETWORK DATA ......................................................................................................................7 4.1 INSTRUMENT PERFORMANCE AND CONCENTRATION DATA....................................................7 4.2 INORGANIC ANIONS.................................................................................................................7
4.2.1 Partisol 2025 measurements (PM10) ...................................................................................7 4.2.2 Automatic nitrate analyser (PM2.5)...................................................................................12 4.2.3 Comparison of Automatic Nitrate (PM2.5) and Partisol 2025 Nitrate (PM10)..................13
4.3 EC/OC MEASUREMENTS (PM10) ..............................................................................................13 4.3.1 Elemental Carbon and Organic Carbon .............................................................................13 4.3.2 Comparison between elemental carbon and black carbon ...............................................21
4.4 PARTICLE NUMBER AND SIZE DISTRIBUTION ........................................................................25 4.4.1 Particle Number Concentrations (CPC) ..........................................................................25 4.4.2 Particle number and size distributions (SMPS) ...............................................................33 4.4.3 SMPS versus CPC data ....................................................................................................37
4.5 METEOROLOGICAL DATA .....................................................................................................41 4.6 TRENDS AND PROFILES .........................................................................................................41
4.6.2 Monthly trends..................................................................................................................41 4.6.3 Diurnal profiles ................................................................................................................48 4.6.4 Weekly profiles .................................................................................................................51
5 UPDATE ON THE WIDER POLICY AND RESEARCH CONTEXT ................................57 5.1 UPDATE ON RELATED UK ACTIVITIES.................................................................................57
5.1.1 London specific measures .................................................................................................57 5.1.2 Research Council Activity in London................................................................................57 5.1.3 Defra and Other National Monitoring Activities .........................................................58
5.2 UPDATE ON EUROPEAN ACTIVITIES .....................................................................................58 5.2.1 New EU Air Quality Directive 2008/50/EC .................................................................58 5.2.2 CEN standards .............................................................................................................59 5.2.3 EUSAAR .......................................................................................................................60
5.3 ISO STANDARDS...................................................................................................................60 6 TOPIC REPORTS AND PUBLICATIONS.............................................................................61
6.1 PROJECT AND TOPIC REPORTS..................................................................................................61 6.2 PUBLICATIONS..........................................................................................................................62 6.1 MAIN FINDINGS OF REPORTS AND PAPERS IN 2010 ...............................................................63

NPL Report AS 65
7 ACKNOWLEDGEMENTS .......................................................................................................70 Annex 1. Wind roses at Rochester ...........................................................................................71

NPL Report AS 65
1
EXECUTIVE SUMMARY This report was prepared by NPL as part of the UK Airborne Particulate Concentrations and Numbers contract (CPEA 28) let by the Department for the Environment, Food and Rural Affairs (Defra) and the Devolved Administrations: the Scottish Government; the Welsh Government; and the Department of the Environment in Northern Ireland. This is the Annual Summary Report for 2010 and contains: • A summary of network operation and quality procedures • A graphical presentation of all ratified network data from 2010 • Data capture per instrument per month • Comparison of 2010 data with data from recent years • Update on relevant policy areas • Update of the context of the project research and of equipment in the field All equipment was audited during the annual audit round in November/December 2010, and all instruments have been serviced and calibrated by the instrument manufacturer or Equipment Service Unit or NPL. In addition to the measurement programme, short-term research projects have been commissioned on specific topics related to the measurement programme. As part of the contract, the measurements have been and are being used by the University of Birmingham to gain further understanding of particulate matter, its sources, composition and possible control options. A list of Topic Reports and papers in the year is given, together with their main findings.

NPL Report AS 65
2
1 INTRODUCTION This report was prepared by NPL as part of the UK Airborne Particulate Concentrations and Numbers contract (CPEA 28) let by the Department for the Environment, Food and Rural Affairs and the Devolved Administrations: the Scottish Executive; the Welsh Assembly Government; and the Department of the Environment in Northern Ireland. This is the Annual Summary Report for 2010 and contains: • A summary of network operation and quality procedures. • A graphical presentation of all ratified network data from 2010. • Data capture per instrument per month. • Comparison of 2010 data with data from recent years. • Update on relevant policy areas. • Update of the context of the project research and of equipment in the field. All equipment was audited during the annual audit round in November/December 2010, and all instruments have been serviced and calibrated by the instrument manufacturer or Equipment Service Unit or NPL. In addition to the measurement programme, short-term research projects have been commissioned on specific topics and papers related to the measurement programme. The measurements have been and are being used by the University of Birmingham to gain further understanding of particulate matter, its sources, composition and possible control options. The main findings of these reports and papers can be found in Section 6. 2 NETWORK OPERATION 2.1 OVERVIEW The operation of the network in 2010 was structured in the same way as the previous year. King's College London (KCL) has continued in its role as the Central Management and Control Unit (CMCU). It has carried out activities including routine collection of data from sites, initial data validation and instrument fault finding, routine liaison with the Local Site Operators (LSO) and the Equipment Support Unit (ESU). The QA/QC activities were performed by NPL and included site audits, instrument calibrations, data ratification and reporting. 2.2 NETWORK STRUCTURE The current measurement programme is shown in Table 2-1. Wind speed and direction are reported for Rochester site. Site details are available through http://aurn.defra.gov.uk/stations/index.htm. The R&P 8400N automatic nitrate analysers have been discontinued by the manufacturer and service was stopped by the ESU (Air Monitors) in September 2009. The instruments were kept running until final breakage. The analysers at Harwell and North Kensington broke in early January 2010 while the one at Marylebone Road kept going until mid July 2010. Ratified data from the analyser at Marylebone Road are provided.

NPL Report AS 65
3
Table 2-1 Network structure during 2010
Site Daily PM10 anions
Daily PM10 OC/EC
CPC SMPS Aethalometer
Birmingham Tyburn (Urban background)
x
Harwell (Rural) x x x x x
London North Kensington (Urban background)
x x x x
London Marylebone Road (Roadside)
x x x x
2.3 INSTRUMENTATION A brief summary of the operation of the network instruments is given here. More detailed descriptions of the theory of operation, calibration and the estimated uncertainty in the results are included in the NPL measurement uncertainty report1.
2.3.1 Particle counting and sizing analysers Particle number concentrations are measured using a Condensation Particle Counter (CPC) TSI model 3022A. This works by passing the sample through a heated tube saturated with butanol, and then cooling the airstream to set up supersaturated conditions. The butanol vapour then condenses on particles down to very small size, enabling them to be counted optically. CPCs are sensitive to particles from 7 nm up to several microns in size, and have a concentration range from zero to 107 cm-
3. At lower concentrations, each particle is individually counted, and at higher concentrations an optical integrating mode is used. Particle size distributions are measured using a Scanning Mobility Particle Sizer (SMPS). This consists of a CPC (TSI model 3775) combined with an electrostatic classifier (TSI model 3080). The electrostatic classifier consists of a charge neutraliser (incorporating a Kr-85 radioactive source) and a Differential Mobility Analyser (DMA – TSI model 3081). The former brings the particles in the sample to a known steady state charge distribution and the latter allows particles of a single electrical mobility (a quantity related to particle diameter) to pass to the CPC. By varying the operating voltage of the DMA, the size of particles sent to the CPC can be varied and a size distribution obtained.
2.3.2 NPL drying units
A drying unit controls the humidity of the sample air going into the CPC and SMPS. The EU funded EUSAAR project (European Supersites for Atmospheric Aerosol Research) aimed, amongst other things, to improve the harmonisation of the monitoring of many of the pollutants covered by this network. Harwell was a EUSAAR site. The EUSAAR project finished in March 2011 and many of its activities are continued in the project ACTRIS.
1 NPL Report DQL-AS 037, “CPEA 28: Airborne Particulate Concentrations and Numbers in the UK (phase 2) Estimation of Measurements Uncertainty in Network Data”, R. Yardley, B. Sweeney, D. Butterfield, P. Quincey, G. Fuller, D. Green, March 2007

NPL Report AS 65
4
The Harwell site was audited by a group from EUSAAR in November 2007 and a number of recommendations were made, most notably on the sampling inlet and regulating the humidity of the inlet air. New manifolds with PM1 size selective cyclones were installed for the SMPS and CPC at Harwell and the other Network sites in late 2009 to meet these recommendations. The humidity of the sample air going to both the CPC and SMPS instruments, is now controlled and monitored through drying units designed by NPL, which use Nafion driers (see Figure 2-1). Humidity sensors have been installed and are logged by the computers.
NPL DRYING UNIT
Figure 2-1 Typical configuration of CPC, SMPS and NPL drying unit at the Network sites
2.3.3 R&P 8400N Automated Nitrate Analyser (PM2.5)
Ambient samples are pulled through a PM2.5 cyclone operated at 5.5 L/min. Particles are collected by humidification and impaction, and assayed in place by flash heating and chemiluminescent analysis of the evolved nitrogen oxide vapors.
URG AIM samplers with PM10 inlets replaced these analysers at the Marylebone Road and North Kensington sites in February 2011 for measuring hourly concentrations of many anions and cations species. These will be described in future reports.
2.3.4 Daily Sulphate, Nitrate and Chloride (PM10 )
Daily measurements of the main anion components of PM10 (sulphate, nitrate and chloride) were made using a Thermo Partisol 2025 sequential air sampler. Ultrapure quartz filters (Pallflex Tissuquartz) were used and cut in half to allow for the analysis of both EC/OC and the inorganic components.
The Partisol sampler provides uninterrupted sampling of ambient air and automatic exchange of filters for up to 16 days. The instrument used airflow of 1 m3/hour through a PM10 inlet and the filter temperature was maintained to within ± 5 °C of ambient temperature. The exposed filters were stored in small polypropylene filter bags and kept in a cold room until analysis to prevent further loss of volatile components. Extracts from the filters were dissolved in an eluent of 3.5 mM sodium
NPL Report AS 65
5
carbonate and 1 mM sodium hydrogen carbonate and analysed in the laboratory by ion chromatography, for sulphate, nitrate and chloride content. Ambient concentrations were derived from the mass measured on the filter and the airflow during the sampling period.
2.3.5 Elemental Carbon and Organic carbon (PM10)
In the laboratory, a 1.5 cm2 punch is taken from each half filter described above and analysed for elemental and organic carbon in a procedure based on the NIOSH protocol. It involves heating the sample to remove the PM from the filter, conversion of carbonaceous material to methane, followed by detection by flame ionisation. In a helium atmosphere, the sample is gradually heated to 700°C to remove organic carbon on the filter. During this first phase there are usually some organic compounds that are pyrolitically converted to elemental carbon. Measuring the transmission and reflection of a laser beam through the filter continuously monitors this pyrolitic conversion and allows a correction to be made for it. Elemental carbon is detected in the same way after heating to 870°C in the presence of oxygen and helium. The protocol used is termed Quartz, a close variation of the NIOSH protocol. Correction can be made using either the transmitted or reflected signal, giving significantly different results. As the European standardisation process is at an early stage, as described in Section 5, and data from different methods is being evaluated, the results from both methods are presented here.
2.3.6 Aethalometer (PM2.5) Aethalometers quantify Black Carbon on filter samples based on the transmission of light through a sample. The sample is collected onto a quartz tape, and the change in absorption coefficient of the sample is measured by a single pass transmission of light through the sample, measured relative to a clean piece of filter. The system evaluates changes in two optical sensors (sample and reference), with the light source both on and off, such that independent measurements of the change in attenuation of the sample are produced for averaging periods of typically five minutes. The absorption coefficient for material added during the period, α [m-1], is calculated from the attenuation change, and the area and volume of the sample, and converted to a Black Carbon concentration for the period, as a first approximation, using a mass extinction coefficient [16.6 m2 g-1] chosen by the manufacturer to give a good match to Elemental Carbon. In practice this mass extinction coefficient will vary with factors such as particle size, sample composition and quantity of material already on the filter, as discussed below. The Aethalometers run on the Network operate at 2 wavelengths, 880nm and 370 nm. The 880nm wavelength is used to measure the Black Carbon (BC) concentration of the aerosol, while the 370nm wavelength gives a measure of the “UV component” of the aerosol. At wavelengths shorter than about 400 nm, certain classes of organic compounds (such as polycyclic aromatic hydrocarbons, and also certain compounds present in tobacco smoke and fresh diesel exhaust) start to show strong UV absorbance. The UV component can therefore in principle be used as an indicator of oil and solid fuel emissions. The UV component concentration is obtained by subtracting the measured BC concentration from the concentration measured by the 370nm source. The UV component is not a real physical or chemical material, but a parameter based on UV absorption due to the mix of organic compounds measured at this wavelength. This ‘UVPM’ is expressed in units of ‘BC Equivalent’. It is well known that the assumption of constant mass extinction coefficient does not hold as the filter spot darkens, leading to nonlinearity in the Aethalometer response. The effect of this nonlinearity results is that the Aethalometer under-reads at high filter tape loadings. To correct for this nonlinearity, the model developed by A Virkkula[3]
has been used to correct for increased attenuation due to spot darkening during sampling. This uses a simple equation BCcorrected = (1+k.ATN) BCuncorrected, where ATN is the light attenuation by the filter spot, and k is a parameter determined for

NPL Report AS 65
6
each filter spot such that continuity between adjacent filter spots is greatly improved. All of the Black Carbon and UV component results in this report have been corrected by this method. In this Network ambient air is drawn into the sampling system through a standard stainless steel rain cap mounted on the end of a vertical stainless steel tube. Size selection of the sampled aerosol is made by a PM2.5 cyclone placed close to the inlet of the aethalometer. All of the tubing before the cyclone is constructed from stainless steel.
Data from the Harwell aethalometer are shown in more detail in the 2010 Black Carbon Network report2.
3 DATA QUALITY A summary of the principal quality-assurance and quality control procedures used during the measurement and ratification process is given below:
• Continued training of and regular communication with Local Site Operators (LSOs). • The KCL Duty Officer is available to advise LSOs 365 days per year. • Scheduled instrument services and calibrations. • An annual audit of all sites and instruments conducted by NPL. • Calibration data produced at audit by the Equipment Support Unit (ESU), and regular
calibrations carried out automatically or by the LSOs, are all used to produce an appropriate scaling factor to apply to the data.
• Field blank filters have been analysed to evaluate the contamination due to the transport of the filters to the sites and back to the laboratory.
• Routine maintenance is carried out on all instruments according to manufacturers' instructions. • The ESU is contracted to respond to breakdowns within 48 hours. • Data collection is automated by the MONNET system at KCL. • Automatic and manual data validation is followed by rigorous ratification procedures. • Research into particulate mass, chemical composition and speciation continues at NPL under
the Department for Business Innovation and Skills (BIS) Chem-Bio Programme. Data quality circle meetings are held at least annually to review the data. This may lead to tracking back through the measurements and analytical procedures to confirm the validity of specific measurements. Other measurements made in this monitoring programme and in other Defra monitoring programmes will also be used to check the validity of the measurements. 3.1 SCHEDULED INSTRUMENT SERVICE AND CALIBRATION The 2025 Partisols are serviced twice yearly by the ESU, Air Monitors. The service procedure includes replacing old or worn parts, temperature and flow calibrations, leak tests and pump refurbishment. The services completed during 2010 are indicated in Table 3-1. Table 3-1 Equipment services completed on 2010 for the 2025 Partisols
Site Service 1 Service 2 Harwell 4th June 2010 15th September 2010 North Kensington 4th February 2010 13th October 2010 Marylebone Road 24th February 2010 3rd November 2010 2 NPL report AS 63 “2010 Annual Report for the UK Black Carbon Network”, D. Butterfield, S. Beccaceci, B. Sweeney, M. Williams, G. Fuller, D. Green, A. Grieve, August 2011

NPL Report AS 65
7
Since January 2009, the 3022A and 3775 CPCs have been serviced and calibrated at NPL. NPL received ISO 17025 accreditation for this calibration in 2008. Since January 2010 the SMPS instruments have also been serviced and calibrated at NPL. Table 3-2 Annual CPC/SMPS service and calibration dates. (*) Only ‘as found’ calibration.
Site 2009 service 2010 service 2011 service Birmingham March 09 January 10 March 11 North Kensington March 09 February 10 January 11 Marylebone Road January 09(*) February 10 February 11 Harwell March 09 January 10 March 11 4 NETWORK DATA 4.1 INSTRUMENT PERFORMANCE AND CONCENTRATION DATA The following sections discuss the different measurements made in the monitoring programme. The concentration data are also presented in a graphical format and unusual or interesting occurrences are noted and discussed. Annual ratified data from 2010 will be provided to Defra’s UK-AIR (http://uk-air.defra.gov.uk/) and will be used to form the basis of future topic reports, produced in collaboration with the University of Birmingham. 4.2 INORGANIC ANIONS
4.2.1 Partisol 2025 measurements (PM10)
Daily measurements of particulate sulphate, nitrate and chloride in the PM10 fraction were made at 3 sites during 2010 (Harwell, North Kensington and Marylebone Road). The extracts from the filters exposed were analysed by ion chromatography at NPL. The filter extracts are analysed for sulphate, as required by Defra, and also for nitrate and chloride. Monthly data capture rates for the Partisol 2025 instruments in 2010 are given in Table 4-1. The data capture in December was low at Harwell because of failure of the pump and a short circuit between the microswitch controlling the shuttle arm and the control board. The instrument was eventually taken away for repair in early January 2011. The measurements of particulate sulphate, chloride and nitrate concentrations made in 2010 are displayed in Figure 4-1, 4-2 and 4-3. Very high chloride concentrations were found on 26th and 27th December at Marylebone Road. A similar episode occurred in December 2009 at the same site. Both periods were characterised by snowy and very cold weather that caused formation of ice on the road. The high concentrations are thought to be due to the resuspension of salt from the ground.

NPL Report AS 65
8
Table 4-1 Monthly Data Capture for the Partisol 2025 Samplers during 2010
Site Harwell North Kensington Marylebone Rd
January 2010 100% 97% 90% February 2010 86% 89% 89% March 2010 100% 97% 90% April 2010 100% 93% 100% May 2010 81% 94% 87% June 2010 87% 93% 90% July 2010 94% 100% 94% August 2010 100% 97% 100% September 2010 93% 100% 100% October 2010 90% 94% 97% November 2010 77% 100% 100% December 2010 29% 81% 100% Average 86% 95% 95%

NPL Report AS 65
9
01/01/2010
01/02/2010
01/03/2010
01/04/2010
01/05/2010
01/06/2010
01/07/2010
01/08/2010
01/09/2010
01/10/2010
01/11/2010
01/12/2010
0
2
4
6
8
10
12
Chl
orid
e / μ
g m
-3
Harwell
01/01/2010
01/02/2010
01/03/2010
01/04/2010
01/05/2010
01/06/2010
01/07/2010
01/08/2010
01/09/2010
01/10/2010
01/11/2010
01/12/2010
0
2
4
6
8
10
12
Chl
orid
e / μ
g m
-3
North Kensington
01/01/2010
01/02/2010
01/03/2010
01/04/2010
01/05/2010
01/06/2010
01/07/2010
01/08/2010
01/09/2010
01/10/2010
01/11/2010
01/12/2010
0
2
4
6
8
10
12
Chl
orid
e / μ
g m
-3
Marylebone Road
Figure 4-1 Partisol PM10 Chloride concentrations at Network sites in 2010

NPL Report AS 65
10
01/01/2010
01/02/2010
01/03/2010
01/04/2010
01/05/2010
01/06/2010
01/07/2010
01/08/2010
01/09/2010
01/10/2010
01/11/2010
01/12/2010
0
5
10
15
20
25
30N
itrat
e / μ
g m
-3Harwell
01/01/2010
01/02/2010
01/03/2010
01/04/2010
01/05/2010
01/06/2010
01/07/2010
01/08/2010
01/09/2010
01/10/2010
01/11/2010
01/12/2010
0
5
10
15
20
25
30
Nitr
ate
/ μg
m-3
North Kensington
01/01/2010
01/02/2010
01/03/2010
01/04/2010
01/05/2010
01/06/2010
01/07/2010
01/08/2010
01/09/2010
01/10/2010
01/11/2010
01/12/2010
0
5
10
15
20
25
30
Nitr
ate
/ μg
m-3
Marylebone Road
Figure 4-2 Partisol PM10 Nitrate concentrations at Network sites in 2010

NPL Report AS 65
11
01/01/2010
01/02/2010
01/03/2010
01/04/2010
01/05/2010
01/06/2010
01/07/2010
01/08/2010
01/09/2010
01/10/2010
01/11/2010
01/12/2010
0
2
4
6
8
10
12
14
16Su
lpha
te /
μg m
-3Harwell
01/01/2010
01/02/2010
01/03/2010
01/04/2010
01/05/2010
01/06/2010
01/07/2010
01/08/2010
01/09/2010
01/10/2010
01/11/2010
01/12/2010
0
2
4
6
8
10
12
14
16
Sul
phat
e / μ
g m
-3
North Kensington
01/01/2010
01/02/2010
01/03/2010
01/04/2010
01/05/2010
01/06/2010
01/07/2010
01/08/2010
01/09/2010
01/10/2010
01/11/2010
01/12/2010
0
2
4
6
8
10
12
14
16
Sul
phat
e / μ
g m
-3
Marylebone
Figure 4-3 Partisol PM10 Sulphate Concentrations at Network sites in 2010

NPL Report AS 65
12
4.2.2 Automatic nitrate analyser (PM2.5)
The automatic daily measurements of particulate nitrate at Marylebone Road 2010 are displayed in Figure 4-4 and compared with PM10 Partisol nitrate concentrations.
Monthly data capture rates for the time the analyser was operative are presented in Table 4-2.
Table 4-2 Monthly Data Capture in 2010 for the Automatic Nitrate Instrument at Marylebone Road. Note: (*) denotes the data capture for the time the analyser was operative until it finally failed
Site Marylebone Rd January 84% February 38% March 100% April 94% May 100% June 89% July 99%(*)
August --- September --- October --- November --- December --- Average 86%
01/01/2010 01/03/2010 01/05/2010 01/07/2010 01/09/2010 01/11/20100
5
10
15
20
Auto
mat
ic P
M2.
5 / μ
g m
-3
01/01/2010 01/03/2010 01/05/2010 01/07/2010 01/09/2010 01/11/20100
5
10
15
20
Par
tisol
PM
10 /
μg m
-3
Figure 4-4 Comparison between daily automatic nitrate measurements (PM2.5) and Partisol measurements (PM10) at Marylebone Road in 2010.

NPL Report AS 65
13
4.2.3 Comparison of Automatic Nitrate (PM2.5) and Partisol 2025 Nitrate (PM10)
Average daily concentrations of particulate nitrate have been derived from the hourly measurements made by the automatic analyser and these have been compared with the filter measurements of particulate nitrate.
Figure 4-5 presents a scatter plots between the two methods. Only those days for which there are 20 or more hours of data have been included in the analysis
0 5 10 15 20 250
5
10
15
20
25
Parti
sol P
M10
(μg/
m3 )
Automatic PM2.5 (μg/m3)
Figure 4-5 Scatter plot of Nitrate concentrations in 2010 at Marylebone Road
Differences in the two measurement methods are expected to give rise to discrepancies in the results, and these are described in more detail in the NPL report on measurement uncertainty. As the measurements are from different PM size fractions (Partisol – PM10, automatic nitrate – PM2.5), a 1:1 correlation is not expected. Also, more sampling losses of volatile nitrate are expected from the daily Partisol method. 4.3 EC/OC MEASUREMENTS (PM10)
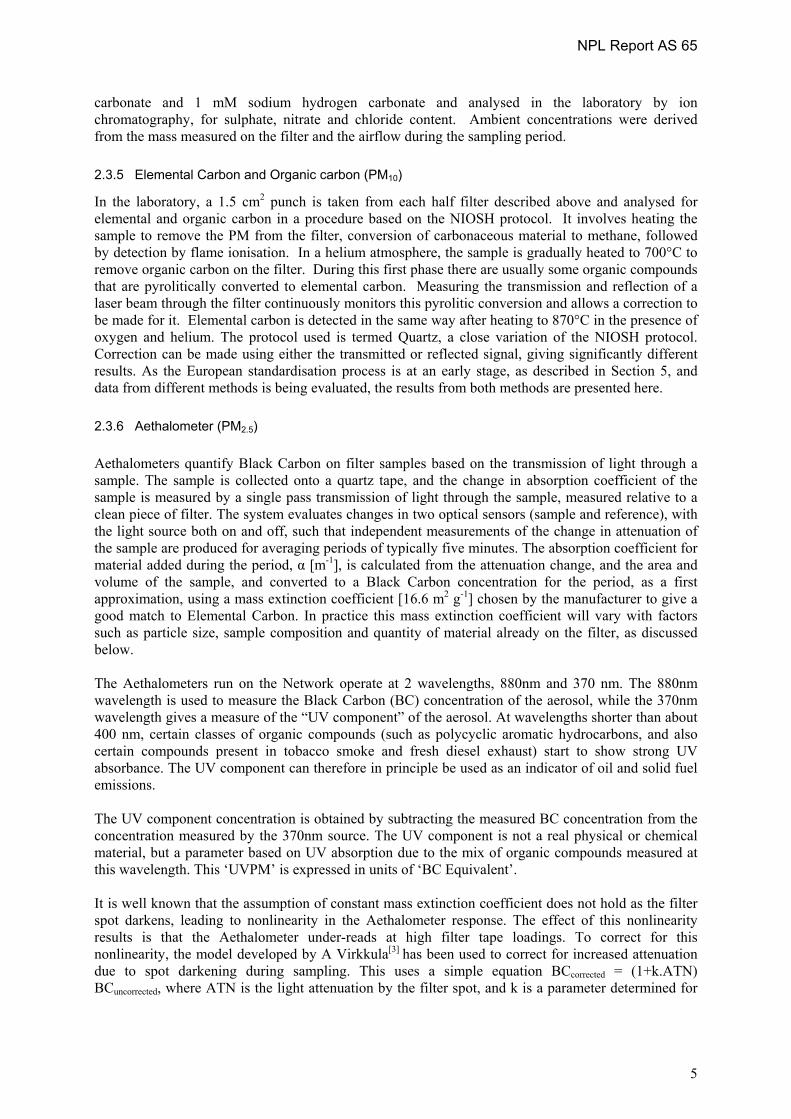
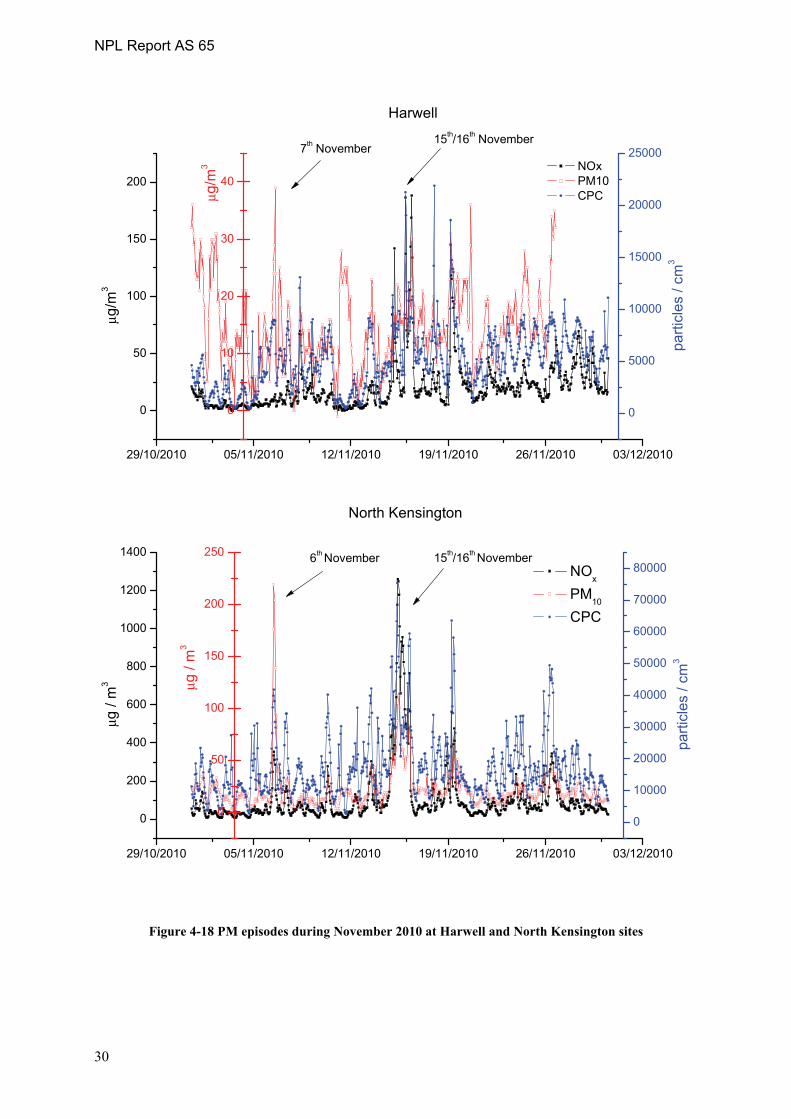
4.3.1 Elemental Carbon and Organic Carbon The filter measurements of EC, OC and TC (Total Carbon – the sum of EC and OC) made in 2010 are displayed in Figures 4-6, 4-7 and 4-8 for the 3 sites. Concentrations for EC and OC are shown for thermal/optical transmission (TOT) and thermal/optical reflectance (TOR) methods. Because the optical correction simply determines the split of TC into EC and OC, TC is the same for both methods. Data are reported as the mass of carbon atoms per unit volume of air. Reasonably high concentrations were found for both organic and elemental carbon at North Kensington on 15th and 16th November. Evidently a widespread moderate pollution event occurred in the night between 15th and 16th November across London, as high levels of PM10 and NO2 were also recorded, mainly due to poor dispersion of air pollution emitted from within London. A change in wind direction and increase in wind strength brought a rapid dispersion of air pollution across the region. Fireworks and wood smoke on Bonfire night (mainly on the night of Saturday 6th November)

NPL Report AS 65
14
seem to have affected only the organic carbon part of the particulate. These episodes are less notable at Marylebone Road.

NP
L R
epor
t AS
65
15
01/01/2010
01/02/2010
01/03/2010
01/04/2010
01/05/2010
01/06/2010
01/07/2010
01/08/2010
01/09/2010
01/10/2010
01/11/2010
01/12/2010
0246810121416182022H
arw
ell -
OC
T
concentrations (μg/m3)
01/01/2010
01/02/2010
01/03/2010
01/04/2010
01/05/2010
01/06/2010
01/07/2010
01/08/2010
01/09/2010
01/10/2010
01/11/2010
01/12/2010
0246810121416182022H
arw
ell -
OC
R
concentrations (μg/m3)
01/01/2010
01/02/2010
01/03/2010
01/04/2010
01/05/2010
01/06/2010
01/07/2010
01/08/2010
01/09/2010
01/10/2010
01/11/2010
01/12/2010
0246810121416182022
6th/7
th N
ovem
ber
15th/1
6th N
ovem
ber
Mar
ylebo
ne R
oad
- OC
T
concentrations (μg/m3)
01/01/2010
01/02/2010
01/03/2010
01/04/2010
01/05/2010
01/06/2010
01/07/2010
01/08/2010
01/09/2010
01/10/2010
01/11/2010
01/12/2010
0246810121416182022
6th/7
th N
ovem
ber
15th/1
6th N
ovem
ber
Mar
ylebo
ne R
oad
- OC
R
concentrations (μg/m3)
01/01/2010
01/02/2010
01/03/2010
01/04/2010
01/05/2010
01/06/2010
01/07/2010
01/08/2010
01/09/2010
01/10/2010
01/11/2010
01/12/2010
0246810121416182022N
orth
Ken
sing
ton
- OC
T
concentrations (μg/m3)
15th/1
6th N
ovem
ber
6th/7
th N
ovem
ber
01/01/2010
01/02/2010
01/03/2010
01/04/2010
01/05/2010
01/06/2010
01/07/2010
01/08/2010
01/09/2010
01/10/2010
01/11/2010
01/12/2010
0246810121416182022
6th/7
th N
ovem
ber
15th/1
6th N
ovem
ber
Nor
th K
ensi
ngto
n - O
C R
concentrations (μg/m3)
Figu
re 4
-6 P
M10
Org
anic
Car
bon
conc
entr
atio
ns in
201
0 fo
r bo
th th
e tr
ansm
ittan
ce (T
) and
ref
lect
ance
(R) m
etho
ds
NP
L R
epor
t AS
65
16
01/01/2010
01/02/2010
01/03/2010
01/04/2010
01/05/2010
01/06/2010
01/07/2010
01/08/2010
01/09/2010
01/10/2010
01/11/2010
01/12/2010
02468101214161820H
arw
ell -
EC
T
concentrations (μg/m3)
01/01/2010
01/02/2010
01/03/2010
01/04/2010
01/05/2010
01/06/2010
01/07/2010
01/08/2010
01/09/2010
01/10/2010
01/11/2010
01/12/2010
02468101214161820H
arw
ell -
EC
R
concentrations (μg/m3)
01/01/2010
01/02/2010
01/03/2010
01/04/2010
01/05/2010
01/06/2010
01/07/2010
01/08/2010
01/09/2010
01/10/2010
01/11/2010
01/12/2010
02468101214161820M
aryle
bone
Roa
d - E
C T
concentrations (μg/m3)
01/01/2010
01/02/2010
01/03/2010
01/04/2010
01/05/2010
01/06/2010
01/07/2010
01/08/2010
01/09/2010
01/10/2010
01/11/2010
01/12/2010
02468101214161820M
aryle
bone
Roa
d - E
T R
concentrations (μg/m3)
01/01/2010
01/02/2010
01/03/2010
01/04/2010
01/05/2010
01/06/2010
01/07/2010
01/08/2010
01/09/2010
01/10/2010
01/11/2010
01/12/2010
02468101214161820N
orth
Ken
sing
ton
- EC
T
concentrations (μg/m3)
15th/1
6th N
ovem
ber
01/01/2010
01/02/2010
01/03/2010
01/04/2010
01/05/2010
01/06/2010
01/07/2010
01/08/2010
01/09/2010
01/10/2010
01/11/2010
01/12/2010
02468101214161820
15th/1
6th N
ovem
ber
Nor
th K
ensi
ngto
n - E
C R
concentrations (μg/m3)
Figu
re 4
-7 P
M10
Ele
men
tal C
arbo
n co
ncen
trat
ions
in 2
010
for
both
the
tran
smitt
ance
(T) a
nd th
e re
flect
ance
(R) m
etho
ds

NPL Report AS 65
17
01/01/2010
01/02/2010
01/03/2010
01/04/2010
01/05/2010
01/06/2010
01/07/2010
01/08/2010
01/09/2010
01/10/2010
01/11/2010
01/12/2010
02468
10121416182022242628303234 Harwell
conc
entra
tion
(μg/
m3 )
01/01/2010
01/02/2010
01/03/2010
01/04/2010
01/05/2010
01/06/2010
01/07/2010
01/08/2010
01/09/2010
01/10/2010
01/11/2010
01/12/2010
02468
10121416182022242628303234 Marylebone Road
conc
entra
tion
(μg/
m3 )
01/01/2010
01/02/2010
01/03/2010
01/04/2010
01/05/2010
01/06/2010
01/07/2010
01/08/2010
01/09/2010
01/10/2010
01/11/2010
01/12/2010
2468
10121416182022242628303234 North Kensington
conc
entra
tion
(μg/
m3 )
Figure 4-8 PM10 Total Carbon concentrations in 2010
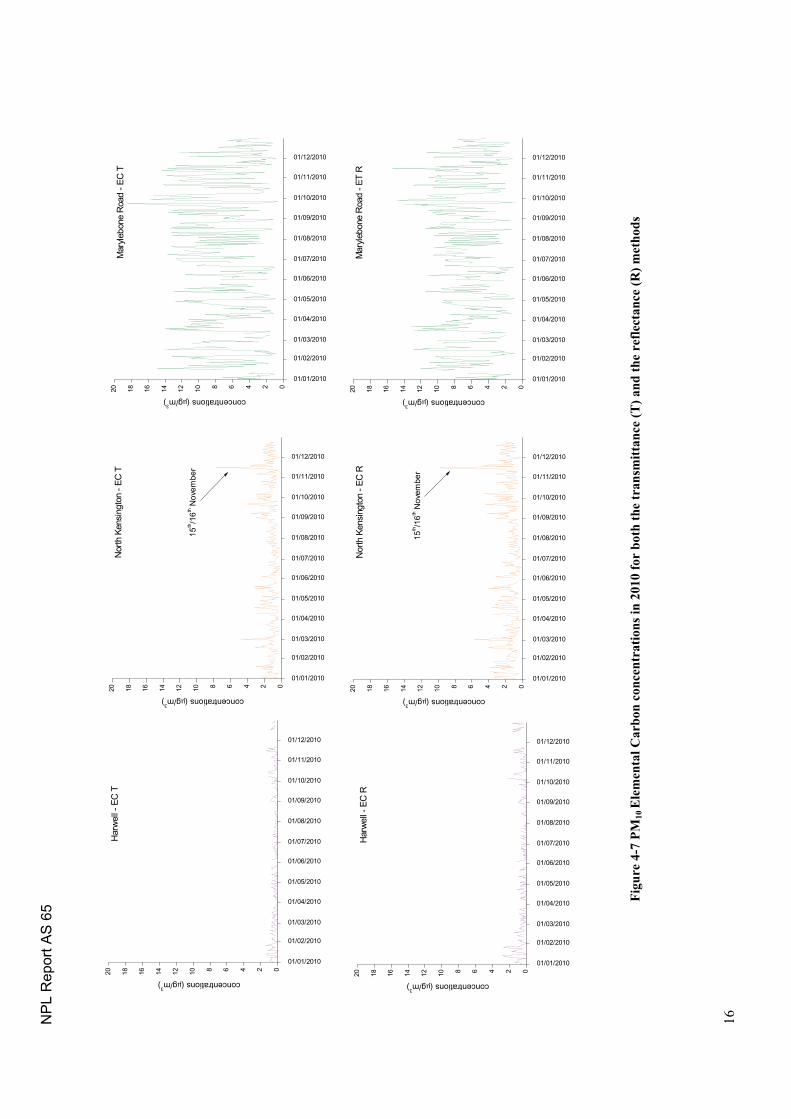
Figure 4-9 to 4-11 show scatter plots between the Reflectance and Transmittance data reported as μgC/cm2. The results are consistent with previous years.
NPL Report AS 65
18
0 2 4 6 8 10 12 14 16 18 20 22 240
5
10
15
20
25
Harwell Linear fit
OC
(R) /
μg
cm-2
OC (T) / μg cm-2
y = 0.8479 x + 0.6287R2 = 0.9716
0 1 2 3 4 5 60
1
2
3
4
5
6Harwell
Linear fit
EC
(R) /
μg
cm-2
EC (T) / μg cm-2
y = 1.4680 x -0.1133R2 = 0.7801
Figure 4-9 Scatter plots of OC and EC measurements for TOR and TOT methods at Harwell

NPL Report AS 65
19
0 10 20 30 40 500
10
20
30
40
50
Marylebone Road Linear fit
OC
(R) /
μg
cm-2
OC (T) / μg cm-2
y = 1.1020 x - 0.8440R2 = 0.8764
0 5 10 15 20 25 30 35
0
5
10
15
20
25
30
35Marylebone Road
Linear fit
EC
(R) /
μg
cm-2
EC (T) / μg cm-2
y = 0.7221 x +2.39106R2 = 0.92158
Figure 4-10 Scatter plots of OC and EC measurements for TOR and TOT methods at Marylebone Road

NPL Report AS 65
20
0 2 4 6 8 10 12 14 160
2
4
6
8
10
12
14
16
North Kensington Linear fit
OC
(R) /
μg
cm-2
OC (T) / μg cm-2
y = 0.8535 x + 0.6551R2 = 0.9921
0 5 10 15 20 25 30 35 400
5
10
15
20
25
30
35
40
North Kensington Linear fit
EC
(R) μ
g cm
-2
EC (T) μg cm-2
y = 1.3853 x - 0.2884R2 = 0.9122
Figure 4-11 Scatter plots of OC and EC measurements for TOR and TOT methods at North Kensington

NPL Report AS 65
21
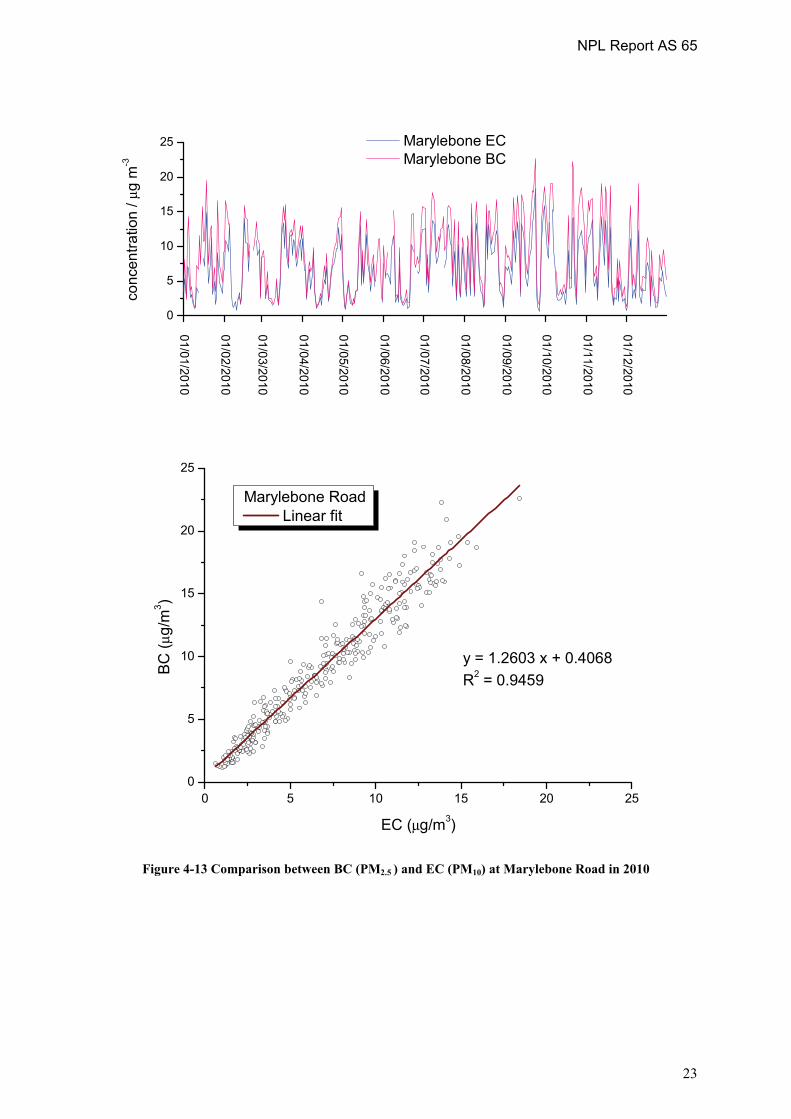
4.3.2 Comparison between elemental carbon and black carbon
In principle, the chemically based Elemental Carbon metric and the optically based Black Carbon metric both quantify the “soot” component of airborne particles. Co-located measurements of Black Carbon (PM2.5) have been made at North Kensington and Marylebone Road, using aethalometers, as part of the Defra Black Carbon Network, and at Harwell as part of this Network. The different size fraction is not expected to have a large effect, as soot from combustion processes is expected to be below 2.5 μm in size. The time series of the elemental carbon (EC), obtained by using TOT method, and black carbon (BC) measurements, by using aethalometers, have been compared and are shown in Figures 4-12, 4-13 and 4-14, as well as scatter plots. The comparison at North Kensington and Marylebone Road sites shows a good agreement, although the BC measurements are generally higher than the EC measurements by 15-25%. The agreement at Harwell is less good, and it is notable that a high number of zero concentrations are reported for EC whereas the BC does not drop to zero. This is consistent with the observation that thermo-optical OC/EC measurements using the Quartz protocol tend to under-read EC (and hence over-read OC), whether either transmittance or reflectance is used for the pyrolysis correction, and this effect is significant at rural sites like Harwell3.
3 An evaluation of measurement methods for organic, elemental and black carbon in ambient air monitoring sites¸ P. Quincey, D. Butterfield, D. Green, M. Coyle, J. Neil Cape, Atmospheric Environment, 43 (32) 5085 – 5091, 2009

NPL Report AS 65
22
01/01/2010
01/02/2010
01/03/2010
01/04/2010
01/05/2010
01/06/2010
01/07/2010
01/08/2010
01/09/2010
01/10/2010
01/11/2010
01/12/2010
0.0
0.5
1.0
1.5
2.0
2.5
conc
entra
tion
/ μg
m-3
Harwell EC Harwell BC
0.0 0.5 1.0 1.5 2.0 2.50.0
0.5
1.0
1.5
2.0
2.5
Harwell Linear fit
BC (μ
g/m
3 )
EC (μg/m3)
y = 0.8858 x + 0.203R2 = 0.5546
Figure 4-12 Comparison between BC (PM2.5 ) and EC (PM10) at Harwell in 2010
NPL Report AS 65
23
01/01/2010
01/02/2010
01/03/2010
01/04/2010
01/05/2010
01/06/2010
01/07/2010
01/08/2010
01/09/2010
01/10/2010
01/11/2010
01/12/2010
0
5
10
15
20
25co
ncen
tratio
n / μ
g m
-3
Marylebone EC Marylebone BC
0 5 10 15 20 250
5
10
15
20
25
Marylebone Road Linear fit
BC (μ
g/m
3 )
EC (μg/m3)
y = 1.2603 x + 0.4068R2 = 0.9459
Figure 4-13 Comparison between BC (PM2.5 ) and EC (PM10) at Marylebone Road in 2010

NPL Report AS 65
24
01/01/2010
01/02/2010
01/03/2010
01/04/2010
01/05/2010
01/06/2010
01/07/2010
01/08/2010
01/09/2010
01/10/2010
01/11/2010
01/12/2010
0
2
4
6
8
10
12
conc
entra
tion
/ μg
m-3
North Ken EC North Ken BC
0 2 4 6 8 10 120
2
4
6
8
10
12
North Kensington Linear fit
BC
(μg/
m3 )
EC (μg/m3)
y = 1.1619 x + 0.0288R2 = 0.7339
Figure 4-14 Comparison between BC (PM2.5 ) and EC (PM10) at North Kensington in 2010

NPL Report AS 65
25
4.4 PARTICLE NUMBER AND SIZE DISTRIBUTION
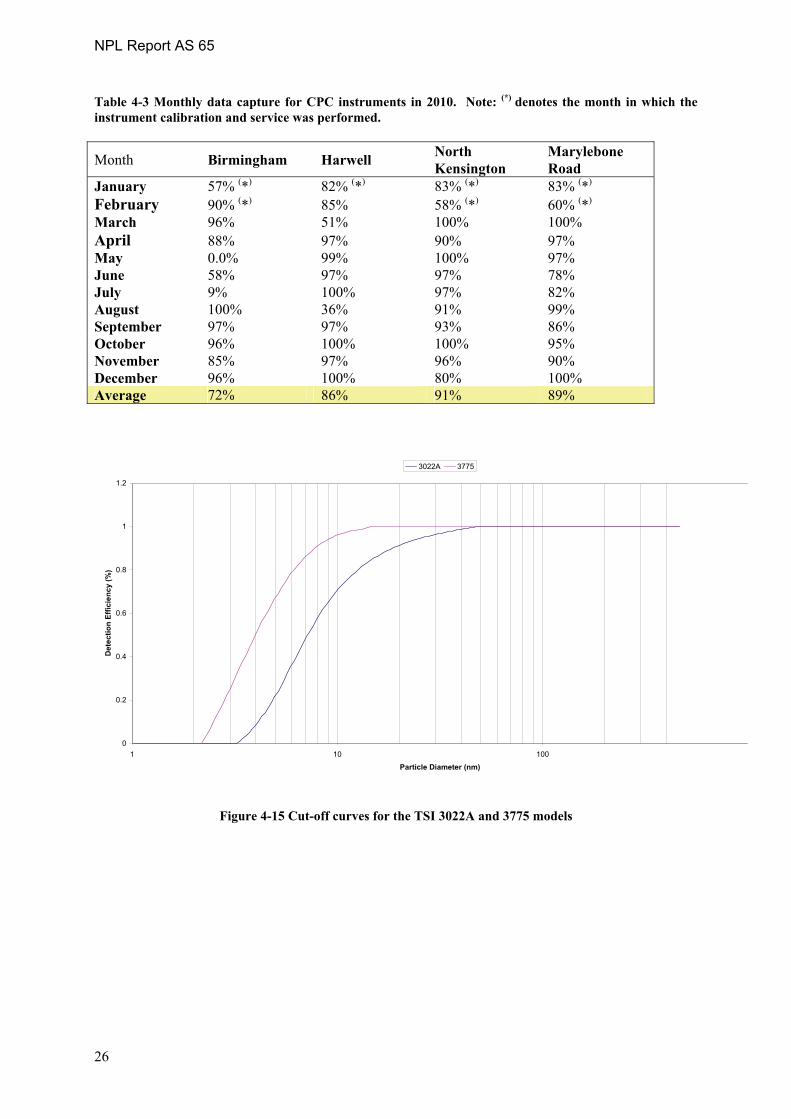
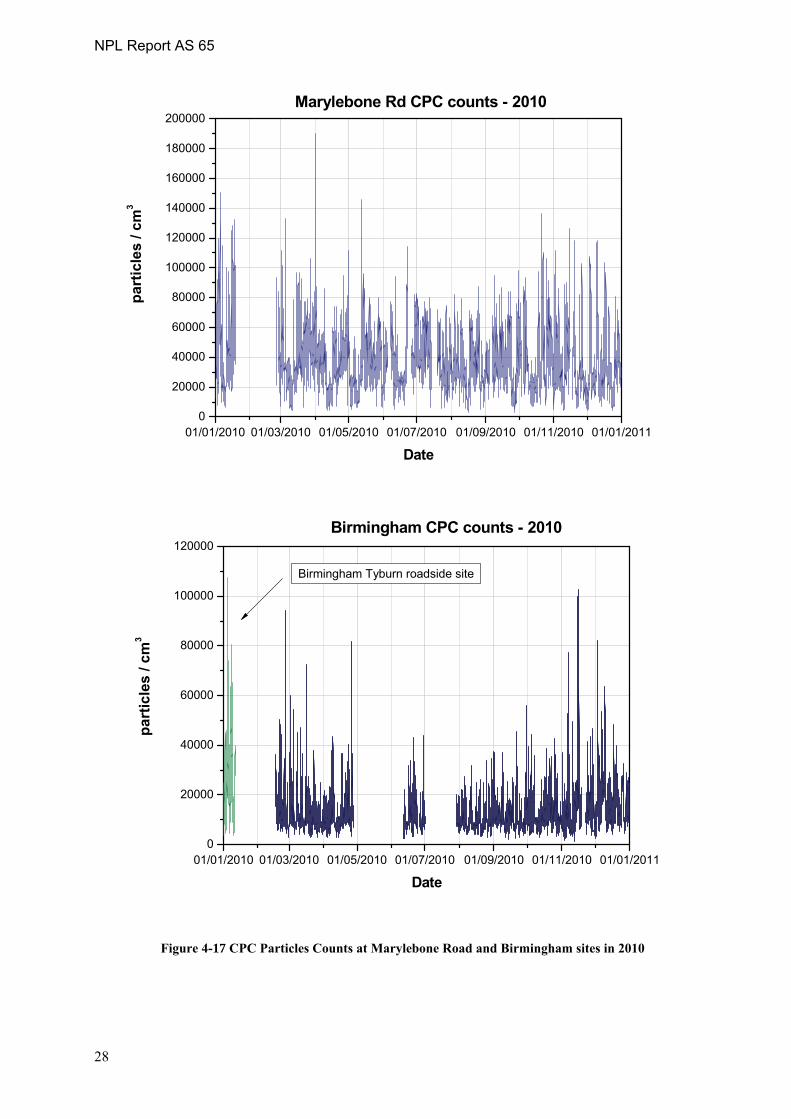
4.4.1 Particle Number Concentrations (CPC) Time series of hourly particle number concentrations (between about 7nm and several microns in diameter) measured at network sites during 2010 are shown in Figure 4-16 and 4-17. The following should be noted: Birmingham –The instrument was removed from the Birmingham Centre site in January 2009, as this site was closing, and installed at the Birmingham Tyburn Roadside site. It was then moved to the Birmingham Tyburn (urban background) site in February 2010, after calibration at NPL, for better continuity with the previous site in Birmingham centre. Concentrations in January 2010 refer to Birmingham Roadside site. Serious communication problems with the laptop on site did not allow the observation of instrument failures, which caused two gaps in the data between the end of April and the end of July. Harwell – The instrument was removed in January for calibration at NPL. In August the pump failed and the CPC was sent to NPL for repair. North Kensington – The instrument was removed from site in January 2010 for calibration at NPL. The CPC did not have major problems for the rest of the year. Marylebone Road – The instrument was removed from site in January 2010 for calibration at NPL. The CPC did not have major problems for the rest of the year. Monthly data capture rates for the CPC instruments during 2010 are displayed in Table 4-3. Each instrument is removed from the site for a full service and calibration annually. This scheduled maintenance is expected to take three weeks, to include draining and drying, transit time, full service and re-installation. In the month(s) where the CPC was serviced, the data capture quoted in the table takes into account the scheduled downtime, and is denoted with an asterisk. There have been generally fewer operational problems with the 3022A CPCs in 2010 than in previous years, as shown by the higher data capture, especially for the CPC at the Marylebone Road site. This can be attributed, at least in part, to the introduction of the new inlet systems, including drying units and the PM1 inlets, which prevent contamination from water and large particles. Also, the LSOs have been provided with a HEPA (High Efficiency Particle Attenuator) filter and a Gilibrator flow meter to perform a leak check and a flow measurement of the CPC and SMPS instruments during their usual fortnightly visit. Although these flow results are not used in the ratification of the data, they are a good means to assure the flow is stable and reasonable. Measuring the flow can detect blockage or butanol flooding. This has been found to be a quicker way to diagnostic a fault in the instruments and consequently to improve the quality of the data and data capture. Any anomaly is immediately reported to King’s College London (ERG) and, when necessary, the analysers are removed from site to be sent to NPL or TSI for repair. However, it should be noted that the TSI 3022A is an old model that has been discontinued by TSI. Some of the 3022A Network CPCs have been working since 2000 and the network would benefit from these being replaced by new models. Some new models have a much higher concentration range in counting (as opposed to photometric) mode, which would make compliance with the draft CEN Technical Specification easier (see Section 5.2). The TSI 3375 CPC model, which is the one used in the SMPS system, could be a suitable replacement of the 3022A model, though with its standard parameters it has a lower size cut-off than the 3022A (as shown on the Figure 4-15), which at ~7nm is the value currently in the draft CEN Technical Specification. It is generally more reliable, and laboratory measurements at NPL show that the flow is 10 times more stable than the old 3022A mode.
NPL Report AS 65
26
Table 4-3 Monthly data capture for CPC instruments in 2010. Note: (*) denotes the month in which the instrument calibration and service was performed.
Month Birmingham Harwell North Kensington
Marylebone Road
January 57% (*) 82% (*) 83% (*) 83% (*) February 90% (*) 85% 58% (*) 60% (*) March 96% 51% 100% 100% April 88% 97% 90% 97% May 0.0% 99% 100% 97% June 58% 97% 97% 78% July 9% 100% 97% 82% August 100% 36% 91% 99% September 97% 97% 93% 86% October 96% 100% 100% 95% November 85% 97% 96% 90% December 96% 100% 80% 100% Average 72% 86% 91% 89%
0
0.2
0.4
0.6
0.8
1
1.2
1 10 100
Particle Diameter (nm)
Det
ectio
n Ef
ficie
ncy
(%)
3022A 3775
Figure 4-15 Cut-off curves for the TSI 3022A and 3775 models

NPL Report AS 65
27
01/01/2010 01/03/2010 01/05/2010 01/07/2010 01/09/2010 01/11/2010 01/01/20110
5000
10000
15000
20000
25000
30000
35000
40000
part
icle
s / c
m3
Date
Harwell CPC counts - 2010
01/01/2010 01/03/2010 01/05/2010 01/07/2010 01/09/2010 01/11/2010 01/01/20110
10000
20000
30000
40000
50000
60000
70000
80000
part
icle
s / c
m3
Date
North Kensington CPC counts - 2010
Figure 4-16 CPC Particles Counts at Harwell and North Kensington sites in 2010
NPL Report AS 65
28
01/01/2010 01/03/2010 01/05/2010 01/07/2010 01/09/2010 01/11/2010 01/01/20110
20000
40000
60000
80000
100000
120000
140000
160000
180000
200000
part
icle
s / c
m3
Date
Marylebone Rd CPC counts - 2010
01/01/2010 01/03/2010 01/05/2010 01/07/2010 01/09/2010 01/11/2010 01/01/20110
20000
40000
60000
80000
100000
120000
part
icle
s / c
m3
Date
Birmingham CPC counts - 2010
Birmingham Tyburn roadside site
Figure 4-17 CPC Particles Counts at Marylebone Road and Birmingham sites in 2010

NPL Report AS 65
29
Figure 4-18 and 4-19 aim to show the PM events occurred in November 2010, described in Section 4.3.1, at all the Network sites. The fireworks on the Bonfire night (5th November – 7th November) significantly affected the PM10 concentrations, especially at London North Kensington (a typical residential area), but less so the number concentration. This indicates that particles emitted during the fireworks are mainly in the large size fraction of the PM.
NPL Report AS 65
30
29/10/2010 05/11/2010 12/11/2010 19/11/2010 26/11/2010 03/12/2010
0
50
100
150
200
μg/
m3
μg/
m3
NOx PM10 CPC
Harwell
0
10
20
30
40
0
5000
10000
15000
20000
25000
par
ticle
s / c
m3
7th November15th/16th November
29/10/2010 05/11/2010 12/11/2010 19/11/2010 26/11/2010 03/12/2010
0
200
400
600
800
1000
1200
1400
μg
/ m3
μg
/ m3
NOx
PM10
CPC
0
50
100
150
200
250
0
10000
20000
30000
40000
50000
60000
70000
80000
par
ticle
s / c
m3
15th/16th November6th November
North Kensington
Figure 4-18 PM episodes during November 2010 at Harwell and North Kensington sites

NPL Report AS 65
31
29/10/2010 05/11/2010 12/11/2010 19/11/2010 26/11/2010 03/12/2010
0
200
400
600
800
1000
1200
1400
1600
μg/
m3
μg/
m3
NOx PM10 CPC
Marylebone Road
15th/16th November6th/7th November
0
20
40
60
80
100
120
140
0
20000
40000
60000
80000
100000
120000
140000
par
ticle
s / c
m3
29/10/2010 05/11/2010 12/11/2010 19/11/2010 26/11/2010 03/12/2010
0
300
600
900
1200
1500
μg/
m3
NOx
PM10
CPC
15th/16th November5th/6th November
Birmingham
0
20
40
60
80
100
120
μg/
m3
0
20000
40000
60000
80000
100000
120000
par
ticle
s / c
m3
Figure 4-19 PM episodes during November 2010 at Marylebone Road and Birmingham

NPL Report AS 65
32
A scatter plot has been done between monthly averages of NOx concentrations and monthly averages of number concentrations at Marylebone Road (Figure 4-20). Although the two measurements are not directly comparable, a correlation can still been seen between the two datasets. Ambient concentrations for particle counts and NOx in a roadside site are strongly correlated to fuel emission, especially diesel. This correlation is lost at the rural Harwell site (see Figure 4-21) where there are several episodes of very low NOx concentrations but still high number concentrations.
Marylebone Road
R2 = 0.6887
30000.0
32000.0
34000.0
36000.0
38000.0
40000.0
42000.0
44000.0
200 220 240 260 280 300 320 340 360
NOx (ug/m3)
CP
C (p
artic
les/
cm3 )
Figure 4-20 Comparison between monthly averages of NOx concentrations and monthly averages of number concentrations at Marylebone Road in 2010
Harwell
R2 = 0.0051
4000.0
4500.0
5000.0
5500.0
6000.0
6500.0
7000.0
0 5 10 15 20 25 30 35 40
NOx (ug/m3)
CP
C (p
artic
les/
cm3 )
Figure 4-21 Comparison between monthly averages of NOx concentrations and monthly averages of number concentrations at Harwell in 2010

NPL Report AS 65
33
4.4.2 Particle number and size distributions (SMPS)
The SMPS instruments generate particle size spectra between about 16 nm and 605 nm.
The following should be noted: North Kensington – The instrument was removed in January for service and calibration at NPL. The instrument did not have any major problems for the rest of the year.
Harwell – The instrument was removed in January for service and calibration at NPL. The DMA had a fault in March which was repaired at TSI.
Marylebone Road – The instrument was removed from site in January for service and calibration at NPL. The instrument did not have any major problems for the rest of the year.
Monthly data capture rates for the SMPS instruments during 2009 are displayed in Table 4-4. Table 4-4 Monthly data capture for SMPS instruments during 2010. Note: (*) denotes the month in which the instrument service was performed.
Month Harwell North Kensington
Marylebone Road
January 39% (*) 83% (*) 0 % February 50% (*) 59% (*) 85% (*) March 0% 91% 99% April 58% 59% 100% May 100% 91% 94% June 100% 100% 70% July 97% 79% 78% August 97% 89% 92% September 75% 99% 62% October 96% 96% 80% November 100% 96% 98% December 90% 93% 97% Average 75% 87% 80%
The production of data from SMPS instruments is a complicated process, summarised schematically in Figure 4-22. Many stages of data processing are carried out by proprietary manufacturer’s software to convert the raw data (number count versus Differential Mobility Analyser voltage) into the final data (number concentration versus particle size). While the size axis can be reliably calibrated using certified spheres, the number concentration axis, and hence both the scale and shape of the size distribution, is much less amenable to direct evaluation. Some elements of the software in the current TSI instruments (Model 3936L75) are more transparent than for the previous TSI 3071 model used in the Network (in 2005). The multiple charge correction and diffusion loss correction software can be switched on and off by the user. The data collection software has been upgraded to record these user definable settings. Both of these corrections are used in the data reported here. The effect of the diffusion loss and multiple charge corrections can be seen in Figure 4-23. The uncorrected spectrum is shown in blue. The effects of the multiple charge correction and diffusion loss corrections are shown in red and orange, respectively. The purple curve is the combined effect of

NPL Report AS 65
34
the two corrections. The overall effect of the two corrections is to increase the particle number counts at smaller sizes and to increase the total particle count4. It is clear that great care needs to be applied when comparing SMPS data from similar instruments on different settings, and even more when comparing SMPS data from different instruments.
Raw data Detected particle numbers
at different voltages
Particle size / electrical mobility
relationship
Transfer function:which set of electrical
mobilities will reach the detector through this
design of DMA?
Charge distribution function:
what fraction of particles at each size is expected to be
charged or multiply-charged ?
Instrument response function: expected particle numbers emerging from DMA at a given voltage as a function
of particle size
Data inversion
Provisional particle size distribution
Final particle size
distribution
Correction for diffusive losses at
smaller sizes
Correction for detector efficiency
at smaller sizes
Figure 4-22 Schematic of the internal data processing of SMPS instrument in the Network
4 EURAMET Project 1027, Comparison of nanoparticle number concentration and size distribution

NPL Report AS 65
35
0.00E+00
5.00E+03
1.00E+04
1.50E+04
2.00E+04
2.50E+04
3.00E+04
3.50E+04
4.00E+04
10 100Diameter (nm)
dN/d
logD
pNo Corrections Charge Correction Diffusion Correction Both Corrections
Figure 4-23 Effect of the multiple charge, the diffusion loss and the combined correction in the SMPS size
spectrum
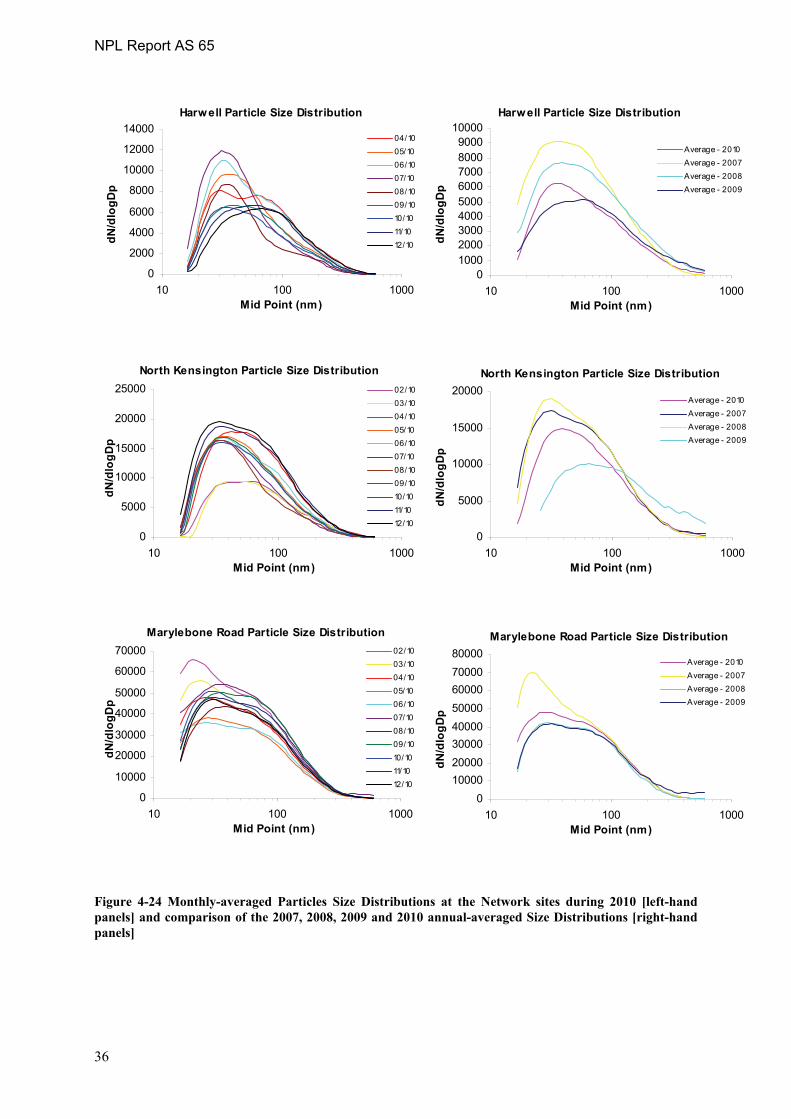
The counts in each particle size bin measured during 2010 are presented as monthly averages in the left-hand panels of Figure 4-24 and as an annual average in the right-panel (only November and December were available for North Kensington in 2007). It can be seen that the size distributions at Harwell during the warm months are characterised by higher nucleation modes (dp < 50 nm). Unlike urban sites, where smaller particles are emitted by anthropogenic sources, in rural sites like Harwell high number concentrations of particles of this size are due to nucleation events. These episodes have been observed at Harwell previously and are likely to occur during warm days with high solar radiation when clean cool arctic or polar maritime air masses arrive in the UK5,6. In late 2009 the PM1 inlets and the NPL drying units were installed at all sites, following the recommendations of the EUSAAR project. No significative difference can currently be seen in the shape of the size distributions between 2010 and previous years. However, as for the stand-alone CPCs, a better performance of the instruments has been observed in 2010, with fewer blockages in the SMPS impactors and less contamination in the CPCs. The annual-averaged size distribution at Marylebone Road in 2007 shows higher concentration for particles with diameter less than 50 nm. This aspect could be related with the drop in concentration observed after 2007 in the particle counts measured by the stand-alone CPC, which is discussed further in Section 4.6.2.
5 Factors Influencing New Particle Formation at the Rural Site, Harwell, United Kingdom, A.Charron, W. Birmili and R.M. Harrison, J. Geophys. Res., 112, (2007). D14210, doi:10.1029/2007JD008425 6 Fingerprinting particle origins according to their size distribution at a UK rural site, A. Charron, W. Birmili, R.M. Harrison, J. Geophys. Res., 113, (2007), D07202, DOI : 10.1029/2007jd008562
NPL Report AS 65
36
Harwell Particle Size Distribution
0
2000
4000
6000
8000
10000
12000
14000
10 100 1000Mid Point (nm)
dN/d
logD
p
04/1005/1006/1007/1008/1009/1010/1011/1012/10
Marylebone Road Particle Size Distribution
0
10000
20000
30000
40000
50000
60000
70000
10 100 1000Mid Point (nm)
dN/d
logD
p
02/1003/1004/1005/1006/1007/1008/1009/1010/1011/1012/10
Harwell Particle Size Distribution
0100020003000400050006000700080009000
10000
10 100 1000Mid Point (nm)
dN/d
logD
p
Average - 2010Average - 2007Average - 2008Average - 2009
Marylebone Road Particle Size Distribution
01000020000300004000050000600007000080000
10 100 1000Mid Point (nm)
dN/d
logD
p
Average - 2010Average - 2007Average - 2008Average - 2009
North Kensington Particle Size Distribution
0
5000
10000
15000
20000
25000
10 100 1000Mid Point (nm)
dN/d
logD
p
02/1003/1004/1005/1006/1007/1008/1009/1010/1011/1012/10
North Kensington Particle Size Distribution
0
5000
10000
15000
20000
10 100 1000Mid Point (nm)
dN/d
logD
p
Average - 2010Average - 2007Average - 2008Average - 2009
Figure 4-24 Monthly-averaged Particles Size Distributions at the Network sites during 2010 [left-hand panels] and comparison of the 2007, 2008, 2009 and 2010 annual-averaged Size Distributions [right-hand panels]

NPL Report AS 65
37
4.4.3 SMPS versus CPC data
Total integrated particles counts from the SMPS analysers have been compared with the CPC counts and scatter plots are presented in Figures 4-25, 4-26 and 4-27. An example of the historical relationship of the ratios of the CPC to SMPS total counts is shown in Table 4-5.
01/01/2010 01/03/2010 01/05/2010 01/07/2010 01/09/2010 01/11/2010 01/01/20110
10000
20000
30000
40000
50000 Harwell SMPS
parti
cles
/ cm
3
01/01/2010 01/03/2010 01/05/2010 01/07/2010 01/09/2010 01/11/2010 01/01/20110
10000
20000
30000
40000
50000 Harwell CPC
parti
cles
/ cm
3
Figure 4-25 CPC and SMPS time series at Harwell in 2010

NPL Report AS 65
38
01/01/2010 01/03/2010 01/05/2010 01/07/2010 01/09/2010 01/11/2010 01/01/20110
1000020000300004000050000600007000080000
North Kensington SMPS
parti
cles
/ cm
3
01/01/2010 01/03/2010 01/05/2010 01/07/2010 01/09/2010 01/11/2010 01/01/20110
1000020000300004000050000600007000080000
North Kensington CPCpa
rticl
es /
cm3
01/01/2010 01/03/2010 01/05/2010 01/07/2010 01/09/2010 01/11/2010 01/01/20110
50000
100000
150000
200000 Marylebone Rd SMPS
parti
cles
/ cm
3
01/01/2010 01/03/2010 01/05/2010 01/07/2010 01/09/2010 01/11/2010 01/01/20110
50000
100000
150000
200000 Marylebone Rd CPC
parti
cles
/ cm
3
Figure 4-26 CPC and SMPS time series at North Kensington and Marylebone Road sites in 2010
NPL Report AS 65
39
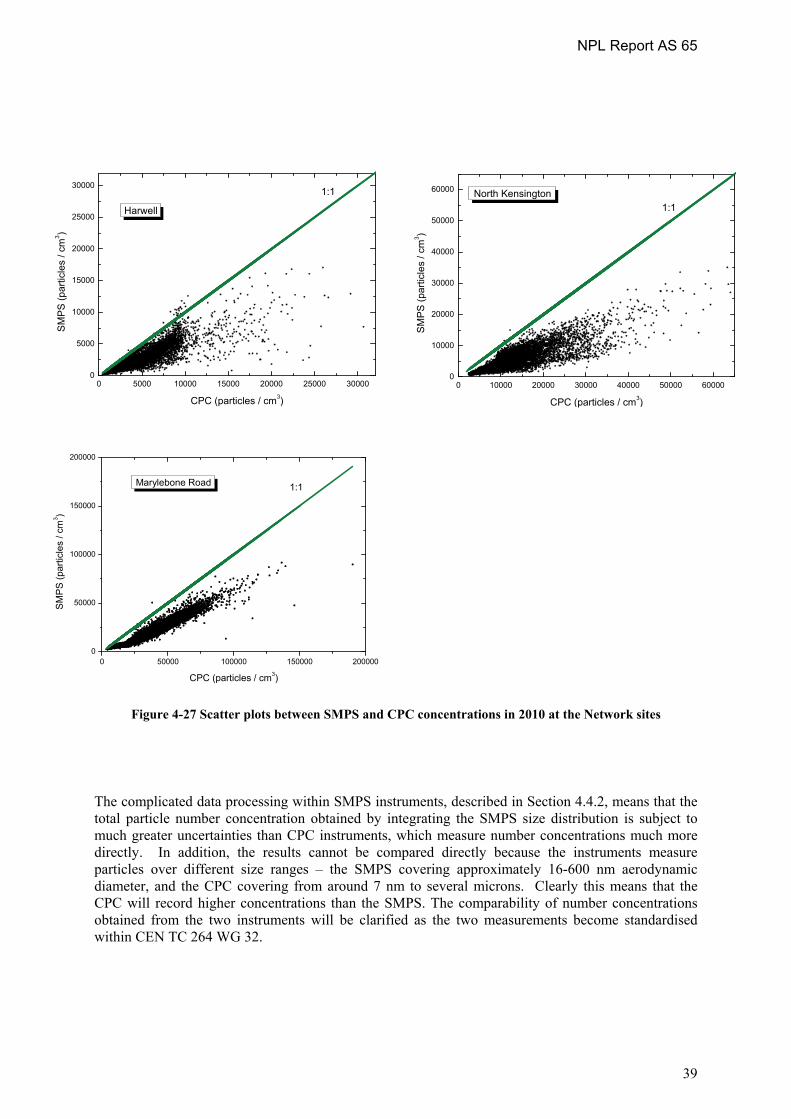
Figure 4-27 Scatter plots between SMPS and CPC concentrations in 2010 at the Network sites
The complicated data processing within SMPS instruments, described in Section 4.4.2, means that the total particle number concentration obtained by integrating the SMPS size distribution is subject to much greater uncertainties than CPC instruments, which measure number concentrations much more directly. In addition, the results cannot be compared directly because the instruments measure particles over different size ranges – the SMPS covering approximately 16-600 nm aerodynamic diameter, and the CPC covering from around 7 nm to several microns. Clearly this means that the CPC will record higher concentrations than the SMPS. The comparability of number concentrations obtained from the two instruments will be clarified as the two measurements become standardised within CEN TC 264 WG 32.
0 5000 10000 15000 20000 25000 300000
5000
10000
15000
20000
25000
30000
Harwell
SM
PS (p
artic
les
/ cm
3 )
CPC (particles / cm3)
1:1
0 10000 20000 30000 40000 50000 60000
0
10000
20000
30000
40000
50000
60000
North Kensington
SM
PS (p
artic
les
/ cm
3 )
CPC (particles / cm3)
1:1
0 50000 100000 150000 2000000
50000
100000
150000
200000
Marylebone Road
SM
PS
(par
ticle
s / c
m3 )
CPC (particles / cm3)
1:1

NP
L R
epor
t AS
65
40 T
able
4- M
onth
ly R
atio
of C
PC to
SM
PS P
artic
le C
ount
s in
2007
, 200
8, 2
009
and
2010
20
07
2008
Mar
yleb
one
Roa
d H
arw
ell
Nor
th
Ken
sing
ton
Mar
yleb
one
Roa
d H
arw
ell
Nor
th
Ken
sing
ton
Janu
ary
2.
4 5.
1 2.
6 Fe
brua
ry
2.
0 1.
0 2.
2 M
arch
2.
9
-
1.8
2.6
Apr
il
- 2.
0 2.
5 M
ay
4.1
- 1.
4 1.
9 Ju
ne
2.6
1.8
1.4
1.6
July
2.
6
1.
1 1.
3 1.
1 A
ugus
t 2.
4
1.
1 1.
2 1.
2 Se
ptem
ber
2.2
1.0
1.1
1.1
Oct
ober
1.
9 1.
8
1.1
1.7
1.3
Nov
embe
r 3.
6
8.8
1.3
1.6
- D
ecem
ber
3.4
3.
5 1.
4 1.
4 -
2009
20
10
M
aryl
ebon
e R
oad
Har
wel
l N
orth
K
ensi
ngto
n M
aryl
ebon
e R
oad
Har
wel
l N
orth
K
ensi
ngto
n Ja
nuar
y
4.
6
2.4
3.9
Febr
uary
2.
1 1.
7 3.
3 1.
7
3.5
Mar
ch
2.1
1.7
2.6
1.8
3.
7 A
pril
2.1
1.3
2.5
1.8
1.8
2.2
May
2.
1 1.
3 2.
5 2.
0 1.
9 2.
0 Ju
ne
1.6
1.3
2.1
2.1
1.6
2.0
July
1.
3
2.0
1.7
1.4
1.8
Aug
ust
1.
8 2.
2 1.
9 Se
ptem
ber
1.4
2.7
2.0
1.7
1.8
2.0
Oct
ober
1.
6 2.
3 2.
2 1.
9 1.
9 2.
3 N
ovem
ber
2.0
2.8
3.6
1.7
1.8
2.2
Dec
embe
r 2.
7 2.
9 4.
1 1.
8 2.
1 2.
1

NPL Report AS 65
41
4.5 METEOROLOGICAL DATA Although not a formal part of this measurement programme, meteorological data have been collated from the measurements made at Rochester as part of other Defra monitoring networks. Monthly data capture rates for the meteorological masts during 2010 are displayed in Table 4-6.
The Harwell meteorological station has been upgraded as part of the EMEP network at the end of August 2009. The collection of the data is now the responsibility of AEA.
The site at Rochester was switched off at the beginning of November 2009 due to a leak in the roof and remained off until the end of July 2010. Table 4-6 Monthly data capture for meteorological instruments in 2010. Note: (*) denotes the data capture for the time the site was operative.
Site Rochester January --- February --- March --- April --- May --- June --- July 100%(*)
August 100% September 100% October 95% November 100% December 100% Average 99% Wind roses are shown in Annex 1.

NPL Report AS 65
42
4.6 TRENDS AND PROFILES
4.6.2 Monthly trends
Using data from this contract, this section seeks to show trends in the average monthly values for all species at all sites during the past several years (see Figures 4-28 to 4-33).
Anions. The monthly chloride trends show a clear seasonal trend with lower concentrations in the summer. This behaviour is less clear for the other two ions although nitrate concentrations are lower in the summer and sulphate concentration are lower in the winter, as expected. Sulphate concentrations seem to have dropped at all sites since 2009.
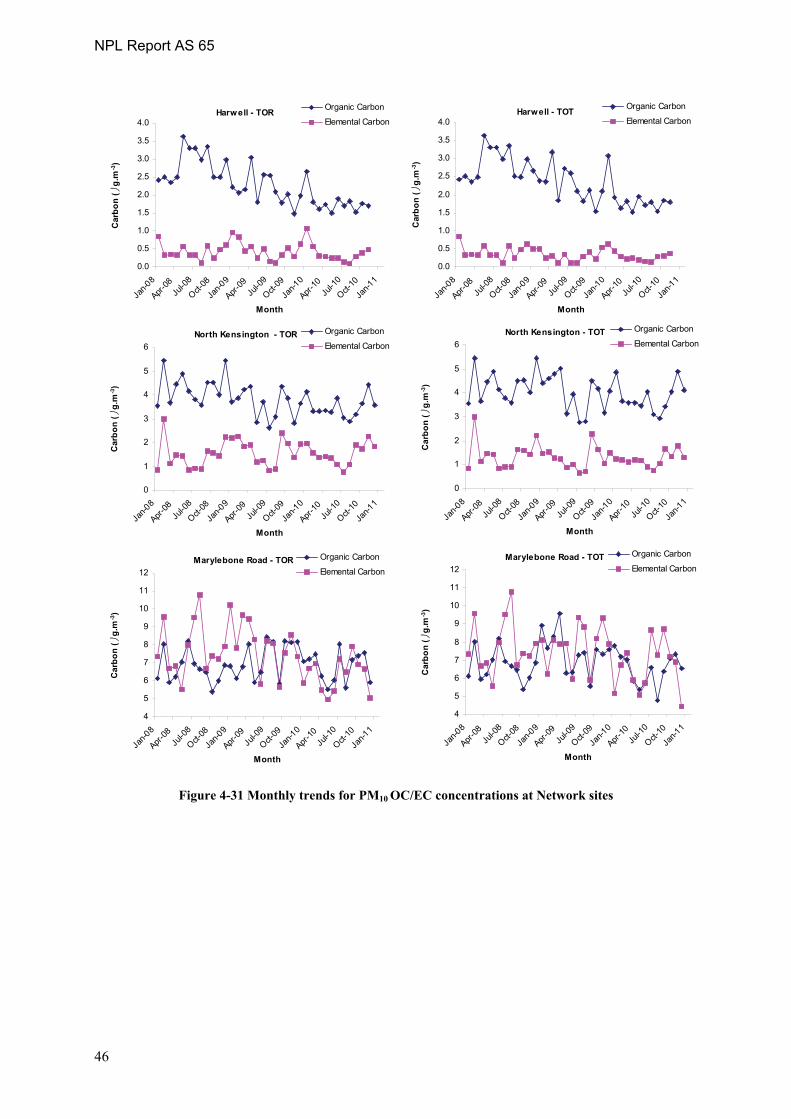
Organic Carbon/Elemental Carbon. Monthly trends are plotted for both methods (transmission and reflectance corrections) at all sites. There seems to be a downward trend for organic carbon at Harwell for both methods while the elemental carbon concentrations appear constant. The long-term trend at North Kensington does not show any significant change across the years. The difference between the two methods (transmission and reflectance corrections) becomes bigger at Marylebone Road, showing how the split between organic carbon and elemental carbon is strongly dependent on the method used when the filters are heavily loaded as the ones at a kerbside site like Marylebone Road.
Particles counts. There is clear drop in concentration at Marylebone Road between 2007 and 2008, which continues in 2009 and 2010. The particles counts at North Kensington show a smaller decrease. Figure 4-33 shows the annual average for particles counts at the two sites in London since 2005.
The reason is likely to be the change in sulphur content of fuel. This is discussed in a Topic Report published in 2011, and will be reported more fully in the 2011 Annual Report.

NPL Report AS 65
43
Harwell - Chloride
0.0
1.0
2.0
3.0
4.0
5.0
6.0
7.0
8.0
9.0
Jul-0
1Ju
l-02
Jul-0
3Ju
l-04
Jul-0
5Ju
l-06
Jul-0
7Ju
l-08
Jul-0
9Ju
l-10
Month
Con
cent
ratio
n /
÷g m
-3
Marylebone Road - Chloride
0.0
1.0
2.0
3.0
4.0
5.0
6.0
7.0
8.0
9.0
Jul-0
1Ju
l-02
Jul-0
3Ju
l-04
Jul-0
5Ju
l-06
Jul-0
7Ju
l-08
Jul-0
9Ju
l-10
Month
Con
cent
ratio
n /
÷g m
-3
North Kensington - Chloride
0.0
1.0
2.0
3.0
4.0
5.0
6.0
7.0
8.0
9.0
Jul-0
1Ju
l-02
Jul-0
3Ju
l-04
Jul-0
5Ju
l-06
Jul-0
7Ju
l-08
Jul-0
9Ju
l-10
Month
Con
cent
ratio
n /
÷g m
-3
Figure 4-28 Monthly trends for PM10 chloride concentrantions at Network sites

NPL Report AS 65
44
Harwell - Nitrate
0.0
2.0
4.0
6.0
8.0
10.0
12.0
14.0
16.0
Jul-0
1Ju
l-02
Jul-0
3Ju
l-04
Jul-0
5Ju
l-06
Jul-0
7Ju
l-08
Jul-0
9Ju
l-10
Month
Con
cent
ratio
n /
Πg m
-3
Marylebone Road - Nitrate
0.0
2.0
4.0
6.0
8.0
10.0
12.0
14.0
16.0
Jul-0
1Ju
l-02
Jul-0
3Ju
l-04
Jul-0
5Ju
l-06
Jul-0
7Ju
l-08
Jul-0
9Ju
l-10
Month
Con
cent
ratio
n /
Πg m
-3
North Kensington - Nitrate
0.0
2.0
4.0
6.0
8.0
10.0
12.0
14.0
16.0
Jul-0
1Ju
l-02
Jul-0
3Ju
l-04
Jul-0
5Ju
l-06
Jul-0
7Ju
l-08
Jul-0
9Ju
l-10
Month
Con
cent
ratio
n /
Πg m
-3
Figure 4-29 Monthly trends for PM10 nitrate concentrations at Network sites

NPL Report AS 65
45
Harwell - Sulphate
0.0
1.0
2.0
3.0
4.0
5.0
6.0
7.0
Jul-0
1Ju
l-02
Jul-0
3Ju
l-04
Jul-0
5Ju
l-06
Jul-0
7Ju
l-08
Jul-0
9Ju
l-10
Month
Con
cent
ratio
n /
ξg m
-3
Marylebone Road - Sulphate
0.0
1.0
2.0
3.0
4.0
5.0
6.0
7.0
Jul-0
1Ju
l-02
Jul-0
3Ju
l-04
Jul-0
5Ju
l-06
Jul-0
7Ju
l-08
Jul-0
9Ju
l-10
Month
Con
cent
ratio
n /
ξg m
-3
North Kensington - Sulphate
0.0
1.0
2.0
3.0
4.0
5.0
6.0
7.0
Jul-0
1Ju
l-02
Jul-0
3Ju
l-04
Jul-0
5Ju
l-06
Jul-0
7Ju
l-08
Jul-0
9Ju
l-10
Month
Con
cent
ratio
n /
ξg m
-3
Figure 4-30 Monthly trends for PM10 sulphate concentrations at Network sites
NPL Report AS 65
46
North Kensington - TOR
0
1
2
3
4
5
6
Jan-0
8
Apr-08
Jul-0
8
Oct-08
Jan-0
9
Apr-09
Jul-0
9
Oct-09
Jan-1
0
Apr-10
Jul-1
0
Oct-10
Jan-1
1
Month
Car
bon
( ⎠g.
m-3)
Organic Carbon
Elemental Carbon
Harwell - TOR
0.0
0.5
1.0
1.5
2.0
2.5
3.0
3.5
4.0
Jan-0
8
Apr-08
Jul-0
8
Oct-08
Jan-0
9
Apr-09
Jul-0
9
Oct-09
Jan-1
0
Apr-10
Jul-1
0
Oct-10
Jan-1
1
Month
Car
bon
( ⎠g.
m-3)
Organic Carbon
Elemental Carbon
Marylebone Road - TOR
4
5
6
7
8
9
10
11
12
Jan-0
8
Apr-08
Jul-0
8
Oct-08
Jan-0
9
Apr-09
Jul-0
9
Oct-09
Jan-1
0
Apr-10
Jul-1
0
Oct-10
Jan-1
1
Month
Car
bon
( ⎠g.
m-3)
Organic Carbon
Elemental Carbon
North Kensington - TOT
0
1
2
3
4
5
6
Jan-0
8
Apr-08
Jul-0
8
Oct-08
Jan-0
9
Apr-09
Jul-0
9
Oct-09
Jan-1
0
Apr-10
Jul-1
0
Oct-10
Jan-1
1
Month
Car
bon
( ⎠g.
m-3)
Organic Carbon
Elemental Carbon
Harwell - TOT
0.0
0.5
1.0
1.5
2.0
2.5
3.0
3.5
4.0
Jan-0
8
Apr-08
Jul-0
8
Oct-08
Jan-0
9
Apr-09
Jul-0
9
Oct-09
Jan-1
0
Apr-10
Jul-1
0
Oct-10
Jan-1
1
Month
Car
bon
( ⎠g.
m-3)
Organic Carbon
Elemental Carbon
Marylebone Road - TOT
4
5
6
7
8
9
10
11
12
Jan-0
8
Apr-08
Jul-0
8
Oct-08
Jan-0
9
Apr-09
Jul-0
9
Oct-09
Jan-1
0
Apr-10
Jul-1
0
Oct-10
Jan-1
1
Month
Car
bon
( ⎠g.
m-3)
Organic Carbon
Elemental Carbon
Figure 4-31 Monthly trends for PM10 OC/EC concentrations at Network sites

NPL Report AS 65
47
Figure 4-32 Monthly trends for CPC counts at Network sites
Marylebone Road - CPC
020000400006000080000
100000120000
Jan-00
Jan-01
Jan-02
Jan-03
Jan-04
Jan-05
Jan-06
Jan-07
Jan-08
Jan-09
Jan-10
Jan-11
Month
Part
icle
s/cm
3
North Kensington - CPC
0
10000
20000
30000
40000
50000
Jan-00
Jan-01
Jan-02
Jan-03
Jan-04
Jan-05
Jan-06
Jan-07
Jan-08
Jan-09
Jan-10
Jan-11
Month
Part
icle
s/cm
3
Birmingham - CPC
0100002000030000400005000060000
Jan-00 Jan-01 Jan-02 Jan-03 Jan-04 Jan-05 Jan-06 Jan-07 Jan-08 Jan-09 Jan-10
Month
Part
icle
s/cm
3
Harwell - CPC
0
2000
4000
6000
8000
Jan-00 Jan-01 Jan-02 Jan-03 Jan-04 Jan-05 Jan-06 Jan-07 Jan-08 Jan-09 Jan-10
Month
Part
icle
s/cm
3

NPL Report AS 65
48
2005 2006 2007 2008 2009 20100
5000
10000
15000
20000
parti
cles
/ cm
-3
North Kensington
2005 2006 2007 2008 2009 20100
10000
20000
30000
40000
50000
60000
70000
80000
parti
cles
/ cm
-3
Marylebone Road
Figure 4-33 Annual averages of particles counts since 2005 at the London sites
4.6.3 Diurnal profiles
Diurnal profiles by quarter have been derived for the CPC instruments and are shown in Figures 4-34 and 4-35. Error bars are reported as 95% confidence based on the spread of data.
At the Marylebone Road site, the trend shows a peak in the morning, when the rush hour starts, which continues along the day because of the constant traffic in the area.
In the two urban background sites (North Kensington and Birmingham Tyburn), the morning rush hour is visible along with a second peak in the evening, which covers also late hours probably due to domestic heating.
The trend at Harwell does not follow a typical urban pattern and could be affected by both natural and anthropogenic activities during the day.
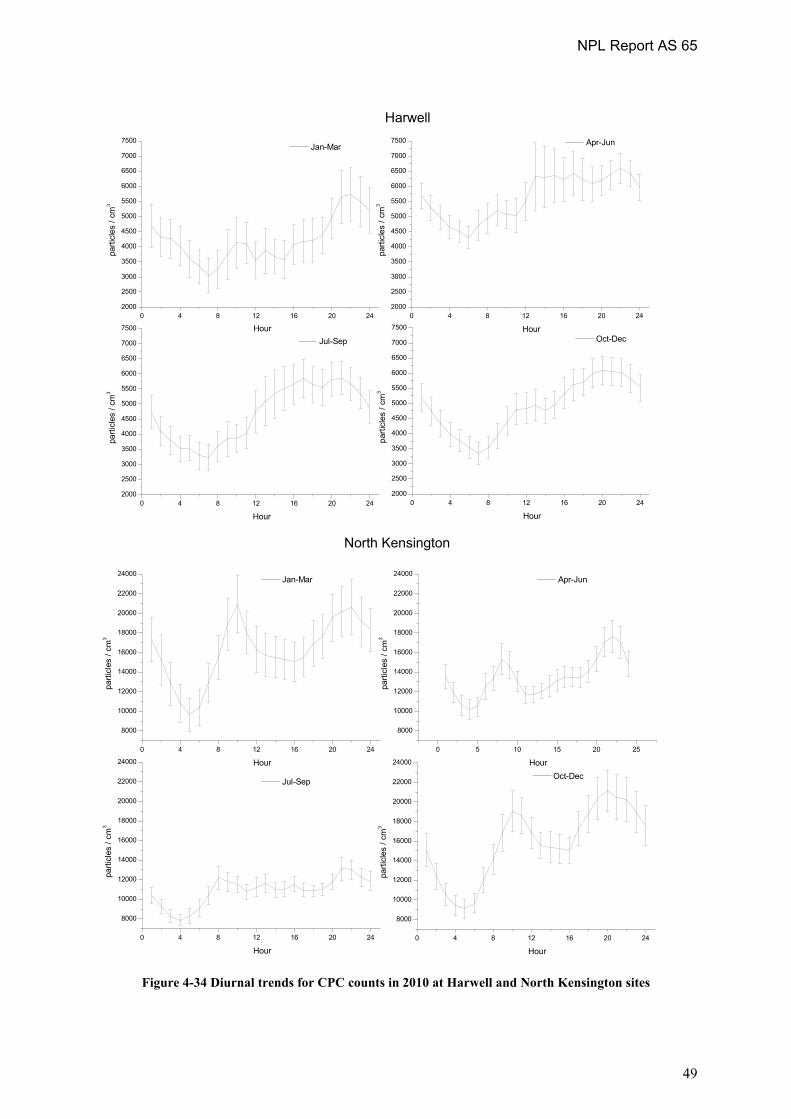
NPL Report AS 65
49
0 4 8 12 16 20 242000
2500
3000
3500
4000
4500
5000
5500
6000
6500
7000
7500
Hour
Jan-Mar
parti
cles
/ cm
3
0 4 8 12 16 20 242000
2500
3000
3500
4000
4500
5000
5500
6000
6500
7000
7500
Hour
Apr-Jun
parti
cles
/ cm
3
0 4 8 12 16 20 242000
2500
3000
3500
4000
4500
5000
5500
6000
6500
7000
7500
Hour
Jul-Sep
parti
cles
/ cm
3
0 4 8 12 16 20 242000
2500
3000
3500
4000
4500
5000
5500
6000
6500
7000
7500
Hour
Oct-Dec
parti
cles
/ cm
3
Harwell
0 4 8 12 16 20 24
8000
10000
12000
14000
16000
18000
20000
22000
24000
Hour
Jan-Mar
parti
cles
/ cm
3
0 5 10 15 20 25
8000
10000
12000
14000
16000
18000
20000
22000
24000
Hour
Apr-Jun
parti
cles
/ cm
3
0 4 8 12 16 20 24
8000
10000
12000
14000
16000
18000
20000
22000
24000
Hour
Jul-Sep
parti
cles
/ cm
3
0 4 8 12 16 20 24
8000
10000
12000
14000
16000
18000
20000
22000
24000
Hour
Oct-Dec
parti
cles
/ cm
3
North Kensington
Figure 4-34 Diurnal trends for CPC counts in 2010 at Harwell and North Kensington sites

NPL Report AS 65
50
0 4 8 12 16 20 24
15000
20000
25000
30000
35000
40000
45000
50000
55000
60000
65000
70000
Hour
Jan-Mar
parti
cles
/ cm
3
0 4 8 12 16 20 24
15000
20000
25000
30000
35000
40000
45000
50000
55000
60000
65000
70000
Hour
Apr-Jun
parti
cles
/ cm
3
0 4 8 12 16 20 24
15000
20000
25000
30000
35000
40000
45000
50000
55000
60000
65000
70000
Hour
Jul-Sep
parti
cles
/ cm
3
0 4 8 12 16 20 24
15000
20000
25000
30000
35000
40000
45000
50000
55000
60000
65000
70000
Hour
Oct-Dec
parti
cles
/ cm
3
Marylebone Road
0 4 8 12 16 20 24
9000
12000
15000
18000
21000
24000
27000
30000
33000
Hour
Jan-Mar
parti
cles
/ cm
3
0 4 8 12 16 20 24
9000
12000
15000
18000
21000
24000
27000
30000
33000
Hour
Apr-Jun
parti
cles
/ cm
3
0 4 8 12 16 20 24
9000
12000
15000
18000
21000
24000
27000
30000
33000
Hour
Jul-Sep
parti
cles
/ cm
3
Birmingham
0 4 8 12 16 20 24
9000
12000
15000
18000
21000
24000
27000
30000
33000
Hour
Oct-Dec
parti
cles
/ cm
3
Figure 4-35 Diurnal trends for CPC counts in 2010 at Marylebone Road and Birmingham sites

NPL Report AS 65
51
4.6.4 Weekly profiles
Weekly profiles across the year have also been derived for the number concentration as well as the daily anions and ECOC measurements. Plots are shown from Figure 4-36 to 4-40 and error bars are reported as 95% confidence.
Elemental Carbon/Organic carbon. The graphs show that EC is generally lower at weekends, with the difference being most pronounced at Marylebone Road. A drop in OC is also apparent at this site.
Anions. The trends are very variable at all sites as mainly natural and meteorological processes and long-range transport (for nitrate and sulphate) drive ambient concentrations of these species
Particle counts. In terms of number concentrations, all the three urban sites are affected by the local traffic with lower concentrations during the weekend. The trend at Harwell is not clear and can be affected by activities on site and/or meteorological conditions.

NPL Report AS 65
52
Monday Tuesday WednesdayThursday Friday Saturday Sunday0
1
2
3
4
conc
entra
tion
/ μg
m-3
OC TOT OC TORHarwell
Monday Tuesday WednesdayThursday Friday Saturday Sunday0.0
0.1
0.2
0.3
0.4
0.5
0.6
0.7
0.8
0.9
1.0
conc
entra
tion
/ μg
m-3
EC TOT EC TORHarwell
Monday Tuesday WednesdayThursday Friday Saturday Sunday0
1
2
3
4
5
6
7
conc
entra
tion
/ μg
m-3
OC TOT OC TORNorth Kensington
Monday Tuesday WednesdayThursday Friday Saturday Sunday0
1
2
3
4
conc
entra
tion
/ μg
m-3
EC TOT EC TORNorth Kensington
Monday Tuesday WednesdayThursday Friday Saturday Sunday0
1
2
3
4
5
6
7
8
9
10
11
conc
entra
tion
/ μg
m-3
OC TOT OC TORMarylebone Road
Monday Tuesday WednesdayThursday Friday Saturday Sunday0
1
2
3
4
5
6
7
8
9
10
11
conc
entra
tion
/ μg
m-3
EC TOT EC TORMarylebone Road
Figure 4-36 Weekly profiles for carbon concentrations at the Network sites in 2010

NPL Report AS 65
53
Monday Tuesday WednesdayThursday Friday Saturday Sunday0.0
0.5
1.0
1.5
2.0
2.5
3.0
3.5
4.0
conc
entra
tion
/ μg
m-3
Harwell TC
Monday Tuesday WednesdayThursday Friday Saturday Sunday0.00.51.01.52.02.53.03.54.04.55.05.56.06.57.07.58.08.59.0
conc
entra
tion
/ μg
m-3
North Kensington TC
Monday Tuesday WednesdayThursday Friday Saturday Sunday0
2
4
6
8
10
12
14
16
18
20
conc
entra
tion
/ μg
m-3
Marylebone Road TC
Figure 4-37 Weekly profiles for Total Carbon (TC) in 2010 at the Network site

NPL Report AS 65
54
Monday Tuesday Wednesday Thursday Friday Saturday Sunday0.0
0.5
1.0
1.5 Chloride
conc
entra
tion
/ μg
m-3
Monday Tuesday Wednesday Thursday Friday Saturday Sunday0.0
0.5
1.0
1.5
2.0
2.5
3.0
3.5
4.0 Nitrate
conc
entra
tion
/ μg
m-3
Monday Tuesday Wednesday Thursday Friday Saturday Sunday0.0
0.3
0.6
0.9
1.2
1.5
1.8
2.1
2.4
2.7
3.0 Sulphate
conc
entra
tion
/ μg
m-3
Harwell - Anions
Monday Tuesday Wednesday Thursday Friday Saturday Sunday0.0
0.3
0.6
0.9
1.2
1.5
1.8
conc
entra
tion
/ μg
m-3
conc
entra
tion
/ μg
m-3
Chloride
conc
entra
tion
/ μg
m-3
Monday Tuesday Wednesday Thursday Friday Saturday Sunday0.0
0.5
1.0
1.5
2.0
2.5
3.0
3.5
4.0
4.5
5.0
5.5
6.0 Nitrate
Monday Tuesday Wednesday Thursday Friday Saturday Sunday0.0
0.5
1.0
1.5
2.0
2.5
3.0
3.5
4.0 Sulphate
North Kensington - Anions
Figure 4-38 Weekly profiles for anions concentrations at Harwell and North Kensington sites in 2010

NPL Report AS 65
55
Monday Tuesday Wednesday Thursday Friday Saturday Sunday0.0
0.2
0.4
0.6
0.8
1.0
1.2
1.4
1.6
1.8
2.0
2.2
2.4
conc
entra
tion
/ μg
m-3
conc
entra
tion
/ μg
m-3
Chloride
conc
entra
tion
/ μg
m-3
Monday Tuesday Wednesday Thursday Friday Saturday Sunday0.0
0.5
1.0
1.5
2.0
2.5
3.0
3.5
4.0
4.5
5.0Nitrate
Monday Tuesday Wednesday Thursday Friday Saturday Sunday0
1
2
3
4 Sulphate
Marylebone Road
Figure 4-39 Weekly profiles for anions concentrations at the Marylebone Road site in 2010

NPL Report AS 65
56
Monday Tuesday Wednesday Thursday Friday Saturday Sunday26000
28000
30000
32000
34000
36000
38000
40000
42000
44000
46000 Marylebone Road
parti
cles
/ cm
3
Monday Tuesday Wednesday Thursday Friday Saturday Sunday10000
10500
11000
11500
12000
12500
13000
13500
14000
14500
15000
15500
16000 North Kensington
parti
cles
/ cm
3
Monday Tuesday Wednesday Thursday Friday Saturday Sunday4400
4600
4800
5000
5200
5400
5600 Harwell
parti
cles
/ cm
3
Monday Tuesday Wednesday Thursday Friday Saturday Sunday10000
11000
12000
13000
14000
15000
16000 Birmingham
parti
cles
/ cm
3
Figure 4-40 Weekly profiles for number concentrations at the Network sites in 2010

NPL Report AS 65
57
5 UPDATE ON THE WIDER POLICY AND RESEARCH CONTEXT The measurements made within this Network are one research programme amongst many in the UK and EU. Other sources of data should be borne in mind. In this Section, we identify complementary measurement activities, which will provide additional data (a) to confirm the measurements made in this network or (b) to assist the interpretation of the measurements. 5.1 UPDATE ON RELATED UK ACTIVITIES
5.1.1 London specific measures The characterisation of the chemical composition of PM is of particular importance in London. Roadside locations in London were the only areas identified as likely to exceed the PM10 objective in the recent time extension notification made by the UK to the European Commission to meet PM10 air quality limits. An understanding of the chemical composition is vital to understand the sources of PM and the impact of local, regional, national and international emissions abatement. It is especially important to assess the impact of any short-term measures applied as a requirement of the time extension notification. London is also the subject of the largest Low Emission Zone in Europe, which began in February 2008 with emissions restrictions for heavy lorries. Further emissions restrictions for lighter lorries were bought in during July 2008; the emissions standards for both these vehicle classes will be further tightened in January 2012. The extension of the LEZ to large vans and minibuses was planned for 2010 but was postponed in the Mayor’s Draft Air Quality Strategy. The draft strategy focuses effort on three key corridors in central London, which are the locations of most of the pollution hot spots, one of these corridors includes the Marylebone Road. Many of the novel approaches to PM abatement, such as the application of dust suppressants currently underway, will require detailed validation using the chemical composition measurements made using this network at this site. The promotion of cleaner vehicles on these routes and across London will also require assessment using particle number concentrations.
5.1.2 Research Council Activity in London ClearfLo is a large NERC-funded project involving 11 UK partners. The ambition is to provide integrated measurements of the meteorology, composition and particulate loading of London’s urban atmosphere, made at street level and at elevated sites, complemented by modelling to improve predictive capability for air quality. Long-term measurements have begun, which will be complemented by more detailed Intensive Observation Periods (IOPs). The aims of the IOPs are (i) to measure the vertical structure of the urban boundary layer, (ii) to determine the oxidation potential of the urban atmosphere, (iii) to measure the properties and composition of particulates in the urban atmosphere. Both the long-term monitoring and the IOPs are centred on the London PM network site. In particular, the IOPs will be undertaken in the school adjacent to the North Kensington site. Both sites have also been augmented with additional monitoring equipment including number concentrations of the larger PM size fractions. However, much of the analysis will be based on the existing measurements made for the PM network and AURN. Traffic is a four-year project for the MRC-HPA Centre for Environment and Health funded though the Living with Environmental Change (LWEC) partnership. It seeks to understand the patterns of exposure of the population to traffic pollution and their relationships to health through an improved understanding of the relative toxicity of air pollution from traffic sources using in vitro studies of

NPL Report AS 65
58
oxidative potential, the development of an integrated dynamic model of exposure to traffic pollution and the quantification of the relationships between traffic pollution and a suite of health outcomes. NCAS (National Centre for Atmospheric Science) research funded through the University of Birmingham has continued to be active in London; measurement campaigns were undertaken in June 2010 and in February/March 2011. Samples of particulate matter were collected at both London Marylebone Road and London North Kensington as bulk coarse and fine fractions but also size fractionated by cascade impactors.
5.1.3 Defra and Other National Monitoring Activities AURN measurements of PM10 and PM2.5 Any investigation of PM should ultimately be linked to the reported PM10 and PM2.5 measurements from the AURN, which are based primarily on TEOM-FDMS instruments, with some gravimetric data using Partisol (1 m3/hr) and reference (2.3 m3/hr) samplers. The link is explicit for the anion and EC/OC parts of this Network. There is frequent communication on this topic between this Network and the key organisations in the AURN, for example through Equivalence trials, CEN committee membership, and AQUILA. Black Carbon Measurements There are currently 20 sites in the Black Carbon Network that measure optically using aethalometers at two wavelengths. The infrared wavelength metric is designed to approximate to Elemental Carbon. There are strong links to this Network through NPL’s involvement in both, and Black Carbon data have been incorporated in this Report. Rural Monitoring Daily measurements of sulphate, and monthly measurements of nitrate, chloride and ammonium are made at a number of rural sites through the Ammonia and Acid Deposition Monitoring Networks. As part of the UK implementation of the EMEP monitoring strategy, two sites, Auchencorth Moss and Harwell, have been established to monitor, inter alia, particulate matter. The measurements of relevance to this network are those of:
Sulphate, nitrate, ammonium, sodium, potassium, calcium and magnesium ions in both the PM10 and PM2.5 size fractions, on an hourly basis, using a steam-jet aerosol collector.
EC by aethalometry with supplementary analysis of filter samples for EC and OC.
5.2 UPDATE ON EUROPEAN ACTIVITIES
5.2.1 New EU Air Quality Directive 2008/50/EC The new Directive on Ambient Air Quality and Cleaner Air for Europe was transposed into UK legislation by a Statutory Instrument that came into force on 11 June 2010. Three aspects are relevant to this Network:
• The previous PM legislation was based on control of PM10, while the new Directive places an emphasis on PM2.5. Research-led measurements such as those on this Network should therefore make due emphasis on the PM2.5 size fraction.

NPL Report AS 65
59
• There is more explicit allowance for exceedences arising from “natural sources” to be excluded. Again, research-led measurements should make the determination of the “natural” fraction of PM a clear aim. Wind blown, long-range, transported mineral dust and sea salt are the most important natural sources, but there are many other sources with potentially significant effects that can be attributed to natural sources. The implications for Member States are still being discussed. The issues have been summarised in Contribution of natural sources to air pollution levels in the EU – a technical basis for the development of guidance for the Member States, Report EUR 22779 EN (2007).
• Annex IV includes the statement “Measurement of PM2.5 must include at least the mass
concentration and appropriate compounds to characterise its chemical composition. At least the list of chemical species below shall be included.”
SO4
2- Na+ NH4+ Ca2+ Elemental carbon (EC)
NO3- K+ Cl- Mg2+ Organic carbon (OC)
Many of these components are those currently measured by this Network. There is, however, an evident need to standardise these measurements for EU reporting purposes, which is being addressed as described in the next section. The lack of PM2.5 EC/OC monitoring is being rectified in 2011.
5.2.2 CEN standards 2010 has seen considerable CEN activity in the areas covered by this Network. CEN TC 264 Working Group 15 is in the process of updating the gravimetric PM10 standard EN 12341:1998, together with the gravimetric PM2.5 standard EN 14907:2005, which will be combined in a revised EN 12341. Validation work is necessary, especially in the areas of filter selection and the handling of field blank values, but it is expected that a revised standard will be published before the validation data is available, with a further revision due soon afterwards. The proposed changes, for example limiting the relative humidity during filter conditioning to 45-50% rather than the present 45-55%, are expected to reduce variations rather than produce step changes to the data. The working group is also drafting a CEN standard for automatic PM measurement, which incorporates type approval of PM instruments, equivalence testing against the reference methods, ongoing QA/QC, and ongoing determination of equivalence. Both standards are expected to go for CEN enquiry in late 2011. CEN TC 264 WG 32 covers particle number concentration and size distribution measurements (ie CPC and SMPS-type). It is producing two separate Technical Specifications (as distinct from full Standards), covering:
1) A standard method for measuring “single parameter” particle number concentration, ie a “total” number concentration covering a broad size range, as typically covered by CPCs in ambient measurements. This will provide a “standard” low size cut-off, sampling, operating, QA/QC and calibration procedures, and be readily adoptable as a reference method. The current proposal is to standardise the cut-off at 7 nm, this being a compromise between the desire to include nucleation mode particles, but with the constraint that the monitoring of smaller sizes will be dominated by the sampling system rather than the instrument, making standardisation impractical. Another relevant proposal is to exclude photometric mode CPC measurements from the reference method. In the case of this Network, this can be addressed by changing to instruments with a larger counting mode range, incorporating a dilution system, or relying on calibration of the photometric mode, as at present. Calibration of CPCs is being delegated to the ISO TC 24 group, as described below.
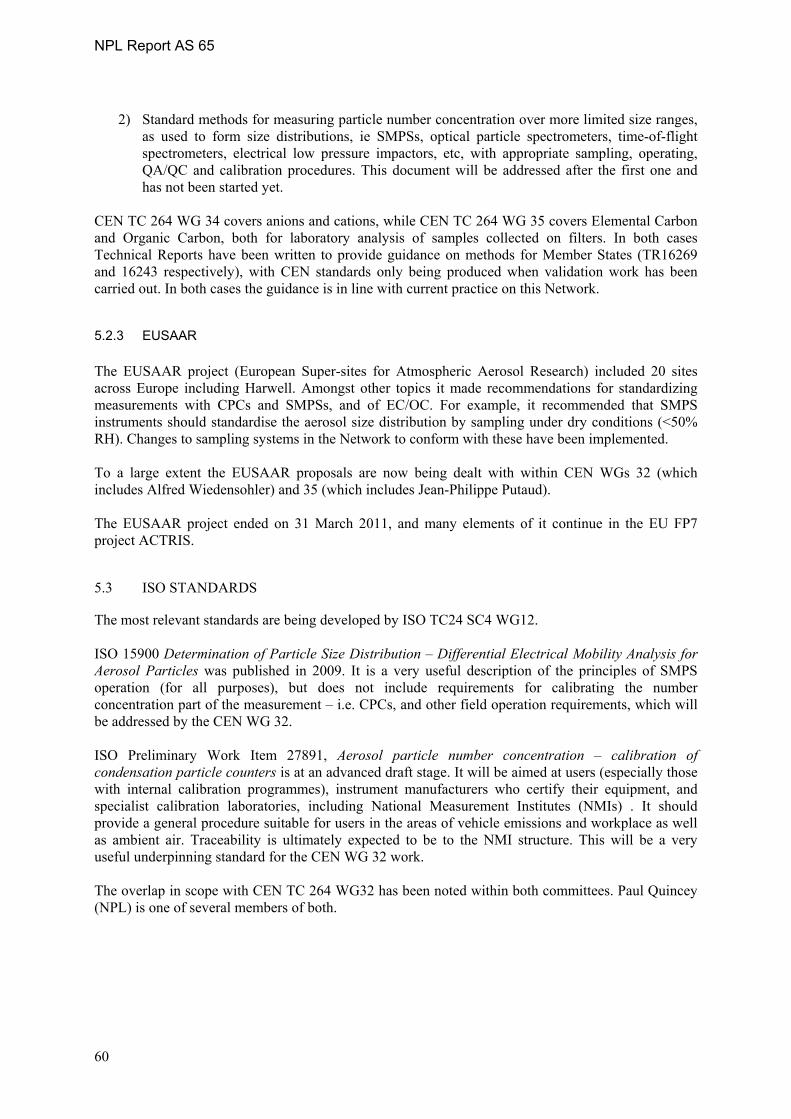
NPL Report AS 65
60
2) Standard methods for measuring particle number concentration over more limited size ranges,
as used to form size distributions, ie SMPSs, optical particle spectrometers, time-of-flight spectrometers, electrical low pressure impactors, etc, with appropriate sampling, operating, QA/QC and calibration procedures. This document will be addressed after the first one and has not been started yet.
CEN TC 264 WG 34 covers anions and cations, while CEN TC 264 WG 35 covers Elemental Carbon and Organic Carbon, both for laboratory analysis of samples collected on filters. In both cases Technical Reports have been written to provide guidance on methods for Member States (TR16269 and 16243 respectively), with CEN standards only being produced when validation work has been carried out. In both cases the guidance is in line with current practice on this Network.
5.2.3 EUSAAR The EUSAAR project (European Super-sites for Atmospheric Aerosol Research) included 20 sites across Europe including Harwell. Amongst other topics it made recommendations for standardizing measurements with CPCs and SMPSs, and of EC/OC. For example, it recommended that SMPS instruments should standardise the aerosol size distribution by sampling under dry conditions (<50% RH). Changes to sampling systems in the Network to conform with these have been implemented. To a large extent the EUSAAR proposals are now being dealt with within CEN WGs 32 (which includes Alfred Wiedensohler) and 35 (which includes Jean-Philippe Putaud). The EUSAAR project ended on 31 March 2011, and many elements of it continue in the EU FP7 project ACTRIS. 5.3 ISO STANDARDS The most relevant standards are being developed by ISO TC24 SC4 WG12. ISO 15900 Determination of Particle Size Distribution – Differential Electrical Mobility Analysis for Aerosol Particles was published in 2009. It is a very useful description of the principles of SMPS operation (for all purposes), but does not include requirements for calibrating the number concentration part of the measurement – i.e. CPCs, and other field operation requirements, which will be addressed by the CEN WG 32. ISO Preliminary Work Item 27891, Aerosol particle number concentration – calibration of condensation particle counters is at an advanced draft stage. It will be aimed at users (especially those with internal calibration programmes), instrument manufacturers who certify their equipment, and specialist calibration laboratories, including National Measurement Institutes (NMIs) . It should provide a general procedure suitable for users in the areas of vehicle emissions and workplace as well as ambient air. Traceability is ultimately expected to be to the NMI structure. This will be a very useful underpinning standard for the CEN WG 32 work. The overlap in scope with CEN TC 264 WG32 has been noted within both committees. Paul Quincey (NPL) is one of several members of both.

NPL Report AS 65
61
6 TOPIC REPORTS AND PUBLICATIONS Reports and papers produced or published since the start of the contract include: 6.1 PROJECT AND TOPIC REPORTS May 2005-April 2006 CPEA 28: Airborne Particulate Concentrations and Numbers in the UK (phase 2). State of Network Report, NPL Report DQL-AS 019, September 2005 CPEA 28: Airborne Particulate Concentrations and Numbers in the UK (phase 2). Strategic Network Review, NPL Report DQL-AS 020, November 2005 CPEA 28: Airborne Particulate Concentrations and Numbers in the UK (phase 2). Annual Report 2005, NPL Report DQL-AS 028, Revised July 2006 May 2006-April 2007 CPEA 28: Airborne Particulate Concentrations and Numbers in the UK (phase 2). Annual Audit Report, NPL Report DQL-AS 031, July 2006 Comparison of Methods for Organic and Elemental Carbon PM10 Concentrations at Marylebone Road for the Period 07/09/06 to 31/12/06, NPL Report DQL-AS 035, February 2007 CPEA 28: Airborne Particulate Concentrations and Numbers in the UK (phase 2). Estimation of Measurement Uncertainty in Network Data, NPL Report DQL-AS 037, March 2007 CPEA 28: Airborne Particulate Concentrations and Numbers in the UK (phase 2). Annual Report 2006, NPL Report AS4, Revised April 2007. May 2007-April 2008 Monitoring of Particulate Nitrate by Rupprecht & Patashnick 8400N Ambient Particulate Nitrate Monitors, A.M. Jones and R.M. Harrison, August 2007. CPEA 28: Airborne Particulate Concentrations and Numbers in the UK (phase 2). Annual Audit Report, NPL Report DQL-AS 016, October 2007. Comparison of Cluster Analysis Techniques Applied to Rural UK Atmospheric Particle Size Data, D.C.S. Beddows and R.M. Harrison, Draft, December 2007. Change in particle number concentration from 2000 to 2006 at four UK sites, A.M. Jones and R.M. Harrison, March 2008. The weekday-weekend difference and the estimation of the non-vehicle contributions to the urban increment of airborne particulate matter, A.M. Jones, J.Yin and R.M. Harrison, CPEA 28: Airborne Particulate Concentrations and Numbers in the UK (phase 2), Annual Report 2007. May 2008-April 2009 CPEA 28: Airborne Particulate Concentrations and Numbers in the UK (phase 2), Annual Report 2008.

NPL Report AS 65
62
The Merging of Atmospheric Particle Size Distribution Data Measured using Electrical Mobility and Time-of-Flight Analysers, David C. S. Beddows and Roy M. Harrison Review and Interpretation of Black Carbon Data Measured by Magee Aethalometers, Alan M. Jones And Roy M. Harrison The Temporal Trends in Particulate Sulphate and Nitrate Concentrations at UK Sites, Alan M. Jones And Roy M. Harrison Quantifying the London Specific Component of PM10 Oxidative Activity, Ian S Mudway, Gary Fuller, David Green, Chrissi Dunster and Frank J Kelly May 2009-December 2010 CPEA 28: Airborne Particulate Concentrations and Numbers in the UK (phase 2), Annual Report 2009. Review and interpretation of particulate carbon data from Marylebone Road and North Kensington in the period 2006 – 2009 Alan M. Jones and Roy M. Harrison Long and short-term temporal trends in airborne particle number concentration in the UK Alan M. Jones and Roy M. Harrison 6.2 PUBLICATIONS Multisite Study of Particle Number Concentrations in Urban Air, R.M. Harrison and A.M. Jones, Environmental Science and Technology, 39, 6063-6070 (2005). The Use of Trajectory Cluster Analysis to Examine the Long-Range Transport of Secondary Inorganic Aerosol in the UK, S.S. Abdalmogith and R.M. Harrison, Atmospheric Environment, 39, 6686-6695 (2005). Interpretation of Particulate Elemental and Organic Carbon Concentrations at Rural, Urban and Kerbside Sites, A.M. Jones and R.M. Harrison, Atmospheric Environment, 39, 7114-7126 (2005). Fine (PM2.5) and Coarse (PM2.5-10) Particulate Matter on a Heavily Trafficked London Highway: Sources and Processes, A. Charron and R.M. Harrison, Environmental Science and Technology, 39, 7768-7776 (2005). An Analysis of Spatial and Temporal Properties of Daily Sulphate, Nitrate and Chloride Concentrations at UK Urban and Rural Sites, S.S. Abdalmogith and R.M. Harrison, J. Environmental Monitoring, 8, 691-699 (2006). Particulate Sulphate and Nitrate in Southern England and Northern Ireland during 2002/3 and its Formation in a Photochemical Trajectory Model, S.S. Abdalmogith, R.M. Harrison and R.G. Derwent, Science of the Total Environment, 368, 769-780 (2006). Intercomparison of Secondary Inorganic Aerosol Concentrations in the UK with Predictions of the Unified Danish Eulerian Model, S.S. Abdalmogith, R.M. Harrison and Z. Zlatev, Journal of Atmospheric Chemistry, 54, 43-66 (2006).

NPL Report AS 65
63
Estimation of the Emission Factors of Particle Number and Mass Fractions from Traffic at a Site Where Mean Vehicle Speeds Vary Over Short Distances, A.M. Jones and R.M. Harrison, Atmospheric Environment, 40, 7125-7137 (2006). Assessment of Natural Components of PM10 at UK Urban and Rural Sites, A.M. Jones and R.M. Harrison, Atmospheric Environment, 40, 7733-7741 (2006). What are the Sources and Conditions Responsible for Exceedences of the 24 h PM10 Limit Value (50 µg m-3) at a heavily trafficked London site? A. Charron, R.M. Harrison and P.G. Quincey, Atmospheric Environment, 41, 1960-1975 (2007). Factors Influencing New Particle Formation at the Rural Site, Harwell, United Kingdom, A.Charron, W. Birmili and R.M. Harrison, J. Geophys. Res., 112, (2007). D14210, doi:10.1029/2007JD008425. Fingerprinting Particle Origins According to their Size Distribution at a UK Rural Site, A. Charron, W. Birmili and R.M. Harrison, J. Geophys. Res., 113, D07202 (2008). doi:10.1029/2007/JD008562 The Weekday-Weekend Difference and the Estimation of the Non-Vehicle Contributions to the Urban Increment of Airborne Particulate Matter, A.M. Jones, J. Yin and R.M. Harrison, Atmos. Environ., 42, 4467-4479 (2008). Comparison of Average Particle Number Emission Factors for Heavy and Light Duty Vehicles Derived From Rolling Chassis Dynamometer and Field Studies, D.C.S. Beddows and R.M. Harrison, Atmos. Environ., 42, 7954-7966 (2008). Particulate matter at a rural location in southern England during 2006: Model sensitivities to precursor emissions, R Derwent, C Witham, A Redington, M Jenkin, J Stedman, R Yardley, G Hayman Atmospheric Environment 43 (2009) 689-696. Cluster Analysis of Rural, Urban and Curbside Atmospheric Particle Size Data, D.C.S. Beddows, M. Dall’Osto and R.M. Harrison, Environ. Sci. Technol., 43, 4694-4700 (2009). An evaluation of measurement methods for organic, elemental and black carbon in ambient air monitoring sites, P. Quincey, D. Butterfield, D. Green, M. Coyle, J. Neil Cape, Atmos. Environ., 43 (2009) 5085-5091 The Wind Speed Dependence of the Concentrations of Airborne Particulate Matter and NOx, A.M. Jones, R.M. Harrison and J. Baker, Atmos. Environ., 44, 1682-1690 (2010). Temporal trends in sulphate concentrations at European sites and relationships to sulphur dioxide, A.M. Jones and R.M. Harrison, Atmos. Environ., 45, 873 – 882 (2011) 6.1 MAIN FINDINGS OF REPORTS AND PAPERS IN 2010 A description of the main findings of topic reports and papers published in 2010 is given below. 1) Paper - The Wind Speed Dependence of the Concentrations of Airborne Particulate Matter and NOx, A.M. Jones, R.M. Harrison and J. Baker, Atmos. Environ., 44, 1682-1690 (2010). It was found that the relationship between mean concentration (X) and wind speed (U) for a number of different metrics of airborne particulate matter and NOx could be represented by a general equation;
Χ = { ( U + c ) . exp ( -c’ U ) } . { a1 . U0 + a2 . U-1 + a3 . U3.4 } (1)

NPL Report AS 65
64
where c, c’, a1, a2, and a3 are constants – the latter three being related to the contribution to the airborne material from large area, discrete, and wind driven maritime sources respectively, and which can be determined for each metric and location. The choice of different values of a1, a2 and a3 allows the relationship to be described for different metrics (Figure 1). This relationship was found to be a better representation of the variation of concentration with wind speed than the assumption in traditional Gaussian dispersion models that concentration is inversely proportional to wind speed. Three examples of very different behaviour appear in Figure 6-1. Sulphate (Figure 6-1(a)) is an example of a pollutant arising from a large area source, in this case regional formation and long-range transport. Sensitivity to wind speed is markedly less than that for NOx (Figure 6-1(b)), a locally generated pollutant from point and line sources. Quite different behaviour is shown by chloride (Figure 6-1(c)) in which concentrations of locally emitted and regionally formed chloride aerosol fall with increasing wind speed at low wind speeds, but concentrations of marine-generated chloride increase markedly with wind speed at the higher values of wind speed. The general relationship was found not to be true when the measurement site was at the kerbside in a street canyon and the dominant source was vehicles in the canyon and at one site in the case of particle number concentration. For particulate nitrate there was a more rapid reduction of concentration with wind speed than was the case for the other metrics, and a better representation of the relationship was achieved by taking the right hand side of Equation (1) to the power of 1.5. It was suggested that this is a result of limiting factors imposed by the formation/dissociation equilibrium of ammonium nitrate which is a product of precursor materials, the concentrations of which will themselves be governed by wind speed. From a knowledge of the number of days on which a particular wind speed occurred it is possible to use Equation (1) to calculate the proportion of the metric due to each source type during that period. As one of the source types identified is marine aerosol this procedure may be a valuable tool in identifying the quantity of this natural component of PM10 over a period of time at any site. The results serve to illustrate the very different behaviours of the various pollutants, and show that they can be rationalised on the basis of understandable processes. Results from three types of site (urban roadside, urban background and rural) show the same underlying characteristics, and although further work is needed to test the generality of these observations, it seems unlikely that markedly different behaviours will be observed. 2) Topic Report – Review and interpretation of particulate carbon data from Marylebone Road and North Kensington in the period 2006 – 2009 A number of different methods for the measurement of elemental (or black) carbon were deployed at Marylebone Road and North Kensington over the period from 2006 to 2009 and this report presented an intercomparison of techniques and an interpretation of the airborne concentration data. The instrument intercomparison demonstrated that the R&P 5400 combustion instrument greatly under-estimated the elemental carbon concentration (by a factor of 1:4.8 compared to black carbon measured by aethalometer), probably largely because it depended upon impaction for the sample collection and this is inefficient at the small particle sizes present at Marylebone Road. At North Kensington, measurements of black carbon by aethalometer correlated very highly with measurements of elemental carbon measured in the laboratory with a thermal-optical analyser on co-located filter samples with a ratio of 1.00 ± 0.04. At Marylebone Road, however, a ratio between black carbon and elemental carbon of 1.82 ± 0.18 was found in the earlier period of sampling, whilst latterly this was reduced to 1.28 ± 0.08. The explanation for the change in the black carbon to elemental carbon relationship at Marylebone Road is unclear but the large scatter of data in the earlier period suggests that there may be a problem with data quality in the early samples. Marylebone Road is a heavily trafficked street canyon in which the wind above the building heights drives vortices with the canyon which lead to a strong directional dependence of concentration. The

NPL Report AS 65
65
diurnal pattern, and wind speed and wind direction dependence (Figure 6-2), of black carbon concentrations (measured by aethalometer) at Marylebone Road are similar to particle number, elemental carbon (measured by R&P 5400) and NOx, and confirm its status as a traffic-generated pollutant. Uncorrected non-volatile PM2.5 and PM10, to which there is a greater background material contribution, show (Figure 6-2) different wind direction dependence. Using the carbon data as a tracer for diesel exhaust lead to the conclusion that diesel exhaust contributes 38% to 42% of the PM10 and 61% to 80% of the PM2.5 at the Marylebone Road kerbside site and 12% to 14% of the PM10 and 18% to 22% of the PM2.5 at the North Kensington urban background site. 3) Paper - Temporal trends in sulphate concentrations at European sites and relationships to sulphur dioxide, A.M. Jones and R.M. Harrison, Atmos. Environ., 45, 873 – 882 (2011) The values of 12-month running mean concentrations of SO4
2- and ammonium were found to vary from year to year because of high values of monthly concentration which occurred in some years but not in others. This results in values for the long-term temporal trend in concentration that are influenced by the choice of period over which trend is calculated. A three month period of high monthly concentrations in early 2003 resulted in elevated values of the 12-month running means being calculated at many of the sites, but not at Marylebone Road where instrumentation problems meant that there were no data for this period. Limited reliance can therefore be placed on the representativeness of the trends calculated in these particulate metrics over the full period for which data is available. The example of monthly running mean concentrations of SO2 and SO4
2- at North Kensington are shown in Figure 3 with lines fitted by Sen’s method to the period over which SO4
2- was measured. Over this period SO2 concentrations reduced significantly by -0.28 µg m-3 yr-1 while there was a non-significant increase of 0.01 µg m-3 yr-1 in SO4
2-. Amongst the precursor gases, there was a significantly reducing trend in SO2 at all six UK sites. At two of the sites, Belfast Centre and North Kensington (Figure 6-3), the speed of this reduction became much less after 2001. At Rothamsted and Cromwell Road, where concentrations were relatively high, there were significant reductions in the 12-month running mean concentrations of ammonia, if the lower concentrations measured during the initial sampling period are discounted. At sites with lower mean concentrations there was much more variability in the 12-month running mean concentration between years. Analysis of published data for rural sites in Europe and the USA shows a relationship between the concentrations (χ) of SO4
2- and SO2 of the form: χ [ SO4
2- ] = a . χ [ SO2 ] b + c (2) where a, b and c are constants, and the value of the constant, a, decreases with increasing latitude. This type of relationship predicts reduced conversion of SO2 to SO4
2- at higher concentrations and is a reasonable representation of concentrations at the United Kingdom sites considered here, except where there are substantial local sources of SO2. At these sites the SO4
2- to SO2 relationship approached the general form over the period of measurement (Figure 6-4) as the significance of local sources was reduced. Substantial further reductions in SO2 (around 50%) would be required to achieve an appreciable reduction (1 µg m-3) in SO4
2-, and hence PM10. 4) Topic Report – Long and short-term temporal trends in airborne particle number concentration in the UK Particle number concentrations have been measured for various time periods at nine UK sites. Temporal trends were analysed after removal of the annual seasonal cycle of concentrations. Enhanced operational protocols in June 2005 caused a step change in concentrations (due to corrections for instrument drift and reduced particle losses in the inlet system) and hence the direction and magnitude of trends was examined in datasets before and after this date. During the earlier period

NPL Report AS 65
66
prior to June 2005, a modest but significant downward trend occurred at Belfast Centre, Glasgow Centre, Manchester Piccadilly, Port Talbot, North Kensington and Marylebone Road with a small non-significant positive trend at Birmingham Centre. In the post-June 2005 period, significant downward trends were observed at Belfast Centre, Birmingham, North Kensington and Marylebone Road. A rapid reduction in concentrations at the latter three sites occurred between late 2007 and early 2008. The trend of smoothed monthly particle number concentration at North Kensington is shown in Figure 6-5 with the time of the change in operational protocols indicated. Further analysis of trends in particle number concentration is continuing.
Figure 6-1(a): Dependence of sulphate concentration at North Kensington upon wind speed (Heathrow)

NPL Report AS 65
67
Figure 6-1(b): Dependence of NOx concentration at North Kensington upon wind speed (Heathrow)
Figure 6-1(c): Dependence of chloride concentration at North Kensington upon wind speed (Heathrow)
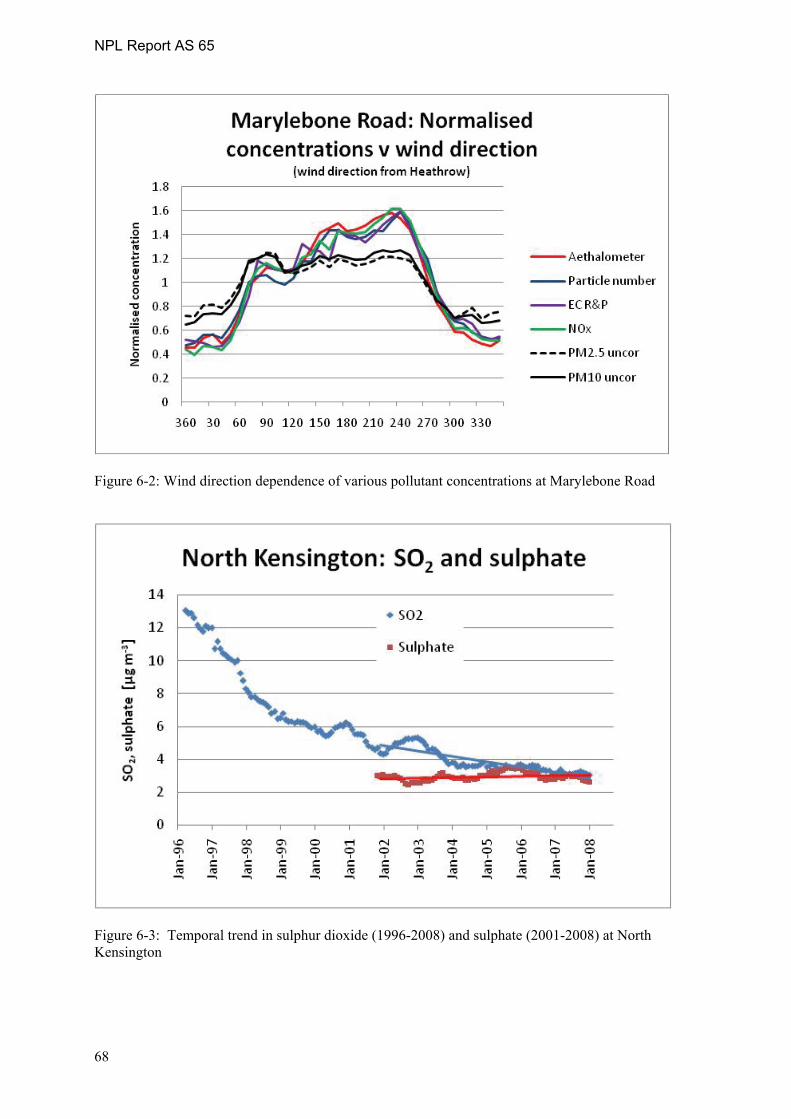
NPL Report AS 65
68
Figure 6-2: Wind direction dependence of various pollutant concentrations at Marylebone Road
Figure 6-3: Temporal trend in sulphur dioxide (1996-2008) and sulphate (2001-2008) at North Kensington

NPL Report AS 65
69
Figure 6-4: Relationship between sulphate and sulphur dioxide concentrations at UK sites. (Note convergence upon the line as concentrations follow the temporal trend indicated by the arrows)
Figure 6-5: Trends in particle number concentration at North Kensington, 2000-2009. (Note the change of protocol in 2005)

NPL Report AS 65
70
7 ACKNOWLEDGEMENTS We wish to acknowledge the support provided by the Department for Environment, Food and Rural Affairs (Defra) and the Devolved Administrations (the Scottish Government, Welsh Government and the Department of the Environment Northern Ireland) for this work under the contract CPEA 28.

NPL Report AS 65
71
Annex 1. Wind roses at Rochester
January 2010 No data for this month
February 2010 No data for this month
March 2010 No data for this month
April 2010 No data for this month
May 2010 No data for this month
June 2010 No data for this month
July 2010
0
5
10
15
20
25
300
1020
30
40
50
60
70
80
90
100
110
120
130
140
150
160170
180190
200
210
220
230
240
250
260
270
280
290
300
310
320
330
340350
m s 1 DegreesAverage Wind Rochester: 0710 2.71 111.73
August 2010
0
10
20
30
40
50
60
70
80
90
1000
1020
30
40
50
60
70
80
90
100
110
120
130
140
150
160170
180190
200
210
220
230
240
250
260
270
280
290
300
310
320
330
340350
m s 1 at DegreesAverage Wind Rochester: 0810 2.65 100.76
September 2010
0
10
20
30
40
50
60
70
800
1020
30
40
50
60
70
80
90
100
110
120
130
140
150
160170
180190
200
210
220
230
240
250
260
270
280
290
300
310
320
330
340350
m s 1 at DegreesAverage Wind Rochester: 0910 1.72 98.64
October 2010
0
10
20
30
40
50
600
1020
30
40
50
60
70
80
90
100
110
120
130
140
150
160170
180190
200
210
220
230
240
250
260
270
280
290
300
310
320
330
340350
m s 1 at DegreesAverage Wind Rochester: 1010 0.96 109.00
November 2010
0
10
20
30
40
50
60
700
1020
30
40
50
60
70
80
90
100
110
120
130
140
150
160170
180190
200
210
220
230
240
250
260
270
280
290
300
310
320
330
340350
m s 1 at DegreesAverage Wind Rochester: 1110 1.60 113.81
December 2010
0
10
20
30
40
50
600
1020
30
40
50
60
70
80
90
100
110
120
130
140
150
160170
180190
200
210
220
230
240
250
260
270
280
290
300
310
320
330
340350
m s 1 at DegreesAverage Wind Rochester: 1210 1.74 147.86


