
Oasis Water – Facilities Improvement
by
GUSTAV KRAAIJ
27061753
Submitted in partial fulfilment of the requirements for the degree of
BACHELORS OF INDUSTRIAL ENGINEERING
in the
FACULTY OF ENGINEERING, BUILT ENVIROMENT AND INFORMATION
TECHNOLOGY
UNIVERSITY OF PRETORIA
OCTOBER 2010
2 | P a g e
Executive Summary Oasis water was established 7 years ago, in the last three years the company grew so much
that they now have more than 100 outlets nationwide. Each outlet provides customers with
bottled filtrated water of sizes from 300ml up to 20l. They also provide customers with the
facility to refill their bottles at a bargain rate of 80c/l. Some of the outlets sell fruit juices
and carbonated water as an addition.
The rapid growth of Oasis Water in the last three years is due to the need for a reliable clean
and healthy water source. The company has no set standards for ergonomics, health and
safety, types of facilities layouts and materials handling equipment. The productivity of the
bottle filling process is very low, because they make use of manual valves to fill bottles.
Consequently lots of water is wasted when filling the bottles.
With this project the aim is to develop methods and solutions which will not only help with
setting standards for different areas within the outlets as mentioned above, but also to
improve productivity and minimize cost and wastage.
With the implementation of suggested material handling equipment, facility layouts and
automated machines the management of Oasis Water will improve their productivity, flow
of materials and utilization of space.
To finish the project successfully within the given deadlines a few tasks and milestones were
set to be reached in time.
3 | P a g e
Table of Contents 1. Introduction and Background 7
2. Problem Description 7
3. Project Aim 8
4. Project Scope 10
5. Deliverables 10
6. Project Plan 10
7. Literature Review 11
7.1 Importance of a literature review 11
7.2 Bottled water 11
7.2.1 Types of bottled water 12
7.3 Oasis water 12
7.3.1Types of water filtration 13
7.3.2 Oasis Water Factory 14
7.4 Methods Engineering 15
7.4.1Analyze data 15
7.5 Facilities Planning 15
7.5.1 Objectives of Facilities Planning 17
7.5.2 Facilities Planning Process 17
7.5.3 Facility layout types 18
7.5.4 Space and Ergonomic requirements 18
7.5.4.1 Work station 19
7.5.4.2 Aisle 19
7.5.4.3 Material Handling 20
7.5 Automation 21
8. Selection of Industrial Engineering Methods, Tools and 23
Techniques
8.1 Project selection 23
8.2 Facilities Planning 24
8.3 Material handling 24

4 | P a g e
8.4 Automation 24
9. Data, Design and Solutions 25
9.1 Facility layout 25
9.1.1 Factory 25
9.1.1.1 Current layout 26
9.1.1.2 Proposed layout 1 29
9.1.1.2.1 Evaluation of proposed layout 1 31
9.1.1.3 Proposed layout 2 32
9.1.1.3.1 Evaluation of Proposed layout 2 33
9.1.2 Franchise layout 36
9.1.2.1 Workstation space requirements 36
9.1.2.2 Proposed Oasis water outlet layout 37
9.2 Material handling 38
9.3 Automation 39
9.3.1 Solutions 40
9.3.2 Proposed design for the refill machine 43
9.3.2.1 Evaluation of design 44
9.3.3 Proposed design for bottle filling machine 44
9.3.3.1 Evaluation of design 45
10. Conclusion 46
11. References 47
Appendix A 49

5 | P a g e
List of Figures Figure 1. Layout of outlet in Gauteng 8
Figure 2. Bottle filling machine 8
Figure 3. Valves used to fill bottles 8
Figure 4. Chair used to sit on when labelling bottles 9
Figure 5. Brand comparison 12
Figure 6. Oasis water filtration process 13
Figure 7. Continuous improvement facilities planning cycle 16
Figure 8. Recommended Aisle Widths For various types of flow 19
Figure 9. Cause-and-effect diagram 23
Figure 10. Oasis Water products 25
Figure 11. Current layout of factory 26
Figure 12. Proposed layout 1 for factory 29
Figure 13. Storage racks 29
Figure 14. Roller conveyer 30
Figure 15. Platform trolley 30
Figure 16. Proposed layout 2 for factory 32
Figure 17. Automated machine layout 33
Figure 18. Proposed outlet layout 38
Figure 19. Containers 39
Figure20. Two-wheel hand truck 39
Figure 21. Current refill and filling machine 39
Figure 22. Semi-automatic gravity liquid filler 41
Figure 23. Semi-automatic Overflow filler 42
Figure 24. Proposed design for refill machine 43
Figure 25. Proposed design for the filling machine 44

6 | P a g e
List of Tables
Table 1. Production capacity comparison 33
Table 2. Contribution analysis between new and old machine 34
Table 3. Workstation space requirements 36
Table 4. Minimum space required for an outlet 37

7 | P a g e
1.Introduction and Background
Oasis water was established in December 2003 and currently has over a 100 outlets
nationwide which are operated on a franchise basis. Oasis water has already gone so far to
open outlets in other African countries such as Botswana and Namibia; they are also looking
to enter the international market, because of the need for a clean and reliable water source
globally.
Each Outlet consists of a filtration plant, where they then bottle their own filtrated water
and also provide their customers with the facility to refill their bottles at 80c/l. Some of the
outlets produce juices and carbonated water.
Oasis water makes use of one of the most successful business formats FASA (the Franchise
Association of Southern Africa) which is accepted globally. Their aim is : “For each franchise
to become an integral part of the community, by bringing the same core values of trust,
mutual respect and caring of the old corner store back to the neighbourhood it serves”.
2.Problem Description
The rapid growth in the number of outlets nationwide in the last three years, led to the
problem of not having standards set for the bottling process of the filtrated water, materials
handling, hygiene and the layout of different facilities.
A factory that is located in Witbank is responsible for producing larger volumes of bottled
water to mines and some of the outlets. The management would like to have a study done
regarding their process capabilities and improvement of their facilities layout and
productivity that can be implemented at their factory in Witbank. They would also like to
investigate the cost implementations for implementing automated machines.

8 | P a g e
3.Project Aim The aim of this project in the whole is to improve processes within outlets and setting
standards for material handling equipment, ergonomics and hygiene. Another aim is to do a
study on new product development. In more detail the aim is to:
Improve the layout of different outlet types and setting a standard for the different
types, not only to optimize the processes, but also to minimize cost.
Figure 1. Layout of an outlet in Gauteng,
As it can be seen in Figure 1 there is no flow in the process of bottling water.
Improve the process of bottling water to minimize waste and processing time.
Figure 2. Bottle filling machine. Figure 3. Valves used to fill bottles.
Counter
F
rid
ge
Fridge
Bo
ttle
Fill
er
Raw Materials
Raw materials and final products
Filt
er
Storage
tank
Storage
tank
Entr
an
ce
Final
Products

9 | P a g e
Improve materials handling equipment which will make it easier for workers to move
raw materials and final products.
Improve the ergonomics by using the OHSA as basis for setting standards within
outlets.
Figure 4. Chair used to sit on when labelling bottles.
Calculate the minimum space required for an outlet to fully operate, taking into
account machine space, isles, storage etc.
Alternative layout for the factory in Witbank to increase productivity. Implementing
material handling systems to minimize the movement of materials.
Due to the lack of time and resources it might be that not all of the problems will be solved.
10 | P a g e
4.Project Scope To successfully complete the project some constraints and boundaries needed to be taken
into consideration. Some of these boundaries and constraints are:
Franchisees do have budget constraints; they might not have the capital to purchase
the suggested solutions.
All the different outlets do not have the same layout configuration and size and
consequently it will be difficult to set one standard way of setting up the bottling
process and the layout.
5.Deliverables With completion of the project the following will be delivered:
A standard improved layout for the different outlet types which optimizes
productivity and minimizes cost.
Implementing an automated filling machine which will minimize wastage of filtrated
water and improves productivity.
Implementing materials handling equipment which will make it easier for workers to
move raw materials and final products at outlets and the factory.
Ergonomic standards that should be put into practice by all franchisees.
A set standard for the minimum space required to fully operate an outlet.
Alternative layout for the factory in Witbank.
Cost of implementing automated machines.
Alternative design for the current bottle filling machine at outlets.
All these will be delivered if the time is available.
6.Project Plan For the purpose of this report the project plan is not required and therefore it is presented in Appendix A.

11 | P a g e
7.Literature Review
7.1 Importance of a literature review A literature review is a report that summarizes all of the published work from researchers
done on a specific topic. The purpose of the literature review is to convey the management
of Oasis water with knowledge about ideas, methods and designs which can be
implemented to gain the advantage over their competitors in the market. A literature
review was done on the following topics:
Bottled water
Facilities Planning
Material handling
Automation
The sources to find literature related to a specific problem are found in books,
questionnaires, journals, articles, newspapers etc.
7.2 Bottled water Bottled water is where drinking water is being packed into bottles in the form of glass or
plastic. Due to the unreliable water supply in South Africa the market growth were rapid
from 2000 upwards. According the report of BMI foodpack the market grew 30% from 2006
to 2007, for the last 18 months the sales of bottled water decreased as the market started
to mature. BMI foodpack also estimate the amount of water to be consumed during the
World Cup to be 1.7 million litres.[3][7]
The rapid growth in the market relate to factors such as[3]:
The poor quality of water from municipalities
New product launches by existing competitors
New competitors entering the market
Bottled water now available nation wide
Increase in marketing strategies among competitors

12 | P a g e
7.2.1 Types of bottled water
Bottled water is packed with water from different water sources; therefore there are
different types of bottled water. These types are [11]:
Mineral water: Water that is sourced from underground where it was filtered
through rock formations at relative constant temperatures. It is bottled at the spring
where the water gets to the surface.
Prepared water: Water that has undergone treatment to remove impurities and
bacteria. This water may originate from any type of water supply.
7.3 Oasis water Oasis water is one of the best purified water producers in South Africa. It is ozonated,
oxygen enriched and purified to the greatest standards. This means it will aid in living a
healthier life. It is also recommended by some of the best homeopaths and other medical
clinics in Gauteng. Oasis water has been proven to benefit people with common ailments
such as asthma, high blood pressure and migraines only to mention a few[9].
Their filtration process is the basis for their quality of water.
In figure 5 below Oasis water is compared against some of the leading brands in South
Africa. Oasis water has the lowest total dissolved solids score and therefore it is known for
as one of the cleanest water suppliers.
Brand 1 Brand 2 Brand 3
Oasis
Water
64 mg/l 52 mg/l 111 mg/l
<20
mg/l
5 mg/l 3 mg/l
15.4
mg/l
<2
mg/l
1 mg/l 2 mg/l
7.12
mg/l
<0.1
mg/l
< 5 mg/l < 5 mg/l
2.21
mg/l
<2
mg/l
1 mg/l
< 0.05
mg/l
0.32
mg/l
<0.3
mg/l
Total Dissolved Solids (TDS)
Calcium (Ca++)
Magnesium (Mg++)
Sulphate (SO4--)
Nitrate (NO3-)
Figure 5. Brand comparison

13 | P a g e
7.3.1Types of water filtration
a) The filtration process of Oasis Water as from their website is as follows[10]:
Figure 6. Oasis water filtration process
Oasis water is also compliant to the SANS(South African National Standards) 241 standards.
b) Distillation
In this filtration process the water are boiled the vapour of this boiling water then passes
through a condenser where the vapour are then cooled down and collected. [4]
Disadvantages of this process are:
Consumes lots of energy.
Costs are high.
Space requirements are large.
Not all contaminants are removed.
Step 1: Sand Filtration, removes sludge and other un-dissolved solids .
Step 2: Carbon Filtration, removes pesticides , hormones , herbicides and other organic chemicals.
Step 3: Element Filtration, a 5 micron element filter removes un-dissolved solids.
Step 4:Reverse Osmosis, removes all sodium and 98% of the dissolved solids.
Step 5: UV Treatment, sanitizes water before ozonation takes place.
Step 6: Ozonation, removes all bacteria and virusses.

14 | P a g e
c) Basic Filtration
In this filtration process the water is poured through three types of filters namely; depth,
screen and surface filter. These 3 filters will almost remove 100% of the suspended solids in
the water, but it will not remove dissolved inorganics, chemicals, pyrogens and all colloidals.
This process has high expendable costs.
From these filtration methods mentioned above the process that Oasis use is the most
effective and it produce the highest quality of water for least amount of energy. [4]
7.3.2 Oasis Water Factory
The factory of Oasis water is situated in Witbank. The purpose of this factory is to supply
some franchises with products that they are not able to produce at their facility. The factory
also supplies water in the form of 20 litre containers to the mining group Xstrata close to
Witbank. They also supply supermarkets such as Pick and Pay with bottled water. The
volume of bottled water produced at the factory is much higher than the volumes of the
franchises. Therefore the factory will also be investigated and improved in this project.
15 | P a g e
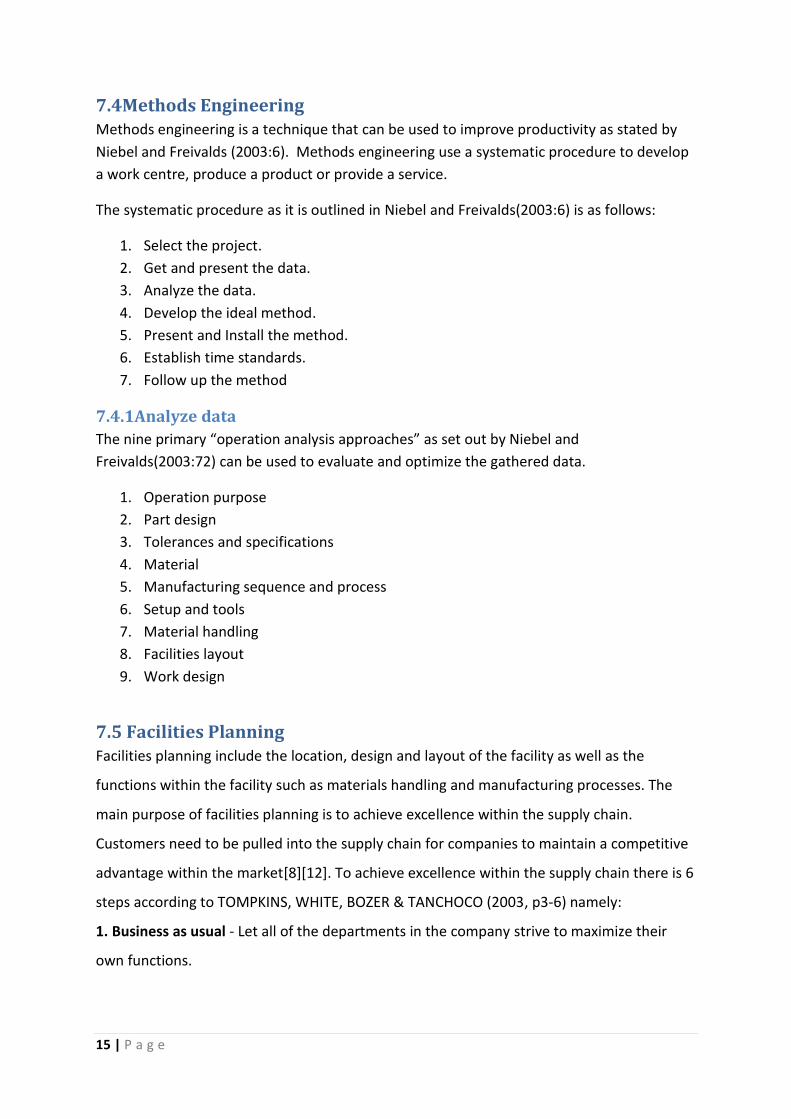
7.4Methods Engineering Methods engineering is a technique that can be used to improve productivity as stated by
Niebel and Freivalds (2003:6). Methods engineering use a systematic procedure to develop
a work centre, produce a product or provide a service.
The systematic procedure as it is outlined in Niebel and Freivalds(2003:6) is as follows:
1. Select the project.
2. Get and present the data.
3. Analyze the data.
4. Develop the ideal method.
5. Present and Install the method.
6. Establish time standards.
7. Follow up the method
7.4.1Analyze data
The nine primary “operation analysis approaches” as set out by Niebel and
Freivalds(2003:72) can be used to evaluate and optimize the gathered data.
1. Operation purpose
2. Part design
3. Tolerances and specifications
4. Material
5. Manufacturing sequence and process
6. Setup and tools
7. Material handling
8. Facilities layout
9. Work design
7.5 Facilities Planning Facilities planning include the location, design and layout of the facility as well as the
functions within the facility such as materials handling and manufacturing processes. The
main purpose of facilities planning is to achieve excellence within the supply chain.
Customers need to be pulled into the supply chain for companies to maintain a competitive
advantage within the market[8][12]. To achieve excellence within the supply chain there is 6
steps according to TOMPKINS, WHITE, BOZER & TANCHOCO (2003, p3-6) namely:
1. Business as usual - Let all of the departments in the company strive to maximize their
own functions.

16 | P a g e
2. Link Excellence – Remove all the boundaries between departments so that they will be
able to function as one.
3. Visibility - All departments need to know what others do for them to support each other
and hereby achieve supply chain excellence.
4. Collaboration – Find the best strategies to meet the customer demands.
5. Synthesis – Improve the flow between supply chain links to achieve customer
satisfaction.
6. Velocity – Improve the speed of flow between supply chain links to always stay in front of
other competitors.
Companies also need to continuously improve and maintain their facilities plan for supply
chain excellence. For companies to continuously improve their facilities planning TOMPKINS,
WHITE, BOZER & TANCHOC (2003, p6) developed a continuous improvement facilities
planning cycle it can be seen in figure 6 on page 14.
Figure 7. Continuous improvement facilities planning cycle.

17 | P a g e
7.5.1 Objectives of Facilities Planning
The customer is an integral part of the supply chain and therefore they should be one of the
primary objectives of facilities planning. In general, according to TOMPKINS, WHITE, BOZER
& TANCHOCO (2003, p12-13) the objectives of facilities planning are:
Improve customer satisfaction.
Increase return on assets (ROA).
Increase speed to improve customer response.
Reduce manufacturing costs and increase profitability.
Improve communication and partnerships within the supply chain.
Support the organization’s vision through improved material handling, material
control and good housekeeping.
Increased utilization of people, equipment, space and energy.
Maximize return on investments (ROI).
Let the facility be as flexible as possible to maintain the facility with no difficulty.
Improve ergonomics within the facility.
Some facilities will not be able to meet all of the objectives mentioned above.
7.5.2 Facilities Planning Process
A facility is normally planned once and thereafter the objectives of the facility may change.
This means that the facility needs to be improved continuously to satisfy the changing
objectives. The traditional engineering process can be used to describe the facilities
planning process. The process as from TOMPKINS, WHITE, BOZER & TANCHOCO (2003, p13-
14) is as follows:
1. Define the problem: Products to be produced at the facility and quantities to be
produced. Define the objectives of the facility.
2. Analyze the problem: Define the interrelationships among different activities. Define the
role of the activities within the facility.
3. Space Requirements: Define the space requirements of machine, personnel, raw
materials and other activities. Alternative facility plans need to be generated.
4. Evaluate alternative plans: Rank the alternative plans according certain criteria and
determine the contribution of each plan towards the facility and its operations.

18 | P a g e
5. Select the preferred design: Select the best alternative plan which satisfies the objectives
minimizes cost and which have the greatest contribution towards the facility.
6. Implement the design: The design selected need to be implemented, maintained and the
objectives of the facility must be redefined constantly.
7.5.3 Facility layout types
When designing a layout it needs to be kept in mind that there are different types of
layouts. The different layout types are:
Process layout
A process layout is were generally purpose machines are grouped together according to
functions or processes for example milling, forging, bending, etc. Therefore this layout can
produce a variety of products with low volumes needed. This is the most flexible layout
type.
Product Layout
A product layout is where resources are arranged sequentially to produce a standardized
product with producing large volumes. This layout is less flexible than the process layout.
Fixed position layout
In this layout the product stays stationary and resources move to work on the product. This
layout is not commonly used because it is used to produce large products such as aircrafts.
At oasis water they need to produce high volumes of a standardized product and therefore
they would make use of a product layout that is flexible. This should be kept in mind when
designing the layout of the facility at the franchises and the factory in Witbank.
7.5.4 Space and Ergonomic Requirements
To determine the true space requirements in facilities some factors such as the growth in
demand, product size, personnel requirements, aisle widths and machine sizes only to
mention a few, need to be taken into consideration.
Ergonomic standards related to the man labour, hygiene, floor types etc also need to be
taken into consideration while planning the facility.

19 | P a g e
7.5.4.1 Work station
To determine the space requirements for a machine the following need to be taken into
account[12]:
Physical geometrics of the machine.
Space for maintenance on the machine.
Machine travel.
Tools and other equipment.
Space for the operator and other employees at the workstation.
Space for material handling.
Raw materials.
In-process materials.
Final products.
Material handling.
7.5.4.2 Aisle
The space requirements for an aisle are primarily based on the type of material handling
equipment used and the flow of materials within the facility. Different types of flow require
different aisle widths[12]. The recommended aisle widths for different types of flow as
recommended by TOMPKINS, WHITE, BOZER & TANCHOCO (2003, p115) are listed in the
table below.
Figure 8. Recommended Aisle Widths For various types of flow.

20 | P a g e
7.5.4.3 Material Handling
Material handling relates to the movement, protection and control of materials and
products within the facility. The type of material handling system used accounts for 25% of
employees, 55% of total space required and 87% of the production time as stated by
FRAZELLE(1986). The material handling equipment used in a facility is an important
component of the facilities design and space requirements[8].
The design of material handling equipment can be done according to the engineering 6 step
process. The 6 steps for the design are as follows[12]:
1. Define objectives of material handling equipment.
2. Analyze the requirements.
3. Generate alternative designs of material handling equipment.
4. Evaluate alternative designs.
5. Select the preferred design.
6. Implement and maintain the selected material handling equipment.
Material handling principles developed by the Materials Handling Institute (1998) provides
the fundamentals of material handling. These 10 principles are[6]:
1. Planning Principle: Material handling plan which define the method to use with
taking into account the limitations and functional requirements to meet the
performance objectives.
2. Standardized Principle: Standardization means that there will be less variation in
the methods to be used and less complex designs for equipment to be used.
3. Work Principle: The physical work should be minimized and the productivity
maximized without influencing the quality of service required.
4. Ergonomic Principle: Ergonomic standards must be set, which suit the abilities of
the worker.
5. Unit Load Principle: A unit load is one entity that is made up by other items. The size
of the unit load increase flow and save space.
6. Space Utilization Principle: Use three dimensional space as effective as possible.
7. System Principle: Entities need to be integrated to form a whole which increase the
flow of the system.
21 | P a g e
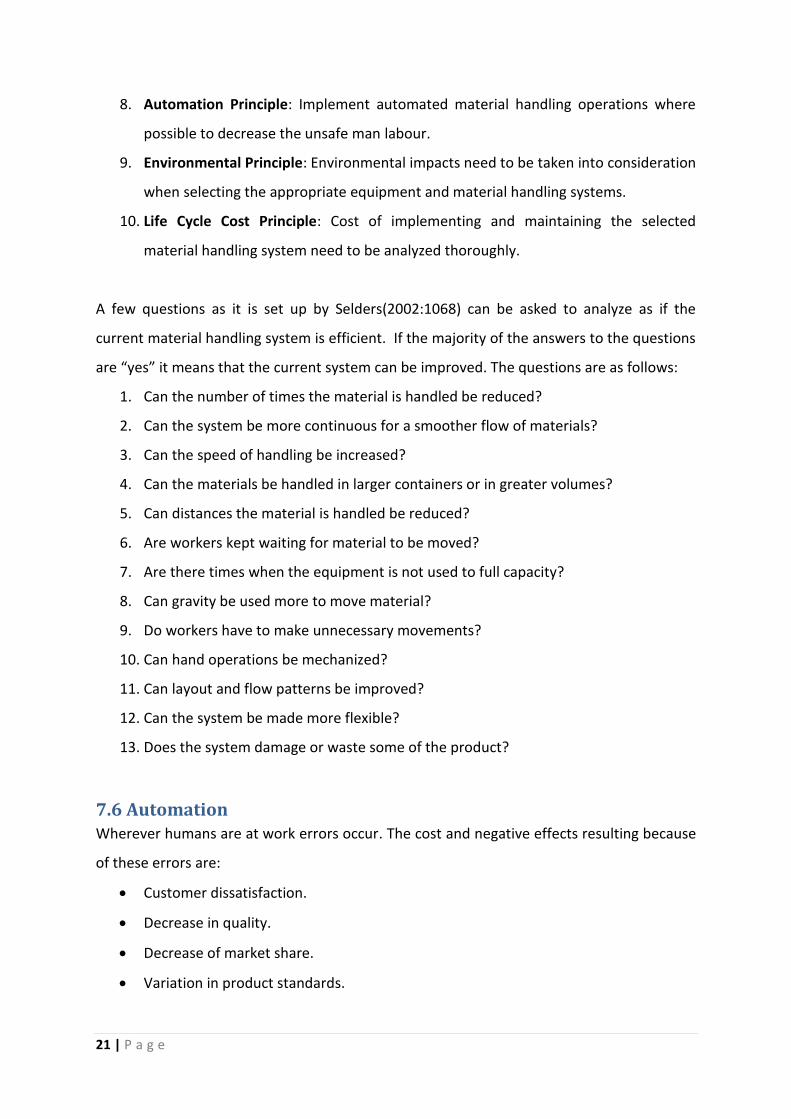
8. Automation Principle: Implement automated material handling operations where
possible to decrease the unsafe man labour.
9. Environmental Principle: Environmental impacts need to be taken into consideration
when selecting the appropriate equipment and material handling systems.
10. Life Cycle Cost Principle: Cost of implementing and maintaining the selected
material handling system need to be analyzed thoroughly.
A few questions as it is set up by Selders(2002:1068) can be asked to analyze as if the
current material handling system is efficient. If the majority of the answers to the questions
are “yes” it means that the current system can be improved. The questions are as follows:
1. Can the number of times the material is handled be reduced?
2. Can the system be more continuous for a smoother flow of materials?
3. Can the speed of handling be increased?
4. Can the materials be handled in larger containers or in greater volumes?
5. Can distances the material is handled be reduced?
6. Are workers kept waiting for material to be moved?
7. Are there times when the equipment is not used to full capacity?
8. Can gravity be used more to move material?
9. Do workers have to make unnecessary movements?
10. Can hand operations be mechanized?
11. Can layout and flow patterns be improved?
12. Can the system be made more flexible?
13. Does the system damage or waste some of the product?
7.6 Automation Wherever humans are at work errors occur. The cost and negative effects resulting because
of these errors are:
Customer dissatisfaction.
Decrease in quality.
Decrease of market share.
Variation in product standards.
22 | P a g e
Increase in wastage.
The capital investment to implement automated machines is high, but all of the above costs
and negative effects will decrease when a process is automated. If the demand is there the
cost of implementing an automated machine will be returned in a short period of time.
The automated bottle filling technology is so far in advance with technology that no man
work is needed to fill, label and cap a liquid filled bottle. Manual filling operations can be
replaced by semi- or full automatic machines.

23 | P a g e
8.Selection of Industrial Engineering Methods, Tools and Techniques
To successfully complete this project the appropriate Industrial Engineering Methods, Tools
and techniques need to be utilized. Due to the nature of this project a lot of methods, tools
and techniques as well as engineering principles will be combined to meet the aim of this
project.
8.1 Project selection For the selection of the project a cause-and-affect diagram was used. This was completed in
the first phase of the project. From this cause-and-effect diagram was found that the
facilities layout, material handling and manual operations was the main problems which led
to low productivity and wastage of water within facilities.
Manual operations Manual handling
Poor design Lack of equipment
No flow
No logic sequence Not used
Figure 9. Cause-and-effect diagram.
The material handling systems implemented at the different outlets and at the factory in
Witbank was investigated by means of an audit checklist. The following problems revealed
opportunities for improving material handling systems at the facilities:
Long distances of material handling
Manual handling of materials
Insufficient utilization of material handling equipment
Material packed directly on to floor
Insufficient use of unitizing principles
Equipment and tools Facility layout
Processes Material handling
Low
productivity

24 | P a g e
Processes stopped to handle material
Poor utilization of 3 dimensional space
Flow of materials can be improved
Lots of time wasted by handling materials
Backtracking of materials
8.2 Facilities Planning As stated in 7.4.2 of this project report the traditional engineering design steps was used to
execute the Facilities Planning Process. Flow diagrams will be used to display current as well
as proposed layouts for the factory and the ideal franchise. Microsoft visio is used to draw
the layouts.
8.3 Material handling To optimize the material handling equipment in use and to design or select other material
handling equipment the principles and design steps discussed in section 7.5.3.3 was used as
guidelines. The questions mentioned in 7.5.3.3 were used to identify opportunities to
improve the current material handling system.
8.4 Automation To improve productivity and minimize wastage the manufacturing processes need to be
automated. The basics and logics of machine design are used to improve the manufacturing
process. The selection of automated machines to replace manual operations is guided by
the traditional engineering design steps and general knowledge of automated machines.

25 | P a g e
9.Data, Design and Solutions
9.1 Facility layout
9.1.1 Factory
The factory of Oasis Water located in Witbank produces a variety of products. The 3 main
products produced at the facility are bottled water, carbonated water and fruit juice. The
factory makes use of a “Just In Time”(JIT) production approach. The demand for the
different products determines which product or products will be produced at what time and
the number of workers allocated to machines.
Due to the nature of the products they produce they have a seasonal demand which means
the demand is much higher in the summer seasons than it is in the winter seasons.
Therefore the factory makes use of seasonal contracts for employing workers. Some of the
products the franchise and the factory produce can be seen in figure 9.
Figure 10. Oasis Water products
26 | P a g e
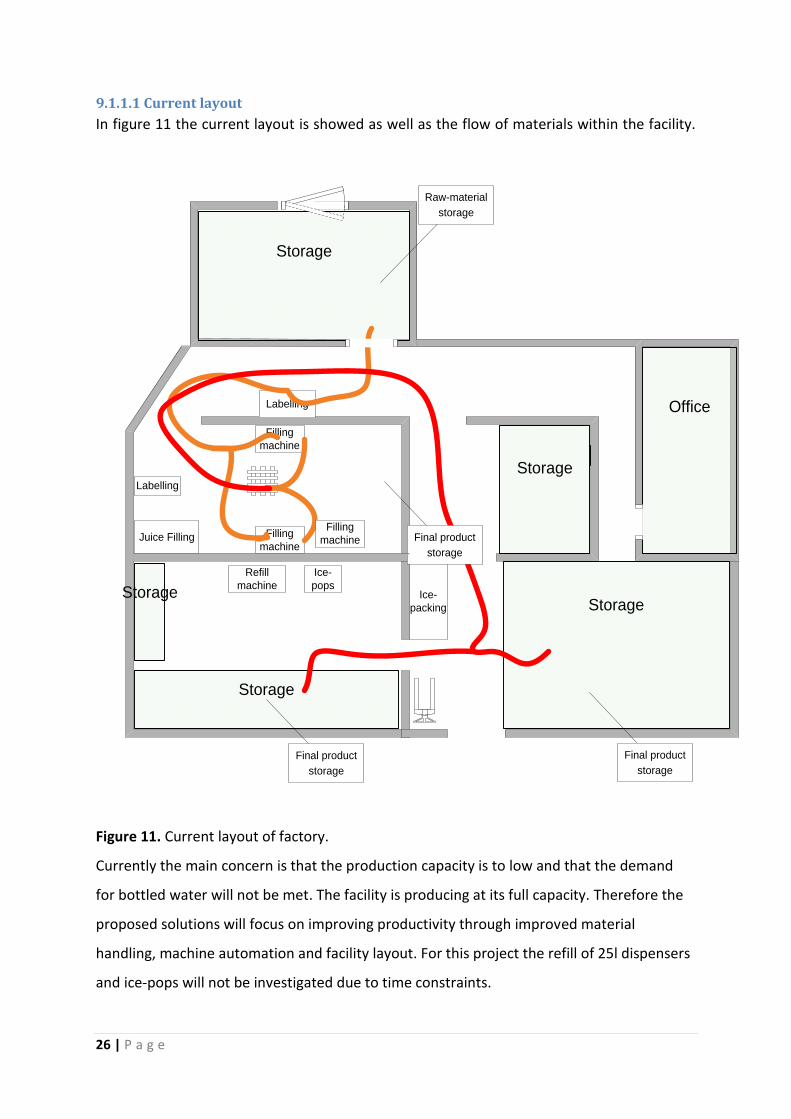
9.1.1.1 Current layout
In figure 11 the current layout is showed as well as the flow of materials within the facility.
Office
Storage
Storage
Storage
Storage
Filling
machine
Filling
machine
Labelling
Labelling
Juice Filling
Storage Ice-
packing
Refill
machine
Ice-
pops
Raw-material
storage
Final product
storage
Final product
storage
Final product
storage
Filling
machine
Figure 11. Current layout of factory.
Currently the main concern is that the production capacity is to low and that the demand
for bottled water will not be met. The facility is producing at its full capacity. Therefore the
proposed solutions will focus on improving productivity through improved material
handling, machine automation and facility layout. For this project the refill of 25l dispensers
and ice-pops will not be investigated due to time constraints.

27 | P a g e
This facility consists of the following areas:
1. Raw-materials storage
2. Production(filling, capping, packing)
3. Final product storage
4. Refill of 25l drums and ice pops production
5. Offices
Production process steps:
1. Raw-materials(bottles, caps, labels) are currently received at the door on the top of
the facility layout in figure 11 where they are piled to heights of approximately 6m. A
worker then makes use of a folding ladder to collect bottles from the top of the pile.
2. Bottles moved to labelling area where 2 workers label bottles manually.
3. Labelled bottles then moved to production area to fill with water by two manual
filling machines(figure 20) and then capped manually.
4. Bottles then packed into boxes and placed onto a pallet.
5. Full pallet moved to final product storage area by means of a manual pallet truck
where they are ready for delivery.
The workers at the carbonated water and juice filling machines are responsible for labelling,
filling and capping of their product. This is because the demand for these two products is
low.
The following problems revealed opportunities for improvement within the facility:
Collection of bottles by means of a large folding ladder is not safe for workers.
Manual handling to move bottles makes it timely and difficult for workers to move
materials.
Manual filling machine is timely.
Materials are moved long distances.
Backtracking of materials.
Lack in the flow of production processes.
Bottlenecks at the filling machines.

28 | P a g e
Resources:
Workers
3 permanent workers
4 seasonal contract workers
1 production manager
1 manager
4 admin workers
Machines:
2 water filling machines
1 carbonated water filling machine
2 juice filling machines
Material handling equipment:
1 manual pallet truck

29 | P a g e
9.1.1.2 Proposed layout 1
Office
Storage
Storage
Storage
Storage
Filling
machine
Filling
machine
Labelling
Labelling
Juice Filling
Storage Ice-
packing
Refill
machine
Ice-
pops
Electric
Forklift
Manual pallet
truck
Raw-material
storage
Final product
storage Final product
storage
Packaging
Filling
machi
ne
Figure 12. Proposed layout 1 for factory.
Recommendations made to improve the facility:
Double storage racks as in figure 13 should be implemented to utilize 3 dimensional
space and to improve stock keeping.
Figure 13. Storage racks.
Roller
conveyer

30 | P a g e
Labelling, filling and packaging need to be in 3 different areas for the company to
comply with HACCP-Based Standard Operating Procedures, which make the factory
able to supply all of the retail stores.
Electronic forklift to improve speed of material handling and loading of final
products onto carriers.
A roller conveyer should be connected to the filling machines where bottles can then
be placed into containers as in figure 18 where they then move down the conveyer
to the packaging area where they are boxed and packed onto a pallet.
Figure 14. Roller conveyer.
In section 9.3.3 an improved design for the current filling machine is showed, which
will improve the productivity for bottle filling.
Labelling for juice and carbonated water done at labelling process.
Ergonomic seating at different operations.
Make use of platform trucks(figure 15) to move empty labelled bottles to the filling
machines.
Figure 15. Platform trolley.
For this proposed layout the conveyer will contribute the most for improving productivity
and flow of materials. The cost of implementing a 6m conveyer will be ±R10000.

31 | P a g e
9.1.1.2.1 Evaluation of proposed layout 1
The initial costs of implementing the recommendations will be high, but these
improvements will lead to:
Increase in productivity
Materials moved shorter distances
Less manual handling of materials
Improved flow of materials
Better stock control
Improved safety
Improved quality of work
Minimize time lost by moving materials between processes
Improved ergonomic standards
The time saved by the improved flow of materials will mean that workers will be able to
improve their productivity and produce more bottles per day.

32 | P a g e
9.1.1.3 Proposed layout 2
Office
Storage
Storage
Storage
StorageLabelling
Storage Ice-
packing
Refill
machine
Ice-
pops
Electric
Forklift
Manual pallet
truck
Raw-material
storage
Final product
storage Final product
storage
capping
Automatic
filling machine
Packaging
Figure 16. Proposed layout 2 for factory.
Recommendations made to improve the facility:
Fully automatic filling, capping and labelling machine. A sketch of a fully automated
machine from the website of Inline Filling Systems can be seen in figure 17.
Roller
conveyer

33 | P a g e
Figure 17. Automated machine layout.
Electronic forklift which will improve the speed of moving material and loading final
products onto carriers.
Storage racks to fully utilize 3 dimensional space and improve stock control.
Ergonomic seating at different operations.
9.1.1.3.1 Evaluation of Proposed layout 2
A cost analysis was done to determine the payback time of implementing an automated
filling machine. For this calculation the maintenance cost was left out because this cost will
be approximately the same for the old and new machine.
Currently the factory produces one type of product per day for example on the first day
500ml bottles will be produced, the second day 1500ml will be produced and the third day
5000ml will be produced. The demand equals the production for the day. This means the
production capacity is full. A market study revealed that the demand is 10% higher than the
current production capacity. Therefore the factory has lost sales because of the demand
that is not met.

34 | P a g e
The production capacity as well as the increase in productivity can be seen in table 1. Time
studies revealed that the current production rate is 250 bottles per hour. The new machine
has n production rate of 1800 bottles per hour, but with stoppage allowance of 20% the
machine will be able to produce 1440 bottles per hour. The current demand will not fill this
capacity, but demand forecasts show that the demand will fill the capacity of the new
machine in the near future.
Table 1. Production capacity comparison.
Production Capacity
Units per hour Units per day
Old machine 250 2000
New machine 1440 11520
Increase in productivity 576%
The new machine make use of only 4 workers instead of 7, this means there is saving of
R300 per day. The increase of 10% in demand will increase the daily turnover.
The calculations in table 2 show that the increase in the average daily contribution will be
R1091.67. This means that the recommended machine with a cost of R346575 will be paid
back in 317 days or 0.87 years. This payback period will be much shorter because the
increase in demand annually is not taken into consideration for this calculation.

35 | P a g e
Table 2. Contribution analysis between new and old machine.
InputsR 100.00
Maintenance R 0.00 500ml 1500ml 5000ml
Demand per day 2000 1800 1500
Demand per day +10% 2200 1980 1650
Cost of automated machine R 346 575.00
Contribution of current machine
500ml 1500ml 5000ml
Units Price Total Units Price Total Units Price Total
Sales 2000 R 3.90 R 7 800.00 1800 R 6.50 R 11 700.00 1500 R 11.50 R 17 250.00
Materials cost 2000 R 2.00 -R 4 000.00 1800 R 2.50 -R 4 500.00 1500 R 3.00 -R 4 500.00
Labour cost 2000 R 0.35 -R 700.00 1800 R 0.39 -R 700.00 1500 R 0.47 -R 700.00
Cotribution p/u R 1.55 R 3.61 R 8.03
Total contribution R 3 100.00 R 6 500.00 R 12 050.00
Contribution of automated machine
500ml 1500ml 5000ml
Units Price Total Units Price Total Units Price Total
Sales 2000 R 3.90 R 7 800.00 1800 R 6.50 R 11 700.00 1500 R 11.50 R 17 250.00
Materials cost 2000 R 2.00 -R 4 000.00 1800 R 2.50 -R 4 500.00 1500 R 3.00 -R 4 500.00
Labour cost 2000 R 0.20 -R 400.00 1800 R 0.22 -R 400.00 1500 R 0.27 -R 400.00
Cotribution p/u R 1.70 R 3.78 R 8.23
Additional cont p/u R 0.15 R 0.17 R 0.20
Savings on labour R 300.00 R 300.00 R 300.00
Increase in sales 10% 10% 10%
new cont p/u R 1.72 R 3.80 R 8.26
Total contribution R 3 780.00 R 7 520.00 R 13 625.00
Increase in contribution R 680.00 R 1 020.00 R 1 575.00
Total increase in cont(3days) R 3 275.00
Total increase in cont(p/day) R 1 091.67
Pay back time(days) 317
Pay back time(years) 0.87
Labour cost per day p/worker
36 | P a g e
9.1.2 Franchise layout
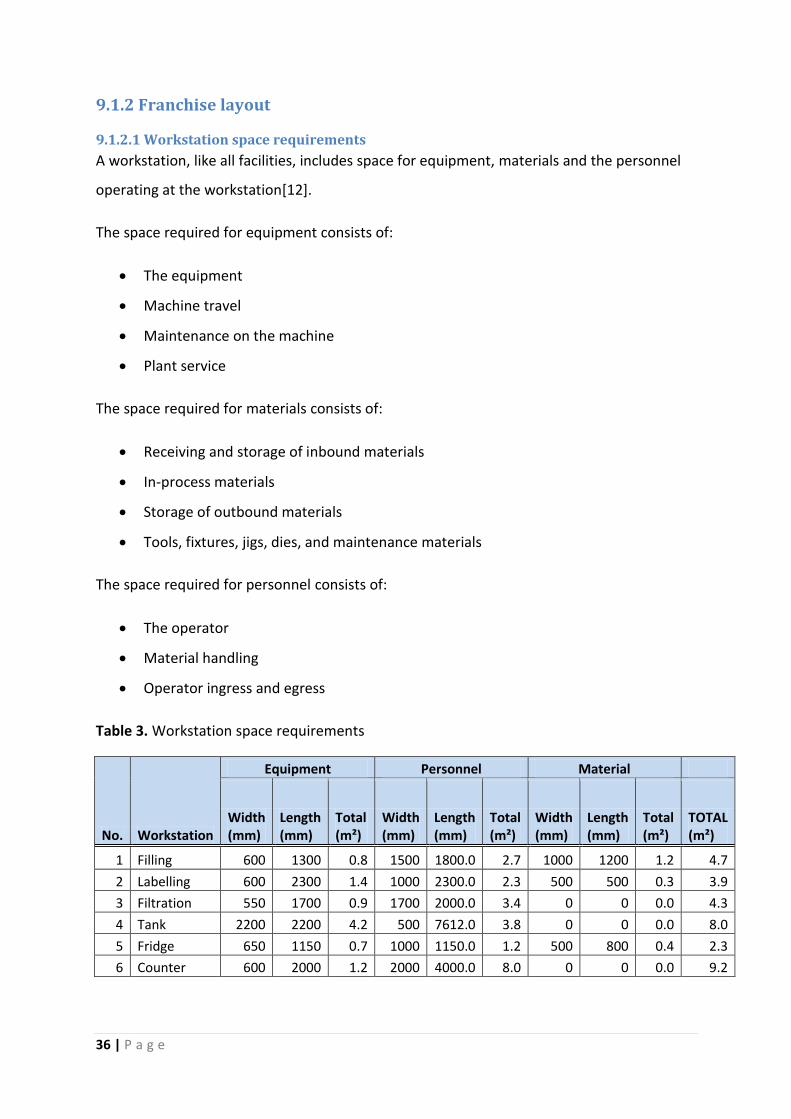
9.1.2.1 Workstation space requirements
A workstation, like all facilities, includes space for equipment, materials and the personnel
operating at the workstation[12].
The space required for equipment consists of:
The equipment
Machine travel
Maintenance on the machine
Plant service
The space required for materials consists of:
Receiving and storage of inbound materials
In-process materials
Storage of outbound materials
Tools, fixtures, jigs, dies, and maintenance materials
The space required for personnel consists of:
The operator
Material handling
Operator ingress and egress
Table 3. Workstation space requirements
No. Workstation
Equipment Personnel Material
Width (mm)
Length (mm)
Total (m²)
Width (mm)
Length (mm)
Total (m²)
Width (mm)
Length (mm)
Total (m²)
TOTAL (m²)
1 Filling 600 1300 0.8 1500 1800.0 2.7 1000 1200 1.2 4.7
2 Labelling 600 2300 1.4 1000 2300.0 2.3 500 500 0.3 3.9
3 Filtration 550 1700 0.9 1700 2000.0 3.4 0 0 0.0 4.3
4 Tank 2200 2200 4.2 500 7612.0 3.8 0 0 0.0 8.0
5 Fridge 650 1150 0.7 1000 1150.0 1.2 500 800 0.4 2.3
6 Counter 600 2000 1.2 2000 4000.0 8.0 0 0 0.0 9.2

37 | P a g e
The minimum space required for an outlet is determined by adding the area of the
individual workstations within the outlet. The aisle allowance for the outlet is added as a
percentage of the sum of the workstations. Additional space for wastage, storage and other
operations within the facility were also considered. Table 4 shows the minimum space
required for an Oasis Water outlet.
Table 4. Minimum space required for an outlet
Outlet Space Requirement
Workstation Quantity Area Total(m²)
Filling 2 4.7 9.4
Labelling 1 3.9 3.9
Filtration 1 4.3 4.3
Tank 2 8 16
Fridge 1 2.3 2.3
Counter 1 9.2 9.2
Storage 10
Total 55.1
Aisle allowance 15%
Total area required 63
9.1.2.2 Proposed Oasis Water outlet layout
In figure18 the proposed layout for an outlet is showed. Processes within the outlet need to
be sequenced and consequently the flow within the facility will improve. This will improve
productivity and an organised facility layout.

38 | P a g e
Tank Tank
Filtration
Raw-Materials
Filling, capping and labelling.
Final Products
Counter
Re-fill machine
Final Products
Platform
truck
Figure 18. Proposed outlet layout
9.2 Material handling A material handling system was developed for each of the alternative factory layouts. The
problem is that the factory currently only has one manual pallet truck which is used to move
the pallet with final products on it. The rest of the materials are moved by hand labour. This
means the proposed solutions will need large amounts of costs to implement other material
handling equipment. The following alternatives are suggested for further use by the
management:
They can implement an electronic forklift which will increase the speed of material
movement and which will make it possible to retrieve raw materials from racks.
Platform trucks can be implemented so that bottles can be moved from labelling to
the filling machine and that materials are not piled on the floor.
A gravity roller conveyer can be installed to move materials from the bottling area to
the packing area which will increase the flow of the materials.

39 | P a g e
Containers must be implemented to unitize the bottles to move them down the
roller conveyer. The ideal container which folds up and takes up minimal space is
showed in figure 19.
The franchise outlets do not have to move large volumes of materials. Therefore
they need to use small material handling equipment. A platform trolley and a 2
wheel hand truck as is in figure 20 can be used to move materials within the outlet.
Figure20.Two-wheel hand truck.
Figure 19. Containers.
9.3 Automation The filling machine used to re-fill bottles and to fill bottles is shown in figure. This machine is
used in the franchises and the factory to fill and refill bottles. The productivity of this
machine is very low and the machine accounts for a lot of wasted water.
Figure 21. Current refill and filling machine.

40 | P a g e
A set of questions were asked to franchisees and observations were made to determine the
problems of the machine. The following problems revealed opportunities for improving the
current filling machine:
The taps that are used on the machine starts to leak after about a month. The taps
then need to be replaced at a cost of R70 per tap.
The tap heights are not set to a standard height. This means the tap is located to low
for a 25l dispenser to fit below the tap and it is located to high for a 5l therefore the
workers needs to hold the bottle close to the tap.
The taps are located to close to the back of the table. This means it is difficult to fit
the bottle straight below the tap.
Wastage on these machines is high.
The filling level varies due to the use of taps to fill the bottle.
Normally only one tap is used to fill bottle, because the worker have to hold the
bottle in place.
Customers complain about the hygiene of the rubber extension pipes used.
Manual handling of bottles.
9.3.1 Solutions
To improve the filling machine a few recommendations are listed below:
One of the main concerns is the tap that starts to leak after about a month. The
problem was investigated and it was found that the sealing rubber gets brittle and
was not sealing properly anymore. The sealing rubber becomes brittle because of
the ozone in the filtrated water. The solution to this problem will be to install a tap
with a silicon seal. Two other alternatives to replace the tap with are shown below.
41 | P a g e
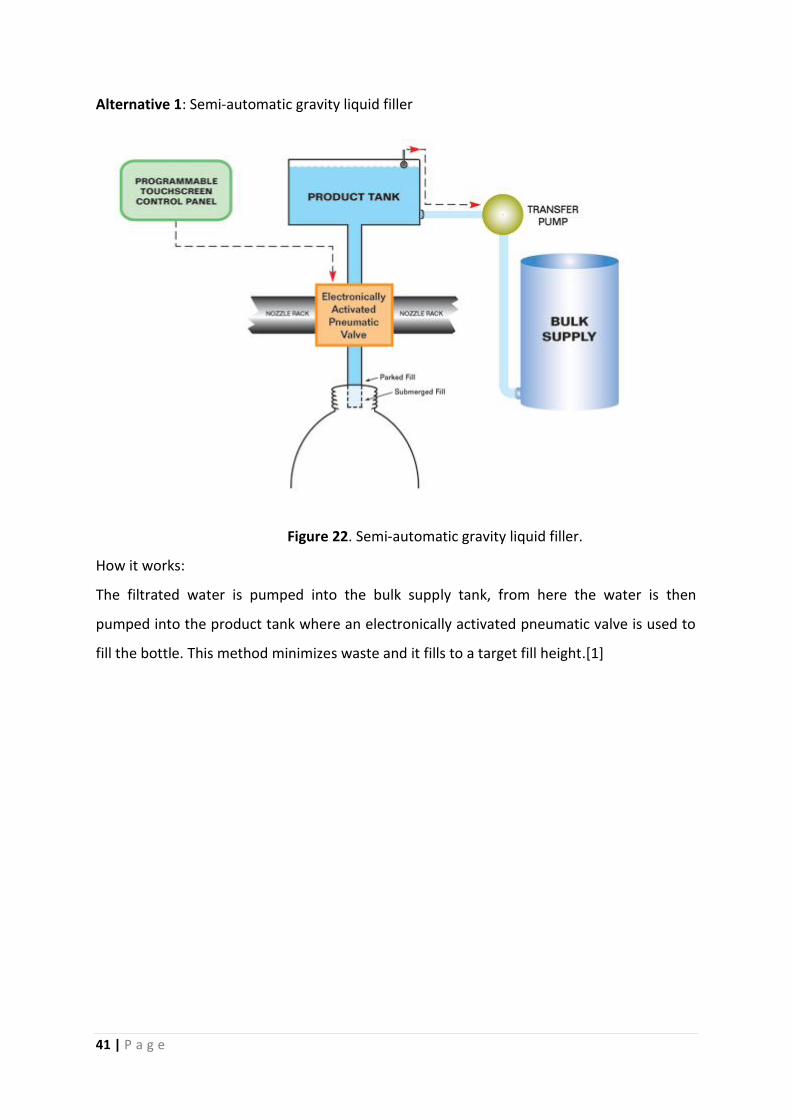
Alternative 1: Semi-automatic gravity liquid filler
Figure 22. Semi-automatic gravity liquid filler.
How it works:
The filtrated water is pumped into the bulk supply tank, from here the water is then
pumped into the product tank where an electronically activated pneumatic valve is used to
fill the bottle. This method minimizes waste and it fills to a target fill height.[1]

42 | P a g e
Alternative 2: Semi-automatic Overflow filler
Figure 23. Semi-automatic Overflow filler.
How it works:
The filtrated water is pumped into the product feed/overflow tank, from here the filtrated
water is pumped to the nozzle. The top of the bottle is then pressed against the nozzle for
the filling process to start. When the bottle is filled to the target fill height the nozzle returns
the excess water to the product feed tank and this means the waste of filtrated water is
minimized. [2]
The nozzles should be placed to a standardized height. This can be solved by locating
the nozzles according to bottle heights. Another solution can be to supply the
franchisee with stainless steel extensions which can be screwed onto the nozzle to
obtain the desired heights.
The dispensing nozzle must be located a greater distance from the back this can be
done by just extending it with a stainless steel extension.

43 | P a g e
9.3.2 Proposed design for the refill machine
The proposed design is a more standardized machine. The valve heights will be standardized
according to the demand of bottle types to be refilled. According to historical data it shows
that the bottles refilled the most are:
1. 5 litre bottle
2. 25 litre dispenser
3. 10 litre bottle
These 3 bottles will have fixed nozzle heights. The nozzle used in the design is the one
proposed in alternative 2 figure 23.
Figure 24. Proposed design for refill machine.
Method
1. Worker collect empty bottle from customer.
2. The bottle size determines which nozzle will be used. The worker then pushes the
bottle into the nozzle where it fills to a target height automatically.
25 litre 10 litre 5 litre Other
sizes

44 | P a g e
3. When bottle is filled to target height the worker removes bottle.
4. Put cap on.
5. Deliver to customer.
9.3.2.1 Evaluation of design
With the implementation of this design the following will be delivered:
Increase in productivity
Less manual handling by workers
Improved hygiene standards
Customer satisfaction
Minimized wastage
Accurate filling heights
9.3.3 Proposed design for bottle filling machine
This bottle filling machine will use the valve showed in alternative 2 figure22. The purpose
of this machine is to make it flexible to fill all types of bottles by adjusting the platform
where bottles are placed on. This smaller machine can be used in franchises and the factory.
Figure 25. Proposed design for the filling machine.
Adjustable
platform height
45 | P a g e
Method
1. Worker adjusts the platform where bottles are placed to the height of bottles to be
filled.
2. Place 3 empty bottles into the nozzles.
3. Bottles filled to target height.
4. Worker removes bottles.
5. Cap the bottles.
6. Pack into boxes.
9.3.3.1 Evaluation of design
Currently workers make use of only one nozzle to fill bottles because they have to hold the
bottle while it is filled. The new machine enables workers to place three bottles into the
nozzles to be filled. This means that 3 bottles will be filled at a time instead of 1 filled by the
old machine. With the implementation of the proposed design the following will be
delivered:
Increase in productivity
Less manual handling
Minimized wastage
Improved hygiene
Accurate filling heights
Less space required

46 | P a g e
8.Conclusion
In the last few years the meaning of facilities planning changed. In the past facilities
planning was described as a science. Today facilities planning are a strategy which gives
companies the competitive advantage over other companies in the global market. With a
dynamic approach towards the planning and the design of a facility with taking into
consideration the methods and principles of facilities planning as well as other constraints,
excellence within the supply chain will be achieved.
Based on the principles of material handling existing material handling equipment can be
improved or new material handling equipment can be designed. The improvement of
material handling systems will lead to more efficient manufacturing flows. It will also
improve ergonomics and flow of material within the facility.
The implementation of automated machines will lead to improved productivity and process
efficiency. It will also decrease wastage.
The literature reviewed in this document provides the possible methods and principles
which can be used to successfully plan a facility. These methods and principles will improve
layout designs, ergonomics, process capabilities, material handling and other operations
within the facility.
With the implementation of the proposed layout designs, material handling equipment and
automated machines it showed that it will:
Improve flow of materials
Improve productivity
Minimize wastage
Enhance a safer working environment

47 | P a g e
9.References
1. Bottle Filling, 2010. [Online]. Available:
http://www.fillers.com/time%20gravity%20filling%20machine%20guide.htm (9 May 2010)
2. Bottle Filling, 2010. [Online]. Available:
http://www.fillers.com/overflow%20filling%20machines%20guide.htm (9 May 2010)
3. Bottled water. 2010. Bottled Water, Iced Tea on Growth Track. [Online]. Available:
http://www.fastmoving.co.za/retail-services/consulting/bmi-foodpack/bmi-brand-
activity/bottled-water-iced-tea-on-growth-track/bottled-water-iced-tea-on-growth-track (7
May 2010)
4. Filtration methods. 2010. DIFFERENT WATER FILTRATION METHODS EXPLAINED. [Online].
Available: http://www.freedrinkingwater.com/water-education/quality-water-filtration-
method.htm#Anchor-Microporous-3588 (8 May 2010)
5. Frazelle, E.H. 1986. “Material Handling: A Technology for Industrial Competitiveness”.
Material Handling Research Center Technical Report. Georgia Institute of Technology.
6. Material handling institute. 1998. Ten principles of material handling.
7. Mofokeng, P. 2009. Bottled water to get 2010 boost. Fin24.com, [internet]. Available:
http://www.fin24.com/AdReview/Bottled-water-to-get-2010-boost-20091014 (7 May 2010)
8. NIEBEL & FREIVALDS. 2004. Methods, Standards and Work Design. 11th ed. Asia: McGraw-
Hill.
9. Oasis water. 2010. BENEFITS OF DRINKING RO3 (reverse osmosis ozonated) WATER
[Online].Available: http://www.oasiswater.co.za/benefits.html (7 May 2010)
10. Oasis water. 2010. Filtration Process. [Online]. Available:
http://www.oasiswater.co.za/filtration_process.html (7 May 2010)
11. Sanbwa. 2010. About bottled water- Definitions. [Online]. Available:
http://www.sanbwa.org.za/water.asp (7 May 2010)

48 | P a g e
12. TOMPKINS, WHITE, BOZER & TANCHOCO. 2003. Facilities Planning. 3rd ed. United
States: Wiley.
13. SELDERS, A.W. Materials handling in Agriculture. Agricultural engineering. p1068-1072.

49 | P a g e
Appendix A
6.1 Activities and Tasks
To make sure the project is completed within the deadlines some tasks and milestones were set. These tasks and milestones are laid out in Appendix A: Gantt Chart with starting and finishing dates. These milestones are crucial to be reached within time so that the project can be completed successfully.
6.2 Project Resources
To successfully complete the project the following resources will be used
Computer
Books, Journals and magazines related to facilities planning.
Internet
Financial Support
Koos de la Rey- Oasis water
Mr. E Brett- Project Leader
Transport
Stationeries
Franchisees
This is only a projection of resources that is going to be used. During the project the number of resources will increase as different problems and scenarios arise.
6.3 Project Budget
The following is an estimation of costs expected to be incurred by the student during the executing of the project. The sum amount estimated to be incurred is R800-00.
Expense Amount
Stationary R50-00
Internet R100-00
Transport R300-00
Printing and binding R200-00
Telephone R100-00
Other expenses R50-00
Total R800-00

50 | P a g e


![OCEANIC AREA SYSTEM IMPROVEMENT STUDY (OASIS] Volume … · The Oceanic (and selected Non-dceanic) Area System Improvement Study (OASIS), conducted by SRI International under contract](https://static.documents.pub/doc/80x56/5f7b6372921cd33a4d72766c/oceanic-area-system-improvement-study-oasis-volume-the-oceanic-and-selected-non-dceanic.jpg)
