
1Fate of Mountain Glaciers in the Anthropocene
Observed Changes in the Himalayan-Tibetan Glaciers
K. KASTURIRANGAN,1 R.R. NAVALGUND2 AND AJAI3
1. IntroductionCryosphere comprises of snow cover, sea ice, freshwater ice (frozen lakes
and rivers), the large ice masses on land such as ice sheets, glaciers, iceshelves, icebergs and permafrost. Among all cryospheric constituents snowcover, ice sheets over Polar Regions, glaciers in the mountains are most im-portant to mankind. Snow cover has three components i.e. permanent, sea-sonal, and temporary. Temporary and seasonal snow cover occurs in winterswhile permanent snow cover is retained for many years. Permanent snowcover occurs principally in Antarctica, Greenland and above permanentsnow line in mountainous areas. Snowfall is responsible for affecting mo-bility of man and machine in many parts of the world; besides, snowmeltrunoff is vital for water storage for drinking, irrigation, and hydroelectricpower generation and to maintain the ecosystems. An important climato-logical effect of snow cover is the thermal insulation provided by it, whichreduces the exchange of heat between the ground and the atmosphere. The total global ice cover is 16 million sq km, i.e. 10% of the earth’s
land area (Benn and Evans 2010). The maximum ice cover has been esti-mated in Antarctica region which is nearly 13.5 million sq km. The nexthighest ice cover is in Greenland (1.74 million sq km). The remaining icyregion is covered by mountain glaciers which are mainly valley glaciersconstrained by topography. Ice sheets keep water locked in frozen state andthus control the global climate and level of oceans. Presence of many gla-ciers in various mountains the world over controls the release of freshwaterto many river systems and sustains civilization. Mountain glaciers are estab-lished in the Himalayas, Alps, Andes, Rockies, China, Russia, Africa, Alaska,and New Zealand. The mountain glaciers can be grouped further into twoi.e. cold and temperate glaciers.
1 Planning Commission, Govt. of India, New Delhi.2 Space Applications Centre (ISRO), Ahmedabad – 380015, India.3 Space Applications Centre (ISRO), Ahmedabad – 380015, India.
Fate of Mountain Glaciers in the AnthropocenePontifical Academy of Sciences, Scripta Varia 118, 2013www.pas.va/content/dam/accademia/pdf/sv118/sv118-kasturirangan.pdf
2 Fate of Mountain Glaciers in the Anthropocene
K. KASTURIRANGAN, R.R. NAVALGUND AND AJAI
Though Earth’s climate has never been the same since the geologicalpast (before the human came into being), the variations in climate havebeen more pronounced in the recent time due to increase in populationand associated development and industrialization. The effect of climatechange on frozen reservoirs of water can have far-reaching implications.Proper assessment of these resources and the impact of climate change re-quire monitoring of the Earth’s cryosphere. Among all the mountainous regions of the world, the glaciers of the Hi-
malaya constitute the largest concentration of freshwater reserve outside thepolar region. The Himalayan mountain ranges extend from Kashmir in thewest to Arunachal Pradesh in the east. In India, the Himalayas occupy the partsof Jammu & Kashmir, Himachal Pradesh, Uttarakhand in the west and the stateof Sikkim, Assam and Arunachal Pradesh in the east. In between, the two coun-tries Nepal and Bhutan also link the Himalayan chain. Hydrologically, the Hi-malayas are drained by the three major river systems, namely the Ganges, theIndus and the Brahmaputra. The Indus flows to the Arabian Sea and its majortributaries are the Satluj, Chenab and Jhelum rivers. The Ganges originates inthe Uttarakhand region of India and flows down to the Bay of Bengal. Its majortributaries are the Bhagirathi, Alaknanda, Yamuna and Kosi rivers. The latteroriginates in the Nepal Himalayas. The Brahmaputra travels eastward across Ti-betan plateau and drains to the Bay of Bengal. Its major tributary is the TistaRiver which drains in Sikkim state. These rivers are perennial and bring waterto the northern plane of the country. The rivers draining out of the Himalayashave shaped the frontal portions of the Himalayas into a very vast alluvial plain.These plains are one of the most fertile regions and thus one of the denselypopulated regions of the world. Rivers flowing from these plains sustain thecivilization by providing irrigation, hydroelectricity and drinking water. The sources of water in these river basins are snow and glacier melt
runoff, rain water and groundwater occurring in mountains. These riversalso carry a huge load of sediments to the reservoirs located in down streams(Rao, 1979). The contribution of snow and glacier melt to total annualrunoff is about 50% (Singh et al., 1997). This might initially increase due tothe warming of the atmosphere but the reserves will get exhausted lateron. Moreover, the demand of water in the future is going to increase. Ac-cording to Kumar et al. (2005) water availability in the years 1991 and 2001were 2309 and 1902 m3 and these are projected to reduce to 1401 and 1191m3 by the years 2015 and 2050 respectively. Therefore, for proper planningfor future requirements of water resources, cryospheric studies of Himalayashave become important. Space-based assessment and monitoring of Hi-malayan cryosphere has been discussed in this article.
3Fate of Mountain Glaciers in the Anthropocene
OBSERVED CHANGES IN THE HIMALAYAN-TIBETAN GLACIERS
2. Elements of Cryospheric StudiesCryospheric studies may range from inventory, monitoring, quantifica-
tion of the extent and volume of snow and glaciers, to development ofmodels to understand the physical processes involved in accumulation andablation of snow and ice. For mountainous regions, estimation of snow andglacier reserve and melt runoff are important component of these studies.Important elements of the Himalayan Cryosphere which need to be studiedin detail include: i) Spatial extent of snow cover and its intra seasonal andinter seasonal variation; ii) spatial extent of glaciers; iii) advance/retreat ofglaciers; iv) glacier mass balance; and v) snow and glaciers melt runoff.
3. Characteristics of Himalayan GlaciersThe Himalayas with a length of about 2400 km have an arcuate shape
and thus occupy a wide range of latitudinal variations. Cross-sectionallyfrom north to south the Himalayas can be divided into the Great Himalayanranges, Lesser Himalayan ranges and Shivalik ranges. These ranges charac-terize high to low altitudes from north to south respectively. The altitudinaland latitudinal variations provide different temperature regimes to theseareas. The western part of the Himalayas is influenced by western monsoonswhereas the eastern Himalayan region is influenced primarily by the S-Emonsoon from the Bay of Bengal. Large areas in the Himalayas are coveredby snow during the winter season. The area of snow can change significantlyduring winter and spring. The onset of seasonal snowfall in Indian Himalayabegins in Kashmir in late September/early October months and slowlyshifts towards lower latitudes. The melting season of snow and glacier alsoprogresses similarly from the months of July to the end of September. Theaccumulation and ablation time in the eastern Himalayan region (Sikkimand Arunachal Pradesh) is little late by about three months. The altitude ofthe lowest snow line also significantly varies from Kashmir, Uttarakhand,Nepal, Sikkim and Bhutan. The snow line comes down to an altitude ofapproximately 2500 m in winter. The snow line at the end of ablation variesbetween 4500 to 5000 m. Increase in concentration of glaciers in the Himalaya varies from north-
west to northeast according to the variation in altitude and latitude of theregion. The Siachin glacier in Kashmir, the Gangotri glacier in Uttranchal(Ganga basin), the Bara Shigri glacier in Himachal (Chenab), the Baltoroglacier in Karakoram (Indus basin) and the Zemu glacier in Sikkim (Tista)are a few famous glaciers of the Himalayas. The glaciers in the Himalayahave high relief and occur above 4000 m amsl up to the peak of Mt. Everest8848 m amsl. These glaciers are temperate glaciers in nature. Many glaciers
4 Fate of Mountain Glaciers in the Anthropocene
K. KASTURIRANGAN, R.R. NAVALGUND AND AJAI
are debris-covered in their ablation zone. Thus these glaciers appear darkcompared to the mountain glaciers of higher latitude. Debris cover reducesthe glacier surface albedo.Due to high relief, the Himalayan glaciers cover a large altitudinal range
compared to the glaciers in other mountainous ranges, located in non-polarregions. The large altitudinal range provides different climatic zones andwind zones to these glaciers. This has implications on the accumulation andablation of snow and ice if there is a rise in temperature. The Himalayas arealso characterized by high seismic activities. Seismic activity may affect therelief and topography, which in turn may affect glacier ice movement.
4. Space based system to monitor cryosphereSpace-borne remote sensing of the cryosphere started in the seventies
after the launch of Landsat (ERTS-1) satellite. Since then there have beenrapid strides in the use of space-borne remote sensing data in cryosphericstudies because of the improvement in the quality and coverage of space-borne data. Due to the difficult and hazardous terrain of the Himalayas,ground-based glacier studies are very scanty. Sensors onboard Indian remotesensing satellites such as LISS I, LISS II, AWiFS, LISS III, LISS IV and car-tosat-1/2 with varying spatial resolutions, band combinations and with wideto narrow viewing capability have provided high quality data to monitorand study the glaciers and snow cover in the Himalayas. In the last two tothree decades, the advancement in image processing techniques and GIShas added tremendously to the quality of information derived from spaceborne sensors.The sensors operating in the following regions of the EM spectrum are
being used to monitor the cryosphere:Optical region: Most of the glacier inventories of the mountains have
been carried out using data in optical region. But the limitation of opticaldata is that often glacier area is covered with clouds during the optimumperiod of data acquisition i.e. August-September when seasonal snow linehas receded to the maximum extent. Data in the optical region has beenextensively used to monitor snow cover, inventory and monitoring of gla-ciers, computing snow albedo etc. LIDAR techniques have been used togenerate DEM over ice with good accuracy to estimate change in thicknessof ice sheets. Stereo photogrammetry techniques employ processing ofSTEREO data for estimation of change in volume by generating DEMand hence estimating the mass balance.Thermal region: Thermal data of medium to coarse resolution is now
being used to map glacier ice below debris cover.
5Fate of Mountain Glaciers in the Anthropocene
OBSERVED CHANGES IN THE HIMALAYAN-TIBETAN GLACIERS
Microwave region: Active sensors SAR are used to map dry and wetsnow. SAR interferometry techniques are useful in generating DEM overglaciers. Time difference DEMs have been used to infer velocity of ice andmass balance of glaciers.Passive sensors in the microwave region help in the determination of
the thickness of snow and ice.
5. Monitoring of Himalayan – Tibetan cryosphereAs mentioned earlier, the difficult and hazardous terrain of Himalaya
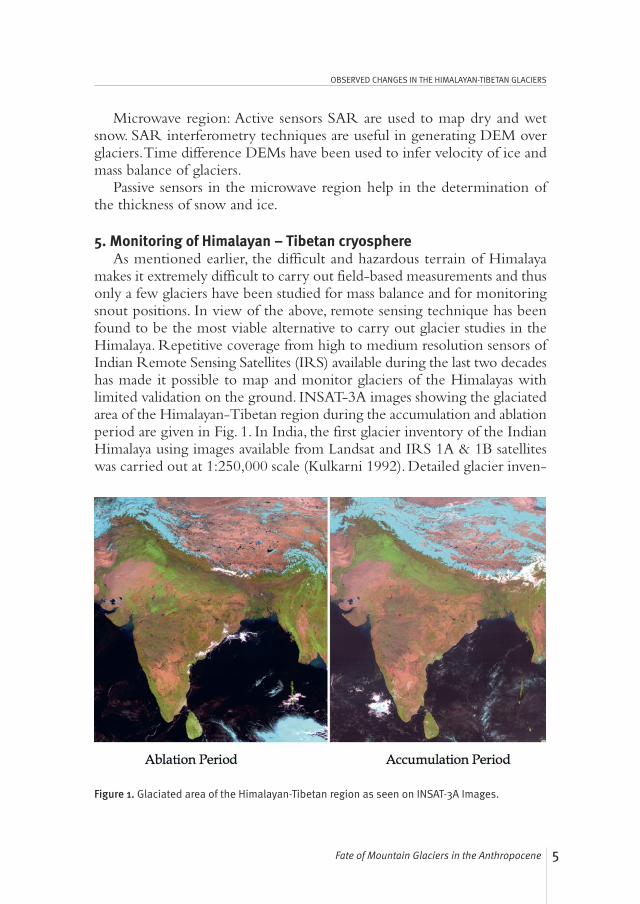
makes it extremely difficult to carry out field-based measurements and thusonly a few glaciers have been studied for mass balance and for monitoringsnout positions. In view of the above, remote sensing technique has beenfound to be the most viable alternative to carry out glacier studies in theHimalaya. Repetitive coverage from high to medium resolution sensors ofIndian Remote Sensing Satellites (IRS) available during the last two decadeshas made it possible to map and monitor glaciers of the Himalayas withlimited validation on the ground. INSAT-3A images showing the glaciatedarea of the Himalayan-Tibetan region during the accumulation and ablationperiod are given in Fig. 1. In India, the first glacier inventory of the IndianHimalaya using images available from Landsat and IRS 1A & 1B satelliteswas carried out at 1:250,000 scale (Kulkarni 1992). Detailed glacier inven-
Figure 1. Glaciated area of the Himalayan-Tibetan region as seen on INSAT-3A Images.
6 Fate of Mountain Glaciers in the Anthropocene
K. KASTURIRANGAN, R.R. NAVALGUND AND AJAI
tory for Satluj basin at 1:50,000 scales followed (Kulkarni et al. 1999). Theglacier features, which are mapped using satellite data, are glacier bound-aries; accumulation zone, the snow line, the ablation zone, deglaciated valleysand moraine dammed lakes (Ajai et al. 2011).
5.1 Inventory of Himalayan glaciers The glacier inventory primarily deals with the occurrence and distri-
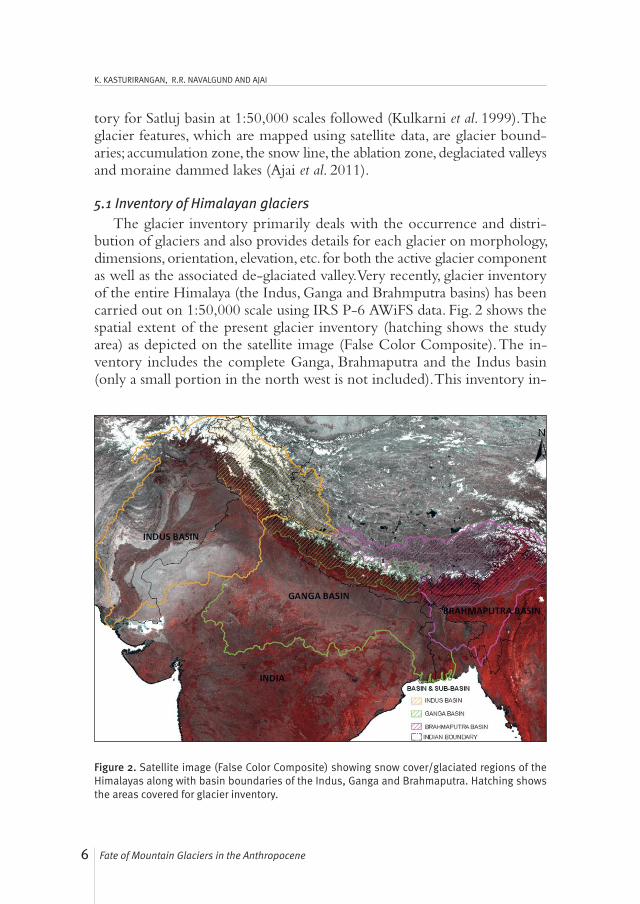
bution of glaciers and also provides details for each glacier on morphology,dimensions, orientation, elevation, etc. for both the active glacier componentas well as the associated de-glaciated valley. Very recently, glacier inventoryof the entire Himalaya (the Indus, Ganga and Brahmputra basins) has beencarried out on 1:50,000 scale using IRS P-6 AWiFS data. Fig. 2 shows thespatial extent of the present glacier inventory (hatching shows the studyarea) as depicted on the satellite image (False Color Composite). The in-ventory includes the complete Ganga, Brahmaputra and the Indus basin(only a small portion in the north west is not included). This inventory in-
Figure 2. Satellite image (False Color Composite) showing snow cover/glaciated regions of theHimalayas along with basin boundaries of the Indus, Ganga and Brahmaputra. Hatching showsthe areas covered for glacier inventory.
7Fate of Mountain Glaciers in the Anthropocene
OBSERVED CHANGES IN THE HIMALAYAN-TIBETAN GLACIERS
cludes even the glaciers of these three basins which are located outside theIndian territory but draining into India (Sharma et al., 2011).The glacier inventory map depicts the glaciers and their spatial distri-
bution. The significant glacier morphological features for each of the glacierare mapped and appropriately represented on the map by a predefinedcolour scheme. The mapped glacier features comprise of glacier boundarywith separate accumulation area and ablation area. The ablation area is fur-ther divided into ablation area ice exposed and ablation area debris covered.The Moraines, like median, lateral and terminal moraines present on theglacier are separately mapped and delineated. The supra-glacier lakes oc-curring on the glaciers are also delineated. The snout is marked as a pointlocation depicting the end of the glacier tongue. The de-glaciated valley as-sociated with the glacier is also delineated along with the associatedmoraines, both lateral and terminal moraines, and the moraine dam lakes. The results of the inventory of glaciers, providing details on the number
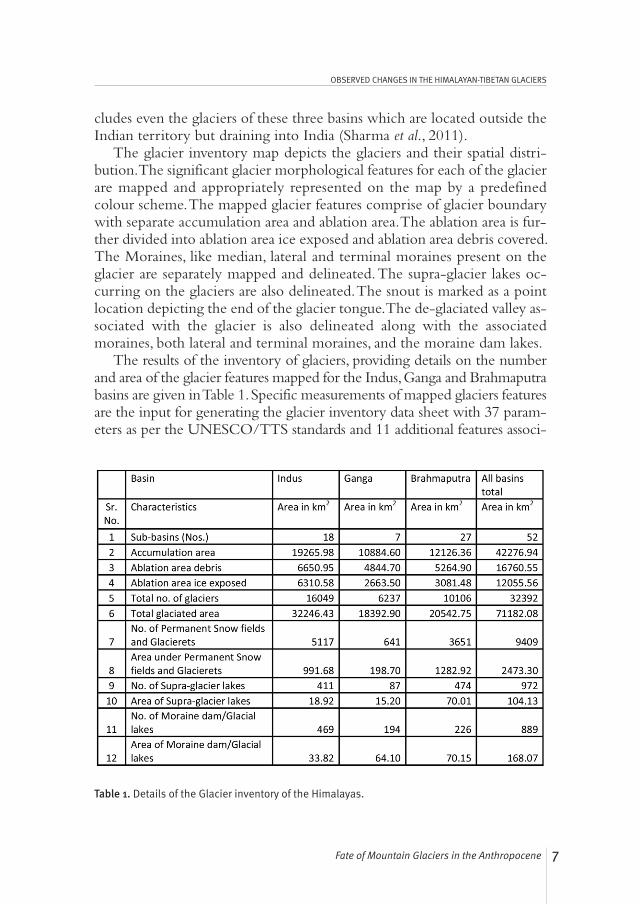
and area of the glacier features mapped for the Indus, Ganga and Brahmaputrabasins are given in Table 1. Specific measurements of mapped glaciers featuresare the input for generating the glacier inventory data sheet with 37 param-eters as per the UNESCO/TTS standards and 11 additional features associ-
Table 1. Details of the Glacier inventory of the Himalayas.
8 Fate of Mountain Glaciers in the Anthropocene
K. KASTURIRANGAN, R.R. NAVALGUND AND AJAI
ated with the deglaciated valley. The data sheet provides glacier-wise details,mainly related to glacier identification, in terms of number, name, glacier lo-cations, information on the elevation, dimensions and orientation etc.The total number of glaciers and the glaciated area in these three basins
put together are 32392 and 71182.08 sq km respectively (Sharma et al. 2011and Ajai et al. 2011). The Indus basin has 16049 glaciers having glaciated areaof 32246.43 sq km. The Ganga basin has 6237glaciers occupying 18392.90sq km of glaciated area. There are 7 glaciated sub-basins in Ganga basin. TheBrahmaputra basin has 10106 glaciers occupying 20542.75 sq km of glaciatedarea. There are 27 sub-basins in the Brahmaputra basin covering the glaciatedarea. The total glaciated area and the number of glaciers in the Indian Hi-malaya are 37266 sq km and 16445 respectively (Sharma et al. 2011).The results of this inventory show that the accumulation and ablation
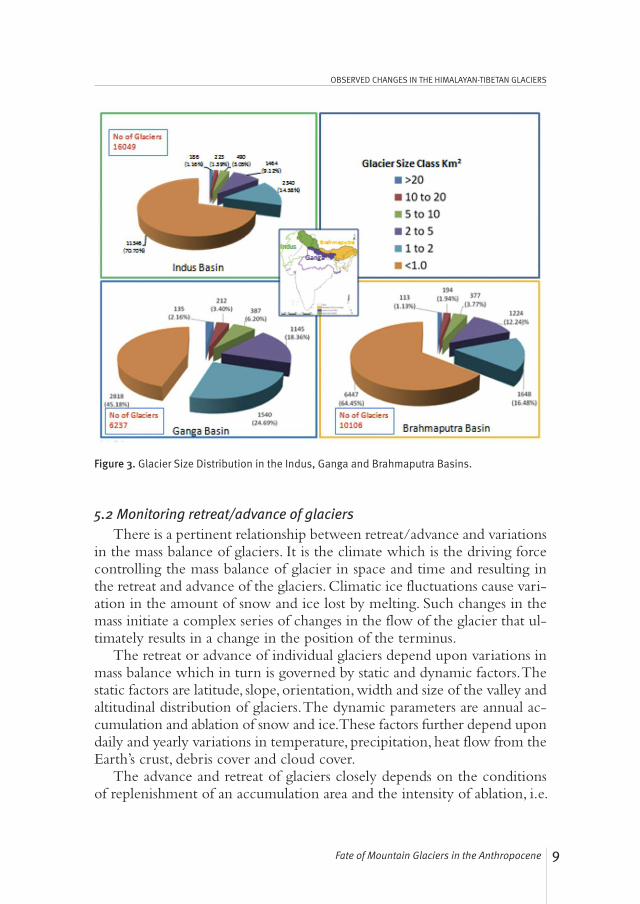
areas of the glaciers are the largest in the Indus basin. The ratio of accumu-lation to ablation area is high in the Brahmaputra basin. This indicates thatthe glaciers of the Indus basin are having larger feed area and hence are rel-atively stable as compared to the other two basins. The Indus basin has51.3% of the ablation area covered with debris whereas the Ganga and theBrahmaputra basins have 64.5% and 63.1% debris cover respectively. All thethree basins put together, about 60% of the glaciated area in the ablationzone is covered with debris. The percentage of debris-covered glaciers ishighest in the Ganga basin. Though the number of glacial lake/morainedammed lake is higher in the Indus basin, the total area of such lakes is thelowest among these three basins which means that the lakes are smaller insize in the Indus basin and larger in the Ganga and the Brahmaputra basin.The number of supra glacier lakes is 474 (with an area of 70.01 km2) in theBrahmaputra basin which is the largest of all three basins. The area of per-manent snowfield is smallest in the Ganga basin which is hardly 198.7 km2.The areas under permanent snowfields are 991.68 and 1282.92 sq km inthe Indus and the Brahmaputra basins respectively. Glaciers of all the basinshave been classified in different class zones based on the size. The numberof glaciers having size less than 1 km2 is highest in the Indus basin andlowest in the Ganga basin. The Ganga basin has the maximum number oflarge-sized glaciers compared to the Indus and Brahmaputra basins (Fig 3). Computing the glacier ice volume and water equivalent (stored in frozen
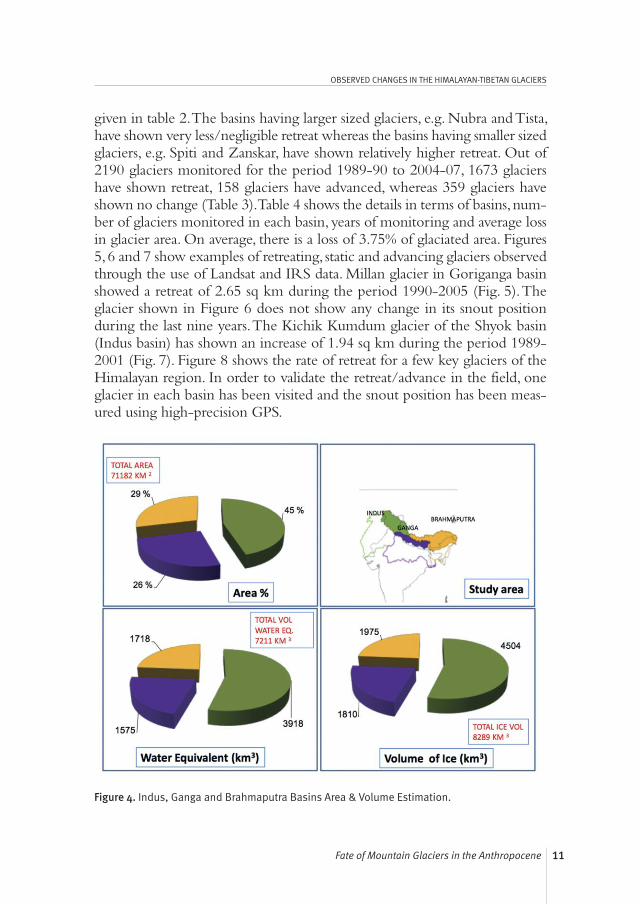
condition) is important from the water security point of view. The volumeof ice has been computed for the three basins using glacier area and icethickness (Chaohai and Sharma, 1998). Figure 4 shows the glaciated area,glacier volume and water equivalent for the three basins. The Indus has thelargest ice volume and water stored.
9Fate of Mountain Glaciers in the Anthropocene
OBSERVED CHANGES IN THE HIMALAYAN-TIBETAN GLACIERS
5.2 Monitoring retreat/advance of glaciersThere is a pertinent relationship between retreat/advance and variations
in the mass balance of glaciers. It is the climate which is the driving forcecontrolling the mass balance of glacier in space and time and resulting inthe retreat and advance of the glaciers. Climatic ice fluctuations cause vari-ation in the amount of snow and ice lost by melting. Such changes in themass initiate a complex series of changes in the flow of the glacier that ul-timately results in a change in the position of the terminus.The retreat or advance of individual glaciers depend upon variations in
mass balance which in turn is governed by static and dynamic factors. Thestatic factors are latitude, slope, orientation, width and size of the valley andaltitudinal distribution of glaciers. The dynamic parameters are annual ac-cumulation and ablation of snow and ice. These factors further depend upondaily and yearly variations in temperature, precipitation, heat flow from theEarth’s crust, debris cover and cloud cover.The advance and retreat of glaciers closely depends on the conditions
of replenishment of an accumulation area and the intensity of ablation, i.e.
Figure 3. Glacier Size Distribution in the Indus, Ganga and Brahmaputra Basins.
10 Fate of Mountain Glaciers in the Anthropocene
K. KASTURIRANGAN, R.R. NAVALGUND AND AJAI
faster melting due to climatic changes. Stream run-off in the Himalayan re-gion is the basic source for water as a resource and also for micro and minihydel projects which have direct implications in the fluvioglacial/geomor-phological process and ecological balance of the region.
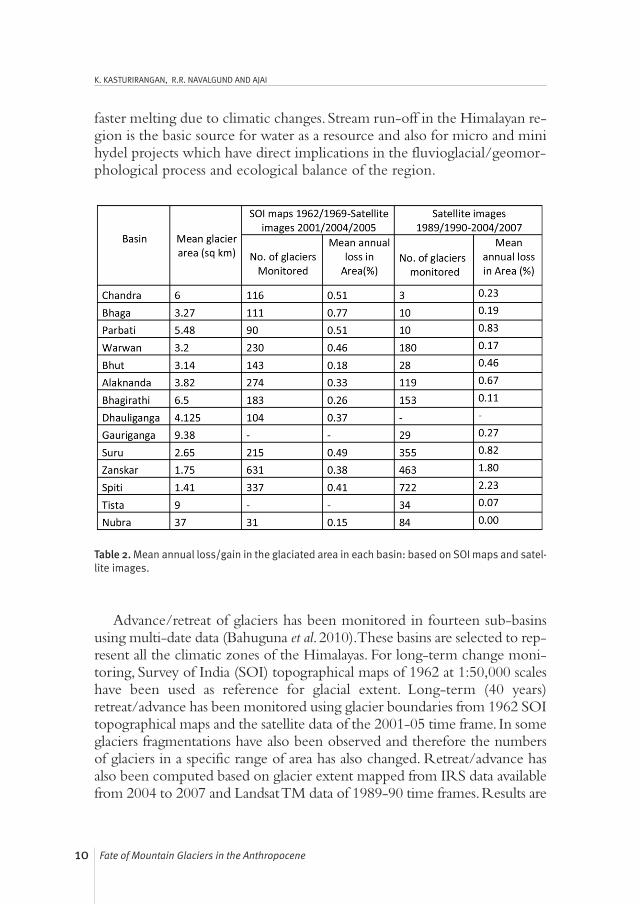
Table 2.Mean annual loss/gain in the glaciated area in each basin: based on SOI maps and satel-lite images.
Advance/retreat of glaciers has been monitored in fourteen sub-basinsusing multi-date data (Bahuguna et al. 2010). These basins are selected to rep-resent all the climatic zones of the Himalayas. For long-term change moni-toring, Survey of India (SOI) topographical maps of 1962 at 1:50,000 scaleshave been used as reference for glacial extent. Long-term (40 years)retreat/advance has been monitored using glacier boundaries from 1962 SOItopographical maps and the satellite data of the 2001-05 time frame. In someglaciers fragmentations have also been observed and therefore the numbersof glaciers in a specific range of area has also changed. Retreat/advance hasalso been computed based on glacier extent mapped from IRS data availablefrom 2004 to 2007 and Landsat TM data of 1989-90 time frames. Results are
11Fate of Mountain Glaciers in the Anthropocene
OBSERVED CHANGES IN THE HIMALAYAN-TIBETAN GLACIERS
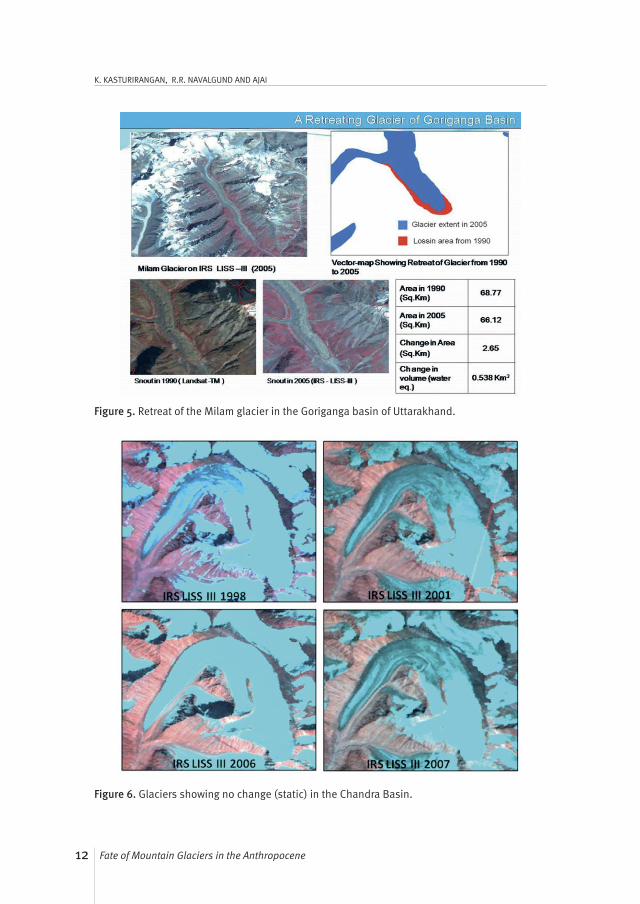
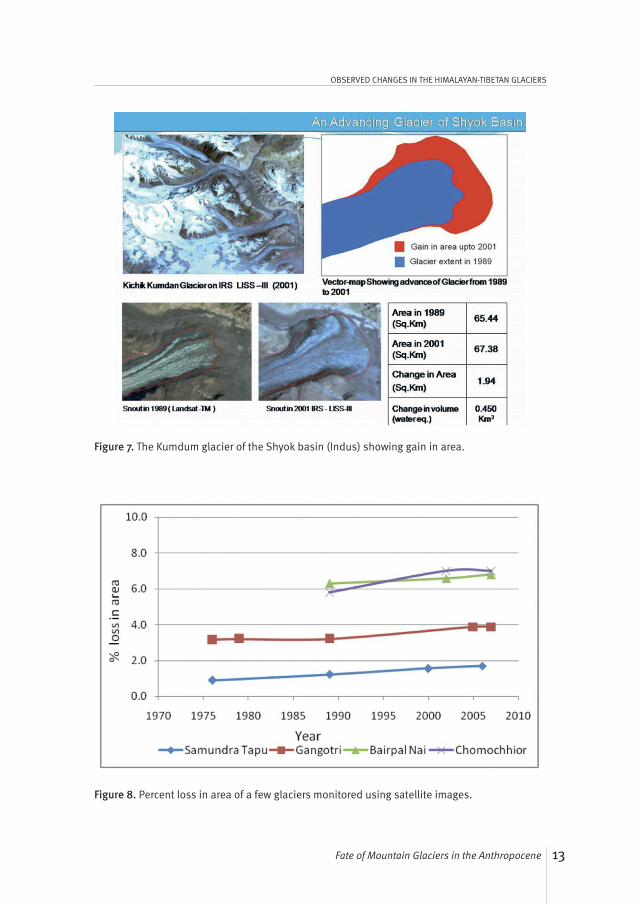
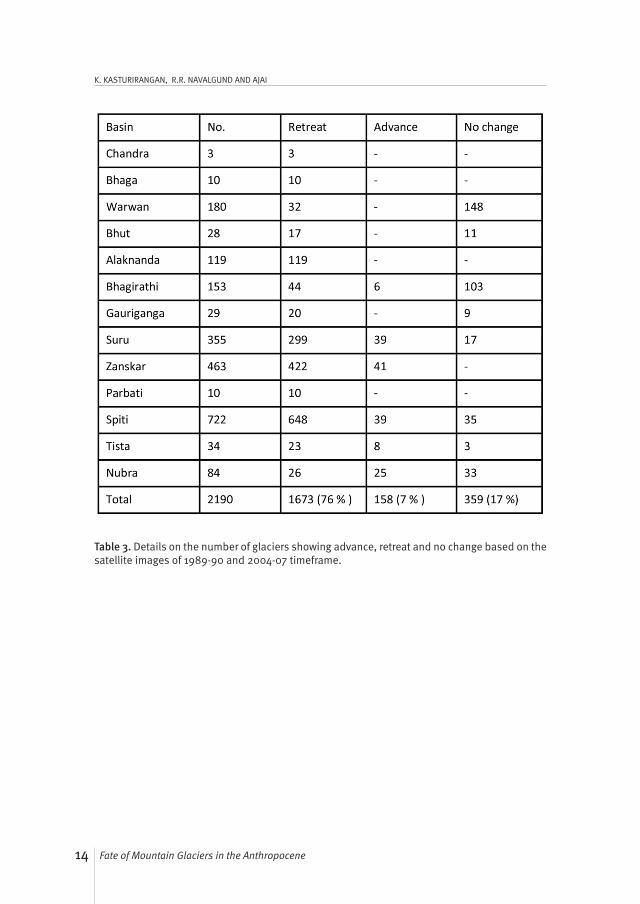
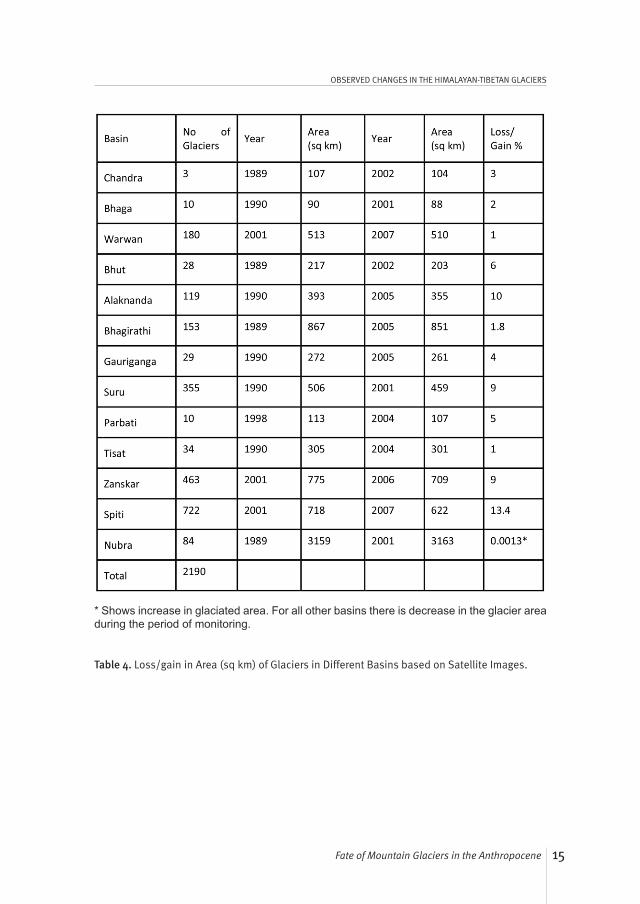
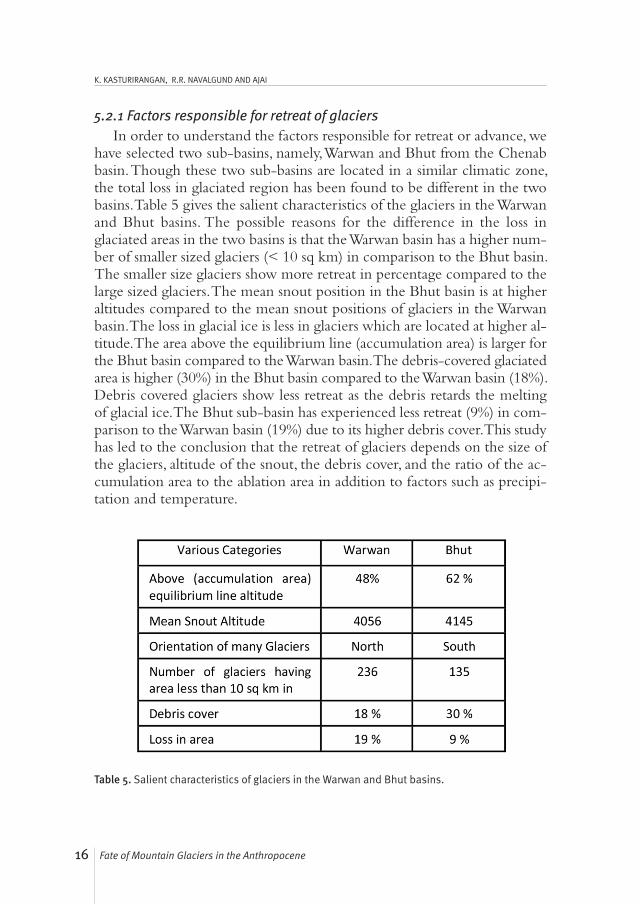
given in table 2. The basins having larger sized glaciers, e.g. Nubra and Tista,have shown very less/negligible retreat whereas the basins having smaller sizedglaciers, e.g. Spiti and Zanskar, have shown relatively higher retreat. Out of2190 glaciers monitored for the period 1989-90 to 2004-07, 1673 glaciershave shown retreat, 158 glaciers have advanced, whereas 359 glaciers haveshown no change (Table 3). Table 4 shows the details in terms of basins, num-ber of glaciers monitored in each basin, years of monitoring and average lossin glacier area. On average, there is a loss of 3.75% of glaciated area. Figures5, 6 and 7 show examples of retreating, static and advancing glaciers observedthrough the use of Landsat and IRS data. Millan glacier in Goriganga basinshowed a retreat of 2.65 sq km during the period 1990-2005 (Fig. 5). Theglacier shown in Figure 6 does not show any change in its snout positionduring the last nine years. The Kichik Kumdum glacier of the Shyok basin(Indus basin) has shown an increase of 1.94 sq km during the period 1989-2001 (Fig. 7). Figure 8 shows the rate of retreat for a few key glaciers of theHimalayan region. In order to validate the retreat/advance in the field, oneglacier in each basin has been visited and the snout position has been meas-ured using high-precision GPS.
Figure 4. Indus, Ganga and Brahmaputra Basins Area & Volume Estimation.
12 Fate of Mountain Glaciers in the Anthropocene
K. KASTURIRANGAN, R.R. NAVALGUND AND AJAI
Figure 6. Glaciers showing no change (static) in the Chandra Basin.
Figure 5. Retreat of the Milam glacier in the Goriganga basin of Uttarakhand.
13Fate of Mountain Glaciers in the Anthropocene
OBSERVED CHANGES IN THE HIMALAYAN-TIBETAN GLACIERS
Figure 7. The Kumdum glacier of the Shyok basin (Indus) showing gain in area.
Figure 8. Percent loss in area of a few glaciers monitored using satellite images.
14 Fate of Mountain Glaciers in the Anthropocene
K. KASTURIRANGAN, R.R. NAVALGUND AND AJAI
Table 3. Details on the number of glaciers showing advance, retreat and no change based on thesatellite images of 1989-90 and 2004-07 timeframe.
15Fate of Mountain Glaciers in the Anthropocene
OBSERVED CHANGES IN THE HIMALAYAN-TIBETAN GLACIERS
Table 4. Loss/gain in Area (sq km) of Glaciers in Different Basins based on Satellite Images.
* Shows increase in glaciated area. For all other basins there is decrease in the glacier areaduring the period of monitoring.
16 Fate of Mountain Glaciers in the Anthropocene
K. KASTURIRANGAN, R.R. NAVALGUND AND AJAI
5.2.1 Factors responsible for retreat of glaciersIn order to understand the factors responsible for retreat or advance, we
have selected two sub-basins, namely, Warwan and Bhut from the Chenabbasin. Though these two sub-basins are located in a similar climatic zone,the total loss in glaciated region has been found to be different in the twobasins. Table 5 gives the salient characteristics of the glaciers in the Warwanand Bhut basins. The possible reasons for the difference in the loss inglaciated areas in the two basins is that the Warwan basin has a higher num-ber of smaller sized glaciers (< 10 sq km) in comparison to the Bhut basin.The smaller size glaciers show more retreat in percentage compared to thelarge sized glaciers. The mean snout position in the Bhut basin is at higheraltitudes compared to the mean snout positions of glaciers in the Warwanbasin. The loss in glacial ice is less in glaciers which are located at higher al-titude. The area above the equilibrium line (accumulation area) is larger forthe Bhut basin compared to the Warwan basin. The debris-covered glaciatedarea is higher (30%) in the Bhut basin compared to the Warwan basin (18%).Debris covered glaciers show less retreat as the debris retards the meltingof glacial ice. The Bhut sub-basin has experienced less retreat (9%) in com-parison to the Warwan basin (19%) due to its higher debris cover. This studyhas led to the conclusion that the retreat of glaciers depends on the size ofthe glaciers, altitude of the snout, the debris cover, and the ratio of the ac-cumulation area to the ablation area in addition to factors such as precipi-tation and temperature.
Table 5. Salient characteristics of glaciers in the Warwan and Bhut basins.
17Fate of Mountain Glaciers in the Anthropocene
OBSERVED CHANGES IN THE HIMALAYAN-TIBETAN GLACIERS
5.3 Glacier mass balance Mass balance of a glacier is an important parameter required to under-
stand the health of the glacier as well as availability of water over a long pe-riod of time. The mass balance of the glacier is usually referred to as thetotal loss or gain in glacier mass at the end of the hydrological year. Long-term estimates of glacier melt runoff are required, as more and more microhydroelectric power stations are planned in the remote hilly regions of theHimalaya. Since some of these areas receive negligible monsoon rainfall,most of the runoff is due to either seasonal snow or glacier melts. Therefore,proper estimates regarding availability of water for long periods of time arerequired for planned development. In addition, glacial mass balance can alsoprovide very vital clues for long-term climatic changes. Mass balance is estimated by measuring the total accumulation of sea-
sonal snow and ablation of snow and ice. The accumulation (input) in-cludes all forms of deposition, precipitation mainly and ablation (output)means loss of snow and ice in the form of melting, evaporation and calvingetc from the glacier. The boundary between the accumulation and ablationarea is the Equilibrium line. The difference between net accumulation andnet ablation for the whole glacier over a period of one year is net balance.The net balance for each glacier is different in amount and depends uponthe size/shape of the glacier and climatic condition of the area. The netbalance per unit area of glacier is specific mass balance, expressed in mmof water equivalent. There is wide variation in mass changes from time totime and place to place on the glacier due to the various factors. Theprocess of mass balance of the glaciers over an entire region is complex, asit is irregular in amount, rate and time of occurrence. Therefore the ulti-mate aim to monitor mass balance is to match it with the changes in var-ious parameters of the glaciers. These changes directly affect the flow ofthe glacier and its terminus position, i.e. advancement and recession of thefrontal position of the glaciers.There are several methods for carrying out mass balance studies of a gla-
cier, which have been used worldwide. One of the methods using satelliteimages is based on AAR (accumulation area ratio) approach. A relationshipbetween AAR and mass balance is developed using field mass balance data(Kulkarni 1992). On the basis of accumulation area ratio (area of accumu-lation divided by whole area of glacier) mass balance in terms of gain orloss can be computed. Multi temporal AWiFS data from IRS P-6 (Re-sourcesat-1) satellite has been used to delineate the snow line and its shiftduring the ablation season. Finally, the snow line at the end of ablation sea-son (the equilibrium line) is delineated to compute AAR.
18 Fate of Mountain Glaciers in the Anthropocene
K. KASTURIRANGAN, R.R. NAVALGUND AND AJAI
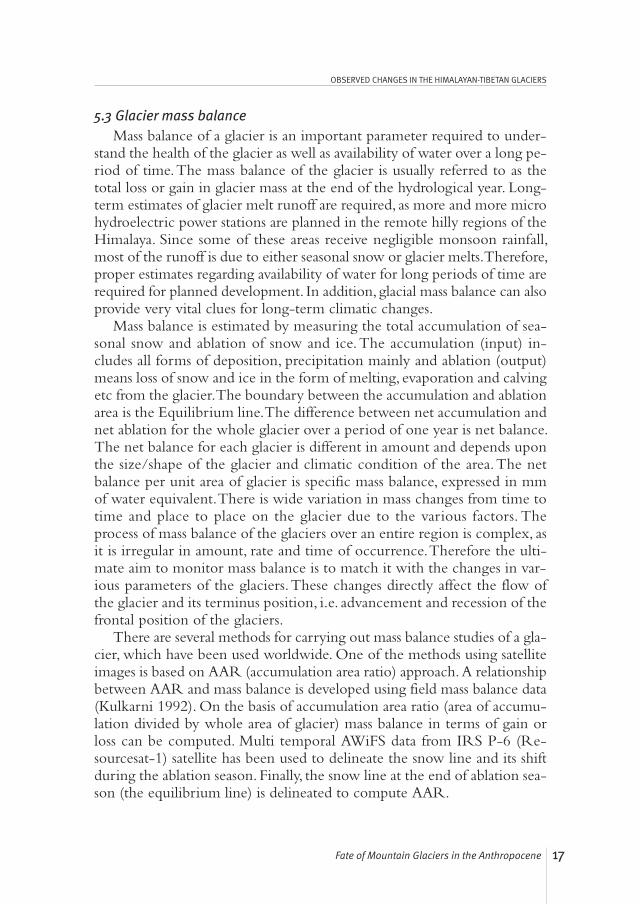
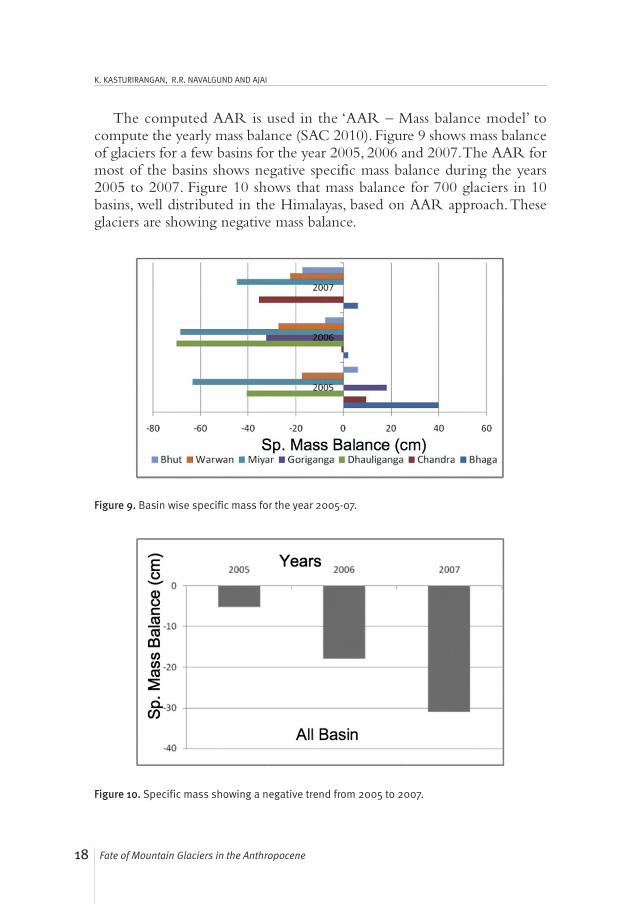
The computed AAR is used in the ‘AAR – Mass balance model’ tocompute the yearly mass balance (SAC 2010). Figure 9 shows mass balanceof glaciers for a few basins for the year 2005, 2006 and 2007. The AAR formost of the basins shows negative specific mass balance during the years2005 to 2007. Figure 10 shows that mass balance for 700 glaciers in 10basins, well distributed in the Himalayas, based on AAR approach. Theseglaciers are showing negative mass balance.
Figure 9. Basin wise specific mass for the year 2005-07.
Figure 10. Specific mass showing a negative trend from 2005 to 2007.
19Fate of Mountain Glaciers in the Anthropocene
OBSERVED CHANGES IN THE HIMALAYAN-TIBETAN GLACIERS
5.4 Monitoring of snow coverStudying the snow cover pattern over time is very important for com-
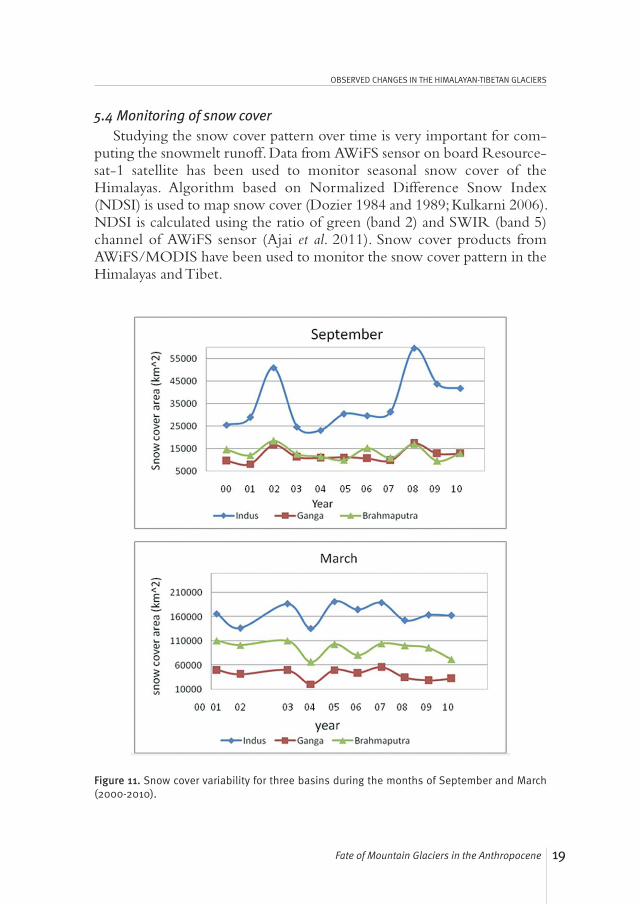
puting the snowmelt runoff. Data from AWiFS sensor on board Resource-sat-1 satellite has been used to monitor seasonal snow cover of theHimalayas. Algorithm based on Normalized Difference Snow Index(NDSI) is used to map snow cover (Dozier 1984 and 1989; Kulkarni 2006).NDSI is calculated using the ratio of green (band 2) and SWIR (band 5)channel of AWiFS sensor (Ajai et al. 2011). Snow cover products fromAWiFS/MODIS have been used to monitor the snow cover pattern in theHimalayas and Tibet.
Figure 11. Snow cover variability for three basins during the months of September and March(2000-2010).
20 Fate of Mountain Glaciers in the Anthropocene
K. KASTURIRANGAN, R.R. NAVALGUND AND AJAI
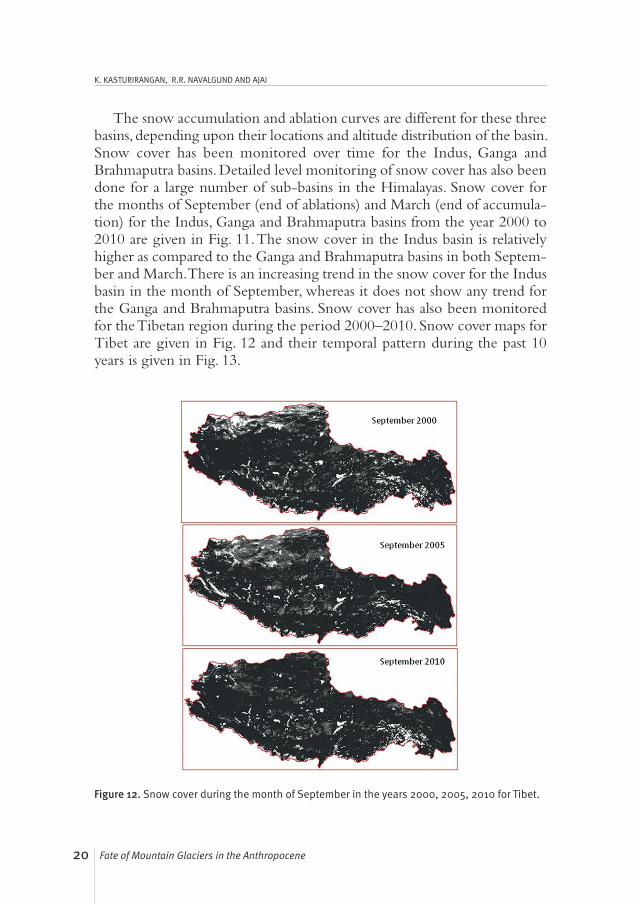
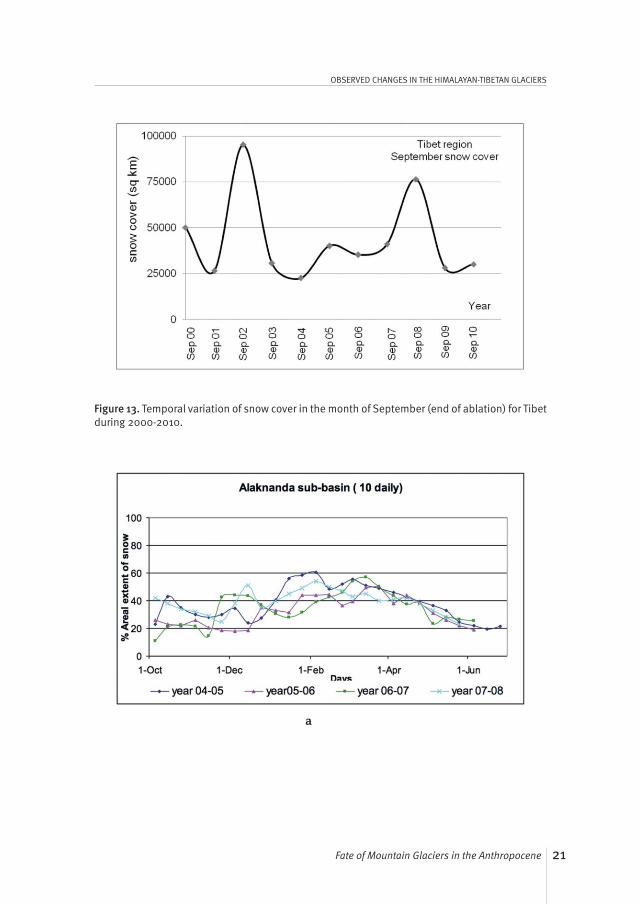
The snow accumulation and ablation curves are different for these threebasins, depending upon their locations and altitude distribution of the basin.Snow cover has been monitored over time for the Indus, Ganga andBrahmaputra basins. Detailed level monitoring of snow cover has also beendone for a large number of sub-basins in the Himalayas. Snow cover forthe months of September (end of ablations) and March (end of accumula-tion) for the Indus, Ganga and Brahmaputra basins from the year 2000 to2010 are given in Fig. 11. The snow cover in the Indus basin is relativelyhigher as compared to the Ganga and Brahmaputra basins in both Septem-ber and March. There is an increasing trend in the snow cover for the Indusbasin in the month of September, whereas it does not show any trend forthe Ganga and Brahmaputra basins. Snow cover has also been monitoredfor the Tibetan region during the period 2000–2010. Snow cover maps forTibet are given in Fig. 12 and their temporal pattern during the past 10years is given in Fig. 13.
Figure 12. Snow cover during the month of September in the years 2000, 2005, 2010 for Tibet.
21Fate of Mountain Glaciers in the Anthropocene
OBSERVED CHANGES IN THE HIMALAYAN-TIBETAN GLACIERS
Figure 13. Temporal variation of snow cover in the month of September (end of ablation) for Tibetduring 2000-2010.
22 Fate of Mountain Glaciers in the Anthropocene
K. KASTURIRANGAN, R.R. NAVALGUND AND AJAI
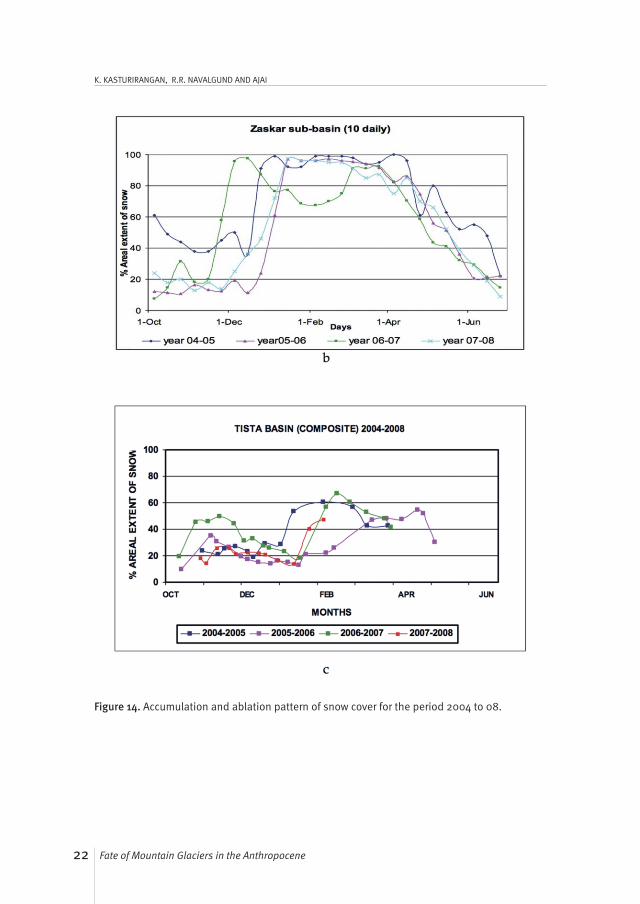
Figure 14. Accumulation and ablation pattern of snow cover for the period 2004 to 08.
23Fate of Mountain Glaciers in the Anthropocene
OBSERVED CHANGES IN THE HIMALAYAN-TIBETAN GLACIERS
Figure 14 a, b, and c shows accumulation and ablation curves for threesub-basins, namely, the Alaknanda (Ganga basin), the Zanskar (Indus basin)and the Tista (Brahmaputra basin) which are located in different climaticzones. The curves indicate that although the pattern of accumulation andablation in different years is not very different in each basin, it differs fromone basin to the other. This information is highly useful to estimatesnowmelt runoff in each basin. The pattern of the Tista basin is influencedby the southeastern monsoon.
5.5 Hydropower potential estimationElectrification of rural areas in the Himalayas is difficult and expensive
due to natural hazard in power transmission. Most of the power requirementcan be met by generating it locally, which will also help in rural employ-ment and contribute in the overall development of the region. By consid-ering these aspects, various state governments are planning to develop microand mini hydroelectric power stations in the Himalayan region. A snowand glacier melt runoff model has been developed to estimate the hy-dropower potential of snow and glaciated stream for winter, summer, mon-soon and autumn seasons. Information generated through remote sensingtechniques such as glacier extent, permanent snow cover, seasonal snowcover, accumulation and ablation areas, altitude of snow and glaciers wereused in conjunction with daily maximum and minimum temperature andrainfall to compute the runoff. The general structure of the model to estimate average seasonal runoff
is given below. The model for estimating seasonal snow and glacier meltrunoff needs remote sensing input in the form of snow and glacial extentand its altitude distribution (Kulkarni et al., 1995).
Q = C1 {a (T * G)} + C2 (P * B) + C3 {(S * W)- (M * Sw)}
Where,Q = Average seasonal runoff (m3/s),C1 = Runoff coefficient for glaciated region,C2 = Runoff coefficient for non-snow and non-glaciated area,C3 = Runoff coefficient for seasonal snow covered areas,a = Melt factor (cm ºC-1d-1),T = Average seasonal degree days (ºC),G = Extent of glaciers, permanent and seasonal snow (m²),S = Area of seasonal snow (m²),W = Water equivalent of average winter snow-fall (m),
24 Fate of Mountain Glaciers in the Anthropocene
K. KASTURIRANGAN, R.R. NAVALGUND AND AJAI
M = Winter snow melt (m),Sw = Snow cover in winter (m²),P = Average seasonal rainfall (m),B = Basin area without snow/glacial cover (m²).
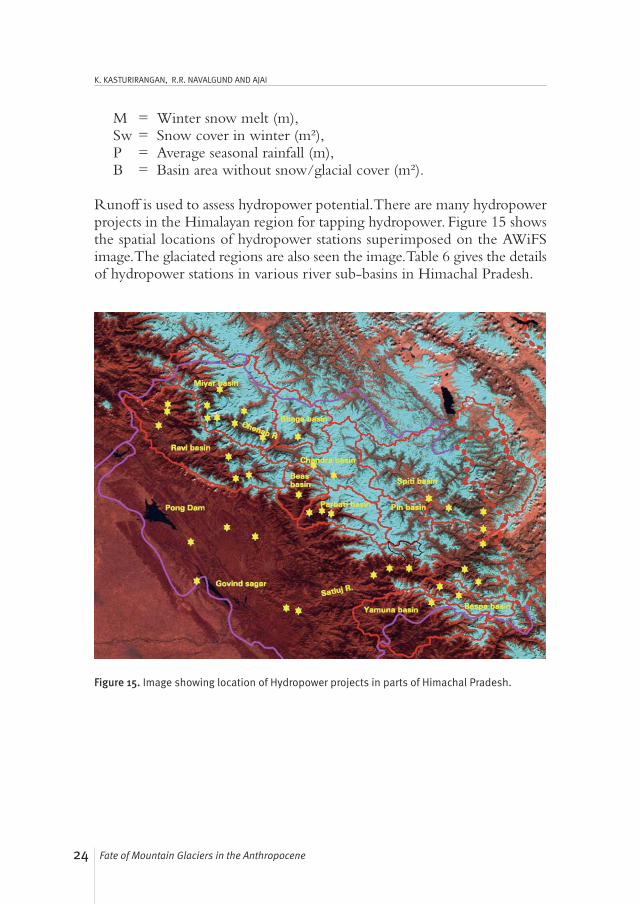
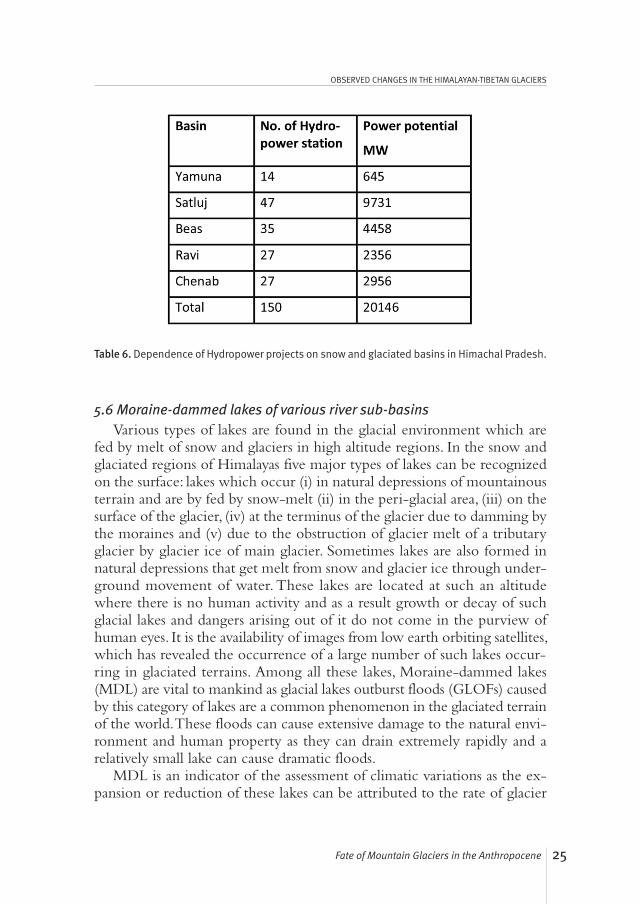
Runoff is used to assess hydropower potential. There are many hydropowerprojects in the Himalayan region for tapping hydropower. Figure 15 showsthe spatial locations of hydropower stations superimposed on the AWiFSimage. The glaciated regions are also seen the image. Table 6 gives the detailsof hydropower stations in various river sub-basins in Himachal Pradesh.
Figure 15. Image showing location of Hydropower projects in parts of Himachal Pradesh.
25Fate of Mountain Glaciers in the Anthropocene
OBSERVED CHANGES IN THE HIMALAYAN-TIBETAN GLACIERS
5.6 Moraine-dammed lakes of various river sub-basinsVarious types of lakes are found in the glacial environment which are
fed by melt of snow and glaciers in high altitude regions. In the snow andglaciated regions of Himalayas five major types of lakes can be recognizedon the surface: lakes which occur (i) in natural depressions of mountainousterrain and are by fed by snow-melt (ii) in the peri-glacial area, (iii) on thesurface of the glacier, (iv) at the terminus of the glacier due to damming bythe moraines and (v) due to the obstruction of glacier melt of a tributaryglacier by glacier ice of main glacier. Sometimes lakes are also formed innatural depressions that get melt from snow and glacier ice through under-ground movement of water. These lakes are located at such an altitudewhere there is no human activity and as a result growth or decay of suchglacial lakes and dangers arising out of it do not come in the purview ofhuman eyes. It is the availability of images from low earth orbiting satellites,which has revealed the occurrence of a large number of such lakes occur-ring in glaciated terrains. Among all these lakes, Moraine-dammed lakes(MDL) are vital to mankind as glacial lakes outburst floods (GLOFs) causedby this category of lakes are a common phenomenon in the glaciated terrainof the world. These floods can cause extensive damage to the natural envi-ronment and human property as they can drain extremely rapidly and arelatively small lake can cause dramatic floods.MDL is an indicator of the assessment of climatic variations as the ex-
pansion or reduction of these lakes can be attributed to the rate of glacier
Table 6. Dependence of Hydropower projects on snow and glaciated basins in Himachal Pradesh.
26 Fate of Mountain Glaciers in the Anthropocene
K. KASTURIRANGAN, R.R. NAVALGUND AND AJAI
melting at the snout. Since many of the Himalayan glaciers are moraine-covered and when debris-covered glaciers melt rapidly, a lot of debris ac-cumulates near the snout, which can give rise to the formation of newerlakes. An inventory of moraine-dam lakes covering a large part of the Hi-malayas has been carried out using satellite images.
6. Conclusions and future scopeInventory and monitoring of the Himalayan-Tibetan cryosphere has been
carried out using satellite data. Inventory of the glaciers of the Himalayas(Indus, Ganga and Brahmaputra basins) has been done on 1:50,000 scale usingResourcesat 1 satellite data of 2004-07 time period. The total number of gla-ciers in these three basins put together is 32392, covering an area of 71182.08sq km. About 60% of the glaciated area in the ablation zone is covered withdebris, which makes these glaciers protected from faster melting due to solarradiation. 2190 glaciers, well distributed in different climatic zones of the Hi-malaya, have been monitored for the period 1989-90 to 2004-07. While 76percent of the glaciers have shown retreat, 7% have advanced and 17% haveshown no change. Average retreat has been 3.75% in area. The mass balanceof about 700 glaciers has been monitored based on AAR approach. Seasonal snow cover has been monitored for the Indus, Ganga and the
Brahmaputra basins for the period 2000-2010. The Indus basin has shownan increasing trend in the snow cover for the month of September (end ofthe ablation) during the above period. However the other two basins didnot show any trend in the snow cover shape. Snow cover has also beenmonitored for the entire Tibetan region for the period 2000 – 2010. It hasnot shown any trend in the snow cover pattern during the last ten years. Monitoring of Himalayan glaciers needs to be continued as they are im-
portant: i) source of fresh water for human consumption and irrigation; ii)source of energy (hydro power), iii) regulate the climate and iv) are criticalindicators of climate change. The changing climate/global warming may accelerate the process of
melting of the Himalayan glaciers which may lead to over all change in thehydrology and there by the runoff and sedimentation. This may lead toflooding as well change in the ecological conditions at many places includ-ing the important ecosystems such as the Sunderbans. The large influx offresh water to the ocean may also change its salinity and may lead to changein the biogeochemistry of the ocean. The changing biogeochemistry willhave larger implications on the marine productivity and carbon cycle.Apart from the inventory and monitoring of cryosphere, there is a need
to develop techniques/model to find out the thickness of glaciers and snow.
27Fate of Mountain Glaciers in the Anthropocene
OBSERVED CHANGES IN THE HIMALAYAN-TIBETAN GLACIERS
Development of model for ice thickness estimation will require systematicfield experimentation. The following important issues related to Himalayanglaciers needs to be studied in future:
• Effect of carbon soot and contamination on snow and glacier ice
• Effect of debris cover on glacier ice-melt
• Use of Hyperspectral data in snow pack characterization
• Use of SAR interferometry and photogrammetry in glacier flow de-termination and glacier mass balance
• Development of algorithm for auto extraction of debris cover on gla-ciers and moraine-dammed lakes
• Development of method for auto extraction of glacier features.
AcknowledgementWe acknowledge with thanks the discussions and help by Dr. I.M.
Bahuguna, Mr. A.K. Sharma, Mr. S.K. Singh and Mr. B.P. Rathore, Scientistsat the Space Applications Centre, Ahmedabad in preparation of the presentpaper. The authors are thankful to Dr. Shailesh Naik, Secretary, Ministry ofEarth Sciences, Govt. of India and Dr. A.V. Kulkarni for their contributionsand fruitful discussions. We are also thankful to all the collaborating organ-izations who have contributed along with SAC ‘Snow and Glacier’ scientificteam in carrying out experiments and data analysis.
References
Ajai et al. 2011, Snow and glaciers ofthe Himalayas. Published by SpaceApplications Centre, (ISRO),Ahmedabad India. Also availableon www.moef.nic.in Bahuguna, I.M., Rathore, B.P., AnishMohan, Kulkarni. A. V., and Ajai,2010, Glacier cover change; a crit-ical parameter for climate changestudies, NNRMS Bulletin,NNRMS (B)-35.Benn, D.I., and Evans, D.J.A., 2010,
Glaciers and glaciation, 2nd edition,Hodder Education, London, 795p.Chaohai, L. and Sharma, C.K. 1988,Report on first expedition to gla-ciers in the Pumqu (Arun) andPoiqu (Bhote – Sun Kosi) riverbasins, Xi-Zang (Tibet) China. Sci-ence Press, Beijing, China, p. 192.Dozier, J. 1984. Snow reflectancefrom Landsat-4 Thematic mapperIEE Trans Geoscience and Rem.Sens. 22 (3), 328-328.
28 Fate of Mountain Glaciers in the Anthropocene
K. KASTURIRANGAN, R.R. NAVALGUND AND AJAI
Dozier, J. 1989. Spectral signature ofAlpine snow cover from the Land-sat Thematic mapper data. RemoteSens. Env. 28, 9-22.Discussion Paper II, 2011, Snow andglaciers of Himalaya; Inventory andMonitoring, Prepared by Space Ap-plications Centre, ISRO, Ahmedabadand Ministry of Environment andForest, Govt. of India, New Delhi.Available at www.moef.nic.in Kulkarni, A.V., Singh S.K., MathurP. and Mishra V.D. 2006. Algorithmto monitor snow cover using AW-iFS data of Resourcesat for the Hi-malayan region. Int. J. Rem. Sens.27 (12): 2449-2457.Kulkarni, A.V., Philip G., Thakur V.C.,Sood R.K., Randhawa S.S. andRam Chandra, 1999, Glacial inven-tory of the Satluj Basin using remotesensing technique, Himalayan Ge-ology Vol. 20(2), pp. 45-52.Kulkarni, A.V. 1992, Glacier inven-tory in the Himalaya, Natural re-sources management- a new per-spective, NNRMS-Bangalore pub-lication pp. 474-478.
Kulkarni A.V. 1992, Mass balance ofHimalayan glaciers using AAR andELA methods, Journal of Glaciol-ogy, 38(128), 101-104.Kulkarni, A.V., Randhawa, S.S.,Rathore, B.P., Bahuguna, I.M., andSood, R.K., 2002, Journal of IndianSociety of remote sensing, 30; 211-228.Kumar, Rakesh, Sing R.D. and Shar-ma K.D., 2005, Water Resourcesof India, current science, 89(5), 794-811.Rao, K.L., 1979, India’s water wealth,Orient Longman limited, NewDelhi.Rees, W.G., 2006, Remote Sensingof Snow & ice, Taylor of Francis,London, 435p.Sharma, A.K., Singh S.K., KulkarniA.V. and Ajai 2011. Glacier Inven-tory of the Himalayas. Communi-cated to Current Science.Singh, D., Jani S.K. & Kumar, N.(1997), Snow & glacier melt runoffcontribution in the Chenab riverat Akhnoor, Mountain ResearchDevelopment Vo. 17, pp. 49-56.


