FEBRUARY 26, 2014
OECD’S COUNTRY BY COUNTRY REPORTING: IMPLICATIONS & PRACTICAL APPLICATION OF THE PROPOSED TEMPLATE
AGENDA
• Overview
• Local File
• Master File for Risk Assessment
• Country by Country Reporting
• Practical Takeaways
OVERVIEW
• Background
– January 30, 2014 proposed Chapter V of OECD Transfer Pricing
Guidelines
– Follow-up to OECD’s White Paper on Transfer Pricing Documentation
– Part of the OECD Action Plan on Base Erosion and Profit Shifting
• Promised to suggest ways that documentation requirements to
enhance transparency taking into compliance costs
OVERVIEW
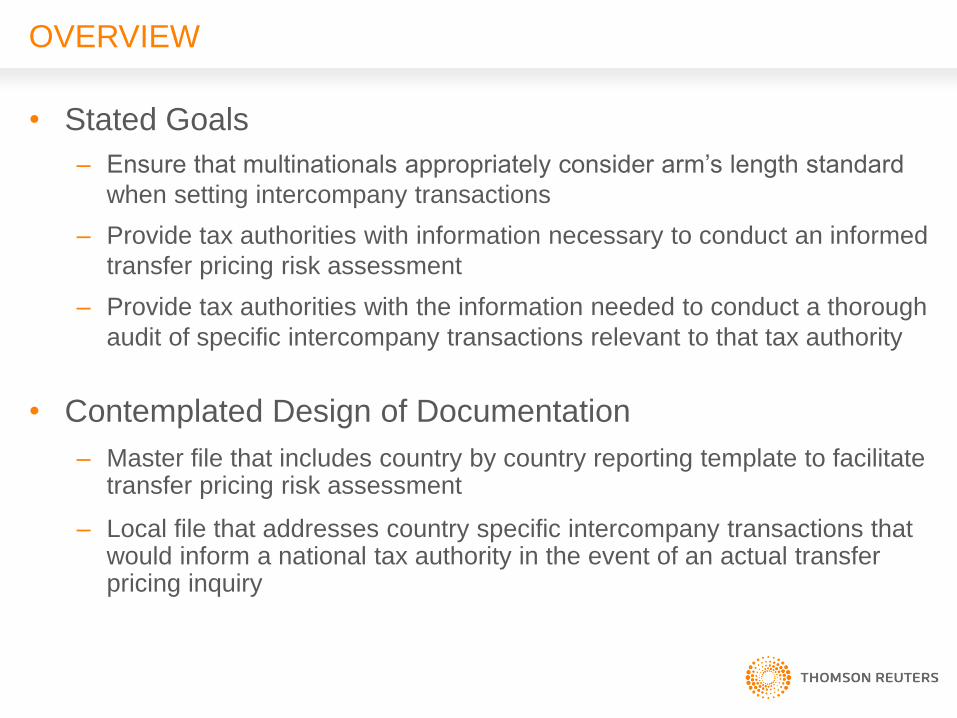
• Stated Goals
– Ensure that multinationals appropriately consider arm’s length standard
when setting intercompany transactions
– Provide tax authorities with information necessary to conduct an informed
transfer pricing risk assessment
– Provide tax authorities with the information needed to conduct a thorough
audit of specific intercompany transactions relevant to that tax authority
• Contemplated Design of Documentation
– Master file that includes country by country reporting template to facilitate transfer pricing risk assessment
– Local file that addresses country specific intercompany transactions that would inform a national tax authority in the event of an actual transfer pricing inquiry
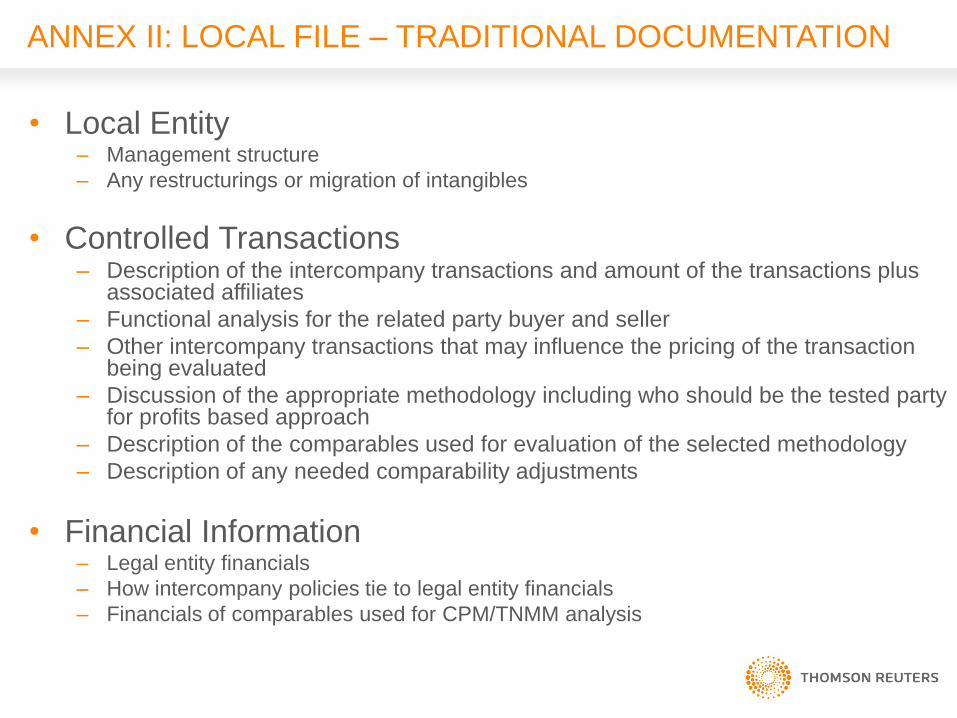
ANNEX II: LOCAL FILE – TRADITIONAL DOCUMENTATION
• Local Entity – Management structure
– Any restructurings or migration of intangibles
• Controlled Transactions – Description of the intercompany transactions and amount of the transactions plus
associated affiliates
– Functional analysis for the related party buyer and seller
– Other intercompany transactions that may influence the pricing of the transaction being evaluated
– Discussion of the appropriate methodology including who should be the tested party for profits based approach
– Description of the comparables used for evaluation of the selected methodology
– Description of any needed comparability adjustments
• Financial Information – Legal entity financials
– How intercompany policies tie to legal entity financials
– Financials of comparables used for CPM/TNMM analysis
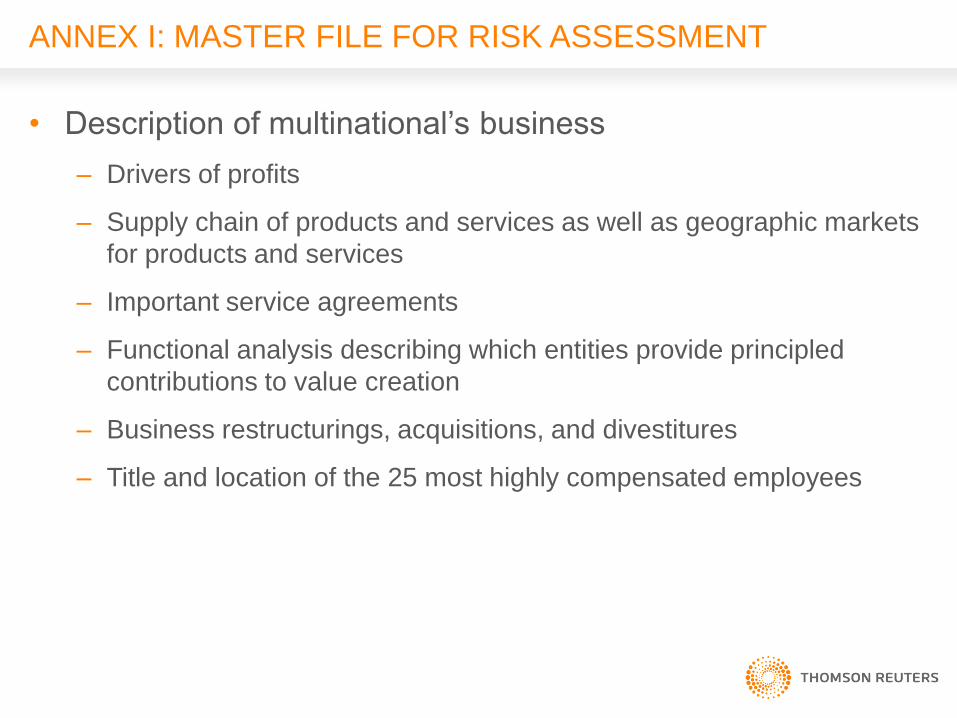
ANNEX I: MASTER FILE FOR RISK ASSESSMENT
• Description of multinational’s business
– Drivers of profits
– Supply chain of products and services as well as geographic markets
for products and services
– Important service agreements
– Functional analysis describing which entities provide principled
contributions to value creation
– Business restructurings, acquisitions, and divestitures
– Title and location of the 25 most highly compensated employees
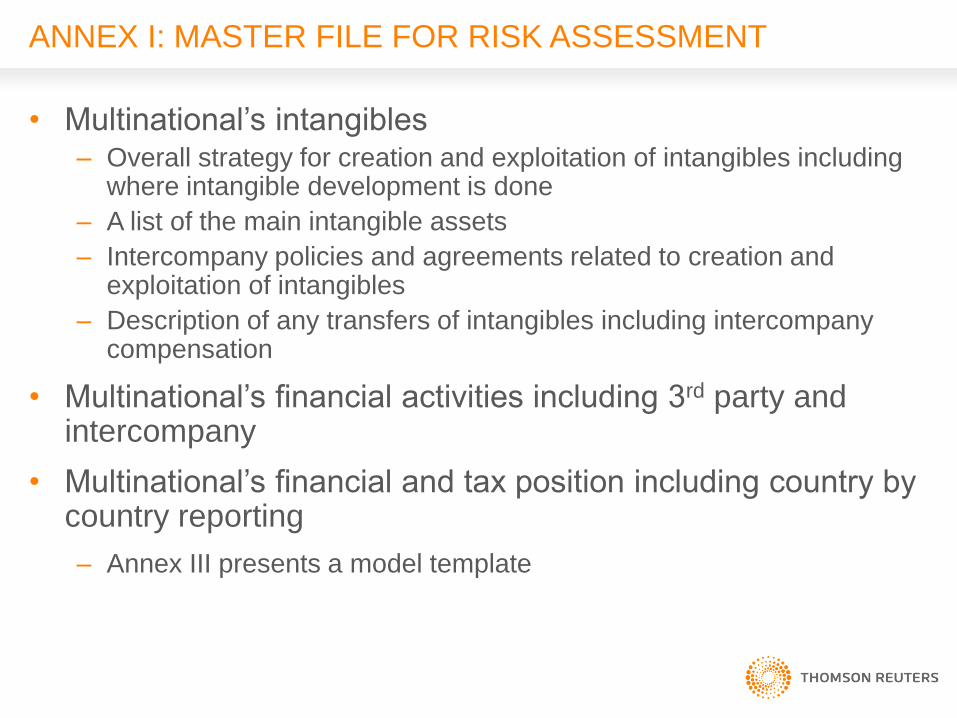
ANNEX I: MASTER FILE FOR RISK ASSESSMENT
• Multinational’s intangibles – Overall strategy for creation and exploitation of intangibles including
where intangible development is done
– A list of the main intangible assets
– Intercompany policies and agreements related to creation and exploitation of intangibles
– Description of any transfers of intangibles including intercompany compensation
• Multinational’s financial activities including 3rd party and intercompany
• Multinational’s financial and tax position including country by country reporting
– Annex III presents a model template
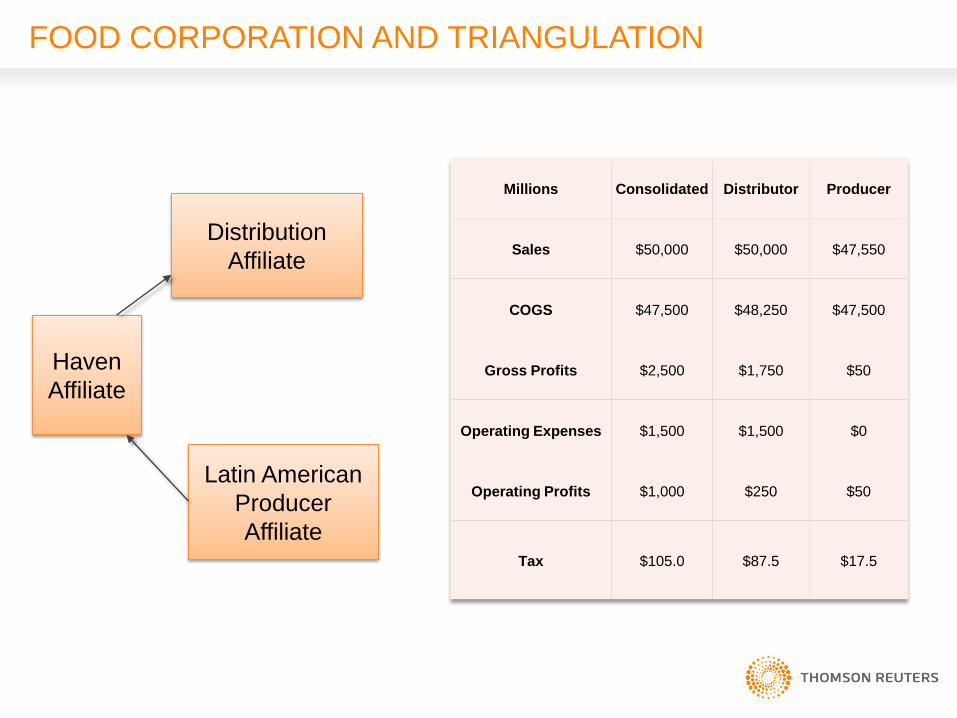
FOOD CORPORATION AND TRIANGULATION
Millions Consolidated Distributor Producer
Sales $50,000 $50,000 $47,550
COGS $47,500 $48,250 $47,500
Gross Profits $2,500 $1,750 $50
Operating Expenses $1,500 $1,500 $0
Operating Profits $1,000 $250 $50
Tax $105.0 $87.5 $17.5
Distribution
Affiliate
Latin American
Producer
Affiliate
Haven
Affiliate
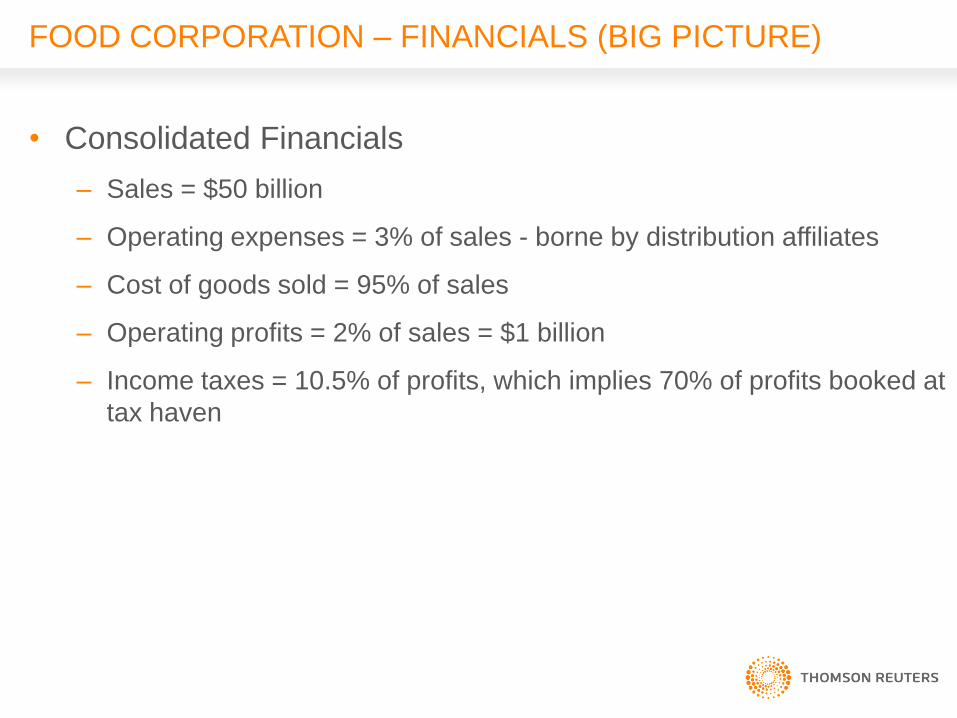
FOOD CORPORATION – FINANCIALS (BIG PICTURE)
• Consolidated Financials
– Sales = $50 billion
– Operating expenses = 3% of sales - borne by distribution affiliates
– Cost of goods sold = 95% of sales
– Operating profits = 2% of sales = $1 billion
– Income taxes = 10.5% of profits, which implies 70% of profits booked at
tax haven
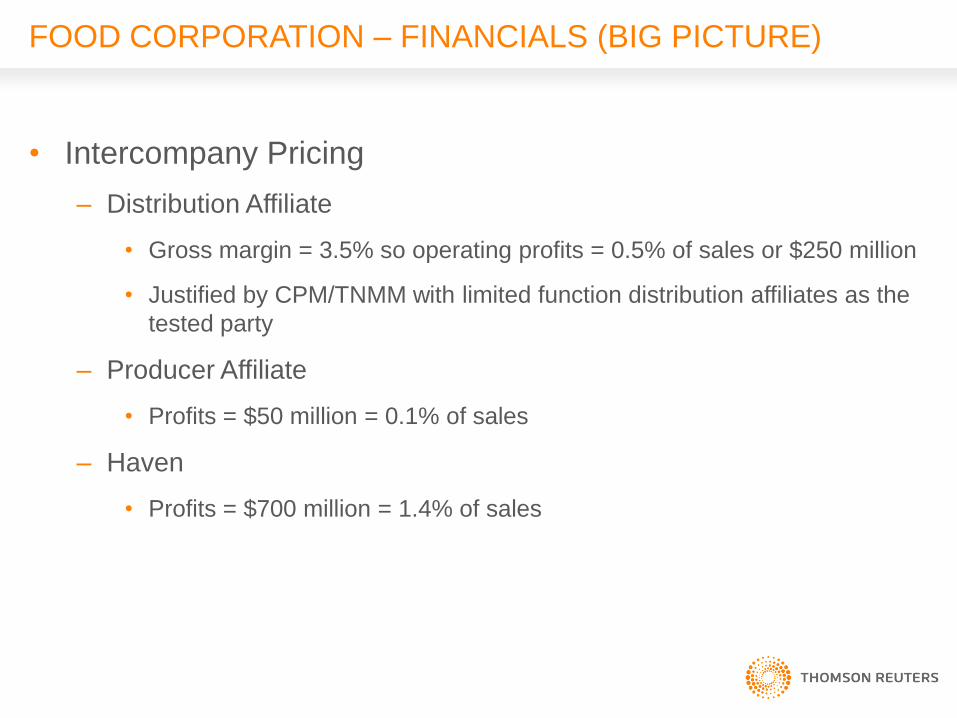
FOOD CORPORATION – FINANCIALS (BIG PICTURE)
• Intercompany Pricing
– Distribution Affiliate
• Gross margin = 3.5% so operating profits = 0.5% of sales or $250 million
• Justified by CPM/TNMM with limited function distribution affiliates as the
tested party
– Producer Affiliate
• Profits = $50 million = 0.1% of sales
– Haven
• Profits = $700 million = 1.4% of sales
FOOD CORPORATION – IMPORTANT DETAILS
• Multiple Affiliates
– Several distribution affiliates globally but main one is in U.S.
• We suggested transfer pricing to distribution affiliates may be
defensible with a CPM/TNMM analysis
– Several products coming from various Latin American affiliates
• Argentina supplies grains and soybeans
• Brazil supplies sugar
FOOD CORPORATION – IMPORTANT DETAILS
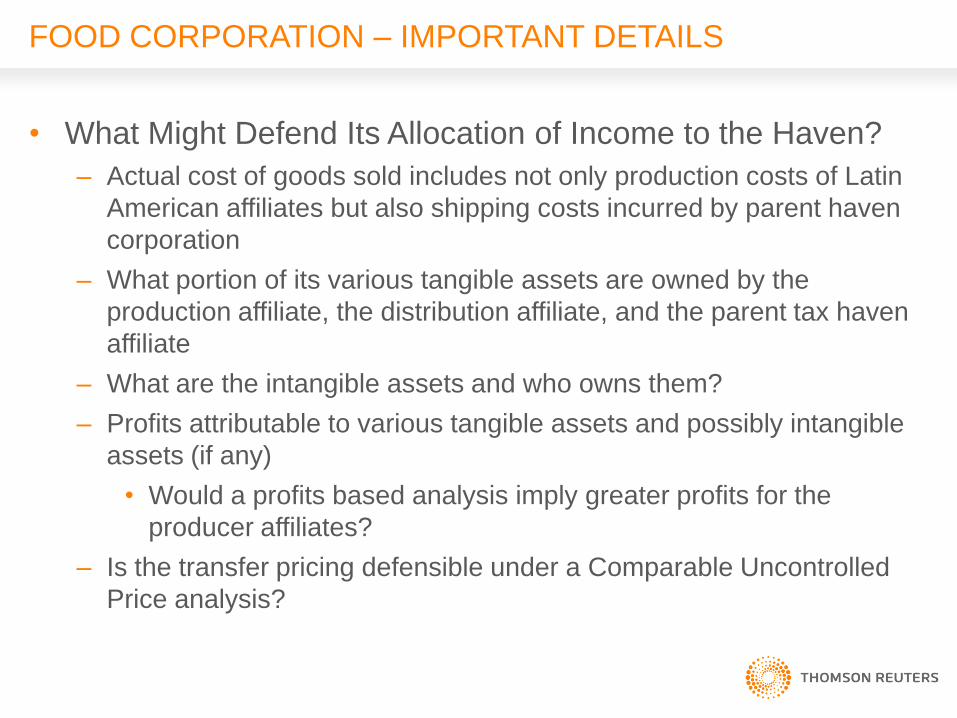
• What Might Defend Its Allocation of Income to the Haven?
– Actual cost of goods sold includes not only production costs of Latin
American affiliates but also shipping costs incurred by parent haven
corporation
– What portion of its various tangible assets are owned by the
production affiliate, the distribution affiliate, and the parent tax haven
affiliate
– What are the intangible assets and who owns them?
– Profits attributable to various tangible assets and possibly intangible
assets (if any)
• Would a profits based analysis imply greater profits for the
producer affiliates?
– Is the transfer pricing defensible under a Comparable Uncontrolled
Price analysis?
COUNTRY BY COUNTRY REPORTING TEMPLATE (ANNEX III)
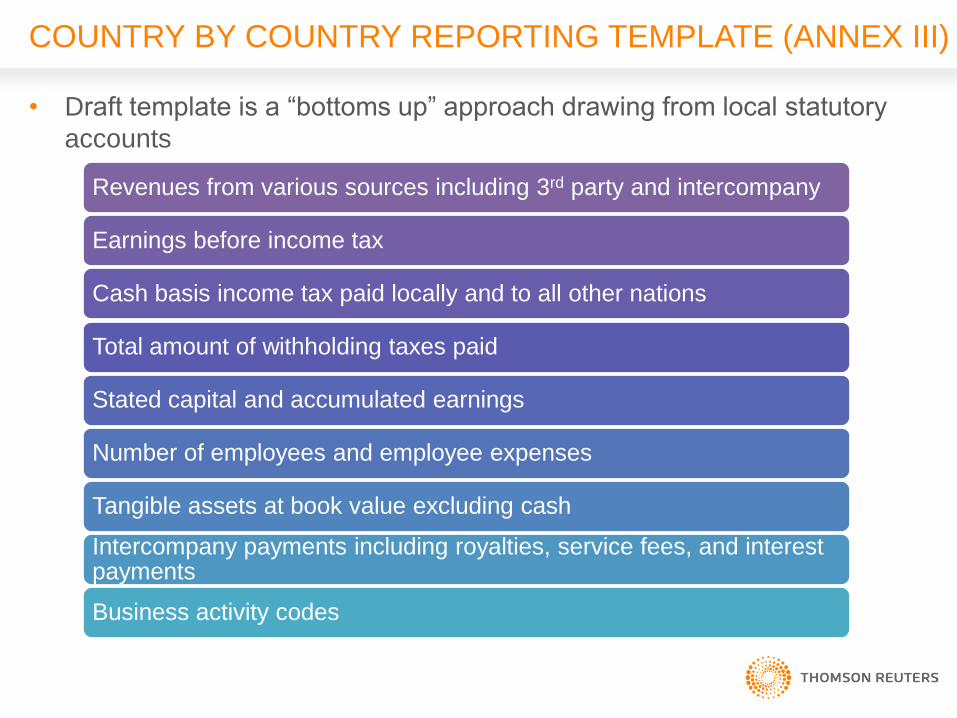
• Draft template is a “bottoms up” approach drawing from local statutory
accounts
Revenues from various sources including 3rd party and intercompany
Earnings before income tax
Cash basis income tax paid locally and to all other nations
Total amount of withholding taxes paid
Stated capital and accumulated earnings
Number of employees and employee expenses
Tangible assets at book value excluding cash
Intercompany payments including royalties, service fees, and interest payments
Business activity codes
COUNTRY BY COUNTRY REPORTING TEMPLATE (ANNEX III)
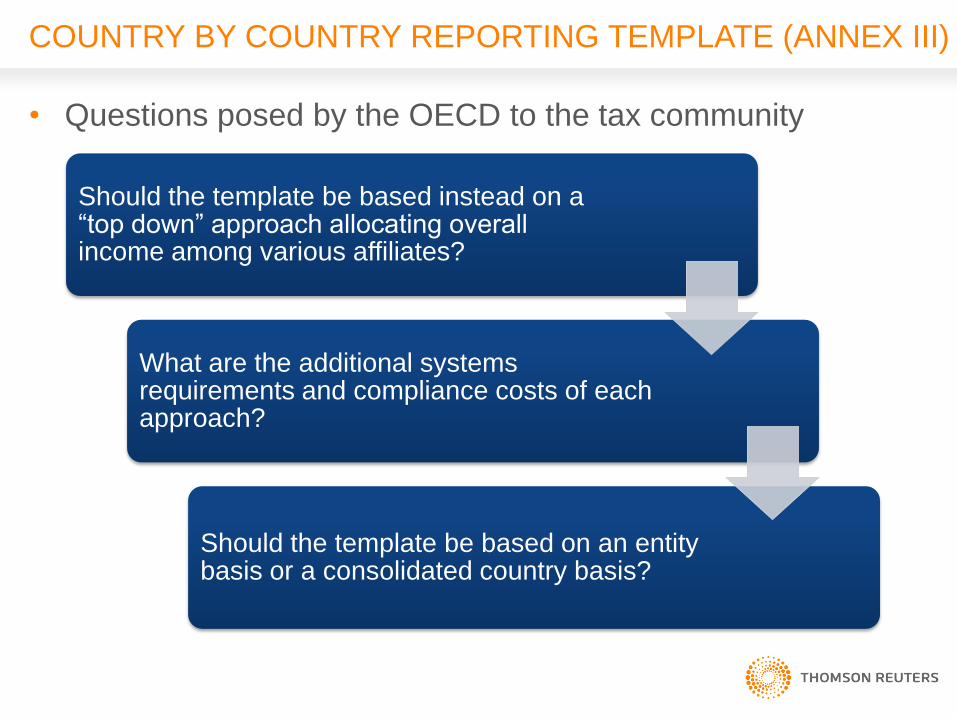
• Questions posed by the OECD to the tax community
Should the template be based instead on a “top down” approach allocating overall income among various affiliates?
What are the additional systems requirements and compliance costs of each approach?
Should the template be based on an entity basis or a consolidated country basis?
POTENTIAL TAX AUTHORITY USE
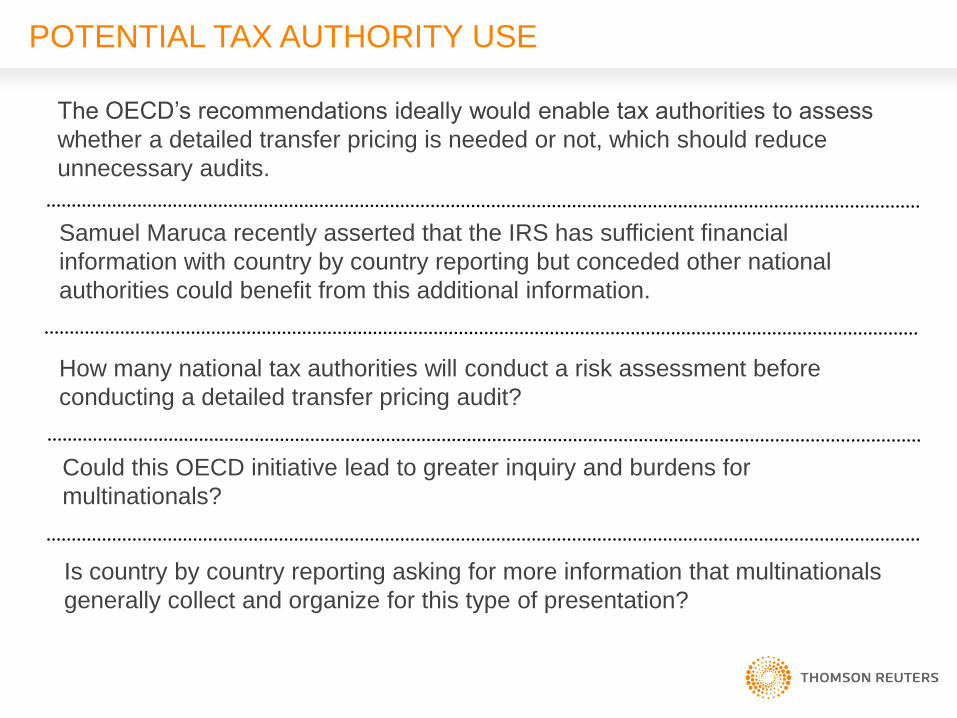
The OECD’s recommendations ideally would enable tax authorities to assess
whether a detailed transfer pricing is needed or not, which should reduce
unnecessary audits.
Samuel Maruca recently asserted that the IRS has sufficient financial
information with country by country reporting but conceded other national
authorities could benefit from this additional information.
How many national tax authorities will conduct a risk assessment before
conducting a detailed transfer pricing audit?
Could this OECD initiative lead to greater inquiry and burdens for
multinationals?
Is country by country reporting asking for more information that multinationals
generally collect and organize for this type of presentation?
PRACTICAL TAKEAWAYS
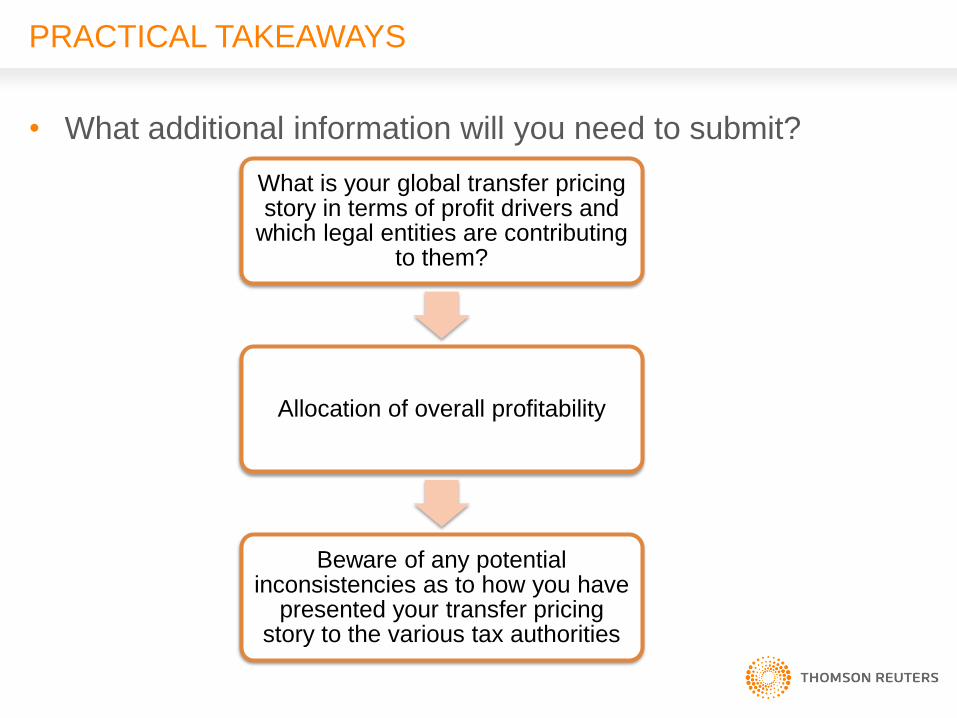
• What additional information will you need to submit?
What is your global transfer pricing story in terms of profit drivers and
which legal entities are contributing to them?
Allocation of overall profitability
Beware of any potential inconsistencies as to how you have
presented your transfer pricing story to the various tax authorities
PRACTICAL TAKEAWAYS
• How best to efficiently assemble this information?
– The Master File approach is fundamentally different from the traditional
by country and by transaction approach to transfer pricing
documentation.
– Division of responsibilities between the parent corporation and the local
affiliates
– Possible need to upgrade your information technology platforms
• Collection of qualitative information
• Presentation of financials and how they tie to intercompany policies
(Operational Transfer Pricing)
OPERATIONAL TRANSFER PRICING
• Reporting policy to reporting and defending results -
Challenges
– Ad hoc, spreadsheet intensive process frequently performed by
multiple parties
– Attempting to capture activity which cuts across traditional
reporting lines and is often assessed at unique levels - not
otherwise captured in statutory or management reporting
– Collection and merging of non-accounting, non-system data with
financial information
– Reconciling the results demanded by differing policies
– Review and QA of unsystematic process – internal audit and TP
defense challenges
• Prospect of country-by-country requirements – New
Challenges
– Need to segment centralized results or aggregate local data
– Competing standards and reporting levels
– TP process considerations: centralized vs. decentralized
– Potential need for increased granularity in TP monitoring and reporting
OPERATIONAL TRANSFER PRICING
TRANSFER PRICING SYSTEMS EVOLUTION
• To meet changing TP disclosure demands will require new systems capabilities – Ability to bridge TP policy to existing accounting infrastructure(s)
– Tying together varying systems in different regions and pooling data from wide range of sources
– Seamless integration of local non-financial data
– Automation of the data collection, processing, computations and reporting – maintaining security
– Systemization of TP computations
– Conversion of TP analyses into actionable accounting entries – link policy to results
– Robust audit trail – ability to trace and defend data and calculations used
– Need for increased clarity and flexibility in data - viewing TP transactions and results at multiple levels and split into varying segments
– Flexibility to present the same data to meet numerous, customized formats
OPERATIONAL TRANSFER PRICING IN PRACTICE
• Global Auto Company – Integration of data from over 50 General Ledger systems
– Monitors TP by functional segment, country and legal entity, with transparency into all intercompany transactions
• Diversified Technology, Media and Information Firm
– Management of close to 20 different TP policies
– Segmentation of analysis by both legal entity and business line
• Major Pharmaceutical Manufacturer – Tracking of TP results across 90 different product groups
– Management of true-ups and pricing corrections across entire supply-chain
– Merging of historical and forecasting systems for more complete assessment of TP position

QUESTIONS?