
Integrative causality analysis of genetic, epigenetic, andtranscriptomic data in a large cohort
Rosemary McCloskey and Sara Mostafavi
http://slideshare.net/rmcclosk/omics-integration
March 27, 2015
R. McCloskey & S. Mostafavi () Omics data integration March 27, 2015 1 / 12
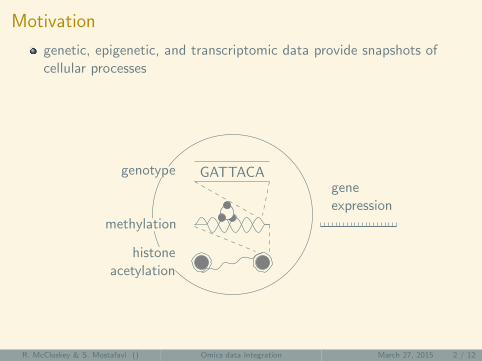
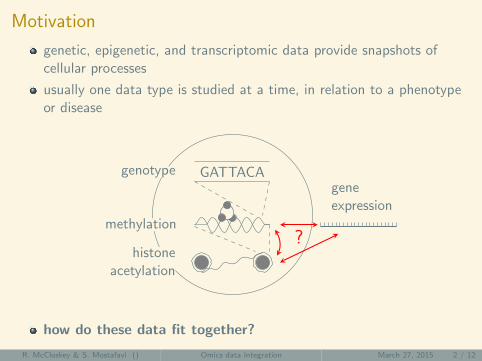
Motivation
genetic, epigenetic, and transcriptomic data provide snapshots ofcellular processes
usually one data type is studied at a time, in relation to a phenotypeor disease
GATTACA
?
geneexpression
methylation
histoneacetylation
genotype
how do these data fit together?
R. McCloskey & S. Mostafavi () Omics data integration March 27, 2015 2 / 12
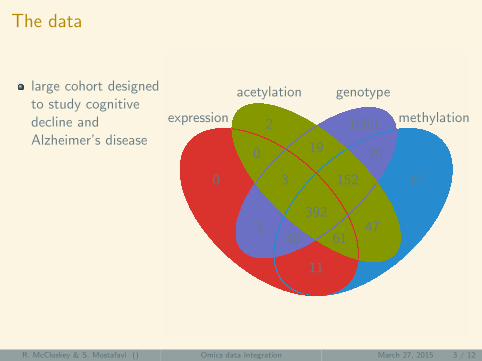
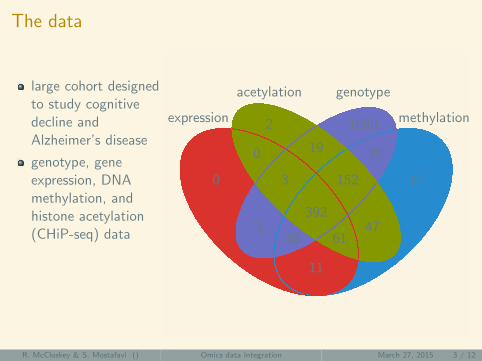
The data
large cohort designedto study cognitivedecline andAlzheimer’s disease
genotype, geneexpression, DNAmethylation, andhistone acetylation(CHiP-seq) data
392 individuals withall four data typeswere used for thisanalysis
2
19
1080
0
3
392
152
20
0
140 61
47
17
11
expression methylation
acetylation genotype
R. McCloskey & S. Mostafavi () Omics data integration March 27, 2015 3 / 12
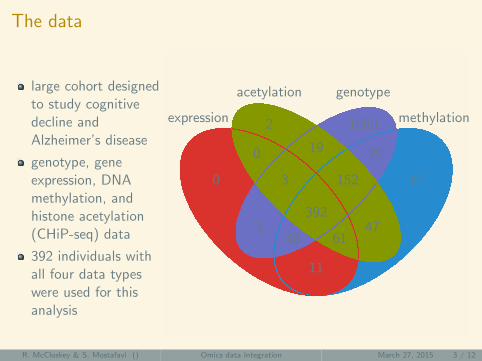
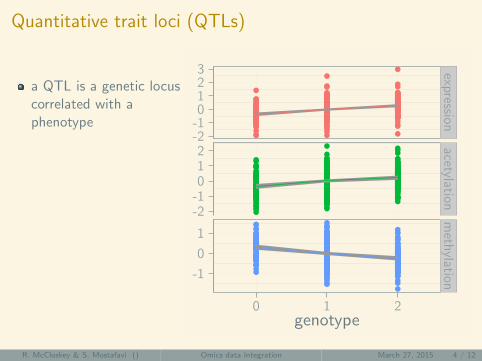
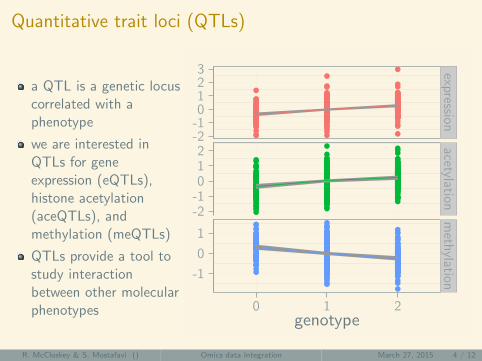
Quantitative trait loci (QTLs)
a QTL is a genetic locuscorrelated with aphenotype
we are interested inQTLs for geneexpression (eQTLs),histone acetylation(aceQTLs), andmethylation (meQTLs)
QTLs provide a tool tostudy interactionbetween other molecularphenotypes
-2-10123
-2-1012
-1
0
1
expressionacetylation
meth
ylation
0 1 2genotype
R. McCloskey & S. Mostafavi () Omics data integration March 27, 2015 4 / 12
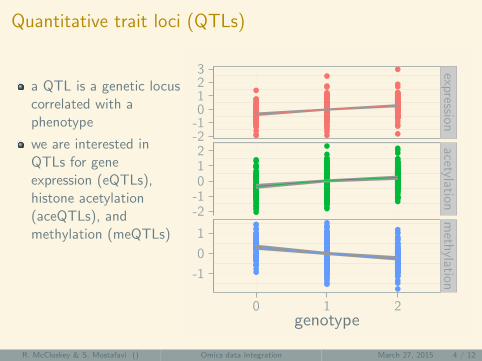
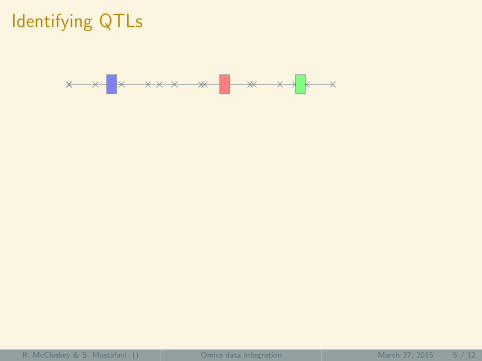
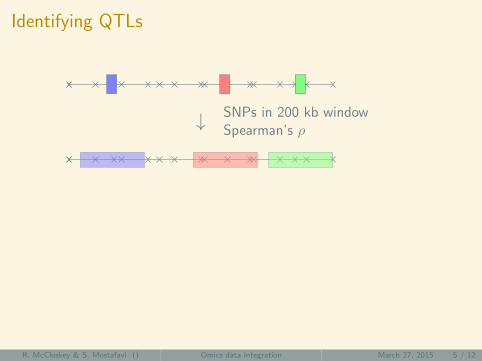
Identifying QTLs
↓ SNPs in 200 kb windowSpearman’s ρ
↓ Holm-Bonferroni correctionbest SNP per feature
↓ FDR correction
R. McCloskey & S. Mostafavi () Omics data integration March 27, 2015 5 / 12
Identifying QTLs
↓ SNPs in 200 kb windowSpearman’s ρ
↓ Holm-Bonferroni correctionbest SNP per feature
↓ FDR correction
R. McCloskey & S. Mostafavi () Omics data integration March 27, 2015 5 / 12

Identifying QTLs
↓ SNPs in 200 kb windowSpearman’s ρ
↓ Holm-Bonferroni correctionbest SNP per feature
↓ FDR correction
R. McCloskey & S. Mostafavi () Omics data integration March 27, 2015 5 / 12

Identifying QTLs
↓ SNPs in 200 kb windowSpearman’s ρ
↓ Holm-Bonferroni correctionbest SNP per feature
↓ FDR correction
R. McCloskey & S. Mostafavi () Omics data integration March 27, 2015 5 / 12
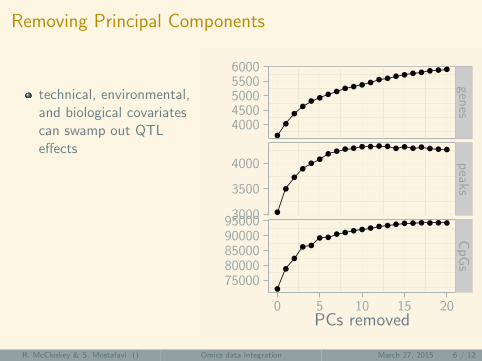
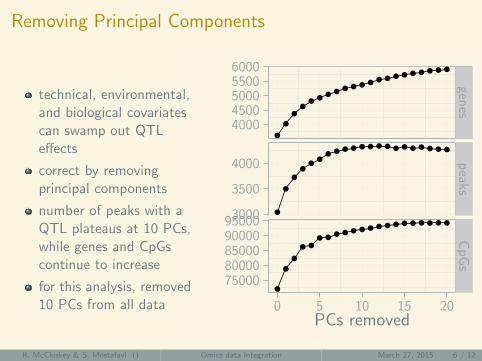
Removing Principal Components
technical, environmental,and biological covariatescan swamp out QTLeffects
correct by removingprincipal components
number of peaks with aQTL plateaus at 10 PCs,while genes and CpGscontinue to increase
for this analysis, removed10 PCs from all data
40004500500055006000
3000
3500
4000
7500080000850009000095000
genes
peaks
CpGs
0 5 10 15 20PCs removed
R. McCloskey & S. Mostafavi () Omics data integration March 27, 2015 6 / 12

Identifying multi-QTLs
By intersecting QTL sets, found240 gene, CpG, and peak tripleswhich shared the same QTL
29841799
50981
127
240
1604
2129
eQTL meQTL
aceQTL
29841799
50981
127
240
1604
2129
eQTL meQTL
aceQTL
Also assessed QTL overlap usingπ0 approach
100 %
46 %
14 %
31 %
100 %
11 %
83 %
84 %
100 %
eQTLs
aceQTLs
meQ
TLs
eQTLs
aceQTLs
meQTLs
R. McCloskey & S. Mostafavi () Omics data integration March 27, 2015 7 / 12

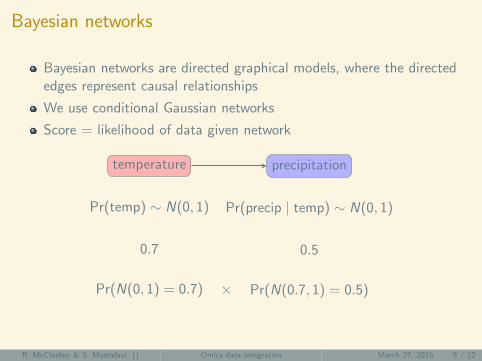
Bayesian networks
Bayesian networks are directed graphical models, where the directededges represent causal relationships
We use conditional Gaussian networks
Score = likelihood of data given network
temperature precipitation
Pr(temp) ∼ N(0, 1) Pr(precip | temp) ∼ N(0, 1)
0.7 0.5
Pr(N(0, 1) = 0.7) Pr(N(0.7, 1) = 0.5)×
R. McCloskey & S. Mostafavi () Omics data integration March 27, 2015 8 / 12

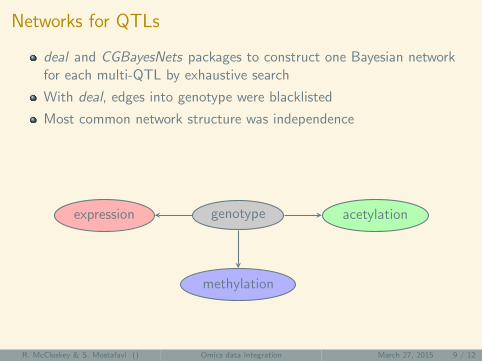
Networks for QTLs
deal and CGBayesNets packages to construct one Bayesian networkfor each multi-QTL by exhaustive search
With deal, edges into genotype were blacklisted
Most common network structure was independence
Accounted for 42% of deal networks, 29% of CGBayesNets networks
genotypeexpression acetylation
methylation
R. McCloskey & S. Mostafavi () Omics data integration March 27, 2015 9 / 12

Future Work
Expand the number of multi-QTLs
More that just the best SNP per featureIdentify overlapping QTLs intelligently
More rigourous criterion for number of PCs to remove
Try other packages for network learning (HyPhy)
Are QTLs enriched in SNPs identified in GWAS studies?
Correlations with phenotype (cognitive decline etc.)
R. McCloskey & S. Mostafavi () Omics data integration March 27, 2015 10 / 12
Thank you!
Harvard / Broad
Philip L. D. Jager
Lori Chibnik
Jishu Xu
Charles White
Cristin McCabe
Towfique Raj
Rush
David A Bennett
Chris Gaiteri
Lei Yu
Bioinformatics Training Program
All the students
Sharon Ruschkowski
R. McCloskey & S. Mostafavi () Omics data integration March 27, 2015 11 / 12
Software
QTL analysis
Matrix eQTL
qvalue
Bayesian networks
deal
CGBayesNets
Slides
beamer
TikZ
tikzDevice
Plots
pheatmap
ggplot2
VennDiagram
Colour Scheme
solarized
R. McCloskey & S. Mostafavi () Omics data integration March 27, 2015 12 / 12


