

J. Flow Injection Anal., Vol. 16, No. 2 (1999)
AUTOMATIC ON-LINE SORBENT EXTRACTION PRECONCENTRATION SYSTEM FOR FLAME ATOMIC ABSORPTION SPECTROMETRIC DETERMINATION OF
COPPER AND LEAD IN TABLE AND FORTIFIED WINES
J. M. P. J. Garrido*, R. A. S. Lapa, J. L. F. C. Lima* and C. Delerue-Matos*
CEQUP / Departamento de Qufrnica-Ffsica, ~Guldade de Farmticia da Universidade do Porto, Rua
A d a 1 Cunha 164,4050 Porto-Portugal
ABSTRACT This paper reports the development of an automated FIA system for the direct determination of
copper and lead in Table and Fortified Wines by flame atomic absorption spectrometry after flow
injection on-line sorbent extraction preconcentration. The studied metals were complexed using diethylammonium-N,N-diethyldithiocarbamate as
chelating agent and then collected in a column packed with bonded silica reversed-phase sorbent
with octadecyl functional groups (RP-C18), positioned at the loop of the FIA system injection valve. The metal complexes were afterwards eluted with ethanol and straight directed to the atomic absorption spectrometer nebulizer.
The present FIA manifold allows the attainment of a sampling rate of about 65 samples/hour for lead determinations and from 150 to 300 samples/hour for copper determinations considering its
concentration level in the samples. The detection limit for both species was about 4 pgL.
Keywords FIA, preconcentration, copper, lead, wines, flame atomic absorption spectrometry
INTRODUCTION
The determination of copper and lead
concentrations is commonly carried out in wine control laboratories, because these metals are
T o whom correspondence should be addressed.
"Permanent address: Institute Superior de Engenharia do Porto, Rua S. Tom6,4200 Porto.
highly toxic and they greatly influence the organoleptic properties of the product
The copper content of wine is mainly
exogenous, from the copper sulphate sprays used to control mildew; the endogenous fraction derives from the soil.
The methods generally used for the
determination of copper in wine include voltammetry [I], ion chromatography [2] and
inductively coupled plasma atomic emission
spectrometry (ICP-AES) [3]. Nevertheless,
flame atomic absorption spectrometry (FAAS)
[4-61 is the most common method used. Its use
is recommended by Office International de la
Vigne et du Vin [5] and it is the official
Portuguese method [6] . The official procedure recommends the standard additions method to
reduce the effects of wine matrix complexity and overcome the FAAS sensitivity.
When copper concentration in wine
samples is very low, FAAS determinations are
unsatisfatory and other procedures such as electrothermal atomisation atomic absorption
spectrometry (ETA-AAS) [7, 81, also called graphite furnace atomic absorption spectrometry (GF-AAS), or sample
preconcentration prior to FAAS or ICP-AES determination [9,10] have been employed.
Lead contamination in wine is mainly due
to environmental pollution, e.g. car exhausts and to certain oenological practices, for
example the contact between wine and tubing
made of bronze, brass or rubber or the use of additives or coadjuvants [9, 1 1- 131.
Lead determination in wines has been
commonly performed by colorimetry [14, 151, inductively coupled plasma mass spectrometry (ICP-MS) [16, 171, voltammetry [18, 191,
FAAS [20, 211, FAAS with hydride generation [22, 231 and ETA-AAS [24-261 used as reference methodology [27-291.
Other procedures are referred to in the literature, based on semi-automated flow
systems with sample preconcentration which requires pretreatment of samples and resort to colorimetry [30] or FAAS [31] as the detection
system. The present work describes the
development of a flow injection analysis (FIA)
manifold that comprises a column for the sorbent extraction and FAAS detection for
copper and lead determination in Table and
Fortified Wines. This automated system allows the determination of both species without
requiring significant changes to the manifold configuration and facilitates the direct insertion
of samples into the system without prior
pretreatment, despite matrices complexity of Port Wine and Madeira Wine samples. The
sorbent and chelating agent used are similar to
those reported by Fang et al. for the determination of the same species in water samples [32].
EXPERIMENTAL
All solutions were prepared with double- deionized water with a specific conductivity
less than 0.1 pSIcm. Analytical grade
chemicals were used throughout Dieth ylatnmonium-N,N-
diethyldithiocarbarnate (DDDC) 0.1% (wlv)
solution was prepared daily by dissolving the solid (Aldrich) in an aqueous solution of 0.01
M acetic acid and 0.02 M ammonia (pH 9.2)
1331. Standard solutions were prepared by
dilution of copper nitrate and lead nitrate solutions at concentrations of 1000 mg/L (BDH Spectrosol) in HNOs 0.2% (wlv). These

standards presented an ethyl alcohol content
similar to that of the samples.
The extraction column was packed with 40- 63 pm (Sigma) bonded silica reversed-phase
sorbent with octadecyl functional groups (RP-
C18), that have been used as the solid sorbent,
4100 ZL atomic absorption spectrometer with
longitudinal Zeemm background correction and equipped with a Perkin-Elmer THGA and
an AS 70 autosampler. Perkin-Elmer software
installed in a personal computer controlled the
equipment used and an Epson LX-800 Printer displayed the results.
Gilson P100, PI000 and P5000 variable volume semi-automatic pipettes were used for
the accurate measurement of solutions. Lead determination by the reference
procedure was carried out in a Perkm-Elmer
The proposed FIA manifold comprised a Rheodyne 5020 injection valve actuated by a microcomputer [34] for the accurate control of opening and closing times of the valve. The
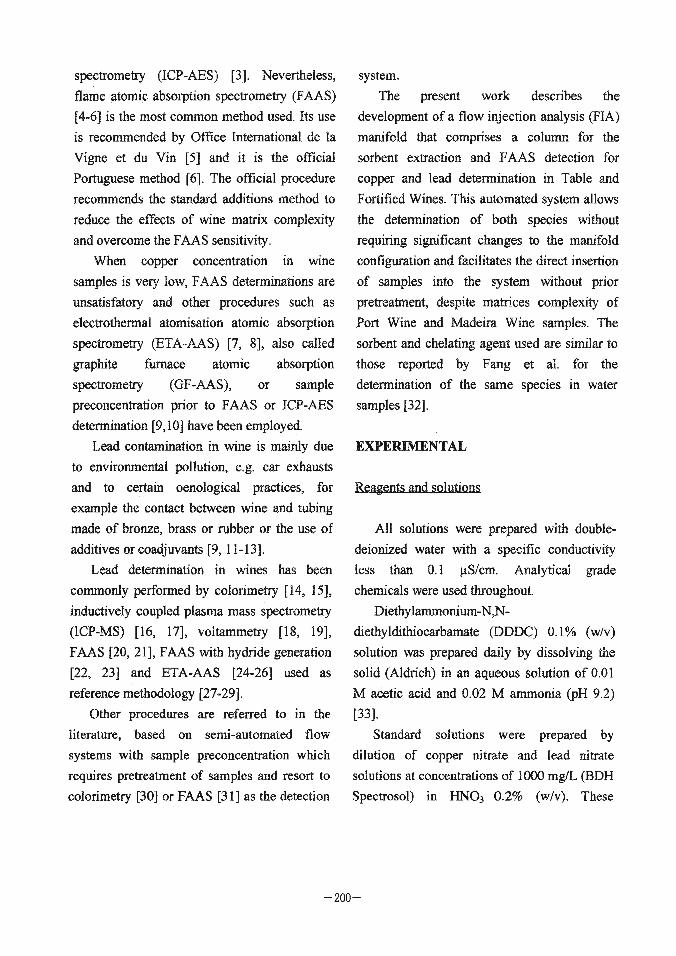
Fig. 1 (A) Detailed view of the column: A, threaded fittings; B, coating; C, PTFE tubing with an internal
diameter identical to that of the manifold; D, rubber fixing ring, E, conical column with sorbent packing.
(B) Flow injection manifold used for copper and lead determination: P, peristaltic pump; Qj, flow rates; D,
dampers; V, injection valve; C,colurnn; X and Y, confluences; Lj, tube lengths (Ll = 30 cm; L2 = 3 cm;
L3 = 6 cm); AA, atomic absorption spectrometer; W, waste.
loop of the injection valve consisted of a home-
made conic-shaped column (Fig. 1A) packed
with the sorbent. To minimize sample dispersion, the column was positioned in the
system so that the sample and chelant could
flow from the narrowest to the largest part of the column and the eluent in the opposite
direction [35]. Two Gilson Minipuls 2
peristaltic pumps were used to propel the different solutions. Tygon pump tubes and a
solvent resistant silicone rubber pump tube
(Isoversinic) were used for the eluent. Ornnifit PTFE tubing (0.8-nun i.d.) connected by
endfittings and joints of the same brand were
used for the reaction coils. Home-made Perspex dampers and confluences were used
[36l. A Perkin-Elmer 5000 atomic absorption
spectrometer was operated according to the manufacturer's instructions and the
wavelengths used were 324.8 and 283.3 nm for copper and lead respectively. The flame
conditions were slightly leaner than those
recommended in order to compensate for the effect of the eluent used. In these conditions the
optimal aspiration flow rate was 2.5 mL/min. The openinglclosing steps of the valve, as
well as the direction of rotation and speed of
the peristaltic pumps were controlled by a Mtek
microcomputer equipped with an Intel 486 DX data processor which also controlled elution
and preconcentration times and its sequence. The analytical signals were acquired either by
this control system or a Kipp & Zonen BD 111
recorder.
Comparison of the results obtained using
the FIA methodology and those of the batch
procedures, allowed evaluation of the quality of
the results provided by the present automated
system. The conventional determination of metal
content in Table Wines was carried out according to the recommendations of Office
International de la Vigne et du Vin and therefore FAAS was used with the standard addition method for copper determinations [5 ] ,
and ETA-AAS for lead [28], Due to the lack of a reference procedure for
the analysis of Fortified Wines (Port Wine and
Madeira Wine), the results of the proposed methodology were compared with those
obtained from previously developed methodology [7,26].
RESULTS AND DISCUSSION
The FIA system was developed from a
simple configuration (Fig. 1B) that allowed adjustment of sample acidity inside the system
(merging of the flows at confluence X) in order to achieve an effective complexing reaction
with the chelating solution (added through channel Q2) at confluence Y. The metal complexes were preconcentrated in the column
(C) placed at the injection valve (V) loop. Rotating the valve to the reverse position allowed the eluent (channel Q l ) to flow through the column and the subsequent
entrainment of the metal complexes to the

atomic absorption spectrometer in which the
measurement took place.
The manifold parameters were optirnised using the univariant method with the intention
of (i) estimating copper and lead concentrations without pretreatment of samples; (ii) allowing
both species to be determined without changing
the configuration; (iii) analysing both Table
and Fortified Wines. The system was optimised, particularly in
respect of reproducibility and sampling rate. The quality of the results obtained by the
proposed methodology was assessed by
comparing them with those obtained from the reference procedures using the same samples.
Reactors Length. Different lengths were tried for reactor LI positioned between X and
Y joints, This reactor mixes the sample from channel Q3 with nitric add from channel 04.
Reactor lengths less than 30 cm provided insufficient reproducibility of the analytical signals due to inadequate mixing between the
sample and the nitric acid which would cause
poor retention of the species inside the
preconcentration column. Longer reactors showed that there was excessive dilution of the
sample that reduced the effectiveness of the
preconcentration step and consequently
required longer preconcentration periods, which decreased the sampling rate; selecting a
30-cm length for reactor LI achieved a satisfactory compromise between both
requirements.
The length for reactor L2 (3 cm) that connects confluence Y (in which the
complexing reaction takes place) to the injection valve as well as for reactor L3 (6 cm)
(through which this valve is connected to the atomic absorption spectrometer) was basically
determined by the physical configuration of the
manifold. It was set to the minimum possible value because the complexed metal species
flowing through reactor L2 tended to be
adsorbed by the reactor walls [37], whereas a higher dispersion of the species in the eluent
flow would reduce the analytical signal if a
longer L3 reactor were used. Sample/Nitric Acid Flow Rates and Acid
Concentration. The ratio of the flow rates in
channels Q3 and Q4 (confluence X) conditions the sample before the metal complexes are
formed after confluence Y as well as its
subsequent retention in the column. The
optimal conditions required for this procedure vary according to the metal studied due to their
different concentration and to the differences between Table and Fortified Wines matrices.
Samples dilution and acidification at
confluence X are both required because the high levels of copper in wines would otherwise cause column saturation. Alternatively, a
shorter preconcentration step might be attempted if the reproducibility of the results is not affected. A four times dilution of the
sample at confluence X was found to be
appropriate for Table and Fortified Wines and thus Q4=1.0 mL/min and Q3=4.2 mLImin flow
rates were selected. The experimental conditions for lead

determination are much more restrictive than
those required for copper determination due to
the low concentrations of the former in wines.
Hence the flow rates at confluence X were
reduced to the lowest possible otherwise a high
sample volume (time) would have to be used in
the preconcentration procedure and
consequently the detection limits and sampling
rates would be compromised.
The flow rates selected for Fortified Wines,
Q3=2.5 mL/min and Q4=1.0 mLImin, were
also suitable for Table Wines. Nevertheless the
less complex matrix of Table Wines allows
higher sample and acid flow rates (Q3=4.4
mL/min and Q4=1.3 mL/min) and thus higher
sampling rates.
The optimisation of Q3lQ4 flow rates for
the estimation of copper and lead was
performed considering the optimization of
HN@ concentration for standards and samples
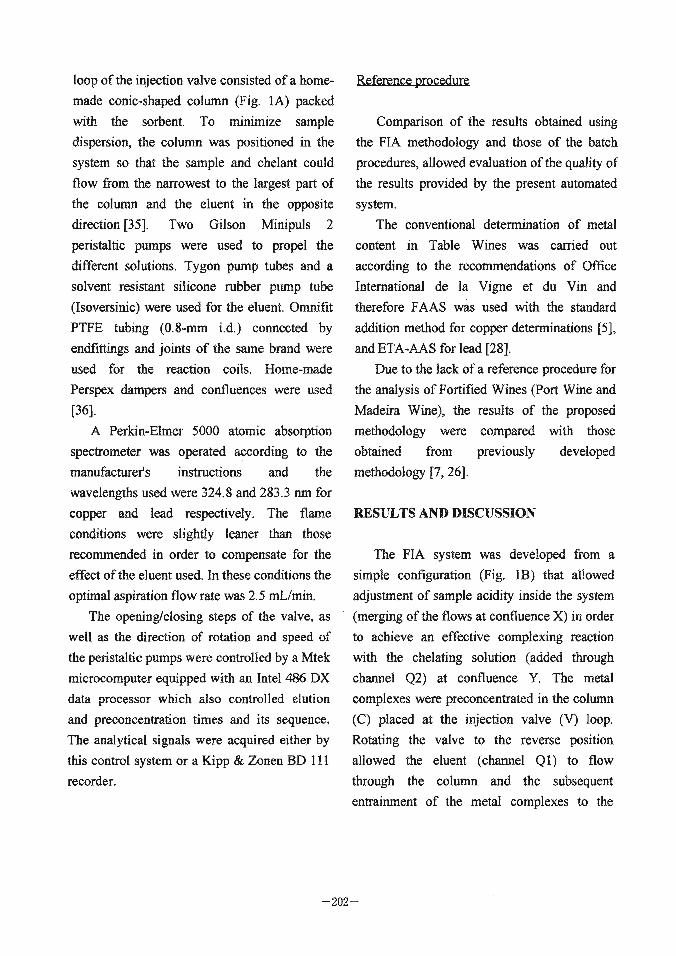
in channel 04. When analysing standard copper solutions
with nitric acid concentrations ranging from 0
to 3M (Fig. 2) the signal amplitude was
constant, whereas for samples of both wines the
best response was obtained at HN@ concentration of 1M and above (Fig. 2). The
concentration of 1M was therefore selected.
For lead determination, it was found that
the analytical signal peak height attained for
standards did not significantly vary up to about
9M acid concentration. The samples, however,
provided increasing peaks up to 6M nitric acid
concentration (Fig. 2), which was therefore
selected as optimal HN@ concentration.
Chelating Agent Concentration and Flow
Rate. The chelating agent concentration in
channel Q2 solution was assessed within a
concentration range of 0.02% to 0.2% (wlv).
and using differently concentrated standards
and samples. No significant differences in the
analytical signal amplitude attained for both
were found. Therefore the mean concentration
(0.1%) of the chelating agent was selected for
complexing copper and lead in both Table and
Fortified Wines, although the lowest
concentration would be sufficient to prevent its
consumption by other metals that may be
present in higher concentrations in other
samples, whose composition may vary in
relation to those used in our study.
After establishing the chelating solution
composition, its flow rate at confluence Y in
which the acidified sample is mixed with this
solution was also evaluated. This mixing step is
greatly affected by the limited length of reactor
L2 discussed previously. The propulsion of fluids by peristaltic pumps inevitably produces
pulses in the flow, even when pulse dampers
are used. The mixing of two flows at a
confluence is never fully accomplished before
it reaches the reactor placed next to the
confluence. Optimal conditions for perfect
mixing at confluence Y were sought without
changing the reactor length due to the effects
mentioned above and it was found that this occurs at flow rates higher than 1.0 mL/min.
The selection of the flow rate for the
chelating solution (Q2), 1.0 mLImin, was
determined by the fact that higher flow rates at
Q2 in addition to those set for Q3 and Q4
produced an overpressure on the preconcentra-

0 , 0 0 - 1 ~ ~ ~ ~ ~ ~ ~ * * 0 1 2 3 4 5 6 7 8 9
Nitric acid concentrati-on (mol/L)
Fig. 2 Effect of nitric acid concentration on the peak heights of (A) copper standards and samples (o and A)
and (B) leadstandards and samples (x and 0).
tion column positioned at the loop of the
injection valve and, consequently, reduced
reproducibility. Eluent Flow. As methanol and ethanol are
widely used for the elution of hydrophobic sorbents [33], these solvents were tested in the
proposed system (channel Ql) and no
significant effects on the analytical signal amplitude and precision were found. Therefore,
ethanol was used as the eluent due to its lower toxicity.
When optimising this parameter, a slight
overpressure on the nebulizer was imposed
compared to the optimum recommended for the atomic absorption spectrometer when operating under conventional conditions with this solvent
(2.5 mLImin). The use of overpressure in atomic absorp-
tion spectrometer coupled to FIA systems
produces better reproducibility of results, as already stressed by some of us in prior works [38,39].
Flow rates ranging from 2.3 to 3.7 mL/min
were tested and it was found that lower flows
produced lower sampling rates and that the highest flows gave rise to high consumption of the eluent as well as excessive overpressure
inside the manifold. This determined the
selection of a 2.8 mL/min flow rate for the eluent determined by the peristaltic pump.
Precancentration and Elution Time Intervals. Adequate preconcentration and elution times depend upon copper and lead concentration of the samples; these times can
be changed whenever necessary by the computer which controls all the system. The

optirnisation of these parameters was carried
out in the current study considering the usual
concentration ranges of these metals even
under unfavourable conditions. Therefore, the
lenght of the preconcentration step was
optimised using solutions with concentrations
near the lowest concentration levels whereas
for the determination of the best elution time,
solutions with concentrations near to the
highest values were used.
The optimal times for copper
preconcentration and elution were assessed
within a copper concentration range of 25 to
200 pg/L and 200 to 1250 pg/L. Times of 1619s
and 418s were accomplished for the lowest and
highest concentrations, respectively.
For lead determinations, a concentration
range of 20 to 100 pg/L was used in the
optimisation of the same parameters, with a
preconcentration step of 50s and a 10s elution.
After optimisation of the manifold
parameters, the system working characteristics
were evaluated.
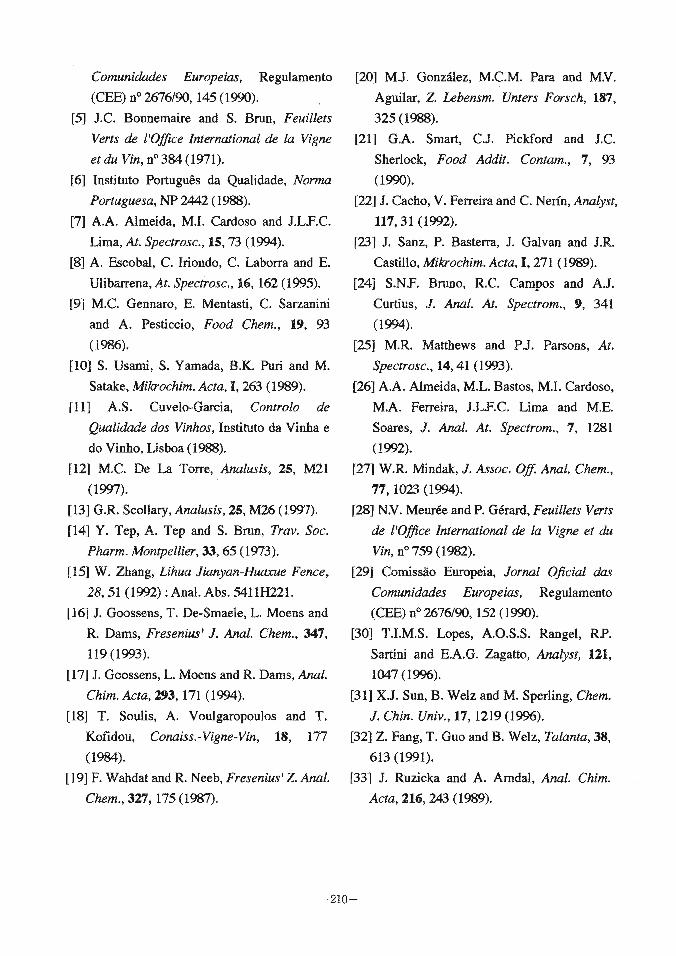
The developed system allowed the
attainment of sampling rates for copper
determinations of about 150 sampleslhour with
concentrations ranging from 25 to 200 pg/L (Fig. 3), and about 300 sampleslhour at higher
concentrations. In both conditions, the
reproducibility of the system was good,
providing results with a relative standard
deviation (RSD) of 1.6% for 11 consecutive
injections of samples with an intermediate
concentration taken from the considered range
of concentrations. The detection limit evaluated
as the concentration corresponding to three-
times the standard deviation of the background
signal 1401, corresponded to 4 pg/L for the low
concentration levels.
The determination of lead at concentrations
of 20 to 100 pg/L was accomplished at a
sampling rate of about 65 sampledhour. A
detection limit of 4 pg/L [40] and a RSD of
1.9% for 11 consecutive injections were
obtained.
Precision of the results obtained from the
automated system was assessed by comparison
with those from the reference methods, namely
FAAS standard addition method [5] for copper
determinations (Table 1) and ETA-AAS 1281 for lead determinations (Table 2). As there are
no reference methods for comparison of the
results obtained with Fortified Wine samples,
these were compared with those given by ETA- AAS, the procedure used for the determination
of both species [7,26]. After comparison of the results obtained for
a set of 19 Table and Fortified Wines, the
relationship CF = CO + SxCR, where CF corresponds to the concentration obtained by
the FIA methodology and CR to that given by
the reference method, was established.
A CO of -3.2 pg/L and an S value of 1.01
were obtained for copper determinations. A
correlation coefficient of 0.9996 between the
current and the reference methods was found

Fig. 3 FIA register obtained for the determination of copper in wines corresponding to injections of
standards [(a) 25, (b) 50, (c) 100, (d) 150 and (e) 200 pglL] and samples.
for the 19 samples analysed, showing that there was a excellent agreement between both
methodologies. The mean relative deviation of the automated procedure was less than 2%, the
highest corresponding to 5%, for the different wine samples in copper concentrations ranging
from 29.0 to 1230.0 ( i g L The comparison
with the results provided by ETA-AAS methodology [7] showed that there was also a
good agreement between both methodologies (Table 1).
The results obtained from the determination of lead concentration in the samples (varying
from 22.8 to 92.0 pg/L) were also compared
and presented a CO of 0.006 pg/L, an S value
of 0.996 and a correlation coeffici'entof 0,998. The mean relative deviation of the proposed
methodology was less than 1% (the maximum
being about 4%).
CONCLUSIONS
On-line sorbent extraction preconcentration by FIA coupled to flame AAS is an
advantageous alternative to conventional
procedures for copper and lead determination in Table and Fortified Wines.
The automated procedure described in this . . . .

Table 1 Results in pg/L obtained from copper determination in Table Wines (W- White; R- Red) and Fortified Wines (PW- Port Wine; MW- Madeira Wine) by on-line sorbent extraction preconcentrarion FIA methodology (FIA), by the reference method (ON) and by electrothermal atomisation (ETA-US)")
Method RD Sample FIA O N ETA-AAS a b
W5 161.7 169.0 170.2 4 . 3 0.7 (1) Please see text. (2) Relative deviation of the developed methodology to the reference method (a) and ETA-US (b).
study presents great advantages in relation to
the methods previously described in the
literature for lead determination [30, 311
because samples are inserted into the system
without prior treatment. This allows automation
of the whole analytical procedure as well as the
attainment of good sampling rates that are not
affected by the need for pretreatment of
samples.
When comparing the present methodology
to electrothermal atomisation AAS it is found
that column preconcentration and subsequent
flame AAS determination provides high
sampling rates in addition to results of similar
precision. The manifold presents other
advantageous features such as easy handling
and less expensive maintenance and working
conditions.
It should also be stressed that this FIA mani fold only requires the instrumentation usually

Table 2 Results in pgIL, obtained from lead determination in Table Wines (W-White; R- Red) and Fortified Wines (PW- Pan Wine; MW- Madeira Wine) by on-line sorbent extraction preconcentration FIA methodology and by the reference method
FIA Reference Sample preconcentrati on method RD (%)(I)
PW1 53.8 55.0 -2.2
PW2 60.8 61.8 -1.6
R5 21.9 22.8 -3.9 (1) Relative deviation of the developed methodology to the reference method.
available in control laboratories and that is the same detection system as that of conventional procedures and avoids the use of ETA-AAS for lead determinations in wines.
REFERENCES
[I] A. Herrero, M.C. Ortiz, J. Arcos, J. L6pez-
Palacios and L. Sarabia, Anal. Chim. Acta,
293,277 (1994).
[2] S. Jun, J.L.F.C. Lima and M.C.B.S.M. Montenegro, Rev. Port. Farm., 43, 5
(1993). [3] F.S. Interesse, F. Lamparelli and V.
Alloggio, 2. Lebensm. Unters Forsch, 178,
272 (1984).
[4] Comissiio Europeia, Jornal Oficial das
ACKNOWLEDGEMENTS
The authors wish to thank JNICT for the financial support given through PBIC/C/QUIM/2 165195 Project. One of us is thankful to Prodep Program (J.M.P.J.G.) for the Master grant.
Comunidades Europeias, Regulamento
(CEE) no 2676190,145 (1990).
[5] J.C. Bonnemaire and S. Brun, Feuillets
Verts de 1'Office Internotional de la Vigne
et du Vin, no 384 (1971).
[6] Institute Portugues da Qualidade, Norma
Portuguesa, NP 2442 ( 1988).
[7] A.A. Almeida, M.I. Cardoso and J.LJF.C.
Lima, At. Spectrosc., 1§,7 (1994).
[8] A. Escobal, C. Iriondo, C. Laborra and E. Ulibarrena, At. Spectrosc., 16, 162 (1995).
[9] M.C. Gennaro, E. Mentasti, C. Sarzanini and A. Pesticcio, Food Chem., 19, 93
(1986). [lo] S. Usarni, S. Yamada, B.K. Puri and M.
Satake, Mikrochim. Acta, 1,263 (1989).
[ l l ] A.S. Cuvelo-Garcia, Control0 de
Qualidade dos Vinhos, Instituto da Vinha e
do Vinho, Lisboa (1988).
[12] M.C. De La Torre, Analusis, 25, M21
( 1997). 1131 G.R. Scollary, Analusis, 25, M26 (1997).
[14] Y . Tep, A. Tep and S. Brun, Tray. Soc.
Pharm. Montpellier, 33,65 (1973).
[15] W. Zhang, Uhua Jianyan-Huaxue Fence,
28,51 (1992) :Anal. Abs. 5411H221.
[16] J. Goossens, T. De-Smaele, L. Moens and R. Dams, Freseniusf J. Anal. Chem., 347,
119 (1993).
[17] J. Goossens, L. Moens and R. Dams, Anal.
Chim. Acta, 293,171 (1994).
[IS] T. Soulis, A. Voulgaropoulos and T. Kofidou, Conaiss.-V@e-Vin, 18, 177
( 1984). [19] F. Wahdat and R. Neeb, Fresenius' 2. Anal.
Chem., 327,175 (1987).
[20] M.J. Gonzalez, M.C.M. Para and M.V.
Aguilar, Z. Lebensm. Unters Forsch, 187,
325 (1988).
[21] G.A. Smart, CJ. Rckford and J.C.
Sherlock, Food Addit. Contam., 7, 93
(1990). [22] J. Cacho, V. Ferreira and C. Nerfn, Analyst,
117.31 (1992).
[23] J. Sanz, P. Basterra, J. Galvan and J.R. Castillo, Mikrochim. Acta, I, 271 (1989).
[24] S.N.F. Bruno, R.C. Camps and A.J. Curtius, J. Anal. At. Spectrom., 9, 341
(1994). [25] M.R. Matthews and PJ. Parsons, At.
Spectrosc., 14,4l (1993).
[26] A.A. Almeida, M.L. Bastos, M.I. Cardoso,
M.A. Ferreira, J.U.C. Lima and M.E.
Scares, J. Anal. At. Spectrom., 7 , 1281
(1992).
[27] W.R. Mindak, J. Assoc. Off. Anal. Chem.,
77,1023 (1994).
[28] N.V. Meurk and P. Gerard, Feuilkts Verts
de lfOffice International de la Vigne et du
Vin, no 759 (1982).
[29] ComissSo Europeia, Jomal Oficial das
Comunidades Europeias, Regulamento (CEE) no 2676190,152 (1990).
[30] T.I.M.S. Lopes, A.O.S.S. Rangel, RP.
Sartini and E.A.G. Zagatto, Analyst, 111,
1047 (1996).
[31] X.J. Sun, B. Welz and M. Sperling, Chem.
J. Chin. Univ., 17,1219 (1996).
[32] Z. Fang, T. Guo and B. Welz, Talanta, 38,
613 (1991).
[33] J. Ruzicka and A. Arndal, Anal. Chim.
Acta, 216,243 (1989).

[34] J.MPJ. Gamdo, R.A.S. Lapa, J.L.F.C. Lima, C.D. Matos and J.L.M. Santos, J. Autom. Chem., 18.17 (19%).
[35l Z. Fang, Flow Injection Separation and Preconcentrafion. VCH Publishers, Weinheim (1993).
[36] S. Alegret, J. Alonso, J. Bartroli, A.A.S.C. Machado, J.L.F.C. Lima and J.M. Paulis, Quim. Anal., 6,278 (1987).
[37] M. Sperling, X. Yin and B. Welz, J. Anal.
At. Spectrom., 6,295 (1991). [38] J.LF.C. Lima and A.O.S.S. Rangel, Am. 1.
Enol. Vitic., 41,284 (1990).
[39] J.L.F.C. Lima and A.O.S.S. Rangel, Food Control, 2,146 (1991).
[40] Analytical Methods Committee, Analyst, 112, 199 (1987).
(Received June 4, 1999)
(Accepted July 30, 1999)


