

Accepted Manuscript
Title: On the morphology of cellulose nanofibrils obtained byTEMPO-mediated oxidation and mechanical treatment
Author: Jose A.F. Gamelas Jorge Pedrosa Ana F. LourencoPere Mutje Israel Gonzalez Gary Chinga-Carrasco GurvinderSingh Paulo Ferreira
PII: S0968-4328(15)00016-5DOI: http://dx.doi.org/doi:10.1016/j.micron.2015.02.003Reference: JMIC 2162
To appear in: Micron
Received date: 23-12-2014Revised date: 11-2-2015Accepted date: 11-2-2015
Please cite this article as: Gamelas, J.A.F., Pedrosa, J., Lourenco, A.F., Mutje,P., Gonzalez, I., Chinga-Carrasco, G., Singh, G., Ferreira, P.,On the morphologyof cellulose nanofibrils obtained by TEMPO-mediated oxidation and mechanicaltreatment, Micron (2015), http://dx.doi.org/10.1016/j.micron.2015.02.003
This is a PDF file of an unedited manuscript that has been accepted for publication.As a service to our customers we are providing this early version of the manuscript.The manuscript will undergo copyediting, typesetting, and review of the resulting proofbefore it is published in its final form. Please note that during the production processerrors may be discovered which could affect the content, and all legal disclaimers thatapply to the journal pertain.

Page 1 of 22
Accep
ted
Man
uscr
ipt
To be submitted to... . Last update 141006.
1
1On the morphology of cellulose nanofibrils obtained by TEMPO-mediated 2
oxidation and mechanical treatment3
4José A. F. Gamelasa*, Jorge Pedrosaa, Ana F. Lourençoa, Peré Mutjéb, Israel Gonzálezb, Gary 5Chinga-Carrascoc, Gurvinder Singhd, Paulo Ferreiraa**6
7aDepartment of Chemical Engineering, CIEPQPF, University of Coimbra, Pólo II. R. Sílvio 8Lima, PT - 3030-790 Coimbra, Portugal9
10bDepartment of Chemical Engineering, LEPAMAP, University of Girona, c/M. Aurèlia 11Campmany, nº 61, Girona 17071, Spain12
13c Paper and Fibre Research Institute, PFI, Høgskoleringen 6B, N-7491, Trondheim, Norway14
d Department of Chemical Engineering, NTNU, N-7491 Trondheim, Norway15
*[email protected] (José A. F. Gamelas), Tel: 00351239798740; fax: 0035123979870316
**[email protected] (Paulo Ferreira), Tel: 00351239798747; fax: 0035123979870317
1819
Abstract202122
The morphological properties of cellulose nanofibrils (CNF) obtained from eucalyptus23
pulp fibres were assessed. Two samples were produced with the same chemical treatment 24
(NaClO/NaBr/TEMPO (2,2,6,6-tetramethylpiperidine-1-oxyl radical) oxidation), but distinct 25
mechanical treatment intensities during homogenization. It was shown that the nanofibrils 26
production yield increases with the mechanical energy. The effect of mechanical treatment on 27
the yield was confirmed by laser profilometry of air-dried nanocellulose films. However no 28
significant differences were detected regarding the nanofibrils width as measured by atomic 29
force microscopy (AFM) of air-dried films. On the other hand, differences in size were found 30
either by laser diffraction spectroscopy or by dynamic light scattering (DLS) of the cellulose 31
nanofibrils suspensions as a consequence of the differences in the length distribution of both 32
samples. The nanofibrils length of the more nanofibrillated sample was calculated based on 33
the width measured by AFM and the hydrodynamic diameter obtained by DLS. A length 34
Page 2 of 22
Accep
ted
Man
uscr
ipt
To be submitted to... . Last update 141006.
2
value of ca. 600 nm was estimated. The DLS hydrodynamic diameter, as an equivalent 35
spherical diameter, was used to estimate the CNF length assuming a cylinder with the same 36
volume and with the diameter (width) assessed by AFM. A simple method is thus proposed to 37
evaluate the cellulose nanofibrils length combining microscopy and light scattering methods.38
39
Keywords: Nanofribrillated cellulose; TEMPO-oxidised cellulose nanofibrils; morphology; 40
size; dynamic light scattering, atomic force microscopy41
42
Introduction43
In the last decade the interest in cellulose nanofibrils (CNF) increased exponentially. This 44
material, usually obtained as a viscous gel, was firstly produced in the eighties (Turbak et al., 45
1983) after passing a wood fibre suspension several times through a homogenizer under high 46
pressure. Chemically pre-treated CNF can be regarded as interconnected webs of tiny 47
nanofibrils with diameters (D) typically of less than 20 nm and lengths (L) in the micrometer 48
scale. The specific D and L dimensions of CNF can vary according to the pristine material 49
and the conditions of the process used for their preparation but the aspect ratio (L/D) is in all 50
cases very high (Gardner et al., 2008; Lavoine et al., 2012; Shinoda et al., 2012). CNF51
possesses a specific surface area significantly higher than that of the pristine cellulose fibres 52
(values can reach more than 100 m2/g (Lavoine et al., 2012)). However, the exact values have 53
been difficult to assess. Nitrogen adsorption using BET calculation has been the most 54
common method to determine the specific surface area but it is widely accepted that the BET 55
values underestimate the real values of surface area, because the measurement is made on the 56
material after drying, where the microfibrils are strongly aggregated by hydrogen bonding57
(Lavoine et al. 2012). In addition, the BET specific surface area will be also strongly 58
dependent on the applied drying process (air drying, freeze drying, spray drying). One of the 59

Page 3 of 22
Accep
ted
Man
uscr
ipt
To be submitted to... . Last update 141006.
3
most important characteristics of CNF is the high strength property, commonly measured on 60
CNF films, that is the result of a high specific surface area for hydrogen bonding. Besides, 61
highly translucent films can be obtained from the CNF suspensions. All these characteristics 62
of CNF, namely the viscosity properties of the CNF gel, the high specific surface area, high 63
mechanical resistance and high light transmittance of its solid films make it appealing for a 64
wide range of applications. Just to mention a few, it may be used in formulations as a 65
viscosity modifier, as gel for biomedical applications (Chinga-Carrasco and Syverud, 2014), 66
as a mechanical reinforcement material in composites, including paper (Ahola et al., 2008a; 67
Syverud and Stenius, 2009), for paper coating (Brodin et al., 2014), in films for food 68
packaging (Syverud and Stenius, 2009; Aulin et al., 2010) and for electronic devices (Chinga-69
Carrasco et al., 2012), and as gas barrier material (Fukuzumi et al., 2009, Lavoine et al. 2012).70
The assessment of the physical and chemical properties of cellulose nanofibrils produced 71
by several methods is of main interest from both the fundamental and practical point of view. 72
Accordingly to a previous review, the main points that should be addressed are the amount of 73
produced nanomaterial, the rheology of the dispersion, the particle size (including aspect 74
ratio) and size distribution, crystallinity, specific surface area, surface charge and chemistry, 75
and mechanical properties (Kangas et al., 2014). Obviously, in account for the foreseen 76
applications, some of the properties can have more importance than the others. 77
The size and size distribution of nanofibrils is always an important parameter to consider, 78
but it should be mentioned that presently no standard methods or validated techniques are 79
available for the size evaluation of polydisperse nanomaterials with a high aspect ratio 80
(Fraschini et al., 2014). Microscopy techniques, such as high-resolution scanning electron 81
microscopy (SEM), transmission electron microscopy (TEM) and atomic force microscopy 82
(AFM) are most appropriate to visualize the cellulose nanofibrils (Chinga-Carrasco et al., 83
2014). However, it is widely recognised that these are much dependent on the operator and84
Page 4 of 22
Accep
ted
Man
uscr
ipt
To be submitted to... . Last update 141006.
4
are usually restricted to the analysis of a small amount of sample, besides being time-85
consuming (Fraschini et al., 2014). On the other hand, techniques based on light scattering, 86
such as dynamic light scattering (DLS), can circumvent most of the drawbacks mentioned for 87
microscopy-based techniques provided that the particles are spheres or have a shape close to 88
that of spheres. This is not the case of cellulose nanofibrils that are closer to a cylindrical 89
shape. Notwithstanding, it was reported for cellulose nanocrystals that the equivalent 90
hydrodynamic radius, measured by DLS, did not differ much from the theoretical 91
hydrodynamic radius, calculated for cylinder-shaped particles based on the dimensions of 92
length and width assessed by Field emission-SEM (Fraschini et al. 2014). Thus, microscopy93
and light scattering methods are considered complementary. 94
In the present work, cellulose nanofibrils obtained by TEMPO-mediated oxidation and 95
different intensity of mechanical treatment will be assessed using complementary techniques, 96
covering structures from the micrometre to the nanoscale. Special emphasis will be put on the 97
determination of the cellulose nanofibrils length using DLS and AFM data and different 98
computing approaches.99
100
Experimental section101
Nanofibrils preparation102
A bleached eucalyptus kraft pulp was pre-treated with NaClO and catalytic amounts of 103
TEMPO (2,2,6,6-tetramethylpiperidine-1-oxyl radical) and NaBr according to a methodology 104
described elsewhere (Saito et al. 2007). In a typical experiment, 15 g of cellulose fibres were 105
dispersed in distilled water containing TEMPO (0.016 g per g of fibres) and NaBr (0.1 g per g 106
of fibres) at a consistency of 1%. The mixture was stirred during 15 minutes at room 107
temperature in order to assure a good dispersion of all the substances. After this, a 15% 108
sodium hypochlorite solution was added drop by drop to the slurry. The volume of NaClO 109
Page 5 of 22
Accep
ted
Man
uscr
ipt
To be submitted to... . Last update 141006.
5
was calculated to have 4 mmol per gram of cellulose. The pH was kept at 10 by addition of 110
drops of a 0.5 M NaOH solution. The oxidation was considered finished when the pH kept 111
constant at 10. The oxidized fibres were then filtered and washed with distilled water. The 112
fibres were then passed through a homogenizer (GEA Niro Soavi Panda Plus 2000, Italy) 5 113
times at 300 bar (CNF-5p) or 15 times (five passes at 300 bar and 10 passes at 600 bar) (CNF-114
15p). Homogenization was performed at room temperature with a pulp consistency of 1.5 %. 115
During the homogenization it is normal that after several passes the temperature of the fluid 116
raises up to 60-70ºC. When this happened, homogenization was stopped in order to avoid 117
pump cavitation and the process continued after cooling of the fluid and equipment at room 118
temperature. The resulting nanofibrils were then characterized for their morphology 119
properties, as described below. 120
121
Characterization methods122123124
The yield of nanofibrils production was determined in triplicate after centrifugation (Alila 125
et al. 2013) of 40 mL of CNF suspensions (0.2%, w/w) at 9000 rpm for 30 min: the retained 126
fraction was analysed for its solid content and compared to the original to obtain by difference 127
the percentage (w/w) of supernatant material. The percentage of fibrillar material separated at 128
the supernatant by centrifugation, corresponds thus to the “yield”. The transmittance of CNF129
suspensions (0.1%, w/w) in the 400-800 nm visible range was measured using a Jascow V550 130
spectrophotometer. Transmittance was measured immediately after stirring the CNF 131
suspensions. 132
Field emission-SEM, AFM micrographs and laser profilometry (LP) were taken on CNF 133
films. The films were obtained by air drying of the original nanocellulose suspensions (0.2%, 134
w/w) in a Petri plate at room temperature for about 7 days.135

Page 6 of 22
Accep
ted
Man
uscr
ipt
To be submitted to... . Last update 141006.
6
The Field emission-SEM images were acquired at 1000x magnification with a Zeiss Ultra 136
field-emission SEM, using 3 kV and 4.7 mm acceleration voltage and working distance, 137
respectively.138
AFM imaging was performed using a Multimode AFM microscope equipped with a 139
Nanoscope V controller (Digital Instruments). All images were recorded in ScanAsyst mode 140
(peak force tapping mode), at room temperature, in air. The AFM tips, of spring constant 141
value ~0.4 N/m, were purchased from Bruker AFM probes. The size of the assessed areas was 142
2 m × 2 m. The nanofibril diameter distribution was quantified on the AFM images, as 143
previously described by Chinga-Carrasco et al. (2011).144
For LP analysis, samples of 10 mm × 10 mm were coated with a layer of gold (Lehmann, 145
Lehman Mess-Systeme AG, Baden-Dättwil, Germany). Ten topography images were 146
acquired from the top and bottom sides (bottom refers to the part of the film that during the 147
film formation has been in physical contact with the Petri plate and top refers to the side of 148
the film formed in contact with air). The lateral and z-resolution of the profilometry system 149
was 1 m and 10 nm, respectively. The size of the local areas was 1 mm × 1 mm. The 150
surfaces were horizontally levelled. The surface images were bandpass filtered to suppress the 151
surface structures with wavelengths larger than approximately 160 m, applying a FFT filter 152
implemented in the ImageJ program. The roughness described by the root-mean square (Sq) 153
was thus quantified at wavelengths of less than 160 m (Chinga-Carrasco et al. 2014).154
Laser diffraction spectroscopy (LDS), which is appropriate to analyze particles with size 155
larger than 1 m, according to the Lorentz-Mie theory (Gouesbet and Grehan, 1999), was 156
performed using a Mastersizer 3000 (Malvern Instruments). 100 mL of the original CNF157
suspensions with a dry matter-content of approximately 0.1% were prepared and magnetically 158
stirred during one hour before the measurements. The suspensions were analysed prior to 159
centrifugation, thus including all the material obtained after the chemi-mechanical treatment 160
Page 7 of 22
Accep
ted
Man
uscr
ipt
To be submitted to... . Last update 141006.
7
of the pulp fibres. A certain volume of the prepared suspension was added to 700 mL of water 161
in the equipment vessel until a 10–20% obscuration was reached, and the tests were162
performed setting the pump speed to 2000 rpm. The results presented are an average of six 163
measurements. 164
Dynamic light scattering (DLS) measurements were made using a Zetasizer Nano ZS 165
(Malvern Instruments). This technique allows the analysis of particles in the size range 166
between 0.6 nm and 6.0 m. The detection was made at a scattering angle of 173º and the 167
intensity size distributions were obtained from analysis of the correlation function using the 168
CONTIN algorithm in the instrument software. The supernatants obtained after centrifugation 169
of 40 ml of the CNF suspensions (0.2% w/w) at 9000 rpm for 30 min were analysed, and the 170
results were an average of five replicated measurements. Zeta potential measurements were 171
carried out in triplicate using the same equipment. 172
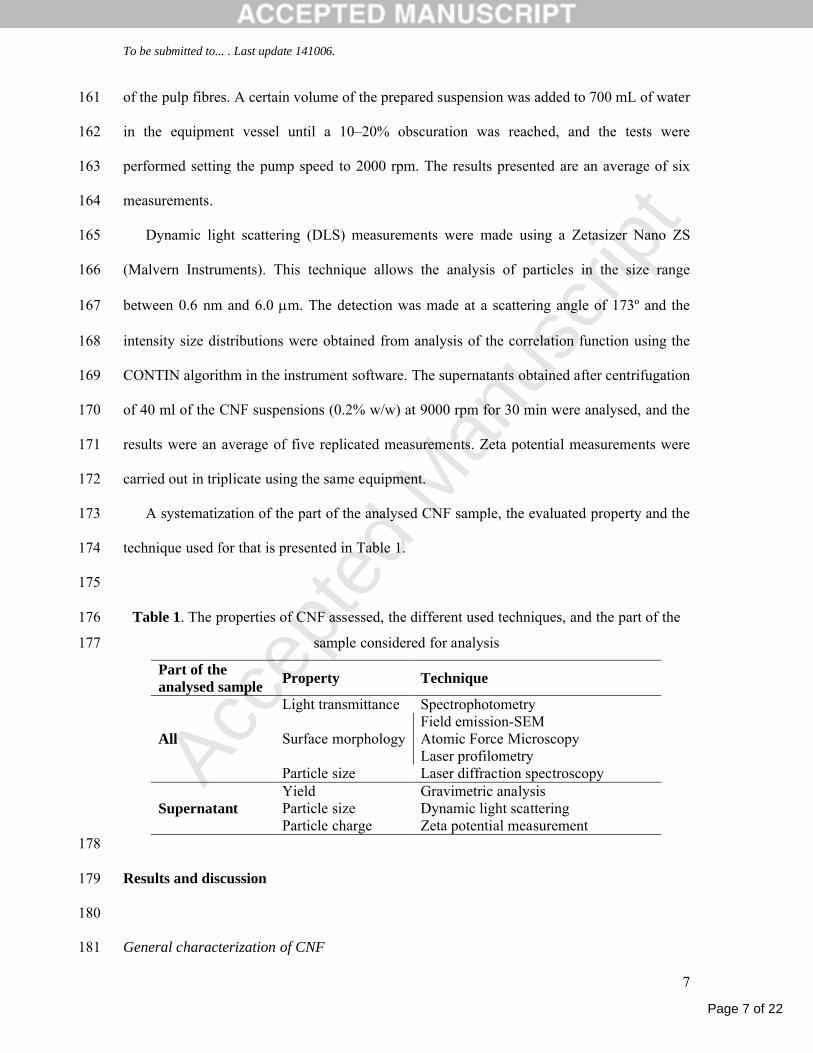
A systematization of the part of the analysed CNF sample, the evaluated property and the 173
technique used for that is presented in Table 1. 174
175
Table 1. The properties of CNF assessed, the different used techniques, and the part of the 176
sample considered for analysis177
Part of the analysed sample
Property Technique
Light transmittance SpectrophotometryField emission-SEMAtomic Force Microscopy Surface morphologyLaser profilometry
All
Particle size Laser diffraction spectroscopy Yield Gravimetric analysisParticle size Dynamic light scattering SupernatantParticle charge Zeta potential measurement
178
Results and discussion179
180
General characterization of CNF181

Page 8 of 22
Accep
ted
Man
uscr
ipt
To be submitted to... . Last update 141006.
8
182
Two samples of cellulose nanofibrils were produced using the same TEMPO-mediated 183
oxidation pre-treatment but different extents of the subsequent mechanical treatment in a 184
homogenizer. Before the evaluation of nanofibrils size and surface properties, the suspensions 185
were characterized for the yield of nanofibrils production, zeta potential and transmittance 186
(Table 2). The zeta potential values of the two samples (-41 and -46 mV, for CNF-5p and 187
CNF-15p, respectively) are both negative and of similar magnitude. The negative values are 188
mostly due to the presence of carboxylates (COO-) at the surface of nanofibrils generated 189
during the oxidative pre-treatment with NaClO/NaBr/TEMPO.190
As expected, the yield of the nanofibrils sample obtained after 15 passes (95%) was much 191
higher than that obtained after 5 passes (63%), in agreement with the higher intensity of the 192
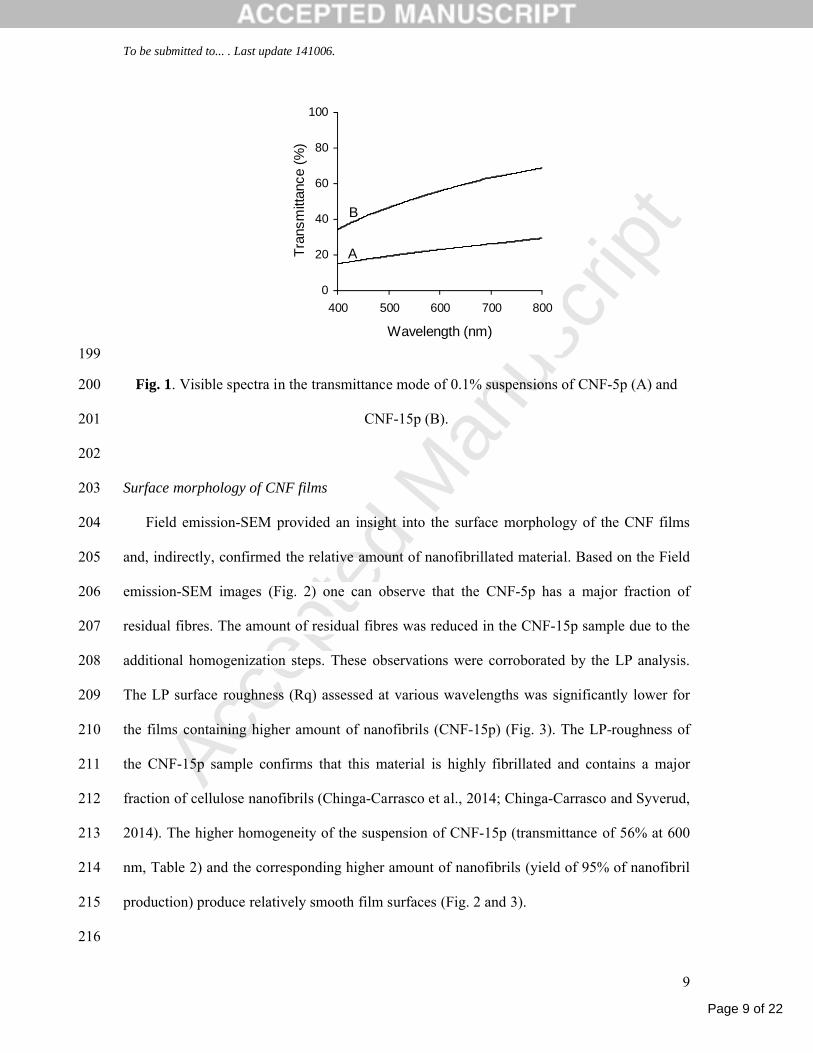
mechanical treatment. The visible spectra in the transmittance mode (Fig. 1) also evidenced 193
higher transmittance for CNF-15p, corresponding to a clearer suspension and corroborating 194
the higher amount of nanosized material in this dispersion. 195
196
Table 2. Results on the production of cellulose nanofibrils by TEMPO-mediated197
oxidation198
Sample Yield (%)Zeta Potential
(mV)Transmittance(600 nm, %)
CNF-5p 63±3 -41±4 23CNF-15p 95±1 -46±3 56
Page 9 of 22
Accep
ted
Man
uscr
ipt
To be submitted to... . Last update 141006.
9
0
20
40
60
80
100
400 500 600 700 800
Wavelength (nm)
Tra
nsm
ittan
ce (
%)
A
B
199
Fig. 1. Visible spectra in the transmittance mode of 0.1% suspensions of CNF-5p (A) and 200
CNF-15p (B). 201
202
Surface morphology of CNF films 203
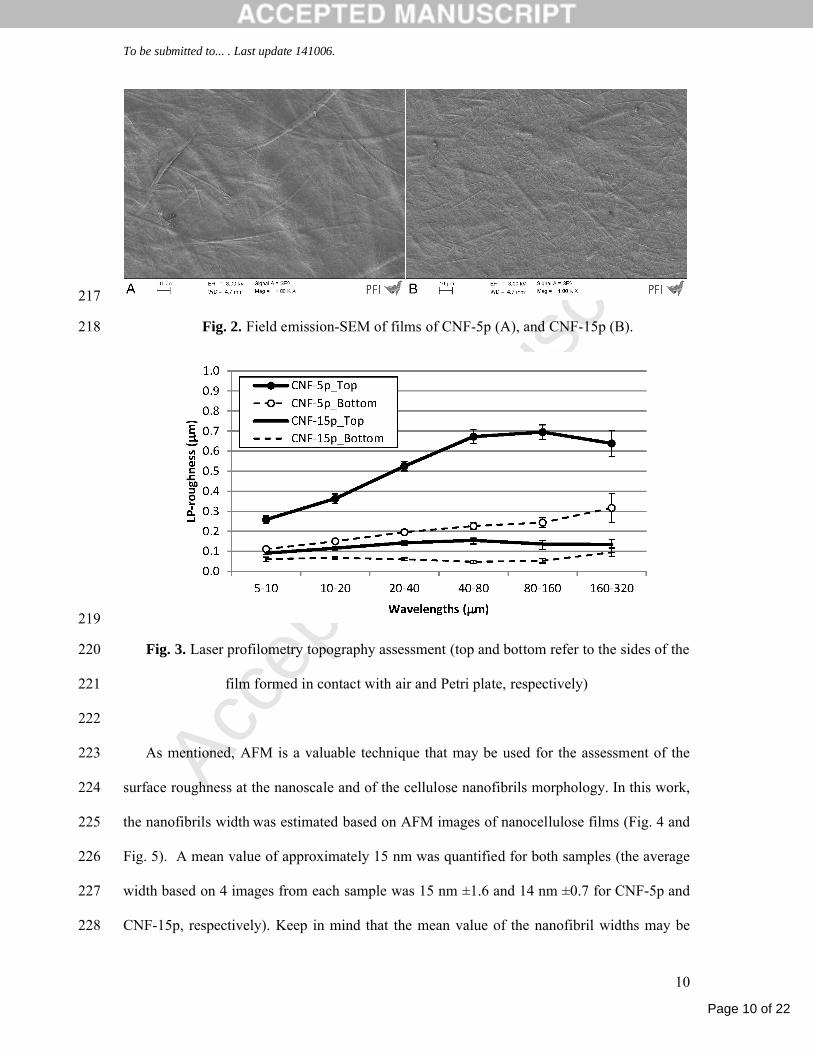
Field emission-SEM provided an insight into the surface morphology of the CNF films 204
and, indirectly, confirmed the relative amount of nanofibrillated material. Based on the Field 205
emission-SEM images (Fig. 2) one can observe that the CNF-5p has a major fraction of 206
residual fibres. The amount of residual fibres was reduced in the CNF-15p sample due to the 207
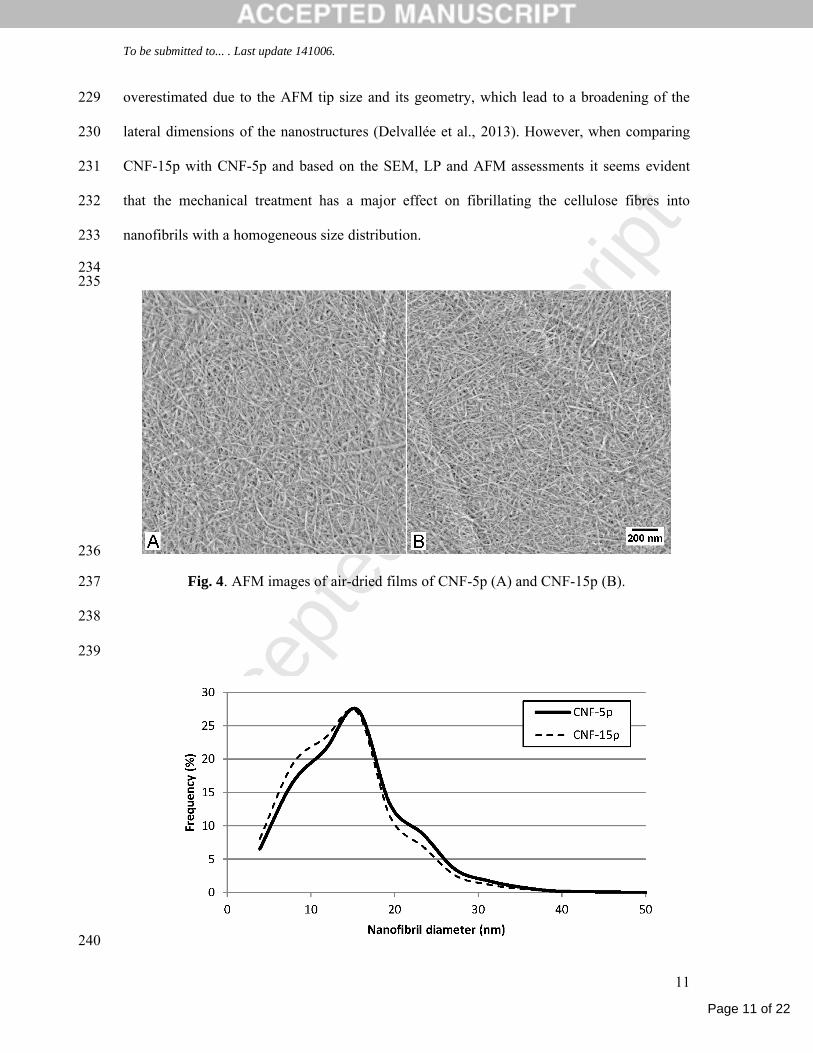
additional homogenization steps. These observations were corroborated by the LP analysis.208
The LP surface roughness (Rq) assessed at various wavelengths was significantly lower for 209
the films containing higher amount of nanofibrils (CNF-15p) (Fig. 3). The LP-roughness of 210
the CNF-15p sample confirms that this material is highly fibrillated and contains a major 211
fraction of cellulose nanofibrils (Chinga-Carrasco et al., 2014; Chinga-Carrasco and Syverud, 212
2014). The higher homogeneity of the suspension of CNF-15p (transmittance of 56% at 600 213
nm, Table 2) and the corresponding higher amount of nanofibrils (yield of 95% of nanofibril214
production) produce relatively smooth film surfaces (Fig. 2 and 3).215
216
Page 10 of 22
Accep
ted
Man
uscr
ipt
To be submitted to... . Last update 141006.
10
217
Fig. 2. Field emission-SEM of films of CNF-5p (A), and CNF-15p (B).218
219
Fig. 3. Laser profilometry topography assessment (top and bottom refer to the sides of the 220
film formed in contact with air and Petri plate, respectively)221
222
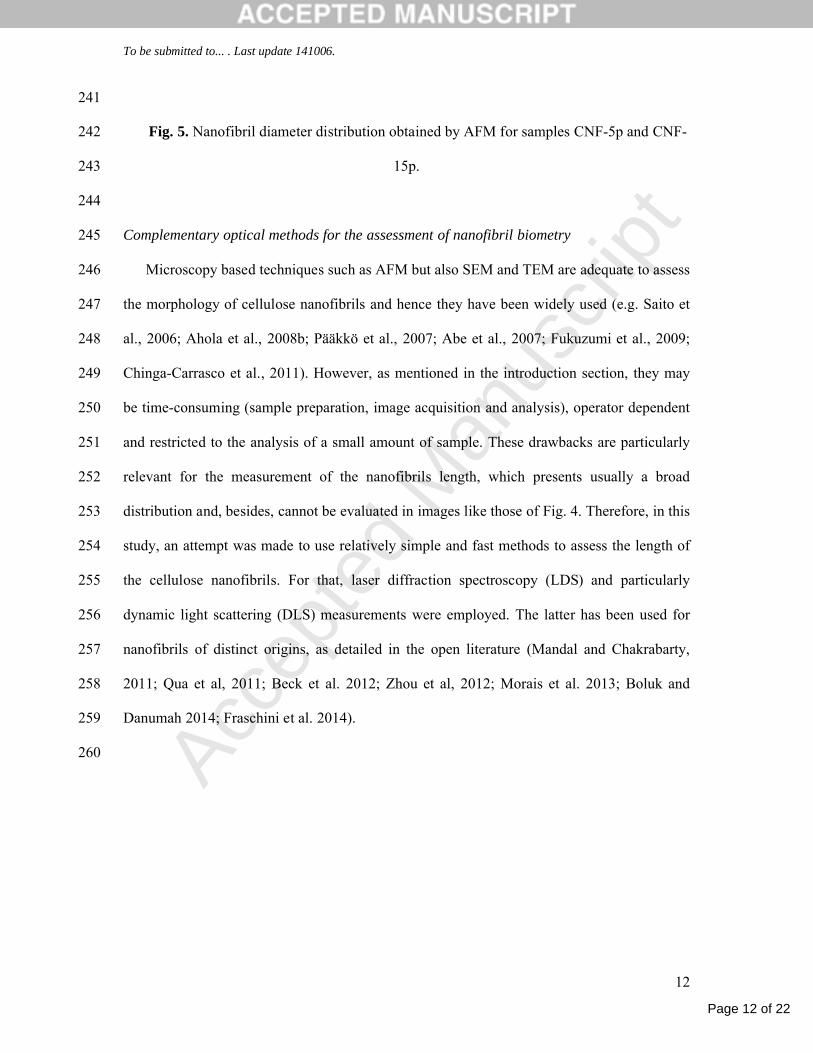
As mentioned, AFM is a valuable technique that may be used for the assessment of the 223
surface roughness at the nanoscale and of the cellulose nanofibrils morphology. In this work, 224
the nanofibrils width was estimated based on AFM images of nanocellulose films (Fig. 4 and 225
Fig. 5). A mean value of approximately 15 nm was quantified for both samples (the average 226
width based on 4 images from each sample was 15 nm ±1.6 and 14 nm ±0.7 for CNF-5p and 227
CNF-15p, respectively). Keep in mind that the mean value of the nanofibril widths may be 228
Page 11 of 22
Accep
ted
Man
uscr
ipt
To be submitted to... . Last update 141006.
11
overestimated due to the AFM tip size and its geometry, which lead to a broadening of the 229
lateral dimensions of the nanostructures (Delvallée et al., 2013). However, when comparing 230
CNF-15p with CNF-5p and based on the SEM, LP and AFM assessments it seems evident 231
that the mechanical treatment has a major effect on fibrillating the cellulose fibres into 232
nanofibrils with a homogeneous size distribution.233
234235
236
Fig. 4. AFM images of air-dried films of CNF-5p (A) and CNF-15p (B).237
238
239
240
Page 12 of 22
Accep
ted
Man
uscr
ipt
To be submitted to... . Last update 141006.
12
241
Fig. 5. Nanofibril diameter distribution obtained by AFM for samples CNF-5p and CNF-242
15p.243
244
Complementary optical methods for the assessment of nanofibril biometry245
Microscopy based techniques such as AFM but also SEM and TEM are adequate to assess 246
the morphology of cellulose nanofibrils and hence they have been widely used (e.g. Saito et 247
al., 2006; Ahola et al., 2008b; Pääkkö et al., 2007; Abe et al., 2007; Fukuzumi et al., 2009; 248
Chinga-Carrasco et al., 2011). However, as mentioned in the introduction section, they may 249
be time-consuming (sample preparation, image acquisition and analysis), operator dependent250
and restricted to the analysis of a small amount of sample. These drawbacks are particularly 251
relevant for the measurement of the nanofibrils length, which presents usually a broad 252
distribution and, besides, cannot be evaluated in images like those of Fig. 4. Therefore, in this 253
study, an attempt was made to use relatively simple and fast methods to assess the length of 254
the cellulose nanofibrils. For that, laser diffraction spectroscopy (LDS) and particularly255
dynamic light scattering (DLS) measurements were employed. The latter has been used for 256
nanofibrils of distinct origins, as detailed in the open literature (Mandal and Chakrabarty, 257
2011; Qua et al, 2011; Beck et al. 2012; Zhou et al, 2012; Morais et al. 2013; Boluk and 258
Danumah 2014; Fraschini et al. 2014).259
260
Page 13 of 22
Accep
ted
Man
uscr
ipt
To be submitted to... . Last update 141006.
13
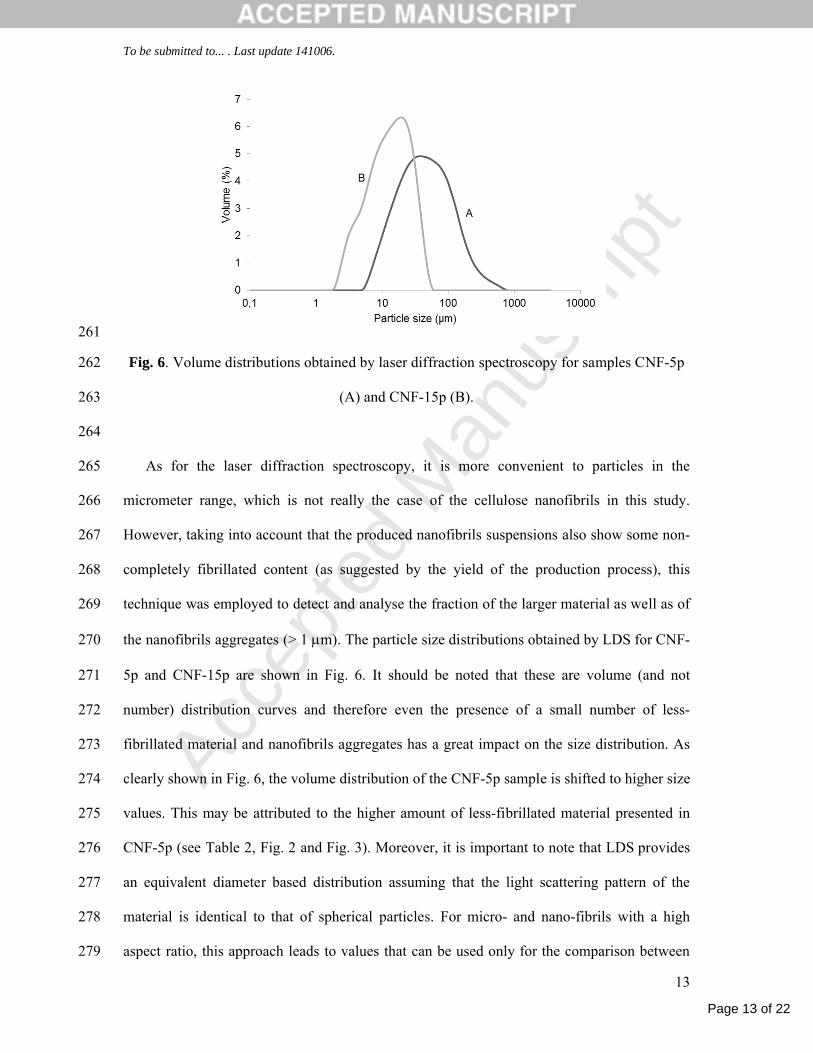
261
Fig. 6. Volume distributions obtained by laser diffraction spectroscopy for samples CNF-5p262
(A) and CNF-15p (B).263
264
As for the laser diffraction spectroscopy, it is more convenient to particles in the 265
micrometer range, which is not really the case of the cellulose nanofibrils in this study. 266
However, taking into account that the produced nanofibrils suspensions also show some non-267
completely fibrillated content (as suggested by the yield of the production process), this 268
technique was employed to detect and analyse the fraction of the larger material as well as of 269
the nanofibrils aggregates (> 1 m). The particle size distributions obtained by LDS for CNF-270
5p and CNF-15p are shown in Fig. 6. It should be noted that these are volume (and not 271
number) distribution curves and therefore even the presence of a small number of less-272
fibrillated material and nanofibrils aggregates has a great impact on the size distribution. As 273
clearly shown in Fig. 6, the volume distribution of the CNF-5p sample is shifted to higher size 274
values. This may be attributed to the higher amount of less-fibrillated material presented in 275
CNF-5p (see Table 2, Fig. 2 and Fig. 3). Moreover, it is important to note that LDS provides 276
an equivalent diameter based distribution assuming that the light scattering pattern of the 277
material is identical to that of spherical particles. For micro- and nano-fibrils with a high 278
aspect ratio, this approach leads to values that can be used only for the comparison between 279

Page 14 of 22
Accep
ted
Man
uscr
ipt
To be submitted to... . Last update 141006.
14
samples and not as a direct measure of the real size of the material. With this in mind, the size 280
reduction from CNF-5p to CNF-15p (Fig. 6) is obvious, when these samples are analysed as a 281
whole (i.e., without any further step of fraction selection such as centrifugation). 282
Considering the existence of nanofibrillated material, dynamic light scattering was used 283
since it is more appropriate than LDS to assess particle sizes in the nanoscale range. To get 284
more information on the produced nanofibrils size, suspensions of CNF-5p and CNF-15p285
were centrifuged (in the same way as that used to determine the nanofibril yield) and only the 286
supernatants were analysed. The size distributions of the supernatants are depicted in Fig. 7.287
288
Fig. 7. Intensity distributions obtained by dynamic light scattering for supernatants obtained 289
after centrifugation of CNF-5p (A) and CNF-15p (B). 290
291
While sample CNF-15p presents an unimodal distribution with a mode at ca. 55 nm, the 292
sample CNF-5p presents a broad range of sizes from about 5 nm to 1000 nm and some objects293
around 5000 nm. The DLS distribution of CNF-15p is more in agreement to what is expected 294
for a highly nanofibrillated material (Mandal and Chakrabarty, 2011; Zhou et al, 2012; 295
Fraschini et al. 2014). From these results, it is evident that the supernatant of sample CNF-15p296
presents a greater uniformity in size distribution comprising only nanofibrils. The supernatant 297

Page 15 of 22
Accep
ted
Man
uscr
ipt
To be submitted to... . Last update 141006.
15
of CNF-5p, on the other hand, still denotes some residual fibres (or nanofibrils aggregates) of 298
higher dimension, in spite of the preliminary centrifugation process. 299
Due to the lack of homogeneity and broad size range observed for CNF-5p, it is not 300
possible to relate the corresponding results obtained by DLS and AFM, contrary to the case of 301
the CNF-15p sample. For the latter, that shows a simple size distribution, several attempts302
were made to obtain the length (L) of the nanofibrils by combining the DLS and AFM data, 303
i.e, by considering the hydrodynamic diameter (mode) of 56 nm measured on the supernatant 304
by DLS (DDLS) and the average width of 14 nm measured on the films by AFM (WAFM). In a 305
first approach, the Tirado and Garcıa de la Torre formula for the ratio DHC/DHS, given by Eq.306
1, was considered (Tirado and García de la Torre, 1980; Fraschini et al., 2014). Here, DHC and 307
DHS are the hydrodynamic diameters, respectively, of a cylinder and a sphere, having the 308
same volume; the term is defined in Eq. 2. Taking DHC = DDLS, W = WAFM and DHS = 309
(3/2W2L)1/3, an average nanofibril length (L) of 150 nm was obtained by solving the Eq. 1.310
However, to apply the formula described by Eq. 1, the aspect ratio of the cylinder should be 311
between 2 and 20 which may not be the present case (Lavoine et al. 2012). Thus, the 312
calculation of the length was also done using a formula developed for a wider range of aspect 313
ratios (up to 100) (Hansen, 2004). The result obtained was the same (L=150 nm). 314
315
W
LWL
D
D
ln
32 3
23
1
HS
HC Eq (1)316
2
100.0565.0312.0
L
W
L
W Eq (2)317
In a second approach, a very simple calculation was carried out considering the mode of 318
the intensity distribution obtained by DLS as an equivalent spherical diameter and using it to 319
Page 16 of 22
Accep
ted
Man
uscr
ipt
To be submitted to... . Last update 141006.
16
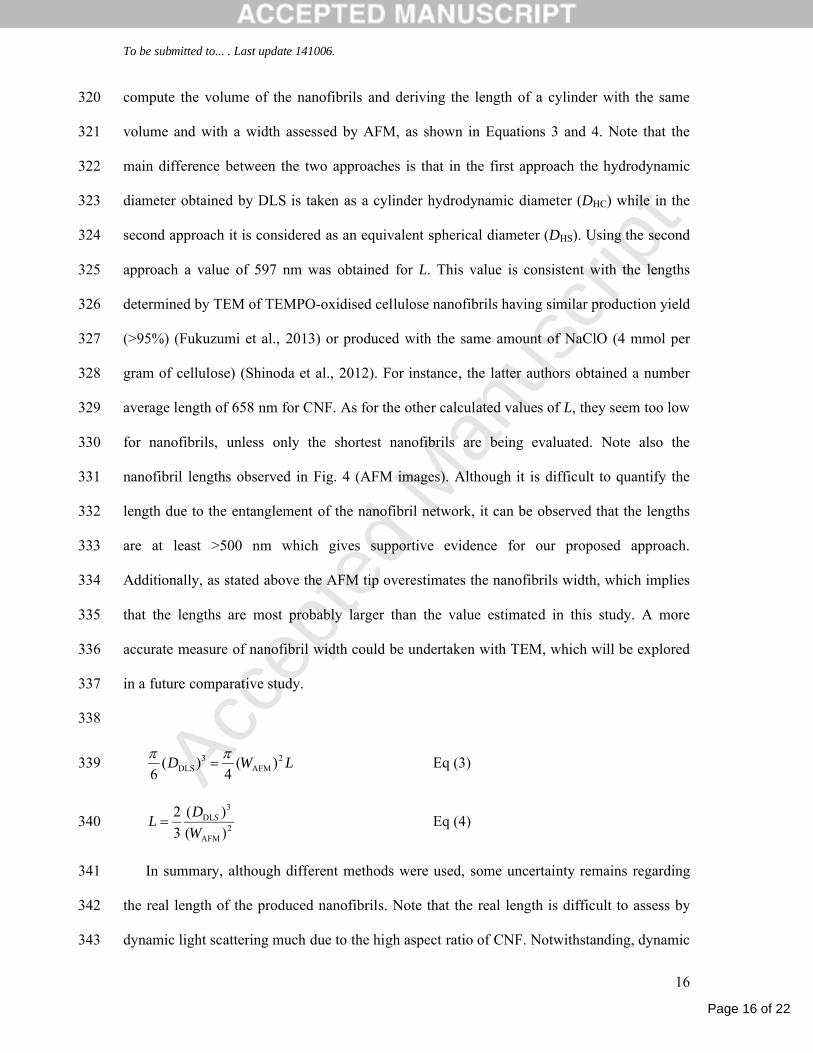
compute the volume of the nanofibrils and deriving the length of a cylinder with the same 320
volume and with a width assessed by AFM, as shown in Equations 3 and 4. Note that the 321
main difference between the two approaches is that in the first approach the hydrodynamic 322
diameter obtained by DLS is taken as a cylinder hydrodynamic diameter (DHC) while in the 323
second approach it is considered as an equivalent spherical diameter (DHS). Using the second324
approach a value of 597 nm was obtained for L. This value is consistent with the lengths 325
determined by TEM of TEMPO-oxidised cellulose nanofibrils having similar production yield 326
(>95%) (Fukuzumi et al., 2013) or produced with the same amount of NaClO (4 mmol per 327
gram of cellulose) (Shinoda et al., 2012). For instance, the latter authors obtained a number 328
average length of 658 nm for CNF. As for the other calculated values of L, they seem too low 329
for nanofibrils, unless only the shortest nanofibrils are being evaluated. Note also the 330
nanofibril lengths observed in Fig. 4 (AFM images). Although it is difficult to quantify the 331
length due to the entanglement of the nanofibril network, it can be observed that the lengths 332
are at least >500 nm which gives supportive evidence for our proposed approach.333
Additionally, as stated above the AFM tip overestimates the nanofibrils width, which implies 334
that the lengths are most probably larger than the value estimated in this study. A more 335
accurate measure of nanofibril width could be undertaken with TEM, which will be explored 336
in a future comparative study.337
338
LWD 2AFM
3DLS )(
4)(
6
Eq (3) 339
2AFM
3DL
)(
)(
3
2
W
DL S Eq (4)340
In summary, although different methods were used, some uncertainty remains regarding 341
the real length of the produced nanofibrils. Note that the real length is difficult to assess by 342
dynamic light scattering much due to the high aspect ratio of CNF. Notwithstanding, dynamic 343

Page 17 of 22
Accep
ted
Man
uscr
ipt
To be submitted to... . Last update 141006.
17
light scattering of the supernatants of nanofibrils suspensions can be considered as a valuable 344
tool to compare the nanofibrils size in terms of relative size trends among a series of 345
preparations. In the case of high yields of produced nanofibrils, the values measured may 346
provide an approximate estimate of nanofibril lengths. 347
348
349
Conclusions350
Several methods were applied for the analysis and differentiation of CNF obtained by 351
NaClO/NaBr/TEMPO pre-oxidation and mechanical treatment with 5 and 15 passes in a 352
homogenizer, namely CNF-5p and CNF-15p. CNF-15p when compared to CNF-5p showed 353
higher nanofibrils yield and correspondingly higher transmittance in the visible range, while 354
zeta potential was similar due to the same applied chemical oxidation pre-treatment. The 355
width of produced nanofibrils, as assessed by AFM on air-dried films was also similar. On the 356
other hand, surface roughness of the air-dried CNF films increased for the less nanofibrillated 357
cellulose. 358
Techniques different from the conventional microscopic ones to assess nanofibrils size359
were attempted. Laser diffraction spectroscopy, which is more appropriate to evaluate 360
particles in the micrometer range, showed that the CNF suspension with lower fibrillated 361
content had a volume distribution shifted to higher size value. From the size distributions 362
measured by dynamic light scattering of the supernatants obtained from centrifugation of 363
CNF it was evident that the supernatant of sample CNF-15p presents a greater uniformity in 364
size distribution and only shows nanofibrils.365
Using the cellulose nanofibrils width measured on the air-dried CNF films by AFM and 366
the hydrodynamic diameter measured on the supernatant by DLS, it was possible to estimate 367
Page 18 of 22
Accep
ted
Man
uscr
ipt
To be submitted to... . Last update 141006.
18
the nanofibrils length for CNF-15p. Combining microscopy and light scattering data, the 368
average length was thus calculated to be of ca. 600 nm. 369
370
Acknowledgments371
The authors acknowledge QREN (Quadro de Referência Estratégico Nacional) for financial 372
support (QREN 34169 NMC). Part of this work has been supported by the Research Council 373
of Norway through the NANO2021 program, grant no. 219733 – NanoHeal: Bio-compatible 374
cellulose nanostructures for advanced wound healing applications.375
376
References377
Abe, K., Iwamoto, S., Yano, H., 2007. Obtaining cellulose nanofibers with a uniform width of 378
15 nm from wood. Biomacromolecules 8, 3276-3278.379
Ahola, S., Österberg, M., Laine, J., 2008a. Cellulose nanofibrils – adsorption with 380
poly(amideamine) epichlorohydrin studied by QCM-D and application as a paper strength 381
additive. Cellulose 15, 303–314.382
Ahola, S., Salmi, J., Johansson, L.-S., Laine, J., Österberg, M., 2008b. Model films from 383
native cellulose nanofibrils. Preparation, swelling, and surface interactions. 384
Biomacromolecules 9, 1273-1282.385
Alila, S., Besbes, I., Rei Vilar, M., Mutjé, P., Boufi, S., 2013. Non-woody plants as raw 386
materials for production of microfibrillated cellulose (MFC): A comparative study. Industrial 387
Crops and Products 41, 250-259.388
Aulin, C., Gällstedt, M., Lindström, T., 2010. Oxygen and oil barrier properties of 389
microfibrillated cellulose films and coatings. Cellulose 17, 559–574.390
Beck, S., Bouchard, J., Berry, R., 2012. Dispersibility in water of dried nanocrystalline 391
cellulose. Biomacromolecules 13, 1486-1494. 392

Page 19 of 22
Accep
ted
Man
uscr
ipt
To be submitted to... . Last update 141006.
19
Boluk, Y., Danumah, C., 2014. Analysis of cellulose nanocrystal rod lengths by dynamic light 393
scattering and electron microscopy. J. Nanopart. Res. 16, 2174.394
Brodin, F.W., Gregersen, O.W., Syverud, K., 2014. Cellulose nanofibrils: Challenges and 395
possibilities as a paper additive or coating material – a review. Nord. Pulp Paper Res. J. 29, 396
156-166.397
Chinga-Carrasco, G., Yu, Y., Diserud, O., 2011. Quantitative electron microscopy of 398
cellulose nanofibril structures from Eucalyptus and Pinus radiata kraft pulp fibres.399
Microscopy and microanalysis 17, 563-571.400
Chinga-Carrasco, G., Tobjörk, D., Österbacka, R., 2012. Inkjet-printed silver-nanoparticles on 401
nano-engineered cellulose films for electrically conducting structures and organic transistors –402
concept and challenges. J. Nanopart. Res. 14, 1213.403
Chinga-Carrasco, G., Averianova, N., Kondalenko, O., Garaeva, M., Petrov, V., Leinsvang, 404
B., Karlsen, T., 2014. The effect of residual fibres on the micro-topography of cellulose 405
nanopaper. Micron 56, 80-84.406
Chinga-Carrasco, G., Syverud K., 2014. Pretreatment-dependent surface chemistry of wood 407
nanocellulose for pH-sensitive hydrogels. J Biomaterials Applications 29, 423-432.408
Delvallée, A., Feltin, N., Ducourtieux, S., Trabelsi, M., Hochepied, J.-F., 2013. Comparison 409
of nanoparticle diameter measurements by Atomic Force Microscopy and Scanning Electron 410
Microscopy. 16th International Congress of Metrology, 06007. DOI: 411
10.1051/metrology/201306007.412
Fraschini, C., Chauve, G., Le Berre, J-F., Ellis, S., Méthot, M., O’ Connor, B., Bouchard, J., 413
2014. Critical discussion of light scattering and microscopy techniques for CNC particle 414
sizing. Nord. Pulp Paper Res. J. 29, 31-40.415

Page 20 of 22
Accep
ted
Man
uscr
ipt
To be submitted to... . Last update 141006.
20
Fukuzumi, H., Saito, T., Iwata, T., Kumamoto, Y., Isogai, A., 2009. Transparent and high gas 416
barrier films of cellulose nanofibers prepared by TEMPO-mediated oxidation. 417
Biomacromolecules 10, 162-165. 418
Fukuzumi H., Saito T., Isogai A., 2013. Influence of TEMPO-oxidized cellulose nanofibril 419
length on film properties. Carbohydr. Polym. 93, 172-177.420
Gouesbet, G., Grehan, G., 1999. J Opt A-Pure Appl Op. 1, 706. 421
Hansen, S., 2004. Translational friction coefficients for cylinders of arbitrary axial ratios422
estimated by Monte Carlo simulation. J. Chem. Phys. 121, 9111-9115. 423
Kangas, H., Lahtinen, P., Sneck, A., Saariaho, A-M., Laitinen, O., Hellén, E., 2014.424
Characterization of fibrillated celluloses. A short review and evaluation of characteristics with 425
a combination of methods. Nord. Pulp Paper Res. J. 29, 129-143.426
Lavoine, N., Desloges, I., Dufresne, A., Bras, J., 2012. Microfibrillated celulose – its barrier 427
properties and applications in cellulosic materials: a review. Carbohydr. Polym. 90, 735-764.428
Mandal, A., Chakrabarty, D., 2011. Isolation of nanocellulose from waste sugarcane bagasse429
(SCB) and its characterization. Carbohydr. Polym. 86, 1291-1299.430
Morais, J.P.S., Rosa, M.F., Filho, M.M.S., Nascimento, L.D., Nascimento, D.M., Cassales, 431
A.R., 2013. Extraction and characterization of nanocelulose structures from raw cotton linter.432
Carbohydr. Polym. 91, 229-235. 433
Pääkkö, M., Ankerfors, M., Kosonen, H., Nykänen, A., Ahola, S., Österberg, M., 434
Ruokolainen, J., Laine, J., Larsson, P.T., Ikkala, O., Lindström, T., 2007. Enzymatic 435
hydrolysis combined with mechanical shearing and high-pressure homogenization for 436
nanoscale cellulose fibrils and strong gels. Biomacromolecules 8, 1934-1941.437
Qua, E.H., Hornsby, P.R., Sharma, H.S.S., Lyons, G., 2011. Preparation and characterization 438
of cellulose nanofibrils. J. Mater. Sci. 46, 6029-6045. 439
Page 21 of 22
Accep
ted
Man
uscr
ipt
To be submitted to... . Last update 141006.
21
Saito, T., Nishiyama, Y., Putaux, J-L., Vignon, M., Isogai, A., 2006. Homogeneous 440
Suspensions of Individualized Microfibrils from TEMPO-Catalyzed Oxidation of Native 441
Cellulose. Biomacromolecules 7, 1687-1691.442
Saito, T., Kimura, S., Nishiyama, Y., Isogai, A., 2007. Cellulose nanofibrils prepared by 443
TEMPO-mediated oxidation of native cellulose. Biomacromolecules, 8, 2485-2491.444
Shinoda, R., Saito, T., Okita, Y., Isogai A., 2012. Relationship between length and degree of 445
polymerization of TEMPO-oxidized cellulose nanofibrils. Biomacromolecules 13, 842-849. 446
Syverud K., Stenius P., 2009. Strength and barrier properties of MFC films. Cellulose 16, 75-447
85.448
Tirado, M.M., García de la Torre, J., 1979. Translational friction coefficients of rigid, 449
symmetric top macromolecules. Application to circular cylinders. J. Chem. Phys. 71, 2581-450
2587. 451
Turbak, A. F., Snyder, F.W., Sandberg, K.R., 1983. Micro-fibrillated cellulose, a new 452
cellulose product: properties, uses, and commercial potential. J. Appl. Polym. Sci. Appl. 453
Polym. Symp. 37, 815-827. 454
Zhou, Y.M., Fu, S.Y., Zheng, L.M., Zhan, H. Y., 2012. Effect of nanocellulose isolation 455
techniques on the formation of reinforced poly(vinyl alcohol) nanocomposite films.456
eXPRESS Polymer Letters 6, 794-804.457
458

Page 22 of 22
Accep
ted
Man
uscr
ipt
To be submitted to... . Last update 141006.
22
Highlights:458
459
AFM and dynamic light scattering (DLS) were used for the cellulose nanofibril analysis460
Laser diffraction spectroscopy was used to assess the less-fibrillated material461
The length of cellulose nanofibril could be estimated based on AFM and DLS data 462
A value of ca. 600 nm was estimated for the TEMPO-oxidised cellulose nanofibril length463
464465466467


