
2017
Oregon Department of Education Report Card Redesign Survey
OFFICE OF ACCOUNTABILITY, RESEARCH, AND INFORMATION SERVICES

Acknowledgements
Oregon Department of Education
Kia Sorensen, Research Analyst, Accountability, Research, & Information Services
Jon Wiens, Director, Accountability Reporting
Isabella Jacoby, Research Analyst, Accountability Reporting
Josh Rew, Education Program Specialist (Psychometrics/Measurement)
Leah Thorp, Research Analyst, Office of Teaching, Learning, and Assessment
Evan Fuller, Research Analyst, Office of Research and Data Analysis
Wendy Finley, Project Manager, Accountability, Research & Information Services
Jordan Heide, Project Manager, Accountability, Research & Information Services
Meg Boyd, Strategic Communications, Office of the Deputy Superintendent
Tricia Yates, Communications Director
Office of Accountability, Research, & Information Services Oregon Department of Education
Public Service Building 255 Capitol St NE
Salem, OR 97310-0203 Fax: (503) 378-5156
Web site: www.ode.state.or.us

Contents Background ................................................................................................................................................... 1
The Oregon Department of Education School Report Card Redesign Survey .......................................... 1
Key Questions ........................................................................................................................................... 1
Analysis ..................................................................................................................................................... 1
Results: Participation and Demographics ................................................................................................. 1
Key Findings .................................................................................................................................................. 5
Results: Use and Access ............................................................................................................................ 5
Results: Information Preferences ............................................................................................................. 6
Opportunities to Learn .......................................................................................................................... 6
Well-Rounded Education .................................................................................................................... 11
Academic Success ............................................................................................................................... 14
College and Career Readiness ............................................................................................................. 18
Results: Design and Clarity ...................................................................................................................... 21
Emergent Themes ............................................................................................................................... 21
Summary and Recommendations ............................................................................................................... 22
Appendix 1. Opportunities to Learn ........................................................................................................... 25
Appendix 2. Well-rounded education ......................................................................................................... 27
Appendix 3. Academic Success ................................................................................................................... 31
Appendix 4. College and Career Readiness ................................................................................................. 34

1
Background
The Every Student Succeeds Act (ESSA), signed by President Obama on December 10, 2015, replaces the No
Child Left Behind (NCLB) Act and affords states greater flexibility. ESSA encourages schools and educators to
innovate and create systems that address local needs. As part of this work, the Oregon Department of
Education (ODE) Report Card Redesign project will redesign the School and District report cards to engage
and inform families about their school’s approach to learning, academic and extracurricular offerings, and
student performance. Reports cards also serve as an important tool for continuous improvement planning by
local and state policymakers, in conjunction with the communities they serve.
The Oregon Department of Education School Report Card Redesign Survey
A key component of the new report card is a two-page “At-A-Glance” overview document designed
specifically for parents and community members. To help inform the At-A-Glance report redesign, the
Oregon Department of Education offered a web-based survey available from August 15, 2017 through
October 13, 2017. The opening of the survey was announced through a press release, social media, and
listservs in an effort to reach parents, educators, and other stakeholders.
Key Questions
The survey contained a total of 14 closed-ended and one open-ended question, which asked respondents for
feedback on:
Use and access: how and why did respondents use the report card?
Information preferences: what types of information did respondents want to see on the report card?
Design and Clarity: what type of design was most appealing to respondents?
Analysis
Descriptive analysis was used to summarize the closed-ended survey questions. A team of two research
analysts conducted exploratory pre-coding to develop an initial list of important themes for the open-ended
survey question. After the initial themes were identified, one research analyst went back through the data
and used a combination of focused-coding (looking for further evidence of the initial themes) and open-
coding (to allow new themes to emerge).
Results: Participation and Demographics
A total of 570 persons responded to the Oregon Department of Education School Report Card Redesign
Survey. The data collected through this survey are a nonrandom sample and therefore the results of this
survey only represent the perspectives of those who took the survey.
Of those who responded, 72.8 percent identified as women and 26.6 as men. The vast majority of
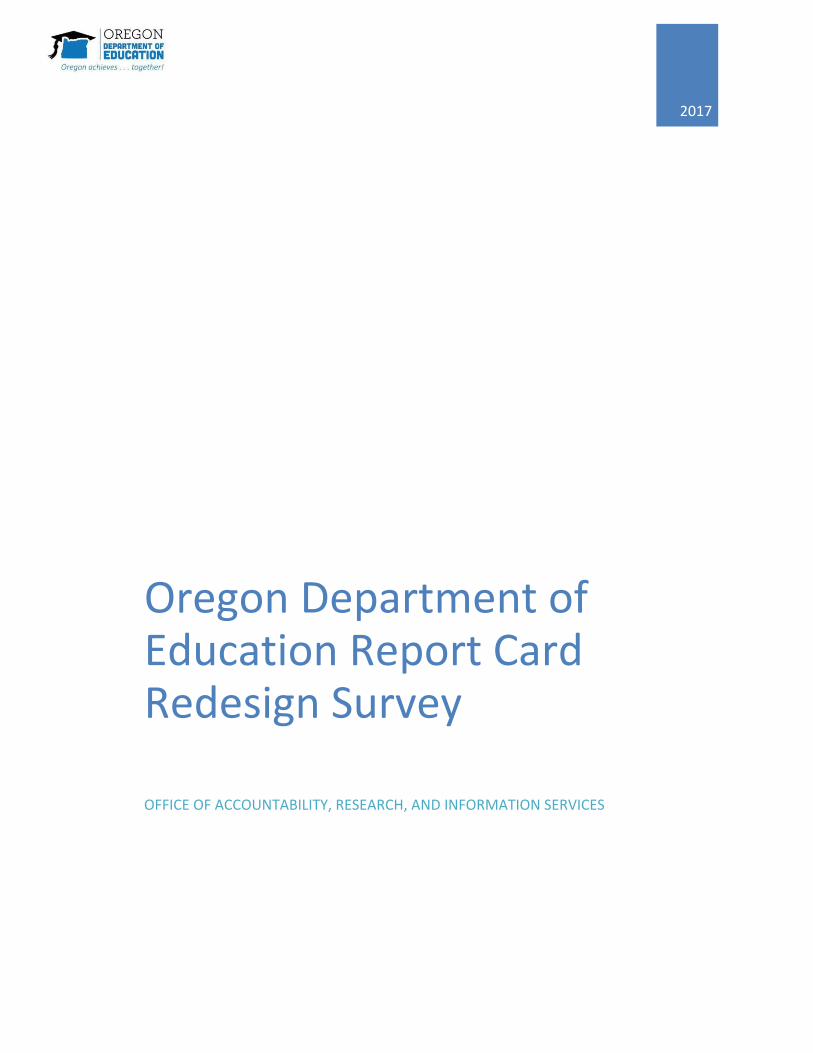
respondents identified their race as white only (84.9 percent, see Figure 1) and 9.1 percent identified their
ethnicity as Hispanic, Latino, or Spanish. Of those who chose “other” responses (n=31) almost half (n=13)
marked Hispanic, Latino, or Spanish as their race.
2
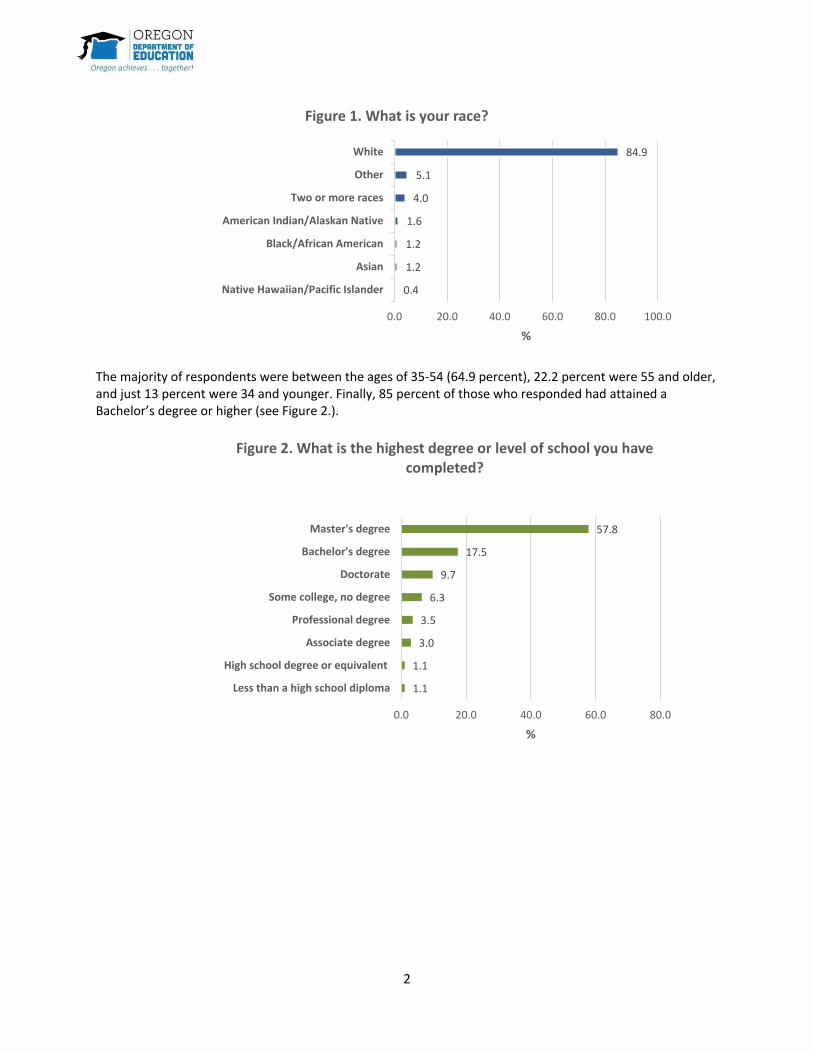
The majority of respondents were between the ages of 35-54 (64.9 percent), 22.2 percent were 55 and older, and just 13 percent were 34 and younger. Finally, 85 percent of those who responded had attained a Bachelor’s degree or higher (see Figure 2.).
0.4
1.2
1.2
1.6
4.0
5.1
84.9
0.0 20.0 40.0 60.0 80.0 100.0
Native Hawaiian/Pacific Islander
Asian
Black/African American
American Indian/Alaskan Native
Two or more races
Other
White
%
Figure 1. What is your race?
1.1
1.1
3.0
3.5
6.3
9.7
17.5
57.8
0.0 20.0 40.0 60.0 80.0
Less than a high school diploma
High school degree or equivalent
Associate degree
Professional degree
Some college, no degree
Doctorate
Bachelor's degree
Master's degree
%
Figure 2. What is the highest degree or level of school you have completed?

3
Respondents were asked to indicate whether or not they were a parent, if they would be answering the
survey as a parent, answering the survey as a professional, or answering the survey as a student. While
just over 78 percent of respondents said they had a child, only 26.8 percent said they were answering
the survey as a parent (see Figure 3. and Figure 4.).
Not yet in kindergarten, 5%
Middle school student, 9%
Elementary school student, 16%
High school student, 16%
Not a parent, 22%
Beyond grade 12, 32%
Figure 3. Percent of Respondents with Children by Child Age Range
0.2
0.7
0.9
0.9
1.6
2.1
3.9
7.2
26.1
26.7
26.8
0.0 5.0 10.0 15.0 20.0 25.0 30.0
Real Estate Agent
Business Professional
Researcher
Student
School Board Member
Non-profit Advocate
Other
Community Member
Educator
School or District Administrator
Parent
%
Figure 4. Will you be answering the questions about the redesign of the Oregon School Report Card as a...?

4
Geographic Spread Figure 5. Counts of Respondents by County
While the majority of respondents to the survey were from counties nearest to the I-5 corridor, most of
counties (88.9 percent) had at least one respondent to the survey. The map in Figure 5 shows the
number of respondents from each county and each color represents a range. For example, 102
respondents were from Multnomah county—the second darkest shade of blue—which represents 100-
119 respondents. Counties with no boundaries means that there were zero respondents (i.e., Sherman,
Wheeler, Grant, and Gilliam).
0.0
5.0
10.0
15.0
20.0
Mo
rro
w
Har
ney
Wal
low
a
Was
co
Jeff
ers
on
Ho
od
Riv
er
Un
ion
Tilla
mo
ok
Lake
Co
os
Bak
er
Lin
coln
Kla
mat
h
Cu
rry
Cro
ok
Syst
em
Co
lum
bia
Jose
ph
ine
Cla
tso
p
Um
atill
a
Jack
son
Do
ugl
as
Mal
he
ur
Yam
hill
Des
chu
tes
Lin
n
Po
lk
Be
nto
n
Lan
e
Was
hin
gto
n
Cla
ckam
as
Mar
ion
Mu
ltn
om
ah
%
Figure 6. What County Are Your From?

5
Key Findings Results: Use and Access Respondents were asked how often they
viewed the Oregon School Report Card. The
majority of respondents (57 percent) indicated
that they frequently view the Oregon School
Report Card. In fact, only 7.2 percent said they
had never viewed the report card. Of those who
had never seen it, half said they were parents
(20/40).
The survey also asked respondents why they
viewed the Oregon School Report Card. Possible
answers included: I have never viewed the
report card, I want information about a specific
school, I want information about a specific
district, I want information about the state, I
want to compare two or more schools, I want to
compare two or more districts, I want to look at
changes in school data over time, or other. Out
of those who said they were answering the
survey as a parent, the greatest number (39.9
percent) said they view the report card because
they care about looking at changes in school
data over time (see Figure 8). Those who said
they were not answering the survey as a parent,
were in agreement with parents, except just
over 60 percent (61.4 percent) stated that it
was important to look at changes in school data
over time.
Just 7.4 percent of survey respondents wrote in a response to the question about why they view the report card. While some respondents wrote in simply that they view the report card because they were curious, the most frequent comment was an expression of concern or skepticism over the accuracy of the data, the importance of the data, or concern of how the data represents the schools. For example, one respondent said,
I am also a teacher and feel the data is
very inaccurate based on what I know is
being done in schools, which ultimately
misrepresents each school.
Other comments reflected the fact that many
educators took the survey. Comments from
educators tended to contain specific
information about how they use the report
card. For example,
To see how [the] current school in which
I work is represented in [the] report card
and to be able to speak to parents
about it.
A few respondents said they use the data to
help train teachers, some said they use the data
in grant applications, and a few said they felt
they had to, or were forced to, view the report
card as part of their job.
Other, 3%I have never viewed the
Oregon Report Card,
7%
I have viewed the Oregon
School Report Card once or twice, 32%
I frequently view the Oregon
School Report Card, 57%
Figure 7. How Often Do You View Oregon's School Report Card?

6
Results: Information Preferences
Opportunities to Learn Respondents were asked to rate the importance of different measures of “opportunities to learn” (see
Figure 9 for the complete list of measures) on a scale from one to three where one meant “not
important” and three meant “important”. Since a key focus of the Report Card Redesign project is to
examine the information preferences of parents, differences in responses between those who said they
were answering as a parent, and those who said they were not answering as a parent (hereafter
referred to as nonparents) were examined.
Parent Responses Over half of the parent respondents thought the majority of the “opportunities to learn” measures
(detailed in Figure 9) were important to include on the future school report card. The only measure
parents were either unsure about or did not think was important to include, was information about the
background similarity between students and teachers. The greatest agreement over the importance of
specific indicators (where over 75 percent of parents indicated they wanted to see a measure included)
were the following:
average class size (89.6% parents, 79.1% nonparents)
teacher quality and quantity (81.3 % parents, 63.6% nonparents)
average district spending per student (77.9% parents, 66.8% nonparents)
teacher turnover (76.1% parents, 62.9% nonparents)
3%
6%
6%
5%
3%
4%
61%
7%
9%
12%
8%
7%
10%
7%
40%
7%
0% 10% 20% 30% 40% 50% 60% 70%
Never viewed
Information about a specific school
Information about a specific district
Information about the state
Compare two or more schools
Compare two or more districts
Changes in school data over time
Other
Figure 8. Why do you view the Oregon Report Card?
Parent Nonparent

7
Nonparent Responses Nonparent responses largely mirrored those of parents. Once again, over 50 percent of nonparent
respondents said the “opportunities to learn” measures are important to include on the future Oregon
Report Card (see Figure 9). However, like parent respondents, the one exception is seeing the extent to
which there is a match between student and teacher backgrounds (only 40 percent of nonparents said
this was an important measure to include on the Oregon Report Card). Finally, while both parents and
nonparents agreed that it was important to see chronic absenteeism on the Oregon Report Card,
nonparents overwhelmingly said chronic absenteeism was important to include (85 percent of
nonparents relative to 57 percent of parents). The greatest agreement over the importance of specific
indicators (where over 75 percent of nonparents indicated they wanted to see a measure included)
were the following:
average class size (79.1% nonparents, 89.6% parents)
chronic absenteeism (85.5% nonparents, 57.2% parents)
While nonparents did not have over 75 percent of respondents agreeing that teacher quality and
quantity, average district spending per student, and teacher turnover were important, the majority—
over 60 percent—agreed on the importance of these measures.
A chi-square test of independence was conducted to look for statistically significant differences
between parent and nonparent responses across measures of opportunities to learn (to see all results
refer to Table 3. in Appendix 1). Results reinforced the aforementioned descriptive results: significant
differences in responses between parent and nonparent responses existed over the number of
chronically absent students, quantity and quality of teachers in a school, average classroom size, and
average spending by districts, but overall the majority of respondents thought these measures were
important. The most notable result was a significant difference in parent versus nonparent responses to
principal turnover (see Table 3. in Appendix 1). Because the chi-square test does not provide
information about the magnitude or the direction of the relationship between variables, a relative risk
ratio was calculated: parents were 1.2 times more likely to report that principal turnover was important
to include on a future Oregon Report Card but overall only 68.5 percent of parents and 56.5 percent of
nonparents reported this measure as important to include.
Difference by Racial Identification A key challenge that Oregon continues to face is a persistent achievement and opportunity gap between
our communities of color and the white population of Oregon. To address this challenge, the Oregon
Department of Education has adopted an “Equity Lens” which articulates equity goals, recognizes
systematic barriers, and articulates a need for clear accountability. In recognition of the important goals
and beliefs detailed in the Equity Lens, and to ensure the future Oregon Report Card is relevant for all
Oregonians, differences between nonwhite and white responses were examined1 (see Table 2. In
Appendix 1).
1 Examining differences across ethnicity and across nonwhite racial categories was not possible due to small sample sizes.

8
Nonwhite respondents, like parents and nonparents, had over 50 percent stating that each measure of
“opportunities to learn” were important to include on the future Oregon Report Card (see Figure 10).
The greatest agreement on the importance of measures (over 75 percent of nonwhites said it was
important to include) were over the following:
teacher quality and quantity (79.3% nonwhites, 67.0% whites)
statement from school describing how the school supports diverse populations (75.9% nonwhites, 49.8% whites)
average class size (89.7% nonwhites, 81.4% whites)
average district spending per student (84.2% nonwhites, 67.3% whites) White respondents had a higher level of agreement over the importance of chronic absenteeism (78.2
percent thought it was important) but nonwhite respondents were not far behind with 74.1 percent
stating its importance.
A chi-square test was conducted to examine differences in responses by race (white versus nonwhite)
(see Table 2. In Appendix 1). There were significant differences by race for the following measures:
number of students taught by teachers with similar backgrounds, X2 (2, N=495)=9.82, p< .01
statement from your school describing how your school supports the success of diverse
populations, X2 (2, N=498)=14.00, p< .001
average per student spending by district, X2 (2, N=497)=6.81, p< .05
The nonwhite respondents were 1.55 times more likely to say that background similarity between
teachers and students was important, 1.52 times more likely to say that a statement from the school on
how the school supports diverse populations was important, and 1.25 times more likely to say that
average per student spending by district was important.
Written Responses Approximately 10.7 percent of those who took the survey wrote a response in the “other” category in
the opportunities to learn section. The most frequent comment was a general concern with how teacher
quality would be defined and calculated. Many expressed skepticisms that an adequate measure would
be used.
For example, one teacher said:
How could you possibly imply the “quality” of a teacher? I am a parent and a teacher and I am
leery of how you think you could communicate teacher quality.
Many people wrote that they wanted specific information about after school programs and about
specific course offerings. For example, a parent said:
I want to see what a school offers such as how much recess do students receive, do they teach
foreign language, how much art and music do they offer, how much P.E. instruction do they get,

9
do they offer extracurricular activities? I want it to be more about what a school offers instead of
how a student achieves.
Finally, a few people said they wanted to see early childhood data, as well as teacher absenteeism.

10
No
nw
hit
e
Wh
ite
No
nw
hit
e
Wh
ite
No
nw
hit
e
Wh
ite
No
nw
hit
e
Wh
ite
No
nw
hit
e
Wh
ite
No
nw
hit
e
Wh
ite
No
nw
hit
e
Wh
ite
No
nw
hit
e
Wh
ite
No
nw
hit
e
Wh
ite
No
nw
hit
e
Wh
ite
0%
20%
40%
60%
80%
100%
Bac
kgro
un
d s
imila
rity
of
stu
den
ts a
nd
tea
cher
s
Sch
oo
l po
licie
s in
su
pp
ort
of
div
erse
po
pu
lati
on
s
Nu
mb
er o
f in
stru
ctio
nal
day
s
Ch
ron
ic A
bse
nte
eism
Susp
ensi
on
or
exp
uls
ion
s
Pri
nci
pal
tu
rno
ver
Teac
her
tu
rno
ver
Ave
rage
dis
tric
t p
er
stu
den
t sp
end
ing
Teac
her
qu
alit
y an
dq
uan
tity
Ave
rage
cla
ss s
ize
Figure 10. Opportunities to Learn Components by Respondent Type Not Important Neutral/Not Sure Important
Par
ents
No
nP
aren
ts
Par
ents
No
nP
aren
ts
Par
ents
No
nP
aren
ts
Par
ents
No
nP
aren
ts
Par
ents
No
nP
aren
ts
Par
ents
No
nP
aren
ts
Par
ents
No
nP
aren
ts
Par
ents
No
nP
aren
ts
Par
ents
No
nP
aren
ts
Par
ents
No
nP
aren
ts
0%
20%
40%
60%
80%
100%
Bac
kgro
un
d s
imila
rity
of
stu
den
ts a
nd
teac
her
s
Sch
oo
l po
licie
s in
sup
po
rt o
f d
iver
sep
op
ula
tio
ns
Nu
mb
er o
fin
stru
ctio
nal
day
s
Ch
ron
ic A
bse
nte
eism
Susp
ensi
on
or
exp
uls
ion
s
Pri
nci
pal
tu
rno
ver
Teac
her
tu
rno
ver
Ave
rage
dis
tric
t p
er
stu
den
t sp
end
ing
Teac
her
qu
alit
y an
dq
uan
tity
Ave
rage
cla
ss s
ize
Figure 9. Opportunities to Learn Components by Respondent TypeNot Important Neutral/Not Sure Important

11
Well-Rounded Education Respondents were asked to rate the importance of different measures of well-rounded education (see
Figure 11. for the complete list of measures) on a scale from one to three where one meant “not
important” and three meant “important”.
Parent Responses Across all of those who responded as parents, over 50 percent across all measures said each measure
was important to include on the future Oregon Report Card. The measures that were important to the
greatest percent of parents (where over 75 percent of parents said to include a given measure) to
include were:
information about science, technology, engineering, and math (STEM) opportunities (86.3%
parents, 71.0% nonparents)
information about the curriculum and instruction offered in a school (87.0% parents, 72.3%
nonparents).
Nonparent Responses Like parents, the greatest percent of nonparents thought STEM opportunities and curriculum and
instruction offerings were important (71 percent, and 72 percent) and the same proportion of both
parent and nonparents said it was important to know information about the career and technical
education (CTE) opportunities offered in a school (74 percent of both groups indicated that it is
important to know about).
A chi-square test of independence was conducted to look for statistically significant differences between
parent and nonparent responses across measures of well-rounded education (to see all results refer to
Table 3. in Appendix 2) and risk ratios were calculated. Similar to the opportunities to learn measures,
results reinforced the aforementioned descriptive results: significant differences in responses between
parent and nonparents existed over information on curriculum and instruction and access to STEM
opportunities where parents were just over 1.2 times more likely to note the importance of these
measures. Significant differences also existed over information on mental and physical health policies,
and information on parent involvement opportunities where parents were between 1.2 and 1.6 times
more likely to list the measures as important. Conversely, nonparents were more likely to say
characteristics of students were important on the Oregon Report Card.

12
Par
ent
No
np
aren
t
Par
ent
No
np
aren
t
Par
ent
No
np
aren
t
Par
ent
No
np
aren
t
Par
ent
No
np
aren
t
Par
ent
No
np
aren
t
Par
ent
No
np
aren
t
Par
ent
No
np
aren
t
0%
20%
40%
60%
80%
100%
Stu
de
nt
char
acte
rist
ics
Stu
de
nt
safe
ty p
olic
ies
Par
ent
or
com
mu
nit
yin
volv
emen
t
Men
tal h
ealt
h p
olic
ies
or
sup
po
rts
Ph
ysic
al h
ealt
hp
olic
ies
Car
eer
and
tec
hn
ical
edu
cati
on
Cu
rric
ulu
m a
nd
inst
ruct
ion
Scie
nce
, tec
hn
olo
gy,
engi
nee
rin
g an
d m
ath
(STE
M)
Figure 11. Well-rounded Education Components by Respondent TypeNot Important Neutral/Not Sure Important
No
nw
hit
e
Wh
ite
No
nw
hit
e
Wh
ite
No
nw
hit
e
Wh
ite
No
nw
hit
e
Wh
ite
No
nw
hit
e
Wh
ite
No
nw
hit
e
Wh
ite
No
nw
hit
e
Wh
ite
No
nw
hit
e
Wh
ite
0%
20%
40%
60%
80%
100%
Stu
de
nt
char
acte
rist
ics
Stu
de
nt
safe
typ
olic
ies
Par
ent
or
com
mu
nit
yin
volv
emen
t
Men
tal h
ealt
hp
olic
ies
or
sup
po
rts
Ph
ysic
al h
ealt
hp
olic
ies
Car
eer
and
tec
hn
ical
edu
cati
on
Cu
rric
ulu
m a
nd
inst
ruct
ion
Scie
nce
, tec
hn
olo
gy,
engi
nee
rin
g an
dm
ath
(ST
EM)
Figure 12. Well-rounded Education Components by Respondent TypeNot Important Neutral/Not Sure Important

13
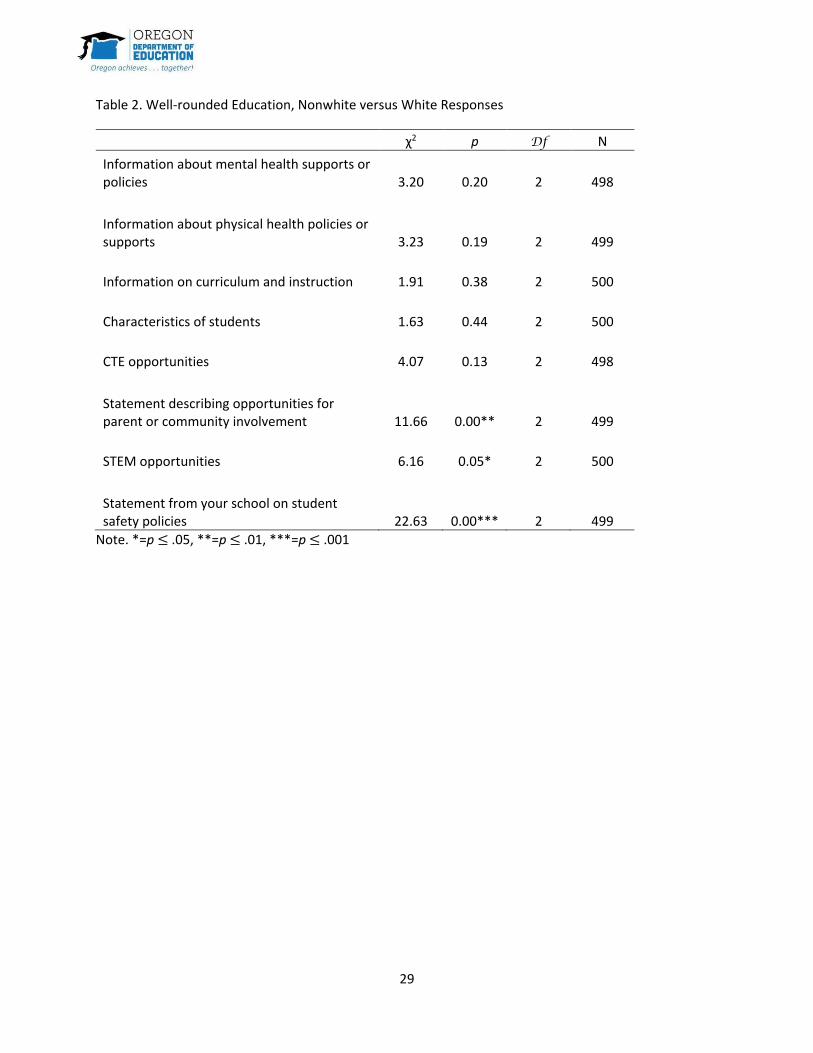
Difference by Racial Identification Nonwhite respondents had the greatest level of agreement (over 75 percent said a given measure was
important) over the following well-rounded education measures (see Figure 12):
information on curriculum and instruction (80.7% nonwhite, 75.4% white)
CTE opportunities (82.5% nonwhite, 72.6% white)
statement from school describing opportunities for parent or community involvement
(nonwhites 75.4%, whites 52.7%)
access to STEM opportunities (87.7% nonwhite, 73.6% white)
statement from your school on student safety policies (80.7% nonwhite, 47.3% white)
The chi-square test of independence showed significant differences between white and nonwhite
responses on the following measures (see Table 2. in Appendix 2):
a statement describing opportunities for parent or community involvement, X2 (2,
N=499)=11.66, p< .01
access to STEM opportunities, X2 (2, N=500)=6.16, p< .05
a statement from your school on student safety policies, X2 (2, N=499)=22.63, p< .001
Nonwhites were over 1.4 times more likely to say that it is important to include statements on
parent/community involvement and on student safety policies on a future Oregon Report Card.
Written Responses Approximately 7.5 percent of those who answered the “well-rounded education” question series, wrote in a response. Two main types of responses, or themes, emerged: Theme 1: Most statements from schools (about policies or otherwise) are not helpful on a report card Many people expressed concern over the quality and accuracy of written responses from schools or districts. For example, one respondent said,
Statements describing strategies are far less useful than indicators that provide real information.
For example, don’t provide a statement on mental health supports. I’d like to know student to
counselor ratio or that the school offers programming. Same on school safety. How frequent are
incidents? I don’t want to just know about CTE. I want to know more about enrollment and
completion. These indicators described here [on the survey] provide me little detail on what you
are actually proposing to do.
Theme 2: Provide information about school climate2
2 The definition of climate used here comes from the National School Climate Center’s definition, which includes safety, teaching and learning, interpersonal relationships (including respect for diversity), environment, and leadership/staff relations. For more information see the National School Climate Center webpage.

14
While many said that most statements from schools are not helpful, those who discussed the
importance of information relevant to school climate, did mention they wanted statements if the
statements were specific. For example,
A statement about policies is fine, but I want to know what is being implemented. And, if I feel
my student is discriminated against, how do I seek help?
Another parent said this,
[I would like to see] a statement from the school describing school climate initiatives: restorative
justice, PBIS, and culturally responsive pedagogy.
And a third parent said,
[I would like to see] a statement of training for understanding students from different
backgrounds
Some respondents said they wanted information about the availability of ethnic studies classes,
information about tracking and segregation, and information about bullying, harassment, and hazing
policies.
Academic Success Respondents were asked to rate how important it was to see measures of academic success on future
Oregon Report Cards (see Figure 13 for the complete list of possible measures). Across all possible
measures, there were generally a smaller percentage who reported that each measure was important to
include on a report card relative to the “opportunities to learn” measures and the “well-rounded
education measures”.
Parent Responses Less than 50 percent of parents thought student group achievement growth (46 percent) and a principal
narrative (48 percent) were important to include (nonparents also had less than 50 percent stating that
the principal narrative was important to include). However, over 50 percent of parents thought it was
important to have English learner proficiency, and between about 60-70 percent thought achievement
gaps, number of eighth graders passing algebra one, and student achievement growth were important
(see Figure 13).
Nonparent Responses Nonparents had over 50 percent stating every measure except the principal narrative were important.
Nonparents had a high level of agreement (75 percent or greater) over the importance of:
Student achievement growth (75.0% nonparents, 68.3% parents)
Achievement gaps (76.3% nonparents, 64.1% parents)

15
Nonparents also were more interested in seeing a measure of student group achievement growth on a
future Oregon Report Card. In fact, the difference between nonparents marking it as important and
parents was 22 percentage points (see Figure 13).
The chi-square test of independence revealed significant differences in parent versus nonparent
responses across measures of: number of English learners on-track to English language proficiency (X2 (2,
N=515)=20.31, p< .001), achievement gaps (X2 (2, N=517)=16.83, p< .001), and student achievement
growth by student group (X2 (2, N=517)=24.50, p< .001). Looking at risk ratios, across all of the
aforementioned differences nonparents were more likely to say they are important to include (see Table
3. Appendix 3).
Difference by Racial Identification Over 50 percent of respondents, both white and nonwhite, thought all measures of academic success
are important to include on a future Oregon Report Card with one exception—only 40.6 percent of
white respondents thought a principal narrative was important to include. Looking for high levels of
agreement on a measure (where 75 percent or greater say a measure is important) shows that high
agreement only existed for (see Figure 14):
student achievement growth (78.9% nonwhites, 72.6% whites)
achievement gaps (nonwhites 89.5%, whites 70.8%)
number of English learners on-track to English language proficiency (nonwhites 82.5%, whites
64.3%)
The chi-square test of independence showed significant differences between white and nonwhite
responses on the following measures (see Table 2. Appendix 3):
achievement gaps, X2 (2, N=499)=9.12, p< .01
number of English learners on-track to English language proficiency, X2 (2, N=497)=7.44, p< .05
principal statement about performance of school X2 (2, N=498)=10.01, p< .01
Nonwhites were 1.26 times more likely to say achievement gaps are important to include, 1.28 times
more likely to say English learner proficiency is important to include, and 1.51 times more likely to say a
principal statement about the performance of the school is important to include on a future Oregon
Report Card.
Written Responses Just over nine percent of those who responded to the “academic success” series of questions wrote in a
comment. Two predominant themes emerged out of the 46 comments.
Theme 1: Concern and skepticism over the validity and value of state tests
Many of the written responses seemed to convey strong perspectives about the lack of value of state
tests. For example,
State testing is culturally biased and does not do a good job of measuring what kids are learning
Another person said,

16
The test scores of students/percentage who graduate directly correlates with socioeconomic
status. All of the money that is put into these report cards would be better spent directly
impacting students’ education.
Theme 2: A focus on achievement growth
Those who were not opposed to state achievement tests, stressed the importance of focusing report
cards on achievement growth, rather than highlighting static scores. One educator said,
The importance of student growth MUST be of significant weighting on the revision of the School
Report Card. When a school has a very mobile population and new students come into a
building, a strong indicator of good instruction is student growth. We are a county of high
poverty and students, [wealthy counties] have exposure to very different life experiences than
our students do. Please don’t punish us by stressing the Student Achievement piece as more
valuable than Student Growth.
Another person said,
Growth. Growth rather than achievement needs to be weighted much higher. It’s the only way
to keep the report card equitable. If achievement is the same weight as growth, there will be an
advantage to more affluent districts.
Therefore, while some respondents want to abandon state testing altogether, others felt that a focus on
achievement growth would be a more equitable way to look at school or district progress.

17
Par
ent
No
nP
aren
t
Par
ent
No
nP
aren
t
Par
ent
No
nP
aren
t
Par
ent
No
nP
aren
t
Par
ent
No
nP
aren
t
Par
ent
No
nP
aren
t
0%
20%
40%
60%
80%
100%St
ud
en
t gr
ou
p a
chie
vem
ent
gro
wth
Pri
nci
pal
sta
tem
ent
on
pe
rfo
rman
ce o
f th
e sc
ho
ol
Engl
ish
lear
ner
s o
n-t
rack
to
Engl
ish
lan
guag
ep
rofi
cien
cy
Ach
ieve
men
t ga
ps
Eigh
th g
rad
ers
pas
sin
gal
geb
ra 1
Stu
de
nt
ach
ieve
me
nt
gro
wth
Figure 13. Academic Success Components by Respondent TypeNot Important Neutral/Not Sure Important
No
nw
hit
e
Wh
ite
No
nw
hit
e
Wh
ite
No
nw
hit
e
Wh
ite
No
nw
hit
e
Wh
ite
No
nw
hit
e
Wh
ite
No
nw
hit
e
Wh
ite
0%
20%
40%
60%
80%
100%
Stu
de
nt
gro
up
ach
ieve
men
tgr
ow
th
Pri
nci
pal
sta
tem
ent
on
pe
rfo
rman
ce o
f th
e sc
ho
ol
Engl
ish
lear
ner
s o
n-t
rack
to
Engl
ish
lan
guag
ep
rofi
cien
cy
Ach
ieve
men
t ga
ps
Eigh
th g
rad
ers
pas
sin
gal
geb
ra 1
Stu
de
nt
ach
ieve
me
nt
gro
wth
Figure 14. Academic Success Components by Respondent TypeNot Important Neutral/Not Sure Important

18
College and Career Readiness The survey asked respondents to rank the importance (1=not important, 2= neutral/not sure,
3=important) of including measures of college and career readiness on the future Oregon Report Card
(see Figure 15 for a complete list of measures).
Parent Responses At least half of all parents said most of the measures are important to include on the Oregon Report
Card. However, fewer parents listed student group achievement scores as important (44 percent). The
measures with the greatest proportion of parents (over 75 percent) indicating the importance of
inclusion were (see Figure 15):
the four-year graduation rate (80.6% parents, 81.7% nonparents)
freshman on-track to graduate (82.1% parents, 82.7% nonparents)
Nonparent Responses
Indicators with larger proportions (over 75 percent) of nonparents noting the importance of a measure
were (see Figure 15):
freshman on-track to graduate (82.7% nonparents, 82.1% parents)
four-year graduation rate (81.7% nonparents, 80.6% parents)
dropout rate (75.4% nonparents, 63.2% parents)
For most other measures, including student group achievement scores, over 50 percent of nonparents
said they were important. However, nonparents were more ambivalent or neutral about the importance
of career and college readiness policies in general, and relative to parents.
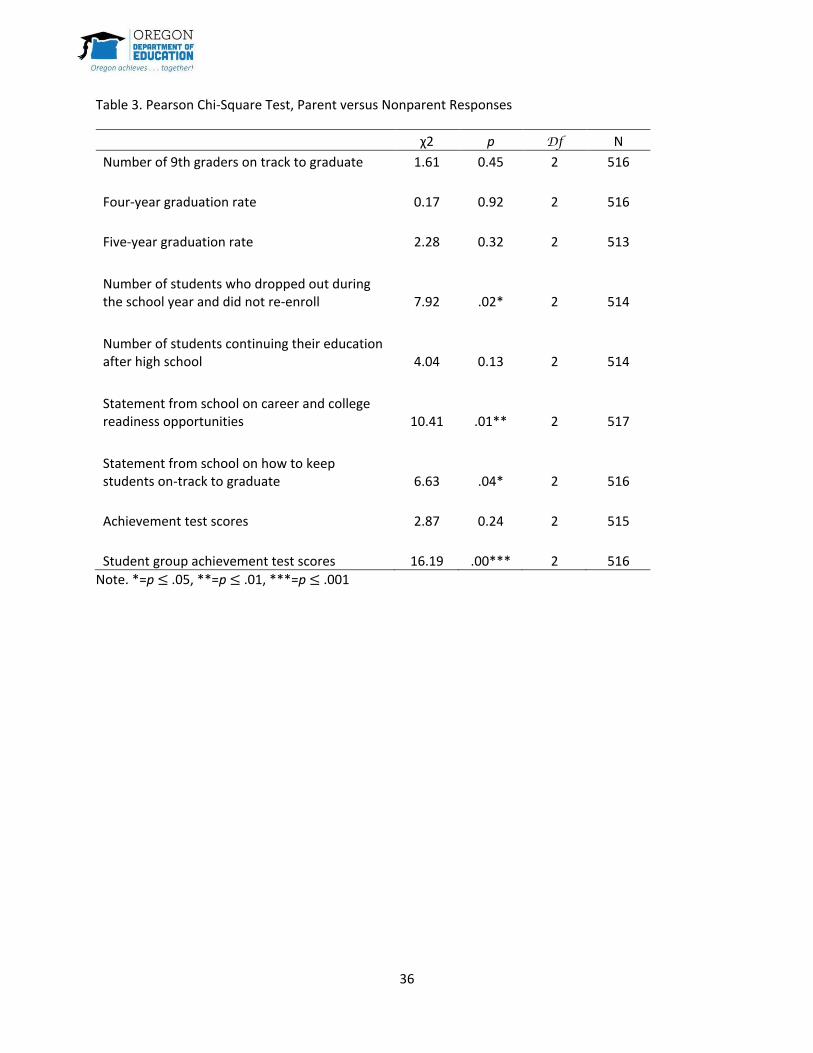
Significant differences between parent and nonparent responses existed over the importance of
including a statement from the school on career and college readiness opportunities, a statement from
the school on how to keep students on-track to graduate, on the number of students who dropped out
during the school year and did not re-enroll, and on student group achievement test scores. Looking at
risk-ratios shows that parents were more interested in including the aforementioned statements from
schools, and nonparents were more interested including student group achievement test scores, and
dropout rates (see Table 3. Appendix 4).
Differences by Racial Identification
For both white and nonwhites, over 50 percent of all respondents said each indicator of college and career readiness is important to include on future Oregon Report Cards with one exception—only 48.4 percent of whites thought a statement from the school on career and college readiness opportunities was important to include (see Figure 16). For both white and nonwhites, a high level of agreement (over 75 percent said a given item was important to include) existed over:
number of 9th graders on track to graduate (93.0% nonwhite, 81.6% white)
four-year graduation rate (86.0% nonwhite, 81.2% white)
five-year graduation rate (75.0% nonwhite, 69.1% white)

19
dropout rates (80.7% nonwhite, 70.5% white)
number of student continuing education after high school (77.2% nonwhite, 61.5% white)
achievement test scores (77.2% nonwhite, 62.8% white) The only significant differences in nonwhite versus white responses existed over the importance of including a statement from the school on career and college readiness opportunities, where risk ratios show that nonwhites were 1.52 times more likely to say that is an important item to include, and student group achievement test scores where nonwhites were 1.34 times more likely to say that it is important to include (see Table 2. Appendix 4).
Written Responses
Just over 10 percent of respondents wrote in a comment in the “college and career readiness” section.
The responses were either very specific ways of measuring, explaining, or displaying the data, or they
echoed themes in earlier write-in sections (dislike of state tests and dislike of the principal narrative
section on report cards). Some examples of comments about specific data or measurement include:
Overall graduation rate, no matter how many years, is what I’m interested in
Or this,
Number of students who withdrew (missed a significant portion of the school year) but
reenrolled
Or this,
“On track” data should include data about number and type of credits (credit deficiency)
The detailed comments about specific means of measurement likely reflect the fact that many
respondents were not only familiar with, but also frequently used, the Oregon Report Card.

20
Par
ent
No
np
aren
t
Par
ent
No
np
aren
t
Par
ent
No
np
aren
t
Par
ent
No
np
aren
t
Par
ent
No
np
aren
t
Par
ent
No
np
aren
t
Par
ent
No
np
aren
t
Par
ent
No
np
aren
t
Par
ent
No
np
aren
t
0%
20%
40%
60%
80%
100%
Stu
de
nt
gro
up
ach
ieve
men
t sc
ore
s
Car
eer
and
co
llege
read
ines
sp
olic
ies/
sup
po
rts
Ach
ieve
men
t sc
ore
s
Co
nti
nu
ing
edu
cati
on
Sch
oo
l po
licie
s an
dsu
pp
ort
s fo
r o
n-t
rack
grad
uat
ion
Dro
po
ut
rate
5-Y
r gr
adu
atio
n r
ate
4-Y
r. g
rad
uat
ion
rat
e
Fres
hm
an o
n-t
rack
to
grad
uat
e
Figure 15. College and Career Readiness Components by Respondent Type
Not Important Neutral/Not Sure Important
No
nw
hit
e
Wh
ite
No
nw
hit
e
Wh
ite
No
nw
hit
e
Wh
ite
No
nw
hit
e
Wh
ite
No
nw
hit
e
Wh
ite
No
nw
hit
e
Wh
ite
No
nw
hit
e
Wh
ite
No
nw
hit
e
Wh
ite
No
nw
hit
e
Wh
ite
0%
20%
40%
60%
80%
100%
Stu
de
nt
gro
up
ach
ieve
men
t sc
ore
s
Car
eer
and
co
llege
read
ines
sp
olic
ies/
sup
po
rts
Ach
ieve
men
t sc
ore
s
Co
nti
nu
ing
edu
cati
on
Sch
oo
l po
licie
s an
dsu
pp
ort
s fo
r o
n-t
rack
grad
uat
ion
Dro
po
ut
rate
5-Y
r gr
adu
atio
n r
ate
4-Y
r. g
rad
uat
ion
rat
e
Fres
hm
an o
n-t
rack
to
grad
uat
e
Figure 16. College and Career Readiness Components by Respondent Type
Not Important Neutral/Not Sure Important

21
Results: Design and Clarity
Emergent Themes
The final question on the survey provided respondents with three sample At-A-Glance type reports to
examine. They were then asked to look over all three reports and state which aspects of the report designs
appealed to them most and why. The vast majority of people said that they like depth of information, but
they want it presented in a clean, clear, and easy-to-read format. Many people said that a report that is
cluttered can be overwhelming and difficult to interpret. Many people also listed the importance of using
graphics over text, in other words, show the data rather than offer too much explanation. For example, one
person said:
[I like a report] that is simple and easy to understand. We don’t need a bunch of info on all of the
groups. Maybe the state cares but parents don’t. We just want to know what our kids are going to a
good school. [I like a report] that is visually appealing as long as the graphics are explained, it could
be useful for a lot of people. [It] is not appealing if it is too wordy.
A teacher said this:
…[A] lot of data can be overwhelming for parents and community members. I really like [a report]
that is easy to read and has lots of data and graphs. As a teacher it is important to have details, but it
is readable for everyone.
Finally, many respondents (just over 20 percent) said that they hope we do not use letter grades on the
report. For example, one person said:
I like to see progress and outcomes. Also, a school profiles that tells me a lot about the school as a
whole. I like fast facts and data shown in graphs. It makes it more visually appealing and not
overwhelming to read. I don’t care for letter grades. It seems negative to show large D’s and F’s and
makes it hard to focus on the overall pictures.
Respondents voiced concern that letter grades are misleading and distill the complexity of schools into an
overly simplistic measure.

22
Summary and Recommendations
Through ESSA, states have greater flexibility to innovate in order to address local needs. Because of this
flexibility, the Oregon Department of Education will redesign the School and District At-A-Glance reports
to better engage and inform families about their school or district. To ensure the At-A-Glance reports
capture information about schools and districts that is important to parents, underserved communities,
and other stakeholders, ODE issued an online survey August through October of 2017. A total of 570
persons responded to the survey. What follows is a summary of results and subsequent
recommendations.
Those who took the Oregon School Report Card Redesign Survey were a unique slice of the Oregon
population: the vast majority of respondents were highly-educated women, who predominantly
identified as white, and who frequently viewed the Oregon School Report Card. It is therefore important
to note that the views expressed in this survey only represent the views of those who took the survey.
Because ODE anticipated that respondents to the survey would not reflect the diversity of the Oregon
population more generally, ODE also conducted 11 focus groups with historically underserved groups,
the results of which can be found, <insert hyperlink here>. Finally, although the majority of responses to
the survey were from those who largely identified as white, differences between white and nonwhite
answers were examined and are highlighted throughout the results.
Overall, it was abundantly clear that the respondents to this survey want an uncluttered, easy-
to-read report card. They also clearly state that they want the report card to prioritize graphics
over text and emphasize changes in data over time. Additionally, respondents to this survey are
interested in learning about many aspects of their schools. In general, across the majority of
measures in every domain (i.e., opportunities to learn, well-rounded education, academic
success, and college and career readiness), over 50 percent of respondents indicated that each
measure was important to include on the future Oregon Report Card. While the measures
detailed in the survey are important, inclusion of all of them could lead to clutter and lack of
clarity. Therefore, the recommendations that follow are based on responses where a high-level
of agreement (75 percent or more agreed on importance) was reached for all groups examined
in this report. However, in recognition of the important goals and beliefs detailed in the Equity
Lens, and in recognition of the goal to make a more parent-friendly report card, when
differences between groups existed, the parent perspective and the nonwhite perspective were
highlighted. Using this methodology, the following indicators are recommended for inclusion on
a future Oregon Report Card:

23
Opportunities to Learn Measures (see Appendix 1 for more information)
Parent Responses: Non-white Responses:
average class size* average class size
teacher quality and quantity* teacher quality and quantity
average district spending per student* average district spending per student*
teacher turnover*
statement from your school describing how your
school supports the success of diverse populations*
*Indicates results are significantly different from either nonparents or white respondents.
Well-rounded Education Measures (see Appendix 2 for more information)
Parent Responses: Non-white Responses:
information about the curriculum and instruction offered in a school*
information about the curriculum and instruction offered in a school
career and technical education opportunities offered in a schools
information about science, technology, engineering, and math (STEM) opportunities*
information about science, technology, engineering, and math (STEM) opportunities*
statement from your school on student safety policies*
a statement describing opportunities for parent or community involvement*
*Indicates results are significantly different from either nonparents or white respondents.
Academic Success Measures (see Appendix 3 for more information)
Parent Responses: Non-white Responses:
None** student achievement growth
number of English learners on-track to English language proficiency*
achievement gaps*
*Indicates results are significantly different from either nonparents or white respondents.
**None of the parent responses met the standard for a high-level of agreement.

24
College and Career Readiness Measures (see Appendix 4 for more information)
Parent Responses: Non-white Responses:
the four-year graduation rate the four-year graduation rate
freshman on-track to graduate freshman on-track to graduate
five-year graduation rate
dropout rate
achievement scores
number of students continuing education after high school
*Indicates results are significantly different from either nonparents or white respondents.
While the results of this survey represent only the views of those who took this survey, comparisons
between parents and nonparents, and nonwhites and whites, reveals important similarities and
differences between group responses. The results of these group responses, taken together with focus
group results, can help inform an At-A-Glance report prototype. Once the prototype is created,
additional data will be collected from stakeholders and used to further the ODE Report Card Redesign
vision: to create a meaningful and actionable At-A-Glance report for parents, underserved communities,
and other stakeholder groups.

25
Appendix 1. Opportunities to Learn
Table 1.
% Agree Item
Important to Include Risk
Ratio* % Agree Item
Important to Include Risk
Ratio*
Parent Nonparent Nonwhite White
Average class size 89.6% 79.1% 1.13 89.7% 81.4% --
Teacher quality and quantity 81.3% 63.6% 1.28 79.3% 67.0% --
Teacher turnover 76.1% 62.9% 1.21 67.2% 66.7% --
Average district per pupil spending 77.9% 66.8% 1.17 84.2% 67.3% 1.25
Statement from school on how the school supports diverse populations 53.5% 52.2% -- 75.9% 49.8% 1.52
Number of chronically absent students 57.2% 85.5% 0.67 74.1% 78.2% --
Number of students suspended or expelled 64.1% 58.4% -- 67.2% 59.2% --
Background similarity between teachers and students 36.8% 40.1% -- 56.9% 36.6% 1.55
Number of School days with at least 5 hours of instruction per year 55.2% 54.9% -- 67.2% 53.5% --
Number of principals who remain in a school for at least five years 68.5% 56.5% 1.21 55.2% 60.4% --
*Risk ratio included when results are significantly different

26
Table 2. Pearson Chi-square Test of Independence, Nonwhite versus White Responses
χ2 p Df N
Number of chronically absent students 0.54 0.77 2 499
Number of students suspended or expelled 3.67 0.16 2 497
Number and quality of teachers at the school 5.17 0.08 2 494
Number of students taught by teachers with similar backgrounds 9.82 0.01** 2 495
Statement from your school describing how your school supports the success of diverse populations 14.00 0.00*** 2 498
Number of School days with at least 5 hours of instruction per year 4.74 0.09 2 497
Typical classroom size in a school 2.44 0.30 2 499
Number of teachers returning to work each year at a school 0.64 0.73 2 500
Number of principals who remain in a school for at least five years 0.59 0.75 2 500
Average per student spending by district 6.81 0.03* 2 497
Note. *=p ≤ .05, **=p ≤ .01, ***=p ≤ .001

27
Table 3. Pearson Chi-square Test of Independence, Parents versus Nonparent Responses
χ2 ρ Df N
Number of chronically absent students 48.50 0.00*** 2 517
Number of students suspended or expelled 4.12 0.13 2 515
Number and quality of teachers at the school 15.02 0.00*** 2 512
Number of students taught by teachers with similar backgrounds 2.91 0.23 2 513
Statement from your school describing how your school supports the success of diverse populations 0.64 0.73 2 516
Number of school days with at least 5 hours of instruction per year 0.51 0.78 2 515
Typical classroom size in a school 10.59 0.01** 2 517
Number of teachers returning to work each year at a school 8.13 0.02* 2 518
Number of principals who remain in a school for at least five years 6.33 0.04* 2 518
Average per student spending by district 8.12 0.02* 2 515
Note. *=p ≤ .05, **=p ≤ .01, ***=p ≤ .001

28
Appendix 2. Well-rounded education
Table 1.
% Agree Item
Important to Include Risk
Ratio* % Agree Item
Important to Include Risk
Ratio*
Parent Nonparent Nonwhite White Information about the curriculum and instruction offered in a school 87.0% 72.3% 1.20 80.7% 75.4% --
CTE opportunities offered in a schools 73.6% 74.2% -- 82.5% 72.6% --
Information about STEM opportunities 86.3% 71.0% 1.22 87.7% 73.6% 1.19
Statement on student safety policies 59.3% 48.9% -- 80.7% 47.3% 1.71
Statement describing opportunities for parent or community involvement 66.4% 51.5% 1.29 75.4% 52.7% 1.43
Information about mental health supports or policies 69.2% 59.6% 1.34 66.7% 55.1% --
Information about physical health policies or supports 67.8% 44.2% 1.53 59.6% 49.3% --
Characteristics of students 52.7% 65.3% 0.81 66.7% 60.9% --
*Risk ratio included when results are significantly different
29
Table 2. Well-rounded Education, Nonwhite versus White Responses
χ2 p Df N
Information about mental health supports or policies 3.20 0.20 2 498
Information about physical health policies or supports 3.23 0.19 2 499
Information on curriculum and instruction 1.91 0.38 2 500
Characteristics of students 1.63 0.44 2 500
CTE opportunities 4.07 0.13 2 498
Statement describing opportunities for parent or community involvement 11.66 0.00** 2 499
STEM opportunities 6.16 0.05* 2 500
Statement from your school on student safety policies 22.63 0.00*** 2 499
Note. *=p ≤ .05, **=p ≤ .01, ***=p ≤ .001

30
Table 3. Pearson Chi-square Test of Independence, Parents versus Nonparent Responses
χ2 p Df N
Information about mental health supports or policies 15.75 0.00*** 2 516
Information about physical health policies or supports 23.62 0.00*** 2 517
Information on curriculum and instruction 12.60 0.00** 2 518
Characteristics of students 10.60 0.01** 2 518
CTE opportunities 0.86 0.65 2 516
Statement describing opportunities for parent or community involvement 9.61 0.01** 2 517
Access to STEM opportunities 14.57 0.00*** 2 518
Statement from your school on student safety policies 4.50 0.10 2 517
Note. *=p ≤ .05, **=p ≤ .01, ***=p ≤ .001

31
Appendix 3. Academic Success
Table 1.
% Agree Item
Important to Include Risk
Ratio % Agree Item
Important to Include Risk
Ratio
Parent Nonparent Nonwhite White
Student achievement growth 68.3% 75.0% -- 78.9% 72.6% --
Number of English learners on-track to EL proficiency 53.8% 70.5% 0.76 82.5% 64.3% 1.28
Achievement gaps 64.1% 76.3% 0.84 89.5% 70.8% 1.26
8th graders passing Algebra 1 60.7% 55.6% -- 64.9% 56.3% --
Student achievement growth by student group 46.2% 67.5% 0.68 71.9% 60.6% --
Principal statement about performance of the school 47.6% 41.2% -- 61.4% 40.6% 1.51
*Risk ratio included when results are significantly different

32
Table 2. Pearson Chi-square Test of Independence, Nonwhite versus White Responses
χ2 p Df N
Student achievement growth 2.32 0.31 2 499
Student achievement growth by student group 2.29 0.25 2 499
Achievement gaps 9.12 0.01** 2 499
Number of 8th graders passing Algebra 1 2.07 0.36 2 499
Number of English learners on-track to EL proficiency 7.44 0.02* 2 497
Principal statement about performance of the school 10.01 0.01** 2 498
Note. *=p ≤ .05, **=p ≤ .01, ***=p ≤ .001

33
Table 3. Pearson Chi-square Test of Independence, Parent versus Nonparent Responses
χ2 p Df N
Student achievement growth 3.55 0.17 2 517
Student achievement growth by student group 24.50 .00*** 2 517
Achievement gaps 16.83 .00*** 2 517
Number of Eighth graders passing Algebra 1 2.47 0.29 2 517
Number of English learners on-track to EL proficiency 20.31 .00*** 2 515
Principal statement about performance of the school 2.42 0.30 2 516
Note. *=p ≤ .05, **=p ≤ .01, ***=p ≤ .001

34
Appendix 4. College and Career Readiness
Table 1.
% Agree Item
Important to Include Risk
Ratio % Agree Item
Important to Include Risk
Ratio
Parent Nonparent Nonwhite White Four-year graduation rate 80.6% 81.7% -- 86.0% 81.2% --
Freshman on-track to graduate 82.1% 82.7% -- 93.0% 81.6% --
Five-year graduation rate 64.1% 70.9% -- 75.0% 69.1% --
Number of students who dropped out during the school year and did not re-enroll 63.2% 75.4% 0.84 80.7% 70.5% --
Number of students continuing their education after high school 59.7% 64.3% -- 77.2% 61.5% --
Achievement test scores 62.5% 65.0% -- 77.2% 62.8% --
Student group achievement scores 44.4% 59.4% 0.74 71.9% 53.5% 1.34
Statement on college and career readiness 61.4% 47.3% 1.30 73.7% 48.6% 1.52
Statement from school on how to keep students on-track to graduate 62.8% 52.7% 1.24 68.4% 52.4% --
*Risk ratio included when results are significantly different

35
Table 2. Pearson Chi-square Test of Independence, Nonwhite versus White Responses
χ2 p Df N
Number of 9th graders on track to graduate 4.61 0.10 2 498
Four-year graduation rate 0.98 0.61 2 498
Five-year graduation rate 0.85 0.65 2 496
Number of students who dropped out during the school year and did not re-enroll 2.71 0.26 2 497
Number of students continuing their education after high school 5.89 0.053 2 496
Statement from school on career and college readiness opportunities 12.69 0.00** 2 499
Statement from school on how to keep students on-track to graduate 5.49 0.06 2 498
Achievement test scores 5.26 0.07 2 498
Student group achievement test scores 6.97 0.03* 2 498
Note. *=p ≤ .05, **=p ≤ .01, ***=p ≤ .001
36
Table 3. Pearson Chi-Square Test, Parent versus Nonparent Responses
χ2 p Df N
Number of 9th graders on track to graduate 1.61 0.45 2 516
Four-year graduation rate 0.17 0.92 2 516
Five-year graduation rate 2.28 0.32 2 513
Number of students who dropped out during the school year and did not re-enroll 7.92 .02* 2 514
Number of students continuing their education after high school 4.04 0.13 2 514
Statement from school on career and college readiness opportunities 10.41 .01** 2 517
Statement from school on how to keep students on-track to graduate 6.63 .04* 2 516
Achievement test scores 2.87 0.24 2 515
Student group achievement test scores 16.19 .00*** 2 516
Note. *=p ≤ .05, **=p ≤ .01, ***=p ≤ .001


