

Research Institute of Organic AgricultureForschungsinstitut für biologischen Landbau
Organic Agriculture Worldwide: Key results from the FiBL-IFOAM survey on organic agriculture worldwide 2015Part 3: Organic agriculture in the regions 2013
Julia Lernoud and Helga WillerResearch Institute of Organic Agriculture (FIBL), Frick, Switzerland© FiBL 2015

www.fibl.org
Organic Agriculture Worldwide: Key results from the FiBL-IFOAM survey on organic agriculture worldwide 2015: Part 3: Organic agriculture in the regions 2013
2
› Data compiled by the Research Institute of Organic Agriculture FiBL, Frick, Switzerland, in cooperation with the International Federation of Organic Agriculture Movements IFOAM – Organics International, based on national data sources and data from certifiers.
› Data as published February 2015 in FiBL & IFOAM (2015) The World of Organic Agriculture. Statistics and Emerging Trends 2015. Frick and Bonn
› For updates check www.organic-world.net› This presentation is available online at: http://www.organic-
world.net/yearbook/yearbook2015/slide-presentations.html› Texts and graphs: Helga Willer and Julia Lernoud; Research Institute of
Organic Agriculture, FiBL, Frick, Switzerland › Contact: Helga Willer, Research Institute of Organic Agriculture, FiBL,
Frick, Switzerland, [email protected]› © Research Institute of Organic Agriculture (FiBL), Frick, Switzerland,
February, 2015

www.fibl.org
Acknowledgements*› The Swiss State Secretariat of
Economic Affairs SECO, Berne
› International Trade Centre ITC
› Nürnberg Messe, the organizers of the BioFach World Organic Trade Fair
› European market data:Co-funding from the European Unionfor the European data survey in the framework of the OrganicDatanetwork project
› 200 experts from all parts of the world contributed to the FiBL-IFOAM survey 2015.
* See also disclaimer on last page of this slide show
3

www.fibl.org
The World of Organic Agriculture 2015
4
› The 16th edition of ‚The World of Organic Agriculture‘, was published by FiBL and IFOAM in February 2015.*
› Contents:
› Results of the survey on organic agricultureworldwide;
› Organic agriculture in the regions and countryreports;
› Australia, Canada, the Pacific Islands, Mediterranean region, and The United States of America.
› Chapters on the global market, standards & legislations, voluntary standards , PGS, European market and vegetables production in China
› Numerous tables and graphs.
› The book can be ordered via IFOAM.bio and shop.FiBL.org.
*Willer, H, Lernoud, J, (2015) The World of Organic Agriculture. Statistics and Emerging Trends 2015. FiBL, Frick, and, IFOAM – Organics International, Bonn

www.fibl.org
Website www.organic-world.net
› Detailed statistics in excel format
› Graphs & Maps› Data revisions› News and
backgroundinformation
5

www.fibl.org
About this presentation
› There are 3 presentations summarizing the key results of the FiBL-IFOAM survey on organic agriculture worldwide 2015 (data 2013). Apart from the global data, key resultson crop and on regional data are presented.
› More information is available at www.organic-world.net › The following three presentations are available at
http://www.organic-world.net/yearbook/yearbook2015/slide-presentations.html :› Part 1: Global data 2013 and survey background
› Part 2: Land use and key crops in organic agriculture 2013
› Part 3: Organic agriculture in the regions 2013
6

www.fibl.org
The 16th Survey on organic agriculture world-wide
› The 16th survey on organic agriculture worldwide was carried out by the Research Institute of Organic Agriculture FiBL in cooperation with the International Federation of Organic Agriculture Movements (IFOAM – Organics International) and further partners.
› The survey was carried out between July 2014 and February 2015.› Data were received from 170 countries.› New countries included: Andorra, Bahamas, Iraq, Mayotte.› Updated data on area and producers were available for 129 countries. › Data were provided by almost 200 country experts (representatives from NGOs,
certification bodies, governments, researchers).› The following data were collected: Area data (including land use and crop
details); Producers, other operator types; Domestic market values; Export and imports data; Livestock data (animal heads and production tones);
› The results are published in the yearbook “The World of Organic Agriculture 2015” and at www.organic-world.net.
7

www.fibl.org
Africa: Organic agricultural land by country 2013
8Source: FiBL-IFOAM Survey 2015

www.fibl.org
Organic agriculture in Africa 2013
› In Africa, there were 1.2 million hectares of certified organic agricultural land (data 2013).
› This constitutes about three percent of the world’s organic agricultural land.
› More than 572’000 producers were reported. › The countries with the most organic land are Uganda (230’232
hectares), Tanzania (186’537 hectares), and Ethiopia (160’987 hectares).
› The highest shares of organic land are in Sao Tome and Prince (7.2 percent), Egypt (2.3 percent), and Comoros (1.7 percent).
› The majority of certified organic produce in Africa is destined for export markets.
› The European Union, as the major recipient of these exports, is Africa’s largest market for agricultural produce.
9Source: FiBL-IFOAM Survey 2015

www.fibl.org
Africa: Development of organic agricultural land 2000-2013
10
0.05
0.230.32 0.36
0.51 0.49
0.68
0.86 0.86
1.03 1.08 1.071.15
1.22
0.0
0.2
0.4
0.6
0.8
1.0
1.2
1.4
2000 2001 2002 2003 2004 2005 2006 2007 2008 2009 2010 2011 2012 2013
Mill
ion
hect
ares
Africa: Development of organic agricultural land 2000 to 2013Source: FiBL-IFOAM-SOEL 2001-2015

www.fibl.org
Africa: The ten countries with the most organic agricultural land 2013
11
28'201
30'265
37'466
51'838
85'801
139'087
141'479
160'987
186'537
230'232
0 50'000 100'000 150'000 200'000 250'000 300'000
Ghana
Madagascar
South Africa
Dem. Rep.of the Congo
Egypt (2012)
Tunisia
Sudan
Ethiopia
Tanzania
Uganda
Hectares
Africa: The ten countries with the largest organic area 2013Source: FiBL-IFOAM survey 2015

www.fibl.org
Africa: Distribution of organically managed agricultural land by country 2013
230'23219%
186'53715%
160'98713%
644'61853%
Africa: Distribution of organically managed agricultural land by country 2013 Source: FiBL-IFOAM survey 2015
UgandaTanzaniaEthiopiaRest
12

www.fibl.org
Africa: The ten countries with the highest shares of organic agricultural land 2013
13
0.2%
0.2%
0.5%
0.5%
1.4%
1.5%
1.6%
1.7%
2.3%
7.2%
0% 2% 4% 6% 8%
Rwanda
Dem. Rep. of the Congo
Ethiopia (2012)
Tanzania
Tunisia
Réunion (France)
Uganda
Comoros (2011)
Egypt (2012)
Sao Tome and Principe (2012)
Africa: The countries with the highest share of organic agricultural land 2013Source: FiBL-IFOAM survey 2015

www.fibl.org
Africa: Use of organic agricultural land 2013
14
Permanent crops47%
Arable land crops19%
Perm. grassland
5%
Other agr. land1%
No details28%
Africa: Use of organic agricultural land 2013Source: FiBL-IFOAM Survey 2015; based on information from the private sector, certifiers, and governments.
Land use types 2013
5.996.53
22.9164.13
114.74
0.0 100.0 200.0
VegetablesCereals
Medicinal plantsTextile crops
Oilseeds
Thousand hectares
Key arable crops
19.9023.06
40.27125.35
0.0 100.0 200.0
Fruit, tropical/subtrop.Cocoa
NutsOlivesCoffee
Thousand hectares
Key permanent crops

www.fibl.org
Articles about Africa in the 2015 edition of "The World of Organic Agriculture"
› Latest Developments in Organic Farming in Africa,Jordan Gama
15

www.fibl.org
Asia: Organic agricultural land by country 2013
16Source: FiBL-IFOAM Survey 2015, based on national sources and data from certifiers.

www.fibl.org
Organic Agriculture in Asia – Key Figures 2013
› The total organic agricultural area in Asia was 3.4 million hectares in 2013.
› This constitutes eight percent of the world’s organic agricultural land.
› There were more than 0.7 million producers reported. › The leading countries by organic agricultural land are
China (2.1 million hectares) and India (0.5 million hectares).
› Timor-Leste has the most organic agricultural area as a proportion of total agricultural land (almost seven percent).
17Source: FiBL-IFOAM survey 2015

www.fibl.org
Asia: Development of organic agricultural land 2000-2013
18
0.060.42 0.43 0.49
3.78
2.683.00 2.90
3.363.58
2.77
3.69
3.223.43
0.0
0.5
1.0
1.5
2.0
2.5
3.0
3.5
4.0
2000 2001 2002 2003 2004 2005 2006 2007 2008 2009 2010 2011 2012 2013
Mill
ion
hect
ares
Asia: Development of organic agricultural land 2000 to 2013Source: FiBL-IFOAM-SOEL 2002-2015

www.fibl.org
Asia: Distribution of organic agricultural land by country 2013 (total 3.4 million hectares)
61%15%
9%
15%
ChinaIndiaKazakhstanRest
19FiBL-IFOAM survey 2015

www.fibl.org
Asia: The ten countries with the most organic agricultural land 2013
20
23'331
24'690
33'840
36'595
37'490
65'688
101'278
291'203
510'000
2'094'000
0 500'000 1'000'000 1'500'000 2'000'000 2'500'000
Azerbaijan
Timor-Leste
Thailand
Saudi Arabia
Viet Nam
Indonesia
Philippines
Kazakhstan
India
China
Hectares
Asia: The ten countries with the largest organic area 2013Source: FiBL-IFOAM survey 2015

www.fibl.org
Asia: The ten countries/territories with the highest shares of organic agricultural land 2013
21
0.7%0.7%0.7%0.8%
1.1%1.3%1.4%
1.7%4.7%
6.6%
0% 1% 2% 3% 4% 5% 6% 7%
TaiwanUnited Arab Emirates
Sri LankaPhilippines
Republic of KoreaBhutan
IsraelPalestine (2010)
MongoliaTimor-Leste
Asia: The countries with the highest share of organic agricultural land 2013Source: FiBL-IFOAM survey 2015

www.fibl.org
Asia: Use of organic agricultural land 2013 (total: 3.4 million hectares)
22
Arable land crops37%
Permanent crops11%Permanent
grassland1%
Other agricultural
land2%
No details49%
Asia: Use of agricultural organic land 2013Source: FiBL-IFOAM Survey 2015; based on information from the private sector, certifiers, and governments.
Land use types 2013
12.7318.72
66.90325.13
793.57
0.0 500.0 1'000.0
Medicinal plantsProtein crops
VegetablesOilseedsCereals
Thousand hectares
Key arable crops
39.8939.92
57.4867.60
74.82
0.0 50.0 100.0
Fruit, trop./subtropicalFruit temperate
TeaCoffee
Nuts
Thousand hectares
Key permanent crops

www.fibl.org
Articles about Asia in the 2015 Edition of "The World of Organic Agriculture"
› Organic Asia 2014Ong Kung Wai
› Statistics and Emerging Trends of Organic Vegetable Production in ChinaXue-qing He, Yu-Hui Qiao, Min Su, and Friederike Martin
23

www.fibl.org
Europe: Organic agricultural land by country 2013
24Source: FiBL Survey 2015

www.fibl.org
Organic agriculture in Europe: Key data/indicators 2013
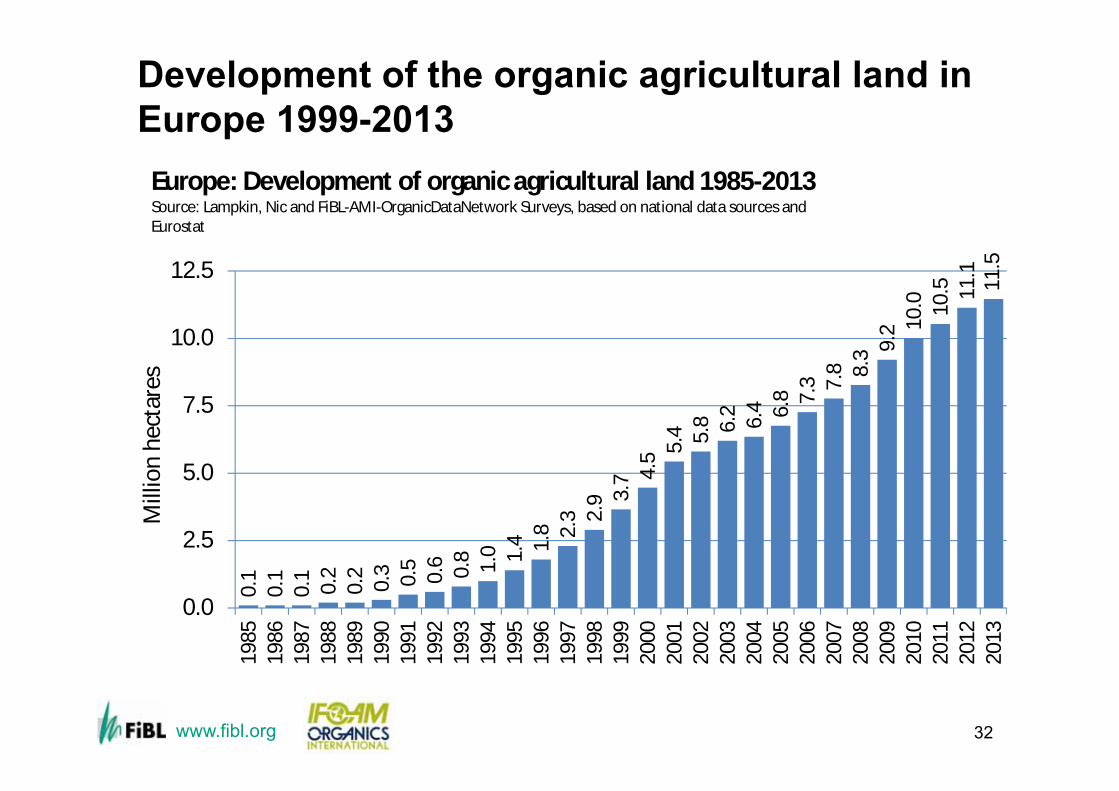
› 11.5 million hectares of agricultural land are organic (including in conversion areas).
› This constitutes 2.4 percent of the agricultural land in Europe.
› The organic agricultural land increased by 0.18 million hectares or three percent in 2013 .
› More than 330’000 producers were reported.
25OrganicDataNetwork Survey 2015 based on national data sources and FiBL-AMI survey 2015 based on Eurostat and national data sources

www.fibl.org
Organic agriculture in the European Union: Key data/indicators 2013
› 10.2 million hectares of agricultural land are organic (including in conversion areas).
› This constitutes 5.7 percent of the agricultural land in the European Union.
› The organic agricultural land increased by 0.16 million hectares or three percent in 2013.
› Almost 260’000 producers were reported.
26OrganicDataNetwork Survey 2015 based on national data sources and FiBL-AMI survey 2015 based on Eurostat and national data sources

www.fibl.org
Organic market in Europe: Key data/indicators 2013
› The European market was 24.3 billion euros; six percent more than in 2012.
› The largest market for organic products in 2013 was Germany with a turnover of 7.6 billion euros, followed by France (4.4 billion euros) and the UK (2.2 billion euros).
› As a portion of the total market share, the highest levels have been reached in Denmark, Austria and Switzerland, with six percent or more for organic products. The highest per capita spending is also in these countries and in Luxembourg.
27OrganicDataNetwork Survey 2015 based on national data sources and FiBL-AMI survey 2015 based on Eurostat and national data sources

www.fibl.org
Europe: The ten countries with the most organic agricultural land 2013
28
461'396474'231500'996526'689567'751
661'9561'060'6691'060'756
1'317'1771'610'129
0 500'000 1'000'000 1'500'000 2'000'000
TurkeyCzech Republic
SwedenAustria
United KingdomPoland
GermanyFrance
ItalySpain
Hectares
Europe: The ten countries with the largest organic area 2013Source: OrganicDataNetwork-FiBL-AMI survey 2015 based on national data sources and Eurostat

www.fibl.org
Europe: Distribution of organically managed agricultural land by country 2013
14%
12%
9%
9%
56%
Europe: Distribution of organically managed agricultural land by country 2013 (Total: 11.5 million hectares)Source: OrganicDataNetwork Survey 2015 based on national data sources and FiBL-AMI survey 2015
SpainItalyFranceGermanyRest
29

www.fibl.org
Europe: Distribution of shares of organic land 2013
30
8 countries
9 countries
16 countries
11 countries
Europe: Distribution of organic farmland shares 2013 Source: OrganicDataNetwork-FiBL-AMI survey 2015
More than 10 percent organic land 5 to 10 percent organic land
1 to 5 percent organic land Less than 1 percent organic land

www.fibl.org
Europe: The ten countries with the highest shares of organic agricultural land 2013
31
8.8%9.0%
10.3%11.0%11.2%
12.2%16.0%16.3%
19.5%31.0%
0% 5% 10% 15% 20% 25% 30% 35%
SlovakiaFinland
ItalyLatvia
Czech RepublicSwitzerland
EstoniaSwedenAustria
Liechtenstein
Europe: The countries with the highest share of organic agricultural land 2013Source: OrganicDataNetwork Survey 2015 based on national data sources and FiBL-AMI survey 2015
www.fibl.org
Development of the organic agricultural land in Europe 1999-2013
32
0.1
0.1
0.1 0.2
0.2 0.3 0.5 0.6 0.8 1.0 1.
4 1.8 2.
3 2.9 3.
7 4.5 5.
4 5.8 6.
2 6.4 6.
8 7.3 7.
8 8.3 9.
2 10.0 10
.5 11.1 11.5
0.0
2.5
5.0
7.5
10.0
12.519
8519
8619
8719
8819
8919
9019
9119
9219
9319
9419
9519
9619
9719
9819
9920
0020
0120
0220
0320
0420
0520
0620
0720
0820
0920
1020
1120
1220
13
Mill
ion
hect
ares
Europe: Development of organic agricultural land 1985-2013Source: Lampkin, Nic and FiBL-AMI-OrganicDataNetwork Surveys, based on national data sources and Eurostat

www.fibl.org
Europe: Growth of organic agricultural land by country group 2000-2013
33
0.0
2.0
4.0
6.0
8.0
10.0
12.0
14.0
2000 2001 2002 2003 2004 2005 2006 2007 2008 2009 2010 2011 2012 2013
Mill
ion
hect
ares
Europe: Growth of organic farmland by country group 2000-2013Source: Nic Lampkin, FiBL-AMI-OrganicDataNetwork survey
EU-15 EU-13 CPC EFTA Other Europe

www.fibl.org
Europe: The 10 countries with the highest growth of organic agricultural land in 2013
+9'683+9'791
+16'932+17'150
+23'311+26'314+27'815
+71'381+120'550
+149'815
0 20'000 40'000 60'000 80'000 100'000 120'000 140'000 160'000
HungaryLithuania
SpainBulgariaSweden
GermanyFrance
PortugalUkraine
Italy
Hectares
Europe: The 10 countries with the highest growth of organic agricultural land in 2013Source: OrganicDataNetwork – FiBL-AMI survey 2015 based on national data sources

www.fibl.org
Europe: Use of organic agricultural land 2013 (total: 11.5 million hectares)
35
Permanent grassland
42%
Arable crops40%
Permanent crops11%
Other agr. land2%
No details5%
Europe: Use of agricultural organic land 2013Source: Source: OrganicDataNetwork-FiBL-AMI Survey 2015
Land use types 2013
105.1190.4226.9
1'844.61'910.4
0 1'000 2'000 3'000
VegetablesOilseeds
Protein cropsCereals
Green fodder
Thousand hectares
Key arable crops
37.35138.57
187.52258.35
478.44
0 200 400 600
Citrus fruitFruit, temperate
NutsGrapesOlives
Thousand hectares
Key permanent crops

www.fibl.org
Europe and European Union: Growth of the Organic Market 2004-2013
36
11.0 12.113.5
15.317.0 18.2
19.621.4 22.7
24.3
10.2 11.212.6
14.315.9 17.0 18.2
19.8 20.9 22.2
0.0
5.0
10.0
15.0
20.0
25.0
30.0
2004 2005 2006 2007 2008 2009 2010 2011 2012 2013
Billi
on e
uros
Europe and European Union: Market development 2004-2013Source: FiBL-AMI Surveys 2006-2012, OrganicDataNetwork Surveys 2013-2015
Europe European Union

www.fibl.org
Development of the organic market in selected European countries 2004-2013
37
0.3 0.4 0.4 0.6 0.7 0.8 0.8 0.9 0.9 0.9
1.8 1.6 1.72.1
2.63.1 3.4
3.8 4.04.4
3.53.9
4.65.3
5.9 5.8 6.06.6
7.07.6
1.1
1.1 1.2 1.4 1.6 1.7 1.9 2.0
0.0
1.0
2.0
3.0
4.0
5.0
6.0
7.0
8.0
2004 2005 2006 2007 2008 2009 2010 2011 2012 2013
Billi
on e
uros
European Union: Market development in selected countries 2004-2013Source: AMI, Germany; Agence Bio France, AssoBio, Italy; LF Denmark
Denmark France Germany Italy

www.fibl.org
Europe: Distribution of sales of organic food and drink by country 2013 (total: 24.3 billion euros)
38
Germany31%
France18%United Kingdom
9%
Italy8%
Switzerland7%
Austria (2011)4%
Rest23%
Europe: Distribution of organic retail sales 2013 (total sales: 24.3 billion euros)Source: FiBL-AMI Survey 2015

www.fibl.org
The European market for organic food and drink: The countries with the highest sales 2013
39
8409179981'0181'065
1'6682'0202'065
4'3807'550
0 2'000 4'000 6'000 8'000
NetherlandsDenmark
Spain (2012)Sweden
Austria (2011)Switzerland
ItalyUnited Kingdom
FranceGermany
Million euros
Europe: The ten countries with the largest markets for organic food and beverages 2013Source: OrganicDataNetwork Survey 2015 based on national data sources and FiBL-AMI survey 2015

www.fibl.org
Europe: The countries with the highest per-capita consumption adjusted by purchasing power 2013
40
23.825.226.827.7
32.032.332.7
51.563.4
83.785.186.4
103.9116.1
132.5139.5
0 50 100 150 200 250
SloveniaNorwayCroatia
ItalyFinland
BelgiumUnited Kingdom
NetherlandsFrance
LiechtensteinSweden
GermanyAustria
DenmarkLuxembourgSwitzerland
Per capita consumption in euros 2013
Europe: The countries with the highest per-capita consumption adjusted by purchasing power 2013Source: OrganicDataNetwork-FiBL-AMI Survey 2013
Euros per capita by purchaing powerEuros per capita
www.fibl.org
Articles about Europe in the 2015 Edition of "The World of Organic Agriculture"
› Organic Farming in EuropeHelga Willer amd Stephen Meredith
› Organic Farming and Market Development in EuropeHelga Willer and Diana Schaack
41

www.fibl.org
Latin America/Caribbean: Organic agricultural land by country 2013
42Source: FiBL-IFOAM Survey 2015

www.fibl.org
Latin America: Key figures 2013
› In Latin America, more than 200’000 producers managed 6.6 million hectares of agricultural land organically in 2013.
› This constitutes 15 percent of the world’s organic land and 1.1 percent of the regions agricultural land.
› The leading countries are Argentina (3.2 million hectares), Uruguay (0.9 million hectares), and Brazil (0.7 million hectares).
› The highest shares of organic agricultural land are in the Falkland Islands/Malvinas (36.3 percent), French Guiana (11.9 percent), and the Dominican Republic (9.3 percent).
43Source: FiBL-IFOAM Survey 2015

www.fibl.org
Latin America: Key figures 2013
› Most organic products from Latin American countries are sold on the European, North American or Japanese markets. Popular goods are especially those that cannot be produced in these regions, as well as off-season products.
› Thus, the development of robust local markets is still a major challenge, without which the sustainability of organic production cannot be achieved. Important crops are tropical fruits, grains and cereals, coffee, cocoa, sugar, and meats. Most organic food sales in the domestic markets of the countries occur in major cities.
44

www.fibl.org
Latin America/Caribbean: Distribution of organic agricultural land by country 2013
48%
14%
11%
8%
19%
Latin America/Caribbean: Distribution of organic agricultural land by country 2013 (total: 6.4 million hectares)Source: FiBL-IFOAM survey 2015
ArgentinaUruguay (2006)Brazil (2012)MexicoRest
45

www.fibl.org
Latin America and Caribbean: The ten countries with the largest organic areas 2013
46
33'621
42'781
62'274
180'609
388'448
403'212
501'364
705'233
930'965
3'191'255
0 1'000'000 2'000'000 3'000'000 4'000'000
Nicaragua (2009)
Ecuador
Paraguay
Dominican Republic
Peru
Falkland Islands (Malvinas)
Mexico
Brazil (2012)
Uruguay (2006)
Argentina
Hectares
Latin America and Caribbean: The ten countries with the largest organic area 2013Source: FiBL-IFOAM survey 2015

www.fibl.org
Latin America: The ten countries with the highest shares of organic agricultural land 2013
47
1.0%
1.0%
1.3%
1.8%
2.3%
2.3%
6.3%
9.3%
11.9%
36.3%
0% 5% 10% 15% 20% 25% 30% 35% 40%
Martinique (France)
Dominica (2011)
Belize
Peru
Argentina
Mexico
Uruguay (2006)
Dominican Republic
French Guiana (France)
Falkland Islands (Malvinas)
Latin America and Caribbean: The countries with the highest share of organic agricultural land 2013Source: FiBL-IFOAM survey 2015

www.fibl.org
Latin America: Development of organically managed agricultural land 2000-2013
48
3.914.54
5.75 5.965.22 5.06 4.95
5.59
7.24 7.66 7.546.86 6.81 6.61
0.0
2.5
5.0
7.5
10.0
2000 2001 2002 2003 2004 2005 2006 2007 2008 2009 2010 2011 2012 2013
Mill
ion
hect
ares
Latin America and Caribbean: Development of organic agricultural land 2000 to 2013Source: FiBL-IFOAM-SOEL 2002-2015

www.fibl.org
Latin America: Use of organic agricultural land 2013 (total: 6.6 million hectares)
49
Permanent grassland
66%
Permanent crops13%
Arable land crops
3%
No details18%
Latin America and Caribbean: Use of agricultural organic land 2013Source: FiBL-IFOAM Survey 2015; based on information from the private sector, certifiers, and governments.
Land use types 2013
11.5934.5235.2337.74
62.73
0 10 20 30 40 50 60 70
Industrial cropsOilseeds
SugarcaneCereals
Vegetables
Thousand hectares
Key arable crops
15.0516.81
117.78204.60
445.18
0 100 200 300 400 500
Citrus fruitCoconut
Sub./Tropical fruitCocoaCoffee
Thousand hectares
Key permanent crops

www.fibl.org
Articles about Latin America and the Caribbean in the 2015 Edition of "The World of Organic Agriculture"
› Organic Agriculture in Latin America and the CaribbeanPatricia Flores Escudero
50

www.fibl.org
North America: Organic agricultural land by country 2013
51Source: USDA and COTA 2015

www.fibl.org
Organic Agriculture in North America: Key figures 2013
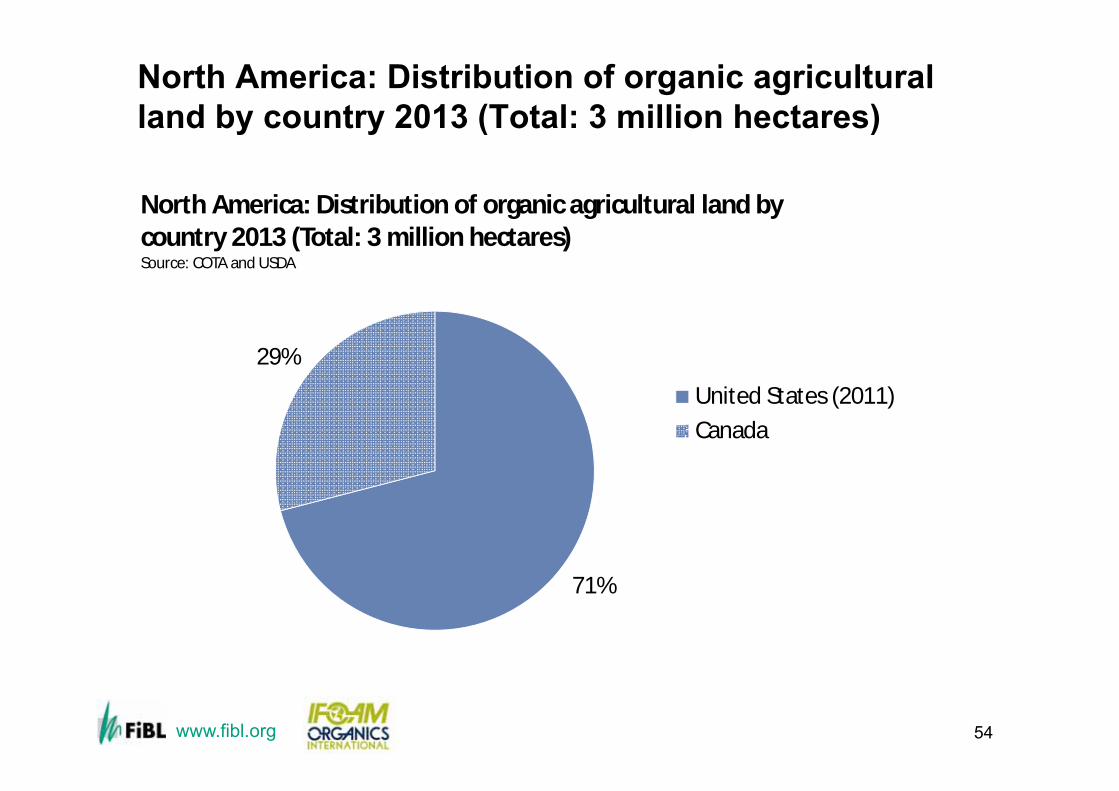
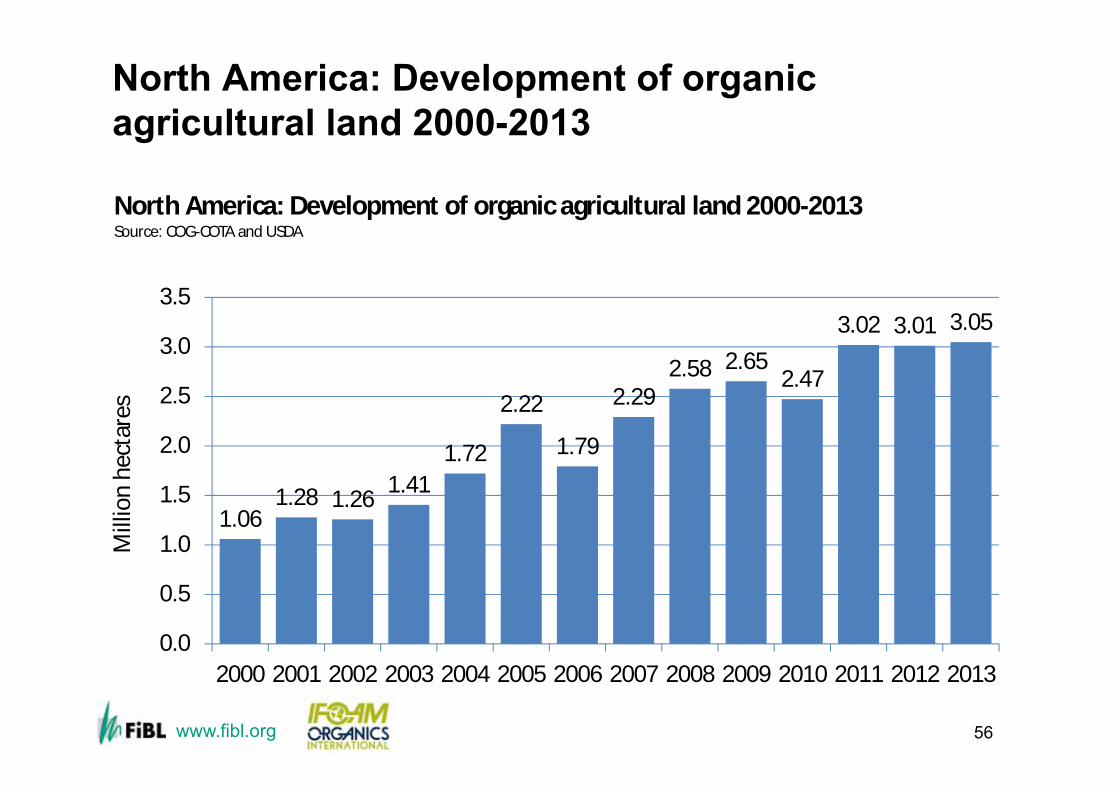
› In North America, 3 million hectares are managed organically, of these are two million in the United States and more than 0.8 million in Canada.
› This represents 0.7 percent of the total agricultural area in the region and 7 percent of the world’s organic agricultural land.
› In 2013, the organic market continued to grow in North America, reaching almost 27 billion euros. In Canada, the organic market grew by 10 percent in 2013, and in the United States the organic market grew by almost 11.5 percent. The United States is the largest single organic market in the world, and North America continues to be the continent with the largest organic market.
52

www.fibl.org
North America: Organic agricultural land 2013
53
869'239
2'178'471
0 500'000 1'000'000 1'500'000 2'000'000 2'500'000
Canada
United States of America(2011)
Hectares
Organic Agriculture in North America 2013Source: COTA and USDA
www.fibl.org
North America: Distribution of organic agricultural land by country 2013 (Total: 3 million hectares)
71%
29%
North America: Distribution of organic agricultural land by country 2013 (Total: 3 million hectares)Source: COTA and USDA
United States (2011)Canada
54

www.fibl.org
North America: Shares of organic agricultural land 2013
55
0.6%
1.3%
0.0% 0.2% 0.4% 0.6% 0.8% 1.0% 1.2% 1.4%
United States of America (2011)
Canada
North America: Organic share of total organic agricultural Land 2013Source: COTA and USDA
www.fibl.org
North America: Development of organic agricultural land 2000-2013
56
1.061.28 1.26 1.41
1.72
2.22
1.79
2.292.58 2.65
2.47
3.02 3.01 3.05
0.0
0.5
1.0
1.5
2.0
2.5
3.0
3.5
2000 2001 2002 2003 2004 2005 2006 2007 2008 2009 2010 2011 2012 2013
Mill
ion
hect
ares
North America: Development of organic agricultural land 2000-2013Source: COG-COTA and USDA

www.fibl.org
North America: Use of organic agricultural land 2013 (total: 3 million hectares)
57
Arable land crops43%
Permanent grassland
35%
Other agr. land7%
Permanent crops
2%
No details13%
North America: Land use in organic agriculture 2013Source: COTA and USDA
Land use types 2013
47.7563.21103.66
462.06624.65
0 500 1'000
Protein cropsVegetables
OilseedsGreen fodder
Cereals
Thousand hectares
Key arable crops
7.538.07
9.4615.99
19.32
0 10 20 30
Citrus fruitBerries
NutsGrapes
Temperate fruit
Thousand hectares
Key permanent crops

www.fibl.org
Articles about North America in the 2015 Edition of "The World of Organic Agriculture"
› 2014 Farm Bill was a Major Milestone for the U.S. Organic SectorBarbara Fitch Haumann
› CanadaMatthew Holmes and Marie-Eve Levert
58

www.fibl.org
Oceania: Organic agricultural land by country 2013
59FiBL-IFOAM Survey 2015

www.fibl.org
Organic agriculture in Oceania: Key figures 2013
› This region includes Australia, New Zealand, and the Pacific Islands. › Altogether, there are almost 23‘000 producers, managing 17.3 million
hectares. A growth of over 5 million hectares was reported in 2013. This increase should be attributed to an update of the Australian area data, where five million hectares more were reported, due to rangeland areas coming into organic production, after some years of no data updates.
› This constitutes 4.1 percent of the agricultural land in the area and almost 40 percent of the world’s organic land.
› Ninety-nine percent of the organic land in the region is in Australia (17.2 million hectares, 96 percent of which is extensive grazing land), followed by New Zealand (106’753 hectares), and Samoa (33’515 hectares).
› The highest shares of all agricultural land are in Samoa (11.8 percent), followed by French Polynesia (5.5 percent), Australia (4.2 percent) and Vanuatu (2.2 percent).
60FiBL-IFOAM Survey 2015

www.fibl.org
Oceania: Organic agricultural land 2013
61
20613981'3072'1642'4694'10620'93933'515106'753
17'150'000
0 5'000'000 10'000'000 15'000'000 20'000'000
Cook Islands (2012)Niue (2012)
TongaSolomon Islands (2012)
FijiFrench Polynesia
VanuatuPapua New Guinea
Samoa (2012)New Zealand (2012)
Australia
Hectares
Oceania: Organic agricultural land by country 2013Source: FiBL-IFOAM survey 2015

www.fibl.org
Oceania: Development of organic agricultural land 2000-2013
62
5.31
5.31 6.
25
11.3
0
12.1
8
11.8
1
12.4
3
12.0
7
12.1
1
12.1
5
12.1
5
12.1
9
12.1
6
17.3
2
0.02.04.06.08.0
10.012.014.016.018.020.0
2000 2001 2002 2003 2004 2005 2006 2007 2008 2009 2010 2011 2012 2013
Mill
ion
hect
ares
Oceania: Development of organic agricultural land 2000-2013Source: FiBL-IFOAM-SOEL 2002-2015

www.fibl.org
Oceania: Shares of organic agricultural land 2013
63
0.5%
0.7%
0.9%
1.2%
1.3%
1.6%
1.8%
2.2%
4.2%
5.5%
11.8%
0% 2% 4% 6% 8% 10% 12% 14%
Fiji
Cook Islands (2012)
New Zealand (2012)
Niue (2012)
Tonga
Solomon Islands (2012)
Papua New Guinea
Vanuatu
Australia
French Polynesia
Samoa (2012)
Oceania: Share of organic agricultural land 2013Source: FiBL-IFOAM survey 2015
www.fibl.org
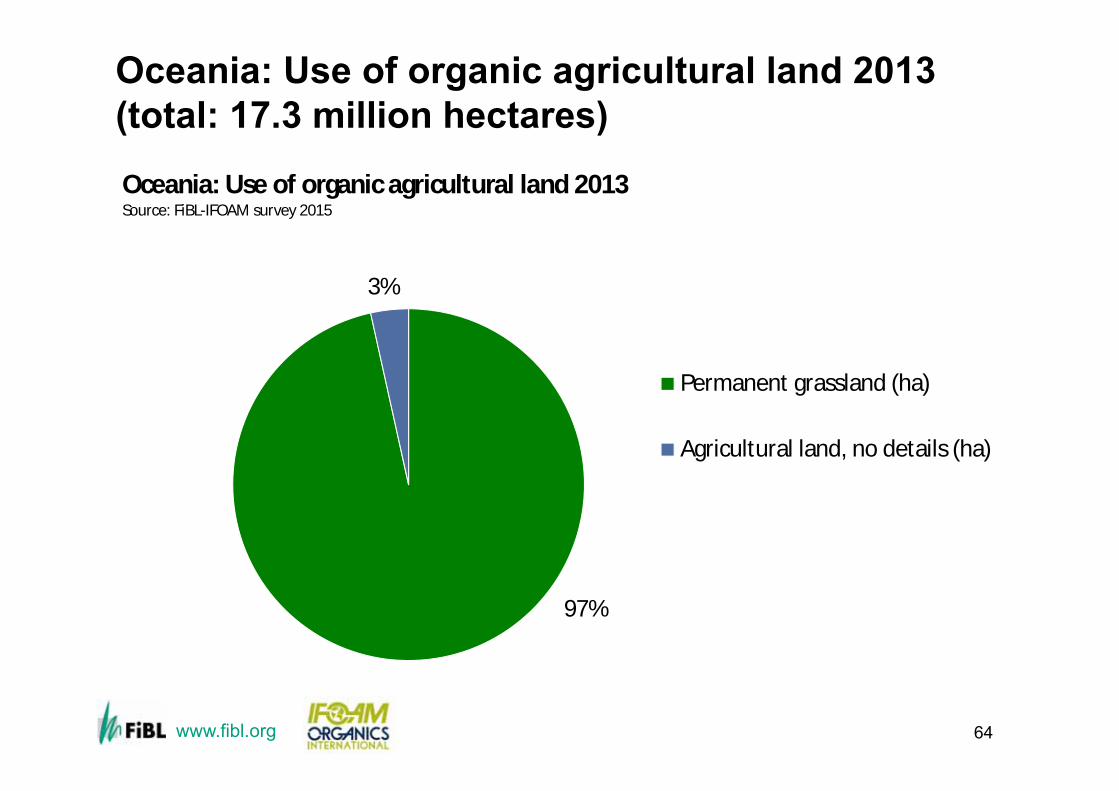
Oceania: Use of organic agricultural land 2013 (total: 17.3 million hectares)
97%
3%
Oceania: Use of organic agricultural land 2013Source: FiBL-IFOAM survey 2015
Permanent grassland (ha)
Agricultural land, no details (ha)
64

www.fibl.org
Articles about Oceania in the 2015 Edition of "The World of Organic Agriculture"
› Organic at all-time high in AustraliaAustralian Organic
› The Pacific IslandsKaren Mapusua
65

www.fibl.org
References and data sources
› FiBL* and IFOAM** (2015): Data on organic agriculture world-wide. In: FiBL& IFOAM (2015): The World of Organic Agriculture. Statistics and Emerging Trends. Frick and Bonn
› FiBL*, AMI*** and IFOAM**: Organic market data. In: FiBL& IFOAM (2015): The World of Organic Agriculture. Statistics and Emerging Trends. Frick and Bonn
› Willer, Helga and Julia Lernoud (2015): Current Statistics on Organic Agriculture Worldwide: Organic Area, Producers, Markets and Selected Crops. In: FiBL& IFOAM (2015): The World of Organic Agriculture. Statistics and Emerging Trends 2015. Frick and Bonn.
› For detailed data sources by country please check http://www.organic-world.net/statistics/statistics-data-sources.html?L=2
› *FiBL= Research Institute of Organic Agriculture, Switzerland; **IFOAM = International Federation of Organic Agriculture Movements, Germany; ***AMI = Agricultural Information Company, Germany
› More information at http://www.organic-world.net/yearbook/yearbook2015.html
66

www.fibl.org
More information
› More information (PDF, data sources, graphs) at http://www.organic-world.net/yearbook/yearbook2015.html
› ContactHelga WillerResearch Institute of Organic Agriculture (FiBL)5070 [email protected]
67

www.fibl.org
Disclaimer
› All of the results contained in this slide show have been compiled by the Research Institute of Organic Agriculture (FiBL) and the International Federation of Organic Agriculture Movements (IFOAM). However, the possibility of mistakes cannot be ruled out entirely. Therefore, they are not subject to any obligation and make no guarantees whatsoever regarding any of the statements or results in this work; neither do they accept responsibility or liability for any possible mistakes, nor for any consequences of actions taken by readers based on statements or advice contained therein.
› This document has been produced with the support of the Swiss State Secretariat for Economic Affairs (SECO), the International Trade Centre (ITC) and NürnbergMesse. The views expressed herein can in no way be taken to reflect the official opinions of SECO, ITC or NürnbergMesse.
› Some work for this publication was undertaken as part of the research project titled "Data network for better European organic market information" (OrganicDataNetwork). This project has received funding from the European Union’s Seventh Framework Programme for research, technological development and demonstration under grant agreement no 289376. The opinions expressed in this contribution are those of the authors and do not necessarily represent the views of the European Commission.
68


