
25030 SW Parkway Avenue, Suite 330 Wilsonville, OR 97070
E-Mail: [email protected] • Corporate Office: 503.570.7778
May 2017
Mountain View Fire Rescue Longmont, Colorado
ORGANIZATIONAL ASSESSMENT & MASTER PLAN REPORT
Operational & Management Assessment Mountain View Fire Rescue
i
Table of Contents
Acknowledgements ..................................................................................................................... iii
Executive Summary ..................................................................................................................... iv
Evaluation of Current Conditions .................................................................................................... 1
MVFR Organization Overview ........................................................................................................ 2
Governance ............................................................................................................................................... 4
Policy and Procedures ............................................................................................................................... 5
Organizational Design ............................................................................................................................... 6
Organizational Structure ........................................................................................................................... 6
Service Area and Infrastructure ................................................................................................................. 8
Financial Management and Analysis ....................................................................................................... 10
MVFR Management Components ................................................................................................. 37
Foundational Management Elements ...................................................................................................... 37
Management Documents and Processes................................................................................................. 40
Internal and External Communications ................................................................................................... 41
Record Keeping and Documentation ...................................................................................................... 43
Critical Issues .......................................................................................................................................... 44
Capital Assets & Capital Improvement Programs ........................................................................... 48
Facilities .................................................................................................................................................. 48
Apparatus ............................................................................................................................................... 60
Capital Replacement Planning ................................................................................................................ 61
Service Delivery & Performance ................................................................................................... 65
Service Demand Analysis ........................................................................................................................ 67
Resource Distribution Analysis ................................................................................................................ 76
Response Analysis ................................................................................................................................... 81
Resource Concentration Analysis ............................................................................................................ 88
Response Reliability ................................................................................................................................ 90
Planning for Fire Protection & EMS .............................................................................................. 93
Tactical (Pre-incident) Planning .............................................................................................................. 95
Operational Planning .............................................................................................................................. 96
Master Planning ...................................................................................................................................... 97
Strategic Planning ................................................................................................................................... 97
Emergency Management Planning ......................................................................................................... 98
Staffing & Personnel Management ............................................................................................. 100
Reports & Records ................................................................................................................................. 100
Compensation ........................................................................................................................................ 103

Operational & Management Assessment Mountain View Fire Rescue
ii
Disciplinary Process & Counseling Services ............................................................................................ 111
Administrative and Support Staffing ...................................................................................................... 113
Emergency Service Staffing ................................................................................................................... 117
Support Programs ..................................................................................................................... 121
Training Program ................................................................................................................................... 121
Training Facilities & Resources ............................................................................................................... 125
Summary Discussion ............................................................................................................................. 126
Prevention & Life-Safety Services .............................................................................................. 128
Organizational Structure ....................................................................................................................... 128
General Inspection Program .................................................................................................................. 129
Fire-Cause Determination & Investigation ............................................................................................. 131
Pre-Incident Planning ............................................................................................................................. 132
Fire Prevention & Life-Safety Programs ................................................................................................. 132
Emergency Medical Services ...................................................................................................... 136
The MVFR EMS Delivery System ............................................................................................................ 136
EMS Administration & Oversight ........................................................................................................... 137
Engine & Rescue Deployment ................................................................................................................ 139
EMS Service-Demand & Performance ................................................................................................... 140
HazMat Services Support & Response Capabilities ........................................................................150
Future System-Demand Projections ............................................................................................ 151
Population Growth Projections .............................................................................................................. 153
Service-Demand Projections .................................................................................................................. 156
Community Risk Assessment ................................................................................................................. 157
Future Delivery System Models .................................................................................................. 166
Recommended Long-Term Strategy ..................................................................................................... 166
Short and Mid-Term Strategies ............................................................................................................. 168
Conclusion ............................................................................................................................................. 172
Appendix A: Table of Figures ...................................................................................................... 173
Appendix B: Organizational Culture and Context At Mountain View Fire Rescue ........................... 178
A Report Supporting the MVFR Master Plan .......................................................................................... 178
Methods ................................................................................................................................................. 178
Key Findings ........................................................................................................................................... 179
Recommendations ................................................................................................................................. 183
Detailed Findings .................................................................................................................................. 184
Operational & Management Assessment Mountain View Fire Rescue
iii
ACKNOWLEDGEMENTS
Emergency Services Consulting International (ESCI) would like to acknowledge that without the assistance
and support of the Board of Directors, administrative staff and personnel of the Mountain View Fire Rescue,
this project could not have been successfully completed.
Board of Trustees
Scott Barcewski, Board President
Chad Christian, Secretary
Timothy Parker, Treasurer
Laura McConnell, Assistant Secretary/Treasurer
Agency Staff
David Beebe, Interim Fire Chief
Roger Rademacher, Assistant Chief
Keith Long, Assistant Chief
LuAnn Penfold, Fire Marshal
Doug Saba, Deputy Fire Marshal
Donna Mullison, Director of Finance
Melissa Meehan, HR Manager
Operational & Management Assessment Mountain View Fire Rescue
iv
EXECUTIVE SUMMARY
Emergency Services Consulting International (ESCI) was engaged by Mountain View Fire Rescue to
evaluate the services provided by the fire district. Specifically, the evaluation was to report on the level of
services compared to standards and best practices, assess financial practices, and gauge the district’s
current culture through surveys and interviews. In addition, ESCI was asked to review the comprehensive
plans of the cities served by the district and attempt to determine the department’s future outlook. This
Organizational Assessment and Master Plan will assist the department in future planning and provision of
comprehensive emergency services to the citizens of Mountain View. This report is organized to review
current conditions; projecting future growth and service demand; and finally make short, mid, and long-
term recommendations to the betterment of the district.
ESCI thanks the Mountain View Board of Directors, interim fire chief, staff members, officers, and
firefighters of the Mountain View Fire Rescue (MVFR) for their outstanding cooperation in the preparation
of this report. All involved were candid in their comments and provided a tremendous amount of essential
information.
Report Section I: Evaluation of Current Conditions
The analysis of current conditions is documented in beginning of the report, reviewing the MVFR
administration, governance, staffing, personnel management, service delivery, planning, support
programs, and capital assets. Each component of the evaluation includes an introductory explanation of the
subject area and discussion of desirable outcomes and identified best practices. Unique to this report was
an assessment of the thoughts and concerns of the MVFR personnel, and efforts were made to evaluate
this. ESCI accomplished this through both face-to-face interviews and a survey open to all members of the
organization. From these encounters with the personnel, a complete internal perspective of the district was
formed. The full report is located in Appendix B and recommendations for leadership are reflected in the
Recommendations section of this report.
Criteria used to evaluate fire departments has developed over many years. These gauges include relevant
guidelines from national accreditation criteria, the National Fire Protection Association (NFPA) standards,
Center for Public Safety Excellence, federal and state mandates for fire and Emergency Medical Services
(EMS) systems, and generally accepted best practices within the fire and EMS industry.
The evaluation of current conditions offers the district a detailed assessment of existing fire department
operations and provides the ESCI project team with a snapshot in time, the basis from which the balance of
the report is developed. It is important to note that the fire district has continued to make progressive
changes since the initial evaluation thus some of the recommendations may already have been completed.
The following discusses some of the key findings:
Operational & Management Assessment Mountain View Fire Rescue
v
Current and Future Service Demand
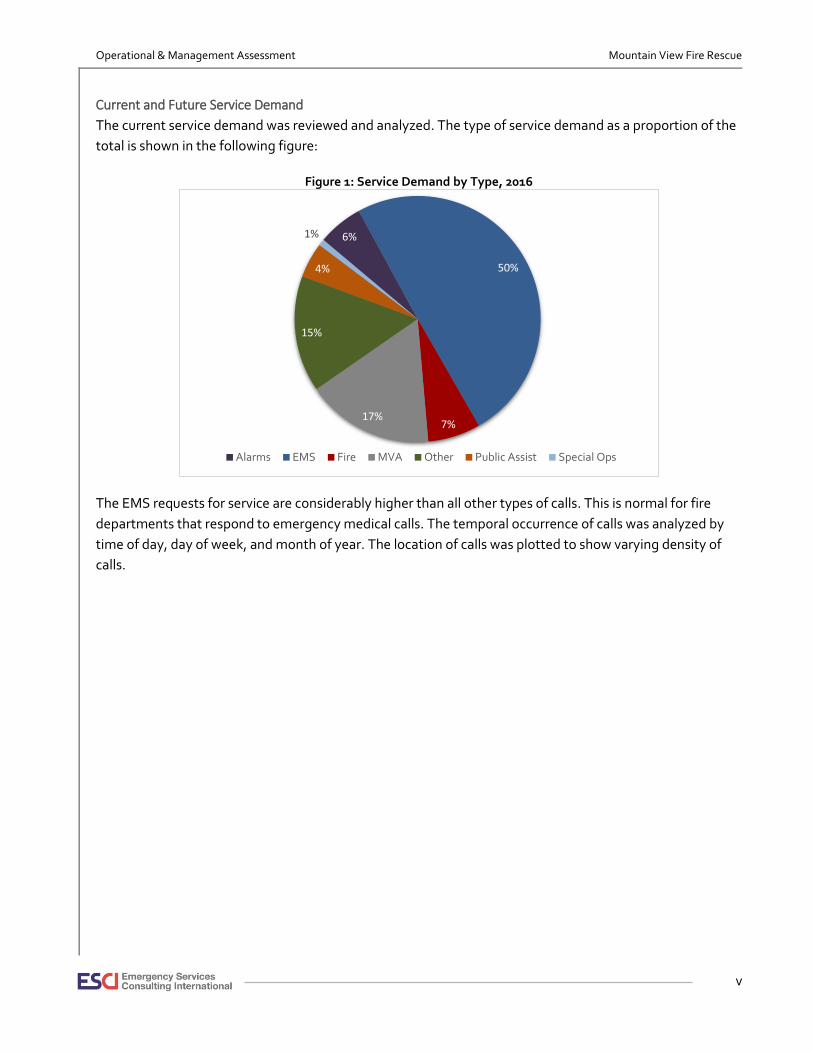
The current service demand was reviewed and analyzed. The type of service demand as a proportion of the
total is shown in the following figure:
Figure 1: Service Demand by Type, 2016
The EMS requests for service are considerably higher than all other types of calls. This is normal for fire
departments that respond to emergency medical calls. The temporal occurrence of calls was analyzed by
time of day, day of week, and month of year. The location of calls was plotted to show varying density of
calls.
6%
50%
7%17%
15%
4%
1%
Alarms EMS Fire MVA Other Public Assist Special Ops
Operational & Management Assessment Mountain View Fire Rescue
vi
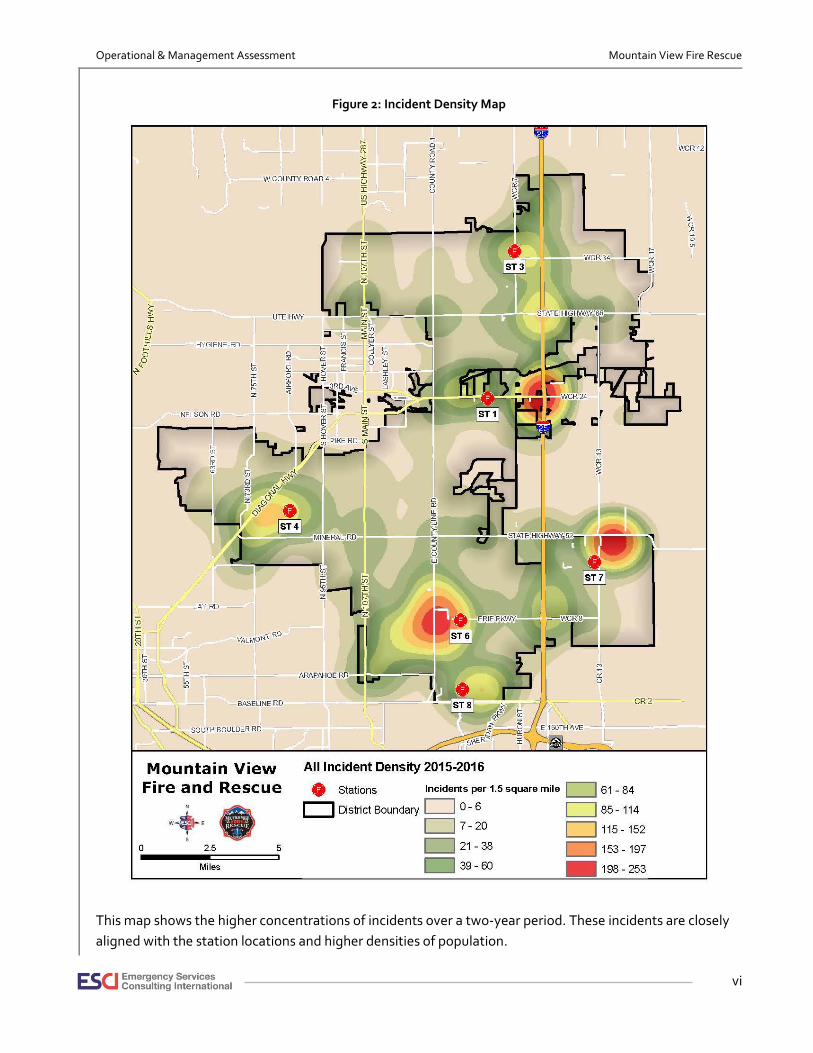
Figure 2: Incident Density Map
This map shows the higher concentrations of incidents over a two-year period. These incidents are closely
aligned with the station locations and higher densities of population.
Operational & Management Assessment Mountain View Fire Rescue
vii
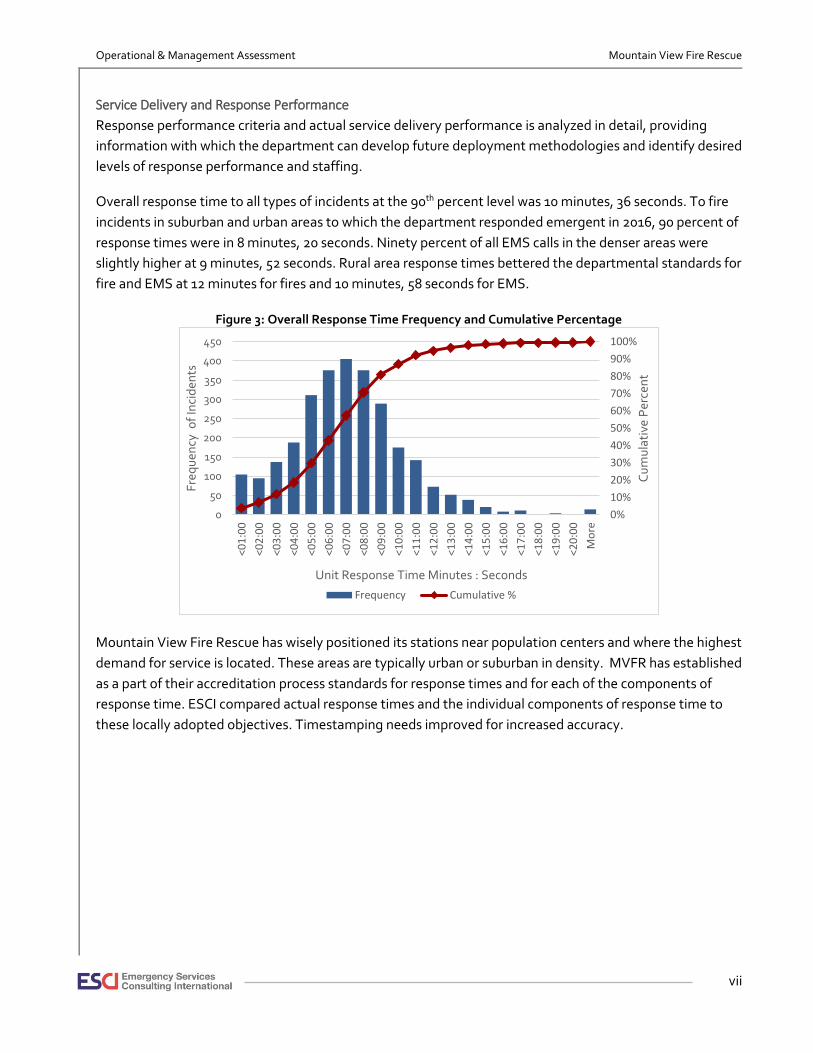
Service Delivery and Response Performance
Response performance criteria and actual service delivery performance is analyzed in detail, providing
information with which the department can develop future deployment methodologies and identify desired
levels of response performance and staffing.
Overall response time to all types of incidents at the 90th percent level was 10 minutes, 36 seconds. To fire
incidents in suburban and urban areas to which the department responded emergent in 2016, 90 percent of
response times were in 8 minutes, 20 seconds. Ninety percent of all EMS calls in the denser areas were
slightly higher at 9 minutes, 52 seconds. Rural area response times bettered the departmental standards for
fire and EMS at 12 minutes for fires and 10 minutes, 58 seconds for EMS.
Figure 3: Overall Response Time Frequency and Cumulative Percentage
Mountain View Fire Rescue has wisely positioned its stations near population centers and where the highest
demand for service is located. These areas are typically urban or suburban in density. MVFR has established
as a part of their accreditation process standards for response times and for each of the components of
response time. ESCI compared actual response times and the individual components of response time to
these locally adopted objectives. Timestamping needs improved for increased accuracy.
0%
10%
20%
30%
40%
50%
60%
70%
80%
90%
100%
0
50
100
150
200
250
300
350
400
450
<01
:00
<02
:00
<03
:00
<04
:00
<05
:00
<06
:00
<07
:00
<08
:00
<09
:00
<10
:00
<11
:00
<12
:00
<13
:00
<14
:00
<15
:00
<16
:00
<17
:00
<18
:00
<19
:00
<20
:00
Mo
re
Cu
mu
lati
ve P
erce
nt
Fre
qu
ency
of
Inci
den
ts
Unit Response Time Minutes : Seconds
Frequency Cumulative %

Operational & Management Assessment Mountain View Fire Rescue
viii
ESCI analyzed calls for service geographically and projected travel time with computer software. The
comparison of projected and actual travel time history as shown in the next figure.
Figure 4: Call Location and Travel Time Predicted and Actual
Operational & Management Assessment Mountain View Fire Rescue
ix
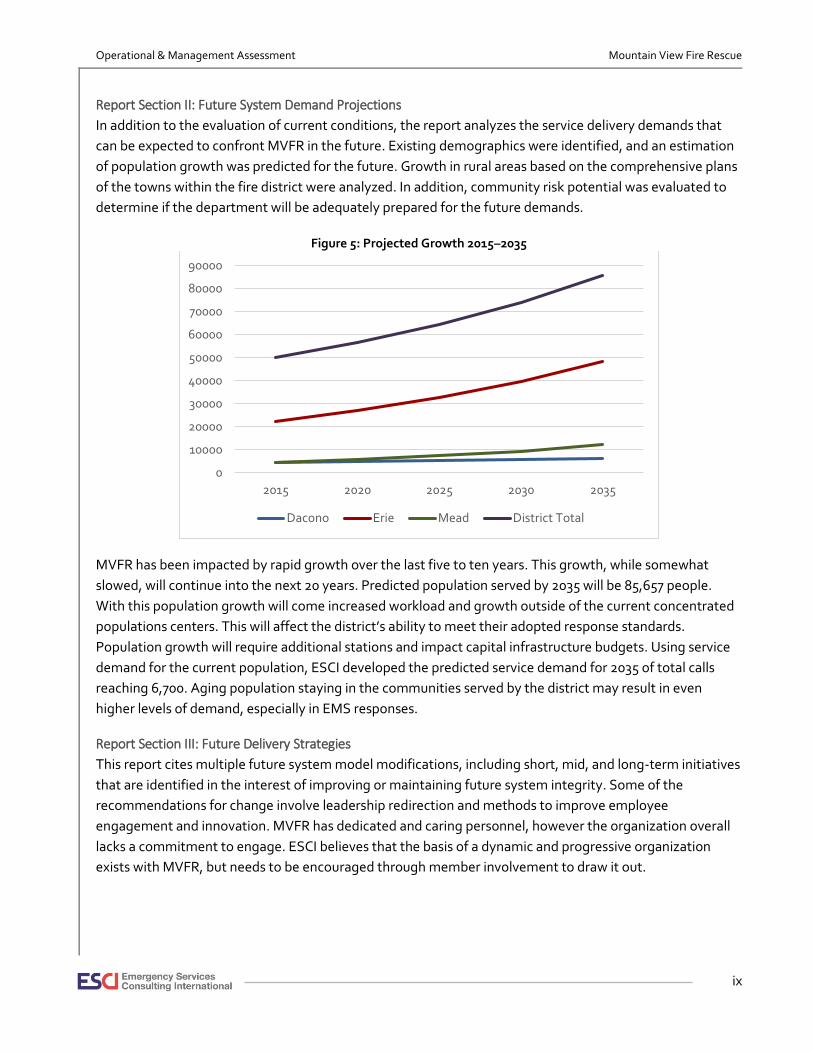
Report Section II: Future System Demand Projections
In addition to the evaluation of current conditions, the report analyzes the service delivery demands that
can be expected to confront MVFR in the future. Existing demographics were identified, and an estimation
of population growth was predicted for the future. Growth in rural areas based on the comprehensive plans
of the towns within the fire district were analyzed. In addition, community risk potential was evaluated to
determine if the department will be adequately prepared for the future demands.
Figure 5: Projected Growth 2015–2035
MVFR has been impacted by rapid growth over the last five to ten years. This growth, while somewhat
slowed, will continue into the next 20 years. Predicted population served by 2035 will be 85,657 people.
With this population growth will come increased workload and growth outside of the current concentrated
populations centers. This will affect the district’s ability to meet their adopted response standards.
Population growth will require additional stations and impact capital infrastructure budgets. Using service
demand for the current population, ESCI developed the predicted service demand for 2035 of total calls
reaching 6,700. Aging population staying in the communities served by the district may result in even
higher levels of demand, especially in EMS responses.
Report Section III: Future Delivery Strategies
This report cites multiple future system model modifications, including short, mid, and long-term initiatives
that are identified in the interest of improving or maintaining future system integrity. Some of the
recommendations for change involve leadership redirection and methods to improve employee
engagement and innovation. MVFR has dedicated and caring personnel, however the organization overall
lacks a commitment to engage. ESCI believes that the basis of a dynamic and progressive organization
exists with MVFR, but needs to be encouraged through member involvement to draw it out.
0
10000
20000
30000
40000
50000
60000
70000
80000
90000
2015 2020 2025 2030 2035
Dacono Erie Mead District Total
Operational & Management Assessment Mountain View Fire Rescue
1
EVALUATION OF CURRENT CONDITIONS
Emergency Services Consulting International (ESCI) begins this report with an Evaluation of Current
Conditions, which provides a comprehensive appraisal of the Mountain View Fire Protection District
(referred to herein as “MVFPD,” “MVFR,” “Mountain View Fire Rescue,” and “the district”) as it was found
upon ESCI’s completion of fieldwork and data collection in March of 2017.
ESCI bases this evaluation on data provided by the agency and collected during ESCI’s fieldwork. The
information is mirrored against a combination of Colorado State laws and regulations, National Fire
Protection Association (NFPA) standards, Commission on Fire Accreditation International (CFAI) self-
assessment criteria, health and safety requirements, federal and state mandates relative to emergency
services, and generally accepted best practices within the emergency services community, as well as the
experience of ESCI’s consultants.1
Each section in the following report provides the reader with general information about that element, as
well as observations and analyses of any significant issues or conditions that are pertinent. Supporting
explanation is provided below each survey section, where needed. The evaluation begins with a baseline
review of the agency’s organizational composition.
1 The CFAI organization is now a subsection of the Center for Public Safety Excellence (CPSE) but maintains its prime function of accrediting fire agencies.
Operational & Management Assessment Mountain View Fire Rescue
2
MVFR ORGANIZATION OVERVIEW
The Organizational Overview component provides a summary of the agency’s composition, discussing its
configuration and the services that it provides. ESCI combined data provided by the Mountain View Fire
Rescue management staff, as well as both internal and external stakeholders, with information collected
during fieldwork to develop the following overview.
The purpose of this section is two-fold. First, it verifies the accuracy of baseline information along with
ESCI’s understanding of the agency’s composition. This provides the foundation from which the
Organizational Evaluation is developed. Secondly, the overview serves as a reference for the reader who
may not be fully familiar with the details of the district’s operations. Where appropriate, ESCI includes
recommended modifications to current observations based on industry standards and best practices.
Mountain View Fire Protection District is not a municipal fire department, but rather is established as a
Special District, as outlined in Colorado Revised Statutes Title 32. The district boundaries include the
communities of Dacono, Erie, Mead, Niwot, and unincorporated portions of Boulder and Weld Counties.
The following figure reflects the study area.

Operational & Management Assessment Mountain View Fire Rescue
3
Figure 6: Mountain View Fire Protection District Study Area
The fire district’s service area encompasses 184 square miles, based on client provided data. The service
area population consists of approximately 50,072, living in approximately 17,000 residential occupancies
and 660 businesses.
Operational & Management Assessment Mountain View Fire Rescue
4
Governance The very basis of any service provided by governmental or quasi-governmental agencies lies within the
policies that give that agency the responsibility and authority upon which to act. In most governmental
agencies, including MVFR, those policies lie within the charters, ordinances, and other governing
documents adopted by the agency. The following figure provides a general overview of the district’s
governance and lines of authority.
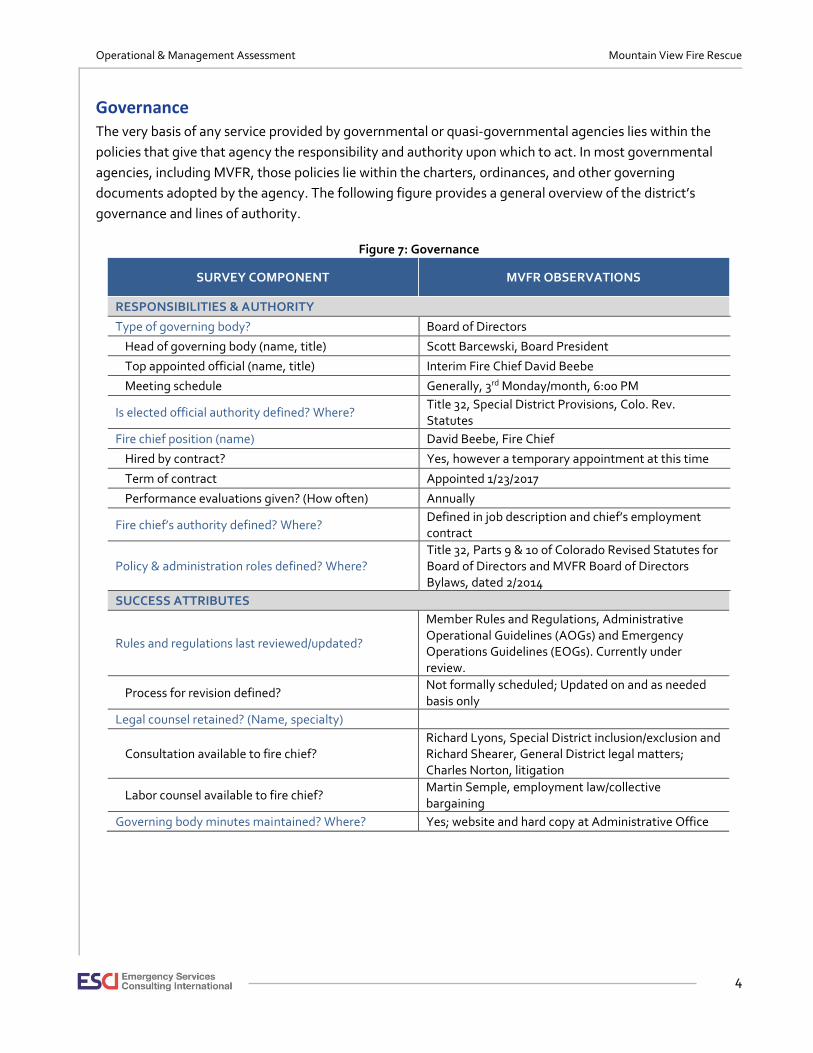
Figure 7: Governance
SURVEY COMPONENT MVFR OBSERVATIONS
RESPONSIBILITIES & AUTHORITY
Type of governing body? Board of Directors
Head of governing body (name, title) Scott Barcewski, Board President
Top appointed official (name, title) Interim Fire Chief David Beebe
Meeting schedule Generally, 3rd Monday/month, 6:00 PM
Is elected official authority defined? Where? Title 32, Special District Provisions, Colo. Rev. Statutes
Fire chief position (name) David Beebe, Fire Chief
Hired by contract? Yes, however a temporary appointment at this time
Term of contract Appointed 1/23/2017
Performance evaluations given? (How often) Annually
Fire chief’s authority defined? Where? Defined in job description and chief’s employment contract
Policy & administration roles defined? Where? Title 32, Parts 9 & 10 of Colorado Revised Statutes for Board of Directors and MVFR Board of Directors Bylaws, dated 2/2014
SUCCESS ATTRIBUTES
Rules and regulations last reviewed/updated?
Member Rules and Regulations, Administrative Operational Guidelines (AOGs) and Emergency Operations Guidelines (EOGs). Currently under review.
Process for revision defined? Not formally scheduled; Updated on and as needed basis only
Legal counsel retained? (Name, specialty)
Consultation available to fire chief? Richard Lyons, Special District inclusion/exclusion and Richard Shearer, General District legal matters; Charles Norton, litigation
Labor counsel available to fire chief? Martin Semple, employment law/collective bargaining
Governing body minutes maintained? Where? Yes; website and hard copy at Administrative Office

Operational & Management Assessment Mountain View Fire Rescue
5
Discussion
Although it is referred to routinely as Mountain View Fire Rescue, the agency is formally identified as the
Mountain View Fire Protection District. The agency is organized and titled as a Fire Protection District,
established under the guidance of Colorado Revised Statute, Title 32, as a Special District.
The MVFR governance configuration is typical of Colorado Fire Districts, operating under the direction of a
five-member Board of Directors (BOD or board). The board hires the fire chief, who is charged with
managing the day-to-day operation of the district.
Policy and Procedures ESCI found that the district possesses the requisite fundamental attributes upon which a successful
organization is established. This consists of a set of Board of Director Bylaws, member Rules and
Regulations, Administrative Operational Guidelines, and Emergency Operations Guidelines (EOGs). Those
documents are appropriate; however, while some are currently undergoing review, all the foundational
documents are not subject to regularly scheduled examination and revision. Because they lay the
foundation upon which the fire district operates, it is essential that those fundamental documents be
current.
Fire Chief Position
Like all fire protection districts, MVFR employs a fire chief. Commendably, the district board also provides
the fire chief with an annual performance evaluation. The chief is hired under an employment contract;
however, the position is currently filled by a temporary appointment. ESCI recommends that, when the
position is filled, an employment agreement or contract between the board and the fire chief be reviewed
to assure that both parties gain a clear understanding of what is required of them. ESCI recommends that
performance criteria be a part of the agreement as well as wages, benefits, and, if desired, incentives for
meeting or exceeding performance goals or penalties for not meeting them. This document should be
drawn up by an attorney as a legally enforceable contract for both parties.
RECOMMENDATIONS:
• Assure that the fire chief’s employment contract clearly defines roles, responsibilities, and expectations on both sides.
• Review and update the district’s foundational documents including the Board of Director Bylaws, member Rules and Regulations, Administrative Operational Guidelines, and Emergency Operations Guidelines (EOGs) on a regularly scheduled basis.
Operational & Management Assessment Mountain View Fire Rescue
6
Organizational Design The structural design of an emergency services agency is vitally important to its ability to deliver service in
an efficient and timely manner while providing the necessary level of safety and security to the members of
the organization—whether career, paid-on-call, or volunteer. During an emergency, an individual’s ability
to supervise multiple personnel is reduced thus industry standards recommend a span of control of four to
six personnel under stressed situations. This is a recommendation carried forward from military history and
has shown to be effective in emergency service situations. In addition, employees tend to be more efficient
when they know to whom they report and have a single point of contact for supervision and direction.
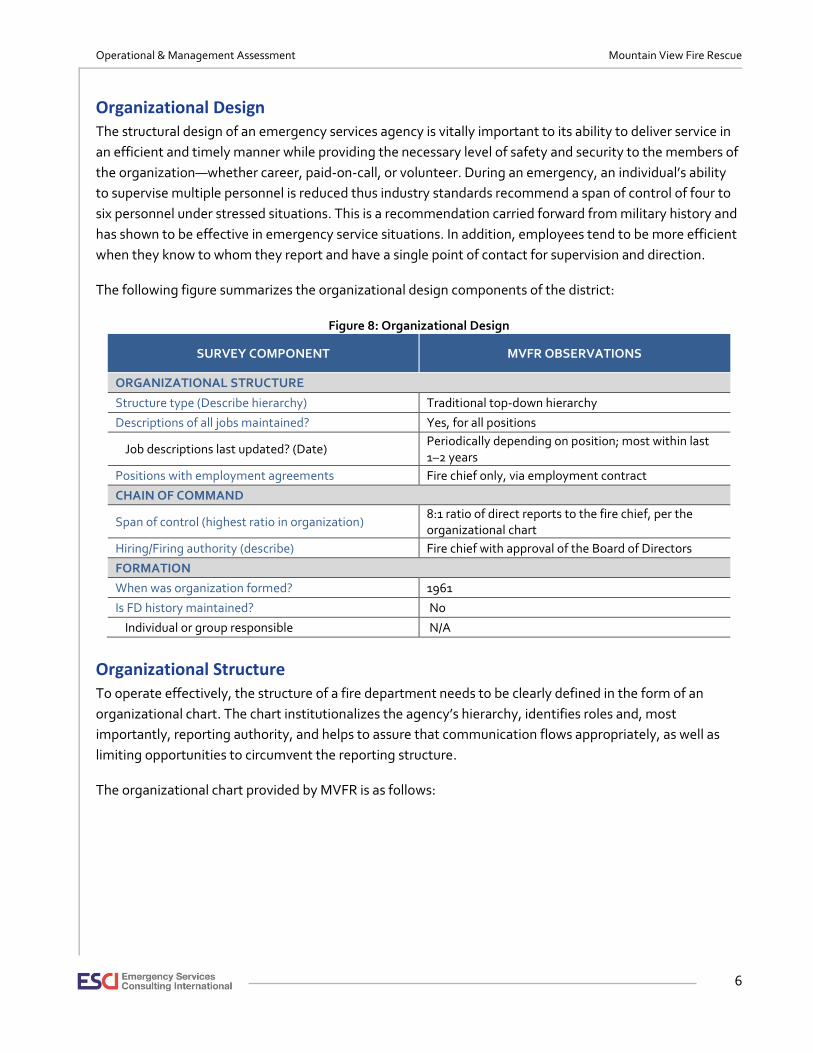
The following figure summarizes the organizational design components of the district:
Figure 8: Organizational Design
SURVEY COMPONENT MVFR OBSERVATIONS
ORGANIZATIONAL STRUCTURE
Structure type (Describe hierarchy) Traditional top-down hierarchy
Descriptions of all jobs maintained? Yes, for all positions
Job descriptions last updated? (Date) Periodically depending on position; most within last 1–2 years
Positions with employment agreements Fire chief only, via employment contract
CHAIN OF COMMAND
Span of control (highest ratio in organization) 8:1 ratio of direct reports to the fire chief, per the organizational chart
Hiring/Firing authority (describe) Fire chief with approval of the Board of Directors
FORMATION
When was organization formed? 1961
Is FD history maintained? No
Individual or group responsible N/A
Organizational Structure To operate effectively, the structure of a fire department needs to be clearly defined in the form of an
organizational chart. The chart institutionalizes the agency’s hierarchy, identifies roles and, most
importantly, reporting authority, and helps to assure that communication flows appropriately, as well as
limiting opportunities to circumvent the reporting structure.
The organizational chart provided by MVFR is as follows:
Operational & Management Assessment Mountain View Fire Rescue
7
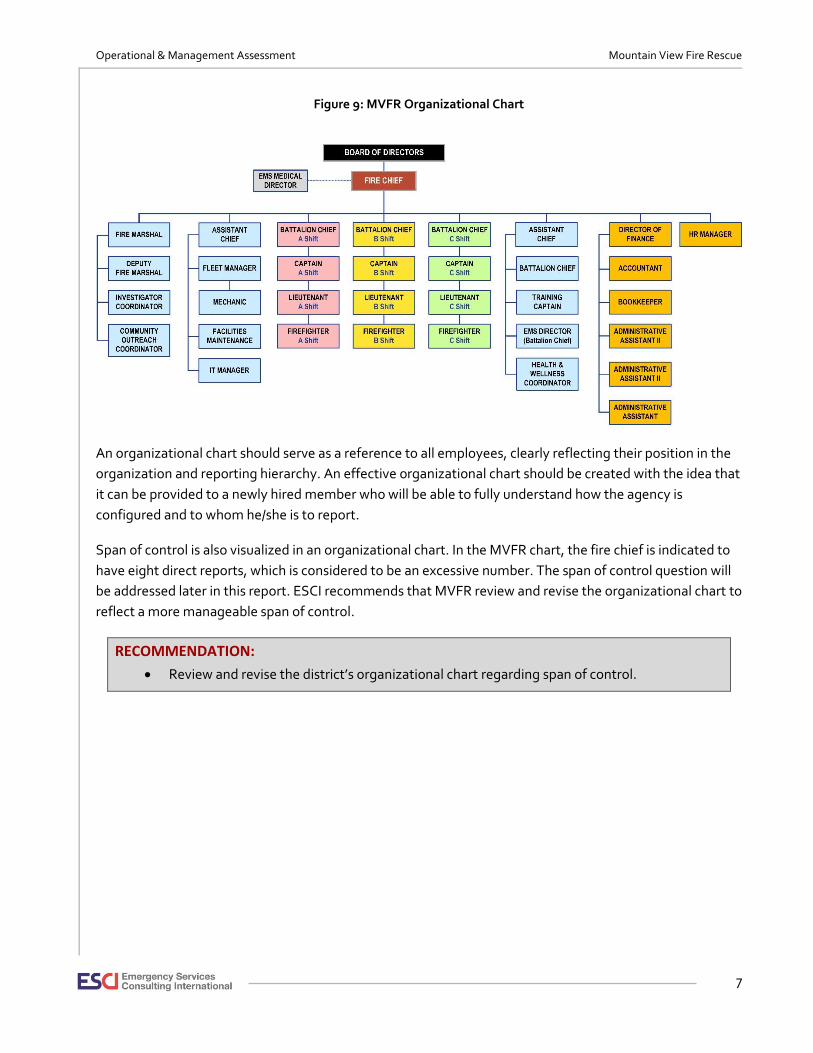
Figure 9: MVFR Organizational Chart
An organizational chart should serve as a reference to all employees, clearly reflecting their position in the
organization and reporting hierarchy. An effective organizational chart should be created with the idea that
it can be provided to a newly hired member who will be able to fully understand how the agency is
configured and to whom he/she is to report.
Span of control is also visualized in an organizational chart. In the MVFR chart, the fire chief is indicated to
have eight direct reports, which is considered to be an excessive number. The span of control question will
be addressed later in this report. ESCI recommends that MVFR review and revise the organizational chart to
reflect a more manageable span of control.
RECOMMENDATION:
• Review and revise the district’s organizational chart regarding span of control.

Operational & Management Assessment Mountain View Fire Rescue
8
Service Area and Infrastructure The size and composition of a fire district’s service area affects the type and number of personnel, fire
stations, and vehicles that are needed to provide services efficiently. Sometimes complex decisions need to
be made regarding the deployment strategies employed to properly position resources based on land area,
geography, risk, and similar factors. Following is a summary of the MVFR service area and infrastructure
resources.
Figure 10: Service Area and Infrastructure
SURVEY COMPONENT MVFR OBSERVATIONS
AGENCY DESCRIPTION
Agency type (district, municipality, etc.) Special District
Area in square miles 184
Headquarters location (physical address) 3561 N. Stagecoach Road, Longmont, CO 80504
Number of fire stations 8 facilities in total; however only six are operational, staffed fire stations
Other facilities Administration, Maintenance, Training/Wellness referred to as Station 10, not staffed with response personnel
Emergency vehicles (number, type)
Engine 8
Engine, reserve 1
Ladder truck 1
Ladder, reserve 0
EMS unit (ALS, BLS, 1st Responder) 3
EMS unit, reserve 4
Command Vehicles 2
Boat/Water craft 1
Tenders/Brush 9
ISO rating 2/2Y
Date of most recent rating May 26, 2015
Discussion
The district has been able to deploy people and apparatus from a six staffed fire stations, addressing a 184-
square mile coverage area while balancing the needs of providing effective coverage with what resources
are available. It is noted that the district identifies four facilities as stations, Station 2, 5, 9, and 10. Stations
2 and 5 are storage facilities only, Station 9 is a vehicle maintenance facility, and Station 10 is a training and
wellness facility. The non-response facilities that are identified as stations should not be included in
deployment planning or Insurance Services Office reporting.
Operational & Management Assessment Mountain View Fire Rescue
9
The district’s continual test will be to make prudent staffing and facility placement decisions—including the
consideration to build new stations in the future—based on multiple factors including risk exposure,
response times, access challenges, deployment, community expectations, and fire department capacity.
Such decisions are difficult given MVFR’s financial considerations. Placing, equipping, and staffing fire
stations will be an ongoing challenge for the district. ESCI will provide a detailed assessment of current
service delivery and effectiveness with these factors in mind in the Service Delivery and Performance
section of this report.
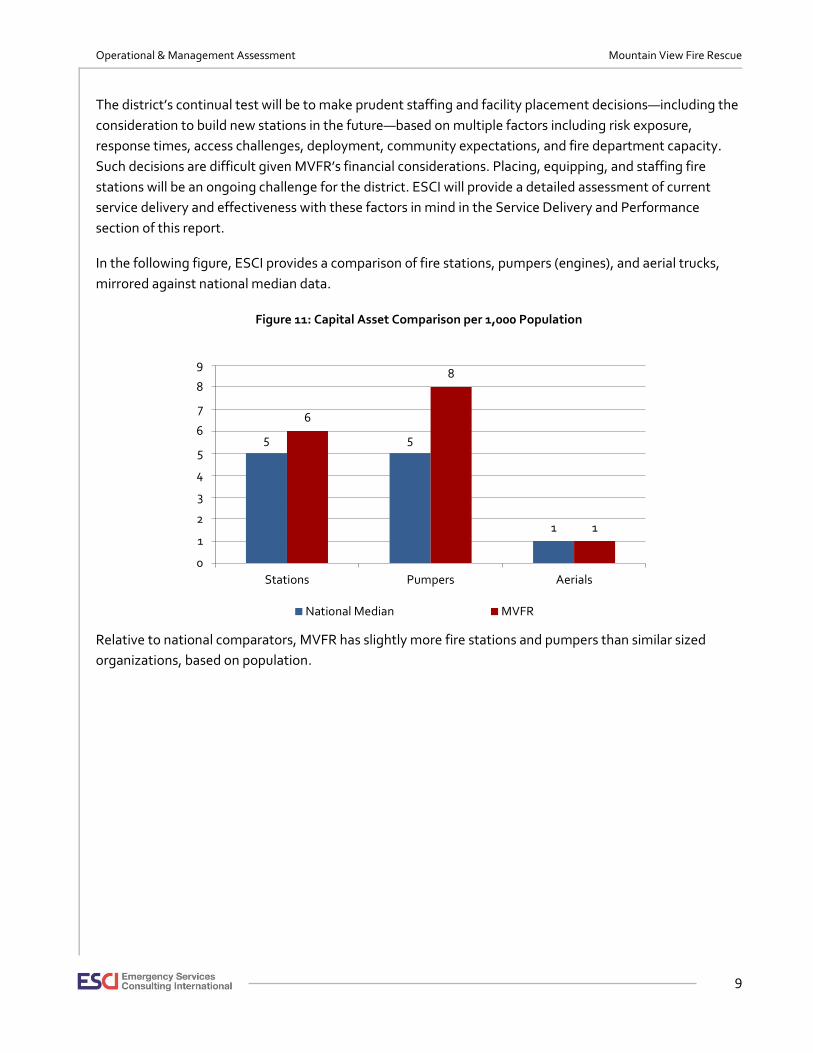
In the following figure, ESCI provides a comparison of fire stations, pumpers (engines), and aerial trucks,
mirrored against national median data.
Figure 11: Capital Asset Comparison per 1,000 Population
Relative to national comparators, MVFR has slightly more fire stations and pumpers than similar sized
organizations, based on population.
5 5
1
6
8
1
0
1
2
3
4
5
6
7
8
9
Stations Pumpers Aerials
National Median MVFR

Operational & Management Assessment Mountain View Fire Rescue
10
Financial Management and Analysis Considerable financial information and background data was provided to ESCI by staff of the Mountain
View Fire Rescue (MVFR), which was reviewed in detail along with various Comprehensive Annual Financial
Reports (CAFRs) and annual budget books. This data has enabled ESCI to develop the following discussion
providing key stakeholders with historical, current, and future viewpoints of MVFR’s financial picture.
Current Conditions
MVFR is an 83-person career-staffed department augmented by one volunteer firefighter and two part-paid
firefighters, that provides traditional fire rescue services from eight strategically placed fire stations. The
district operates on a modified accrual basis for all four fund types: General Fund, Capital Reserve Fund,
Fiduciary (Pension) Fund, and Debt Service Fund. MVFR operates on a calendar year basis. The district
operates on zero-bonded and lease debt.
The following figure provides a general overview of the district’s financial authority elements:
Figure 12: Fiscal Management Table
SURVEY COMPONENT CLIENT AGENCY INFORMATION
FINANCE OVERVIEW
Designated fiscal year? January 1 through December 31 (Calendar Year)
Current year assessed property value $1,290,476,827 (CY 2017)
Current year FD general operating fund budget $17,189,400
Percent of City General Fund (if municipality) N/A
FD general fund property tax levy (if district) 11.747
Levy rate (5-year history, plus current year) 11.747 since 2009
Levy collection rate, expected vs actual (5-year
history, plus current year)
100% vs.100.1% (2015); 100% vs. 99.84% (2014);
100% vs. 98.98% (2013); 100% vs. 98.52% (2012)
Unaudited 2016 = 100% vs. 100.34%
Outstanding bonds, fire department None
Bond levy rate (principal and interest), expiration
date of bond payments N/A
Other tax levies/fees (include specific purpose) None
Levy rate None
BUDGETARY CONTROLS
Budget officer (Name) Tonya Olson
Budget development process
What is the role of elected officials? Oversight
What is the role of administration? Compile all data from department
heads/management team
What is the role of management team? Provide department budget information
What is the role of staff? Provide support
What is the role of the community? Provide support and accountability

Operational & Management Assessment Mountain View Fire Rescue
11
SURVEY COMPONENT CLIENT AGENCY INFORMATION
Budget adoption process
Describe budget approval process (give key dates as
applicable)
Under review; previously department heads provide
budget info to Budget Officer who provides all info to
Chief for final approval. Preliminary budget to Board
on or before 10/15; final budget to Board for approval
between 12/10 and 12/14; approved budget due to
counties and state 12/15.
Describe funding approval process Unknown
Financial control officer
Financial report (include previous five year annual
Comprehensive Annual Financial Report (CAFR), if
applicable)
Audits available
Financial review Ongoing throughout month by Finance Director;
Monthly for Board of Directors
Auditor (include previous five year annual audits)
Robert Feis, CPA and Company
Basis of accounting Modified accrual
Purchasing
Describe purchasing policy
Request purchase order from Finance Director; review
of budget to determine if (1) item is budgeted and (2)
if within budget amount. If so, Purchase Order is
issued; if not, refer to Chief for approval.
Is there an FD central supplies/logistics? Each Station Captain able to order supplies through
Amazon
Are there joint agreements/ventures? None existing
Are there outstanding leases? Station 2/Valley Drive
BUDGET
Operating budgetary funds $17M (2017P)
Reserve funds (reserve for cash forward, restricted for
capex, etc. including reserve guidelines used) Capital Reserve Fund, $4,748,267 (2017P)
Revenue funds General Operating/General Fund
Enterprise funds None
Adopted budget (line item revenue by object code) 2017
Adopted budget (line item expenditures by object code) and categorized below
Personnel Services $12.8M
Operating Services $752K
Operating Commodities
Other Operating $2.5M
Capital outlay
Debt Service $4.7M
DEBT
Bonded debt Fully retired in 2008
Capital lease Zero debt – paid off in 2016

Operational & Management Assessment Mountain View Fire Rescue
12
SURVEY COMPONENT CLIENT AGENCY INFORMATION
Unfunded liability
Pension fund $397,564 (2017P)
Workers’ compensation claims No
REVENUE
Tax levy 11.747
Limitations (cite statute) No
Service contracts No
Grants No
Recent awards Energy Impact Grants, AFG
Outstanding applications No
Fundraising
Foundation Yes
Volunteer association No
Fees for service
Billing for fire response Wildland
Inspection fee Yes; and plan review fees
Hazardous materials Yes
Recovery outside of jurisdiction Wildland
Airport/port fee(s) No
Event stand-by charges Yes
Ambulance service collection(s)
Percentage collected (latest fiscal year)
Collection fee(s)
Annual billing by payor category for previous five
years and current adopted
Annual revenue received by payor category for
previous five years and current adopted
6% of collected amounts
Operational & Management Assessment Mountain View Fire Rescue
13
Local Economic Profile
Community level data for the study area suggest the local economy has fully recovered from the 2008–
2009 recession. Current data presents an optimistic outlook on the local economy with increased
population growth, rising employment levels, increased real estate transactions and values, and modest
inflation trends.
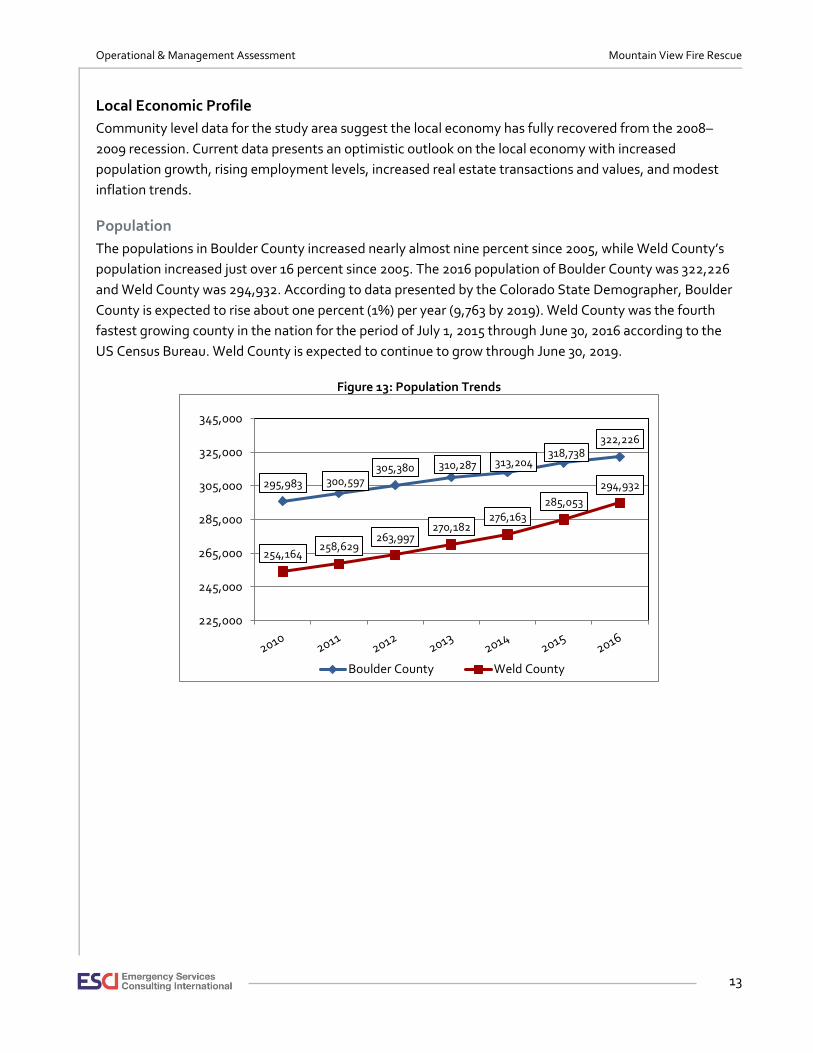
Population
The populations in Boulder County increased nearly almost nine percent since 2005, while Weld County’s
population increased just over 16 percent since 2005. The 2016 population of Boulder County was 322,226
and Weld County was 294,932. According to data presented by the Colorado State Demographer, Boulder
County is expected to rise about one percent (1%) per year (9,763 by 2019). Weld County was the fourth
fastest growing county in the nation for the period of July 1, 2015 through June 30, 2016 according to the
US Census Bureau. Weld County is expected to continue to grow through June 30, 2019.
Figure 13: Population Trends
295,983 300,597305,380 310,287 313,204
318,738322,226
254,164258,629
263,997270,182
276,163
285,053
294,932
225,000
245,000
265,000
285,000
305,000
325,000
345,000
Boulder County Weld County
Operational & Management Assessment Mountain View Fire Rescue
14
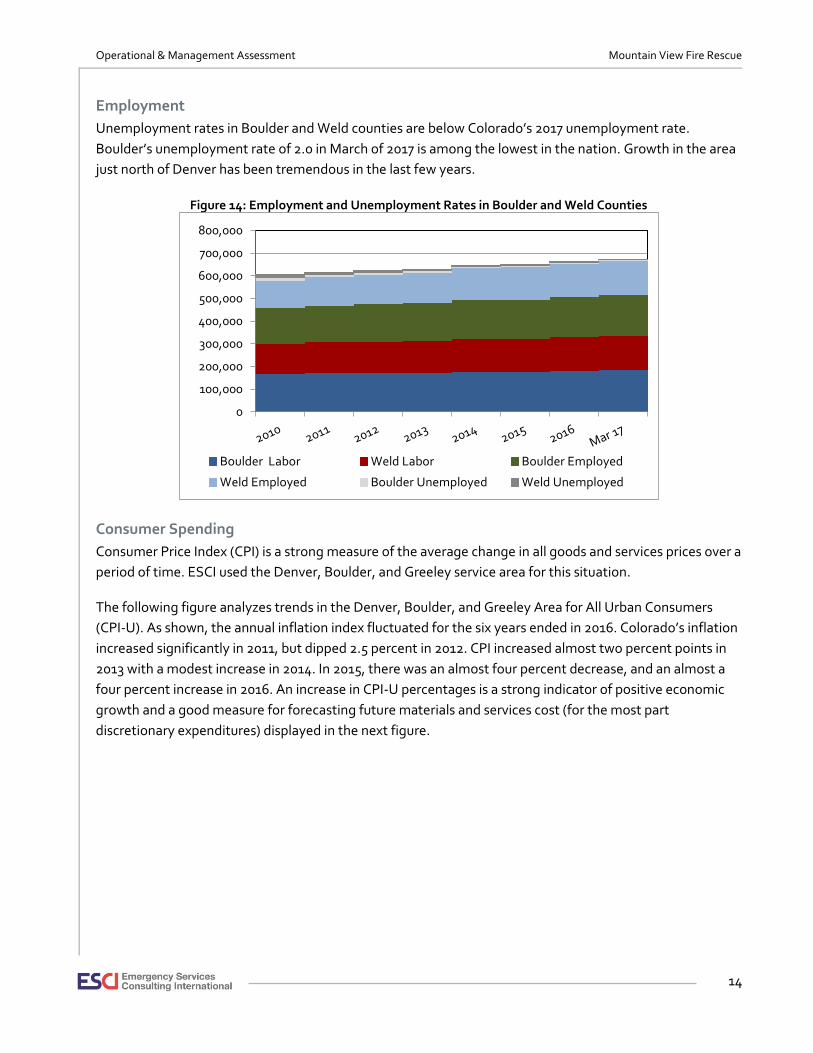
Employment
Unemployment rates in Boulder and Weld counties are below Colorado’s 2017 unemployment rate.
Boulder’s unemployment rate of 2.0 in March of 2017 is among the lowest in the nation. Growth in the area
just north of Denver has been tremendous in the last few years.
Figure 14: Employment and Unemployment Rates in Boulder and Weld Counties
Consumer Spending
Consumer Price Index (CPI) is a strong measure of the average change in all goods and services prices over a
period of time. ESCI used the Denver, Boulder, and Greeley service area for this situation.
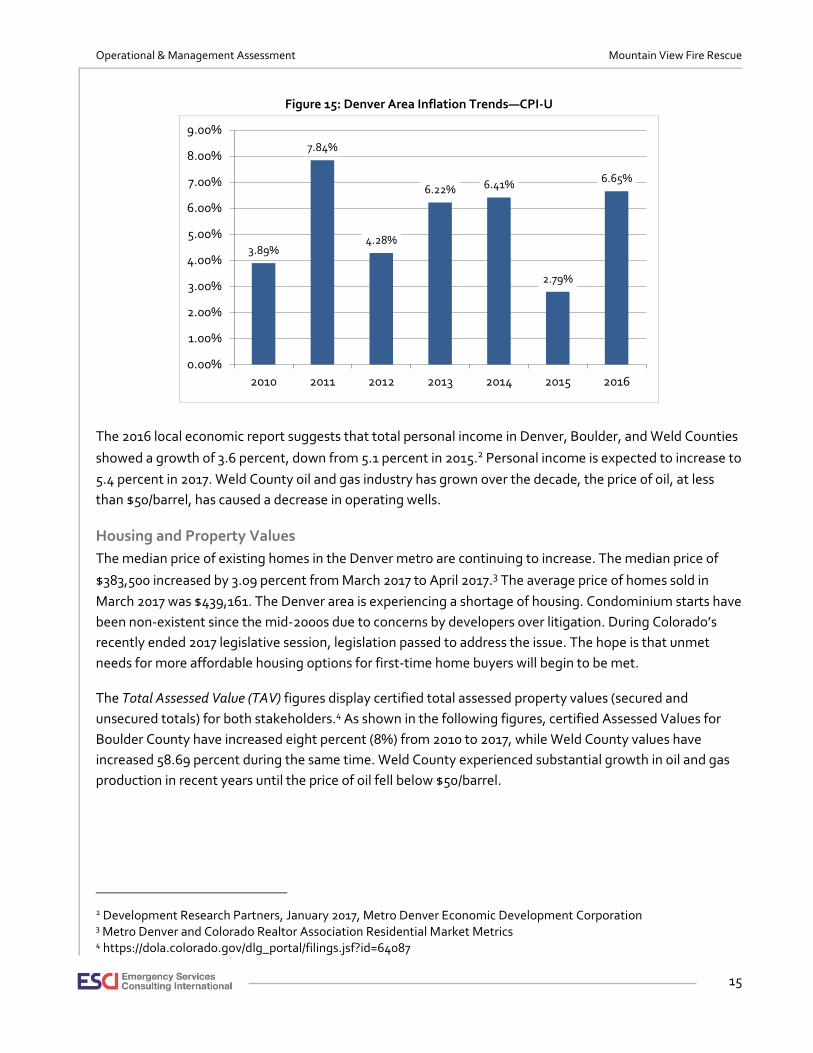
The following figure analyzes trends in the Denver, Boulder, and Greeley Area for All Urban Consumers
(CPI-U). As shown, the annual inflation index fluctuated for the six years ended in 2016. Colorado’s inflation
increased significantly in 2011, but dipped 2.5 percent in 2012. CPI increased almost two percent points in
2013 with a modest increase in 2014. In 2015, there was an almost four percent decrease, and an almost a
four percent increase in 2016. An increase in CPI-U percentages is a strong indicator of positive economic
growth and a good measure for forecasting future materials and services cost (for the most part
discretionary expenditures) displayed in the next figure.
0
100,000
200,000
300,000
400,000
500,000
600,000
700,000
800,000
Boulder Labor Weld Labor Boulder Employed
Weld Employed Boulder Unemployed Weld Unemployed
Operational & Management Assessment Mountain View Fire Rescue
15
Figure 15: Denver Area Inflation Trends—CPI-U
The 2016 local economic report suggests that total personal income in Denver, Boulder, and Weld Counties
showed a growth of 3.6 percent, down from 5.1 percent in 2015.2 Personal income is expected to increase to
5.4 percent in 2017. Weld County oil and gas industry has grown over the decade, the price of oil, at less
than $50/barrel, has caused a decrease in operating wells.
Housing and Property Values
The median price of existing homes in the Denver metro are continuing to increase. The median price of
$383,500 increased by 3.09 percent from March 2017 to April 2017.3 The average price of homes sold in
March 2017 was $439,161. The Denver area is experiencing a shortage of housing. Condominium starts have
been non-existent since the mid-2000s due to concerns by developers over litigation. During Colorado’s
recently ended 2017 legislative session, legislation passed to address the issue. The hope is that unmet
needs for more affordable housing options for first-time home buyers will begin to be met.
The Total Assessed Value (TAV) figures display certified total assessed property values (secured and
unsecured totals) for both stakeholders.4 As shown in the following figures, certified Assessed Values for
Boulder County have increased eight percent (8%) from 2010 to 2017, while Weld County values have
increased 58.69 percent during the same time. Weld County experienced substantial growth in oil and gas
production in recent years until the price of oil fell below $50/barrel.
2 Development Research Partners, January 2017, Metro Denver Economic Development Corporation 3 Metro Denver and Colorado Realtor Association Residential Market Metrics 4 https://dola.colorado.gov/dlg_portal/filings.jsf?id=64087
3.89%
7.84%
4.28%
6.22% 6.41%
2.79%
6.65%
0.00%
1.00%
2.00%
3.00%
4.00%
5.00%
6.00%
7.00%
8.00%
9.00%
2010 2011 2012 2013 2014 2015 2016

Operational & Management Assessment Mountain View Fire Rescue
16
Figure 16: Boulder County, Total Assessed Value (TAV)
Figure 17: Weld County, Total Assessed Value (TAV)
In Colorado, properties are re-evaluated and reassessed every two years. The latest values were evaluated
as of June 30, 2016. Those values will be used in the estimations and assessments for the years 2018 and
2019. Colorado’s governing law for residential assessment is located in the Colorado Constitution.
The Gallagher amendment, passed by voters in 1982, states that Colorado residential properties contribute
45 percent of the total property tax revenue of the state. Commercial properties contribute 55 percent.
Commercial properties are always assessed at 29 percent of the current fair market value.
$320,000,000
$330,000,000
$340,000,000
$350,000,000
$360,000,000
$370,000,000
$380,000,000
$390,000,000
$400,000,000
$410,000,000
$420,000,000
Boulder County
$0
$100,000,000
$200,000,000
$300,000,000
$400,000,000
$500,000,000
$600,000,000
$700,000,000
$800,000,000
$900,000,000
$1,000,000,000
Weld County
Operational & Management Assessment Mountain View Fire Rescue
17
In 1992 Colorado voters also passed the Colorado Taxpayer Bill of Rights, also known as the TABOR
amendment. That amendment prohibits tax increases without a vote of the people living or owning
property within a specific jurisdiction. Currently, when the residential assessment rate needs to go down,
the state property tax administrator—along with the State Board of Equalization—makes the adjustment
without a vote of the people. Conversely, if the residential assessment needs to go up, then a vote of
Colorado taxpayers is required.
Colorado’s residential assessment rate has not been adjusted since 2003 when it was lowered to 7.96
percent of the assessed value of the property. In 2017, the residential assessment rate will be lowered to 7.2
percent. Between 2017 and 2003, some two-year periods required an upward adjustment on the residential
assessment rate. Those rate increases did not occur so the 2017 assessment rate adjustment will be the first
one in over a decade. The difference between 7.96 percent and 7.2 percent is slightly over a 10 percent
decrease in taxable assessment.
Colorado’s Fire Protection Districts are dependent on property taxes. MVFPD is no different. While MVFPD
will receive an increase in revenue in 2018 and 2019 because of increased property value, it loses some
revenue due to the reduction in the assessment rate.
Revenues
An analysis of departmental historical revenues and expenses for the fire district was completed to help
identify relevant financial trends, strengths and weaknesses, and to lay the groundwork for the financial
scenario presented later in this section of the report. The district is actually comprised of four separate
budgets; the operations side (General Fund); Capital Reserve Fund; Pension Fund (Fiduciary Fund); and a
Debt Service Fund.
In order to provide staff and elected officials with a comprehensive perspective of the fire district and yet to
account for revenue and expense as required by law, the following section includes separate analyses of the
various funds and their respective fund balances/reserves.
The historical analysis helps illustrate how the district funds its services—where the money comes from and
where it goes. Historical budget data for the district was provided by staff and was supplemented with a
review of past audits and historical budget records. The historical analysis should provide administration
and elected officials with a solid basis upon which to evaluate recommendations and develop sustainable
future policy. The data provided by staff was comprehensive and presented in exceptional condition.
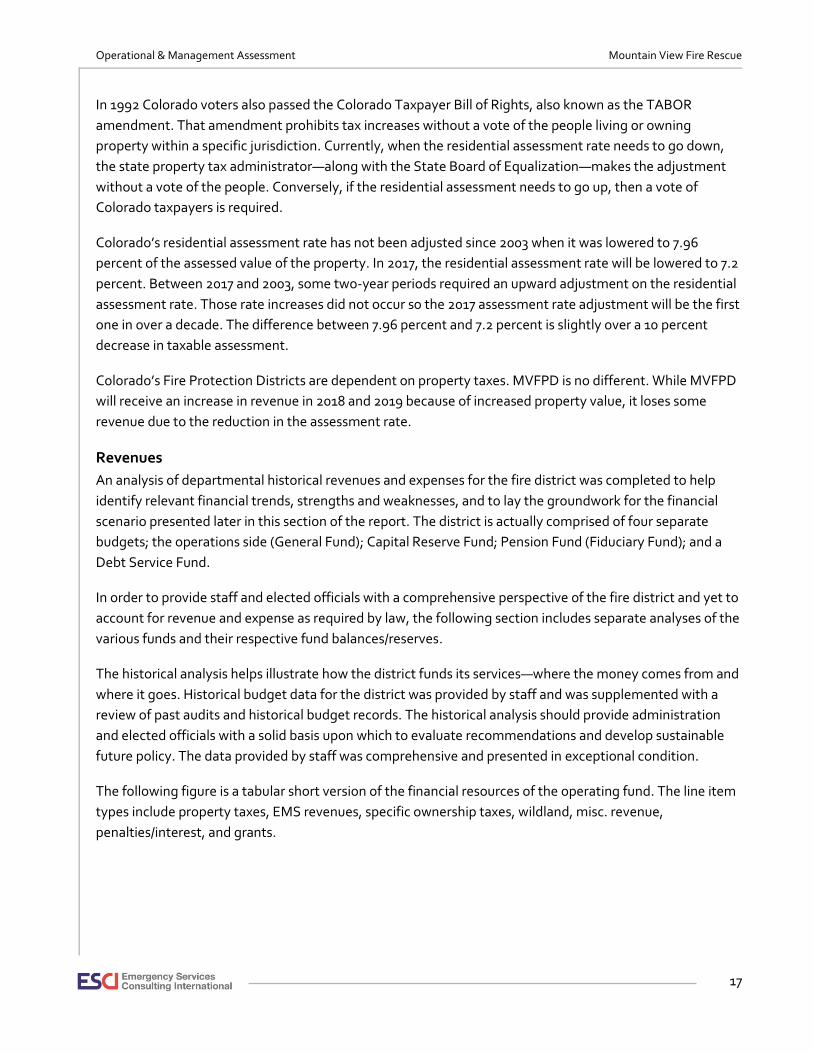
The following figure is a tabular short version of the financial resources of the operating fund. The line item
types include property taxes, EMS revenues, specific ownership taxes, wildland, misc. revenue,
penalties/interest, and grants.
Operational & Management Assessment Mountain View Fire Rescue
18
Figure 18: Mountain View Fire District, Fiscal Years 2010–2017
The following figure graphically compares actual property taxes versus levied taxes and the collection rate
for the district. As displayed, there were only two years (2012 and 2013) where collection rates were just
below 100 percent, which is still within expected collection rates for comparable districts.
Figure 19: General Fund Property Tax Collection, Levied Amount and Collection Rate, 2011–2017
As shown, the district levied approximately $4.9 M more than in 2010. This is likely due to a $419 M in
assessed values on properties, which is a strength for the district. Despite the increases in assessed
valuations and a stagnant mil value, the district is also feeling the effects of variations in the oil and gas
industry.
Property and Specific Ownership Taxes. Property and specific ownership taxes comprise anywhere from
87 to 93 percent of the district’s 2010–2017 budgets. The district has experienced an overall increase in
property tax revenues in since 2010, which is a strength. From 2010 to 2017, the district realized a $4.5 M
increase (or 42 percent change) in property tax revenues, while Specific Ownership taxes increased
$309,317 from 2010 to 2017 (52 percent change).
Financial Resources
By Type
AV - 870,757,484 916,027,397 986,630,367 971,305,742 946,394,511 1,357,256,011 1,290,476,827
Levied $ - 10,228,788 10,760,574 11,589,947 11,409,929 11,117,296 15,943,686 15,159,230
Collection Rate - 99.6% 98.3% 98.5% 100.0% 99.8% 100.2% 100.0%
Mil rate 11.747 11.747 11.747 11.747 11.747 11.747 11.747 11.747
GF Beginning Reserve Balance 2,160,145 2,693,176 3,149,402 3,363,413 3,517,794 3,491,486 3,766,410 3,795,428
CAP Beginning Reserve Balance 2,947,744 4,860,856 5,591,267 4,111,482 4,031,256 3,154,031 3,501,425 4,109,791
Pension + Debt Beginning Reserve Balance 2,469,185 2,611,886 2,473,645 2,583,896 2,780,773 2,787,660 2,629,320 2,510,375
Property taxes 10,675,094 10,190,652 10,582,474 11,410,512 11,409,917 11,094,055 15,969,029 15,159,230
EMS Revenue (MV/JRA/ADJ) 850,856 879,778 887,013 948,421 944,031 778,348 843,645 914,300
Specific ownership taxes 595,483 614,601 724,102 702,749 829,602 699,722 876,000 904,800
Wildland 206,115 326,184 685,407 421,133 225,869 654,283 490,000 98,400
Misc. Revenue 114,862 120,039 112,760 324,889 251,466 170,814 131,075 94,670
Penalties & Interest 30,083 25,220 19,924 17,277 11,820 13,870 31,399 18,000
Grants - - - - - - 40,864 -
General Fund Revenue Total 12,472,493$ 12,156,474$ 13,011,680$ 13,824,981$ 13,672,705$ 13,411,092$ 18,382,012$ 17,189,400$
Capital Reserve Revenue Total 2,925,365$ 1,830,228$ 2,233,793$ 2,493,599$ 1,648,447$ 996,525$ 4,926,503$ 2,649,654$
Pension + Debt Service Total 439,622$ 168,655$ 405,355$ 481,599$ 302,352$ 142,249$ 207,117$ 211,639$
Grand Total 15,837,480$ 14,155,357$ 15,650,828$ 16,800,179$ 15,623,504$ 14,549,866$ 23,515,632$ 20,050,693$
2016 Expected 2017 Proposed2010 Actual 2011 Actual 2012 Actual 2013 Actual 2014 Actual 2015 Actual
100%
98%98%
100%100%
100% 100%
97.0%
97.5%
98.0%
98.5%
99.0%
99.5%
100.0%
100.5%
$0
$5,000,000
$10,000,000
$15,000,000
$20,000,000
$25,000,000
$30,000,000
$35,000,000
Levied $
Property taxes
Collection Rate

Operational & Management Assessment Mountain View Fire Rescue
19
Nationally, the housing market appears to be stabilizing, at least to the point where another major decline
is unlikely over the next few years, which is a positive indicator for the district. Despite increases in property
taxes, specific ownership taxes are effected by the oil and gas production. While there appears to be some
instability in the oil/gas market, the trends in revenue collection continue increase linearly.
The following figure shows (graphically) increases along with linear trend lines.
Figure 20: Property and Specific Ownership Taxes, 2010–2017
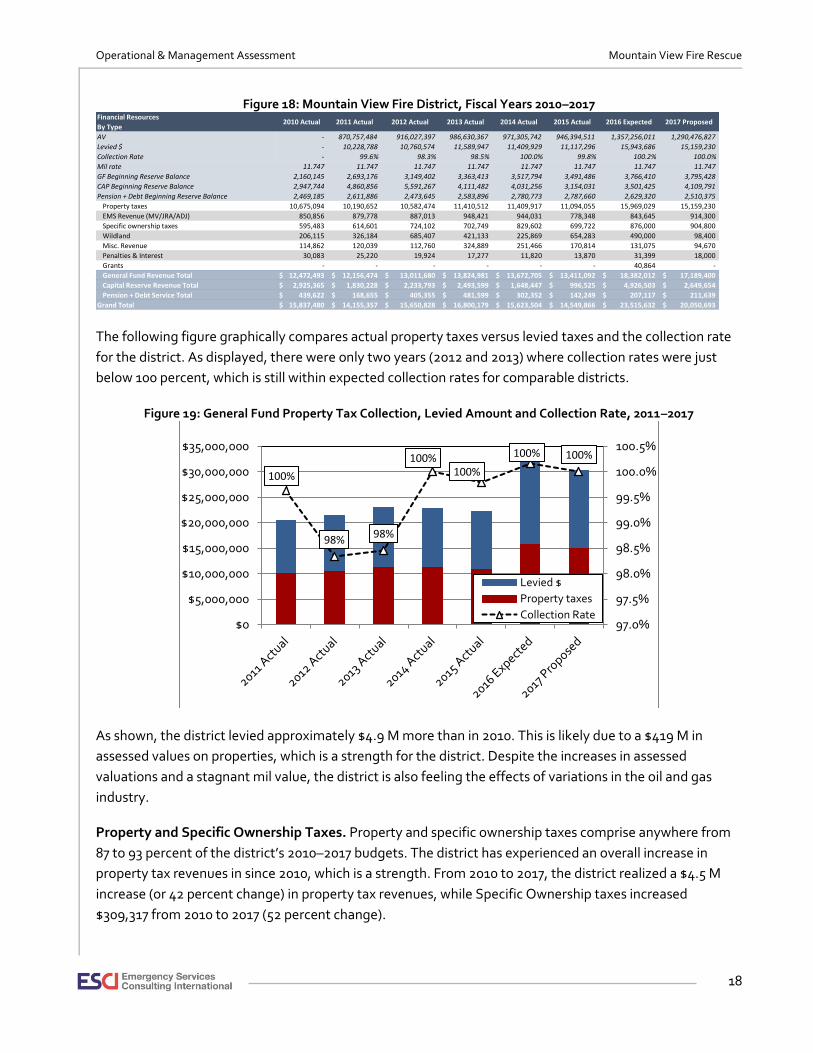
EMS and Wildland Revenues. Combined, EMS and wildland comprise anywhere from 6 to 12 percent of
the district’s 2010–2017 budgets. The district has experienced an increase in EMS revenues since 2010,
despite a decrease from 2014 to 2015 due to the termination of the JRA agreement. Despite the agreement
termination, the district realized a $63,444 increase (7 percent change) in EMS revenues from 2010 to 2017.
However, if you notice in the following figure, the linear trend is downward.
During the same period, wildland revenues have been more volatile. These revenues decreased $107,715
from 2010 to 2017 (-52 percent change). Like EMS revenues, they as well trend downward when viewed as a
linear trend.
The following figure shows (graphically) yearly variations along with declining linear trend lines.
-
100,000
200,000
300,000
400,000
500,000
600,000
700,000
800,000
900,000
1,000,000
$0
$2,000,000
$4,000,000
$6,000,000
$8,000,000
$10,000,000
$12,000,000
$14,000,000
$16,000,000
$18,000,000
Property taxes Specific ownership taxes
Operational & Management Assessment Mountain View Fire Rescue
20
Figure 21: EMS and Wildland Revenues, 2010–2017
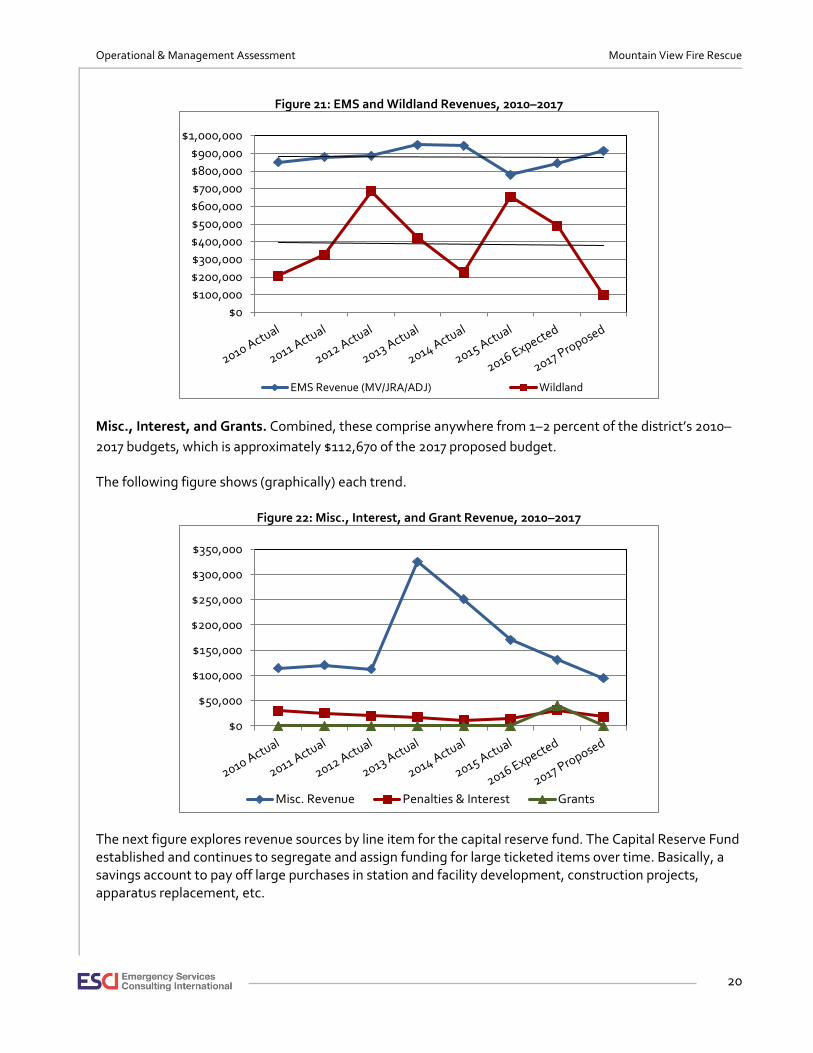
Misc., Interest, and Grants. Combined, these comprise anywhere from 1–2 percent of the district’s 2010–
2017 budgets, which is approximately $112,670 of the 2017 proposed budget.
The following figure shows (graphically) each trend.
Figure 22: Misc., Interest, and Grant Revenue, 2010–2017
The next figure explores revenue sources by line item for the capital reserve fund. The Capital Reserve Fund established and continues to segregate and assign funding for large ticketed items over time. Basically, a savings account to pay off large purchases in station and facility development, construction projects, apparatus replacement, etc.
$0
$100,000
$200,000
$300,000
$400,000
$500,000
$600,000
$700,000
$800,000
$900,000
$1,000,000
EMS Revenue (MV/JRA/ADJ) Wildland
$0
$50,000
$100,000
$150,000
$200,000
$250,000
$300,000
$350,000
Misc. Revenue Penalties & Interest Grants
Operational & Management Assessment Mountain View Fire Rescue
21
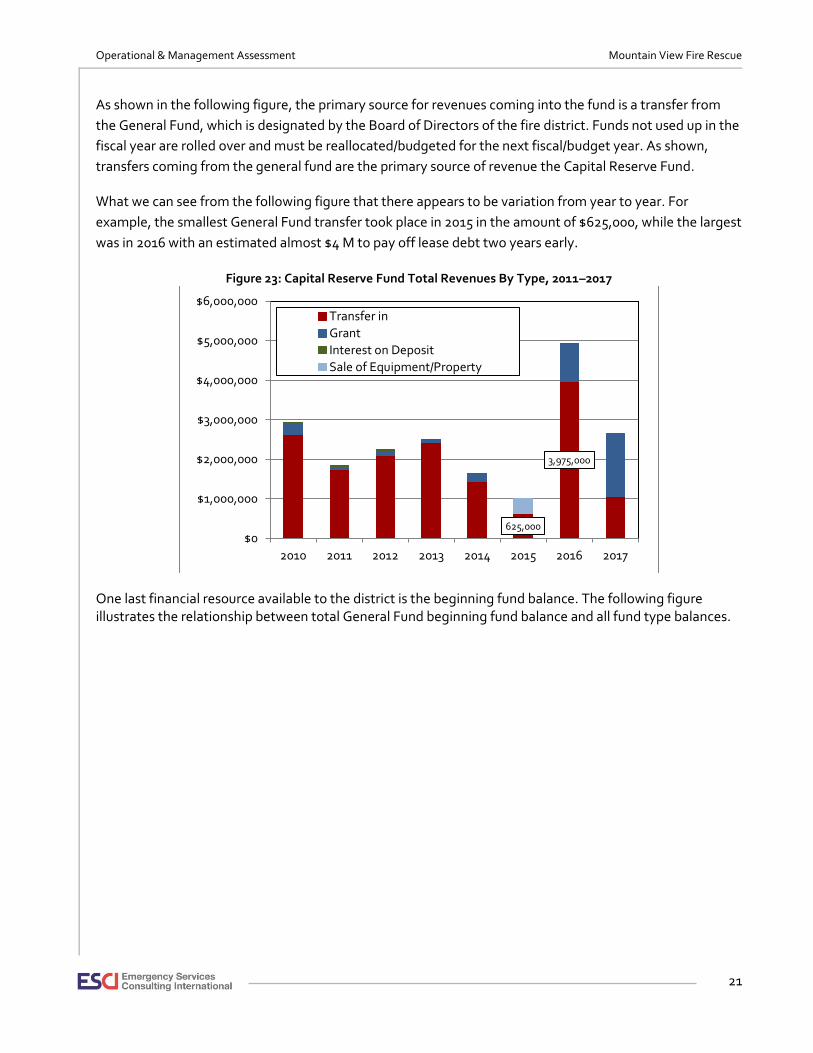
As shown in the following figure, the primary source for revenues coming into the fund is a transfer from
the General Fund, which is designated by the Board of Directors of the fire district. Funds not used up in the
fiscal year are rolled over and must be reallocated/budgeted for the next fiscal/budget year. As shown,
transfers coming from the general fund are the primary source of revenue the Capital Reserve Fund.
What we can see from the following figure that there appears to be variation from year to year. For
example, the smallest General Fund transfer took place in 2015 in the amount of $625,000, while the largest
was in 2016 with an estimated almost $4 M to pay off lease debt two years early.
Figure 23: Capital Reserve Fund Total Revenues By Type, 2011–2017
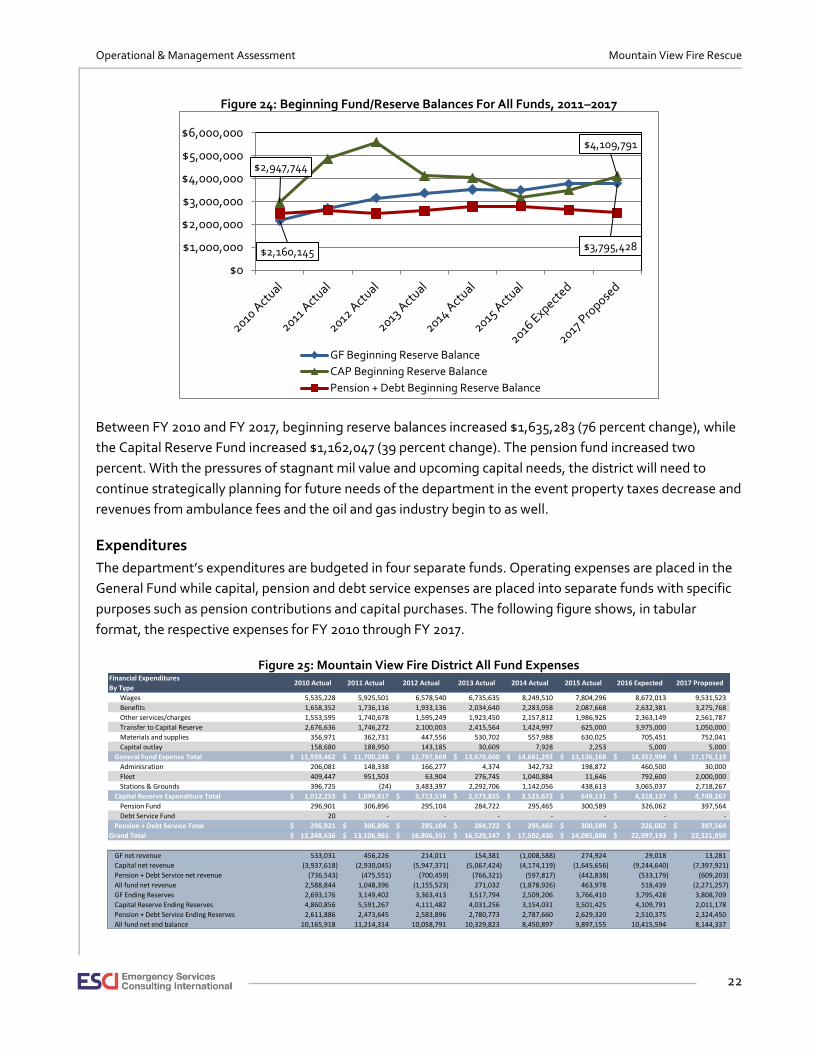
One last financial resource available to the district is the beginning fund balance. The following figure illustrates the relationship between total General Fund beginning fund balance and all fund type balances.
625,000
3,975,000
$0
$1,000,000
$2,000,000
$3,000,000
$4,000,000
$5,000,000
$6,000,000
2010 2011 2012 2013 2014 2015 2016 2017
Transfer in
Grant
Interest on Deposit
Sale of Equipment/Property
Operational & Management Assessment Mountain View Fire Rescue
22
Figure 24: Beginning Fund/Reserve Balances For All Funds, 2011–2017
Between FY 2010 and FY 2017, beginning reserve balances increased $1,635,283 (76 percent change), while
the Capital Reserve Fund increased $1,162,047 (39 percent change). The pension fund increased two
percent. With the pressures of stagnant mil value and upcoming capital needs, the district will need to
continue strategically planning for future needs of the department in the event property taxes decrease and
revenues from ambulance fees and the oil and gas industry begin to as well.
Expenditures
The department’s expenditures are budgeted in four separate funds. Operating expenses are placed in the
General Fund while capital, pension and debt service expenses are placed into separate funds with specific
purposes such as pension contributions and capital purchases. The following figure shows, in tabular
format, the respective expenses for FY 2010 through FY 2017.
Figure 25: Mountain View Fire District All Fund Expenses
$2,160,145 $3,795,428
$2,947,744
$4,109,791
$0
$1,000,000
$2,000,000
$3,000,000
$4,000,000
$5,000,000
$6,000,000
GF Beginning Reserve Balance
CAP Beginning Reserve Balance
Pension + Debt Beginning Reserve Balance
Financial Expenditures
By Type
Wages 5,535,228 5,925,501 6,578,540 6,735,635 8,249,510 7,804,296 8,672,013 9,531,523
Benefits 1,658,352 1,736,116 1,933,136 2,034,640 2,283,058 2,087,668 2,632,381 3,275,768
Other services/charges 1,553,595 1,740,678 1,595,249 1,923,450 2,157,812 1,986,925 2,363,149 2,561,787
Transfer to Capital Reserve 2,676,636 1,746,272 2,100,003 2,415,564 1,424,997 625,000 3,975,000 1,050,000
Materials and supplies 356,971 362,731 447,556 530,702 557,988 630,025 705,451 752,041
Capital outlay 158,680 188,950 143,185 30,609 7,928 2,253 5,000 5,000
General Fund Expense Total 11,939,462$ 11,700,248$ 12,797,669$ 13,670,600$ 14,681,293$ 13,136,168$ 18,352,994$ 17,176,119$
Adminisration 206,081 148,338 166,277 4,374 342,732 198,872 460,500 30,000
Fleet 409,447 951,503 63,904 276,745 1,040,884 11,646 792,600 2,000,000
Stations & Grounds 396,725 (24) 3,483,397 2,292,706 1,142,056 438,613 3,065,037 2,718,267
Capital Reserve Expenditure Total 1,012,253$ 1,099,817$ 3,713,578$ 2,573,825$ 2,525,672$ 649,131$ 4,318,137$ 4,748,267$
Pension Fund 296,901 306,896 295,104 284,722 295,465 300,589 326,062 397,564
Debt Service Fund 20 - - - - - - -
Pension + Debt Service Total 296,921$ 306,896$ 295,104$ 284,722$ 295,465$ 300,589$ 326,062$ 397,564$
Grand Total 13,248,636$ 13,106,961$ 16,806,351$ 16,529,147$ 17,502,430$ 14,085,888$ 22,997,193$ 22,321,950$
GF net revenue 533,031 456,226 214,011 154,381 (1,008,588) 274,924 29,018 13,281
Capital net revenue (3,937,618) (2,930,045) (5,947,371) (5,067,424) (4,174,119) (1,645,656) (9,244,640) (7,397,921)
Pension + Debt Service net revenue (736,543) (475,551) (700,459) (766,321) (597,817) (442,838) (533,179) (609,203)
All fund net revenue 2,588,844 1,048,396 (1,155,523) 271,032 (1,878,926) 463,978 518,439 (2,271,257)
GF Ending Reserves 2,693,176 3,149,402 3,363,413 3,517,794 2,509,206 3,766,410 3,795,428 3,808,709
Capital Reserve Ending Reserves 4,860,856 5,591,267 4,111,482 4,031,256 3,154,031 3,501,425 4,109,791 2,011,178
Pension + Debt Service Ending Reserves 2,611,886 2,473,645 2,583,896 2,780,773 2,787,660 2,629,320 2,510,375 2,324,450
All fund net end balance 10,165,918 11,214,314 10,058,791 10,329,823 8,450,897 9,897,155 10,415,594 8,144,337
2010 Actual 2011 Actual 2012 Actual 2013 Actual 2014 Actual 2015 Actual 2016 Expected 2017 Proposed
Operational & Management Assessment Mountain View Fire Rescue
23
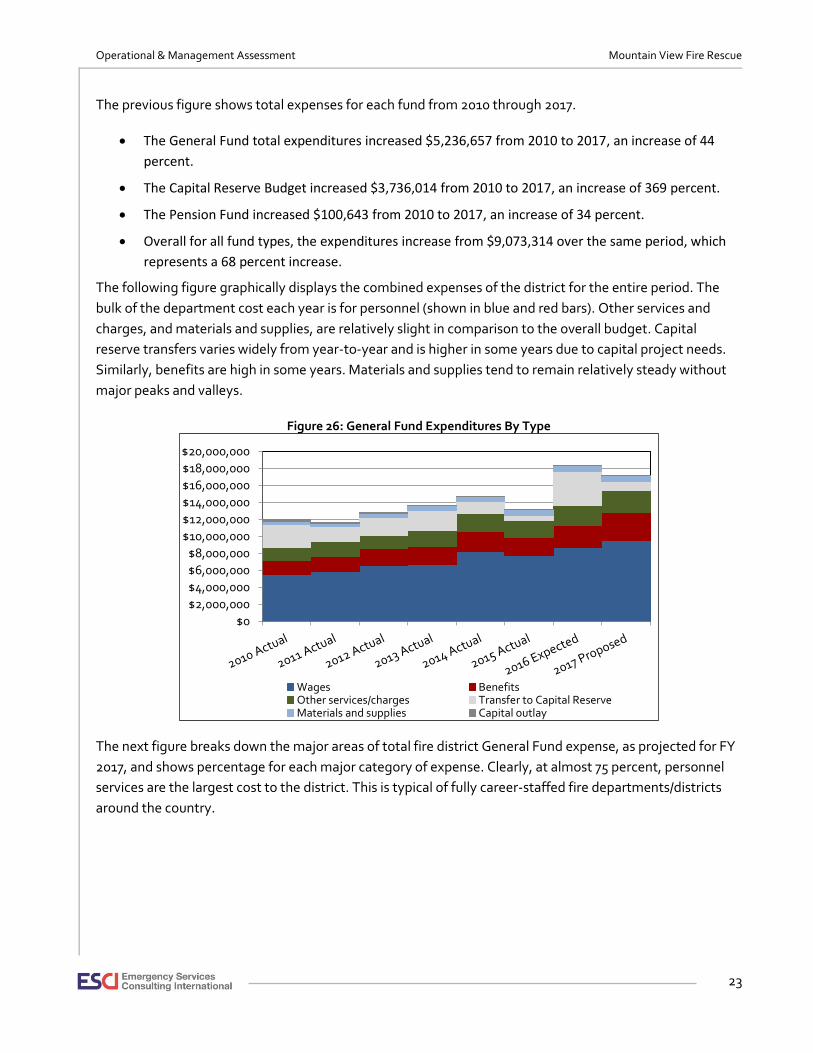
The previous figure shows total expenses for each fund from 2010 through 2017.
• The General Fund total expenditures increased $5,236,657 from 2010 to 2017, an increase of 44
percent.
• The Capital Reserve Budget increased $3,736,014 from 2010 to 2017, an increase of 369 percent.
• The Pension Fund increased $100,643 from 2010 to 2017, an increase of 34 percent.
• Overall for all fund types, the expenditures increase from $9,073,314 over the same period, which
represents a 68 percent increase.
The following figure graphically displays the combined expenses of the district for the entire period. The
bulk of the department cost each year is for personnel (shown in blue and red bars). Other services and
charges, and materials and supplies, are relatively slight in comparison to the overall budget. Capital
reserve transfers varies widely from year-to-year and is higher in some years due to capital project needs.
Similarly, benefits are high in some years. Materials and supplies tend to remain relatively steady without
major peaks and valleys.
Figure 26: General Fund Expenditures By Type
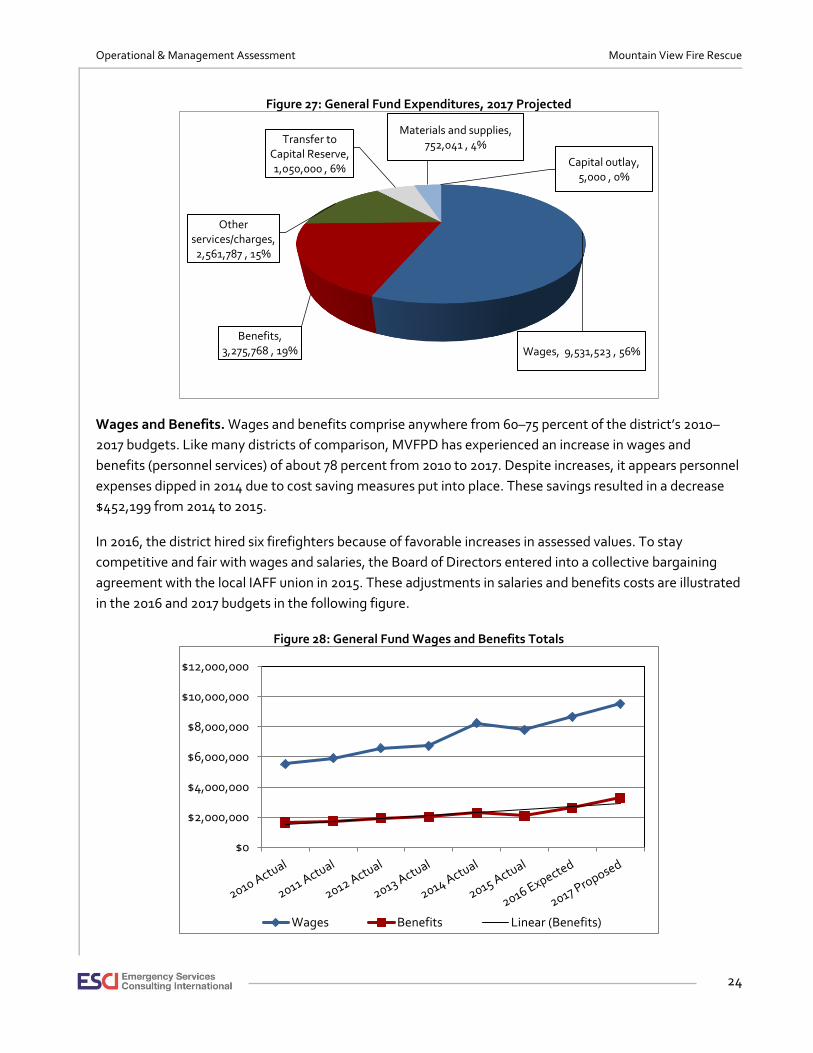
The next figure breaks down the major areas of total fire district General Fund expense, as projected for FY
2017, and shows percentage for each major category of expense. Clearly, at almost 75 percent, personnel
services are the largest cost to the district. This is typical of fully career-staffed fire departments/districts
around the country.
$0
$2,000,000
$4,000,000
$6,000,000
$8,000,000
$10,000,000
$12,000,000
$14,000,000
$16,000,000
$18,000,000
$20,000,000
Wages BenefitsOther services/charges Transfer to Capital ReserveMaterials and supplies Capital outlay
Operational & Management Assessment Mountain View Fire Rescue
24
Figure 27: General Fund Expenditures, 2017 Projected
Wages and Benefits. Wages and benefits comprise anywhere from 60–75 percent of the district’s 2010–
2017 budgets. Like many districts of comparison, MVFPD has experienced an increase in wages and
benefits (personnel services) of about 78 percent from 2010 to 2017. Despite increases, it appears personnel
expenses dipped in 2014 due to cost saving measures put into place. These savings resulted in a decrease
$452,199 from 2014 to 2015.
In 2016, the district hired six firefighters because of favorable increases in assessed values. To stay
competitive and fair with wages and salaries, the Board of Directors entered into a collective bargaining
agreement with the local IAFF union in 2015. These adjustments in salaries and benefits costs are illustrated
in the 2016 and 2017 budgets in the following figure.
Figure 28: General Fund Wages and Benefits Totals
Wages, 9,531,523 , 56%
Benefits, 3,275,768 , 19%
Other services/charges, 2,561,787 , 15%
Transfer to Capital Reserve, 1,050,000 , 6%
Materials and supplies, 752,041 , 4%
Capital outlay, 5,000 , 0%
$0
$2,000,000
$4,000,000
$6,000,000
$8,000,000
$10,000,000
$12,000,000
Wages Benefits Linear (Benefits)
Operational & Management Assessment Mountain View Fire Rescue
25
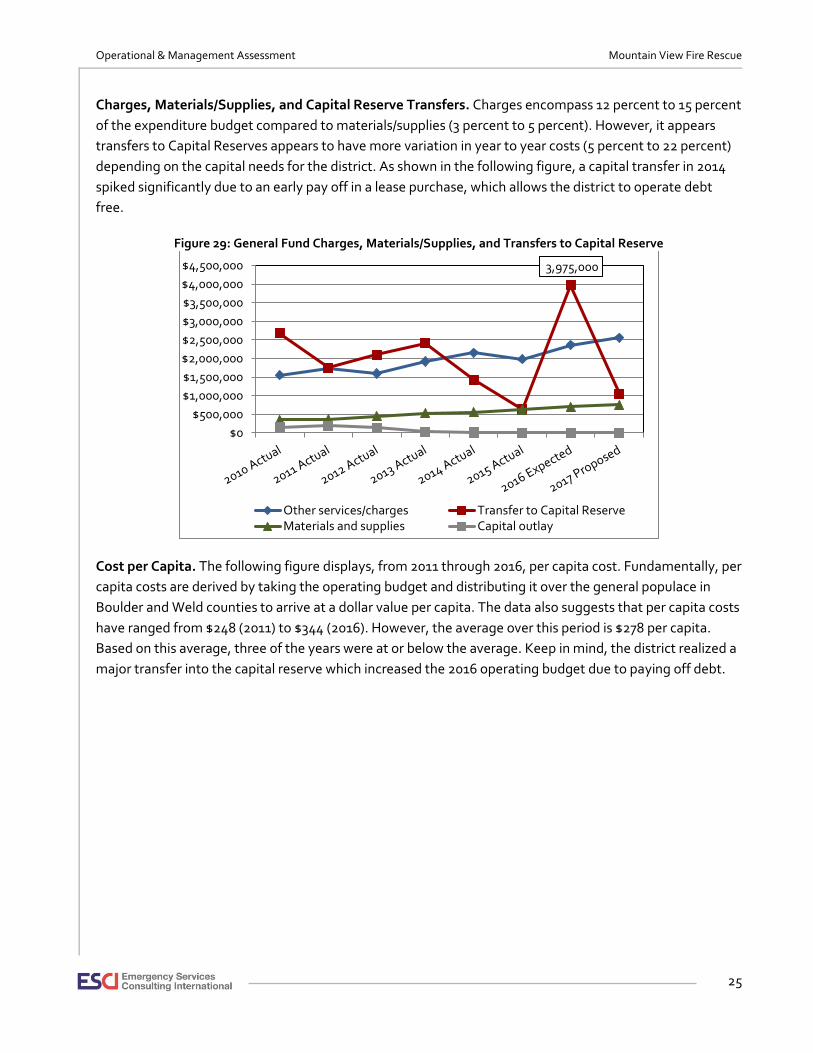
Charges, Materials/Supplies, and Capital Reserve Transfers. Charges encompass 12 percent to 15 percent
of the expenditure budget compared to materials/supplies (3 percent to 5 percent). However, it appears
transfers to Capital Reserves appears to have more variation in year to year costs (5 percent to 22 percent)
depending on the capital needs for the district. As shown in the following figure, a capital transfer in 2014
spiked significantly due to an early pay off in a lease purchase, which allows the district to operate debt
free.
Figure 29: General Fund Charges, Materials/Supplies, and Transfers to Capital Reserve
Cost per Capita. The following figure displays, from 2011 through 2016, per capita cost. Fundamentally, per
capita costs are derived by taking the operating budget and distributing it over the general populace in
Boulder and Weld counties to arrive at a dollar value per capita. The data also suggests that per capita costs
have ranged from $248 (2011) to $344 (2016). However, the average over this period is $278 per capita.
Based on this average, three of the years were at or below the average. Keep in mind, the district realized a
major transfer into the capital reserve which increased the 2016 operating budget due to paying off debt.
3,975,000
$0
$500,000
$1,000,000
$1,500,000
$2,000,000
$2,500,000
$3,000,000
$3,500,000
$4,000,000
$4,500,000
Other services/charges Transfer to Capital ReserveMaterials and supplies Capital outlay

Operational & Management Assessment Mountain View Fire Rescue
26
Figure 30: Cost per Capita
Cost per Call. A similar methodology was utilized for cost per call, but instead we replaced population with
calls for service. For 2016, the average cost per call was $4,828 compared to $3,205 in 2011. The average
cost per call for service was $3,765. Five of six years were at or below the average cost per call for service,
which again shows the variation in 2016 compared to other years.
Figure 31: Cost per Call
47,21648,500 48,688
50,072
52,391
54,885
$248$264
$281$293
$251
$334
$0
$50
$100
$150
$200
$250
$300
$350
$400
$42,000
$44,000
$46,000
$48,000
$50,000
$52,000
$54,000
$56,000
2011 2012 2013 2014 2015 2016
District population estimates Cost per Capita
$3,205$3,573 $3,608 $3,687 $3,689
$4,828
$0
$1,000
$2,000
$3,000
$4,000
$5,000
$6,000
2011 2012 2013 2014 2015 2016
Operational & Management Assessment Mountain View Fire Rescue
27
Net Revenue/Deficit and Fund Balances
The following figures display net revenue gain/deficits and reserve balances for the periods of 2010 actuals
through 2017 proposed for the General Fund, Capital Reserve Fund, and Pension Fund.
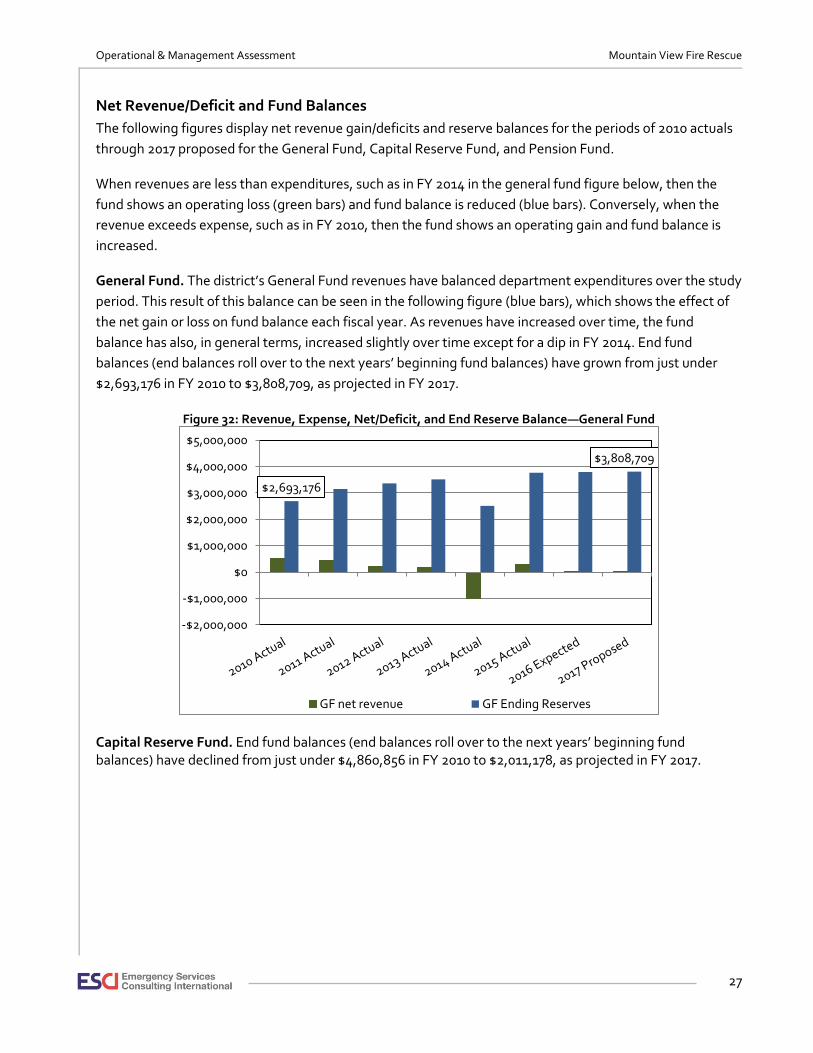
When revenues are less than expenditures, such as in FY 2014 in the general fund figure below, then the
fund shows an operating loss (green bars) and fund balance is reduced (blue bars). Conversely, when the
revenue exceeds expense, such as in FY 2010, then the fund shows an operating gain and fund balance is
increased.
General Fund. The district’s General Fund revenues have balanced department expenditures over the study
period. This result of this balance can be seen in the following figure (blue bars), which shows the effect of
the net gain or loss on fund balance each fiscal year. As revenues have increased over time, the fund
balance has also, in general terms, increased slightly over time except for a dip in FY 2014. End fund
balances (end balances roll over to the next years’ beginning fund balances) have grown from just under
$2,693,176 in FY 2010 to $3,808,709, as projected in FY 2017.
Figure 32: Revenue, Expense, Net/Deficit, and End Reserve Balance—General Fund
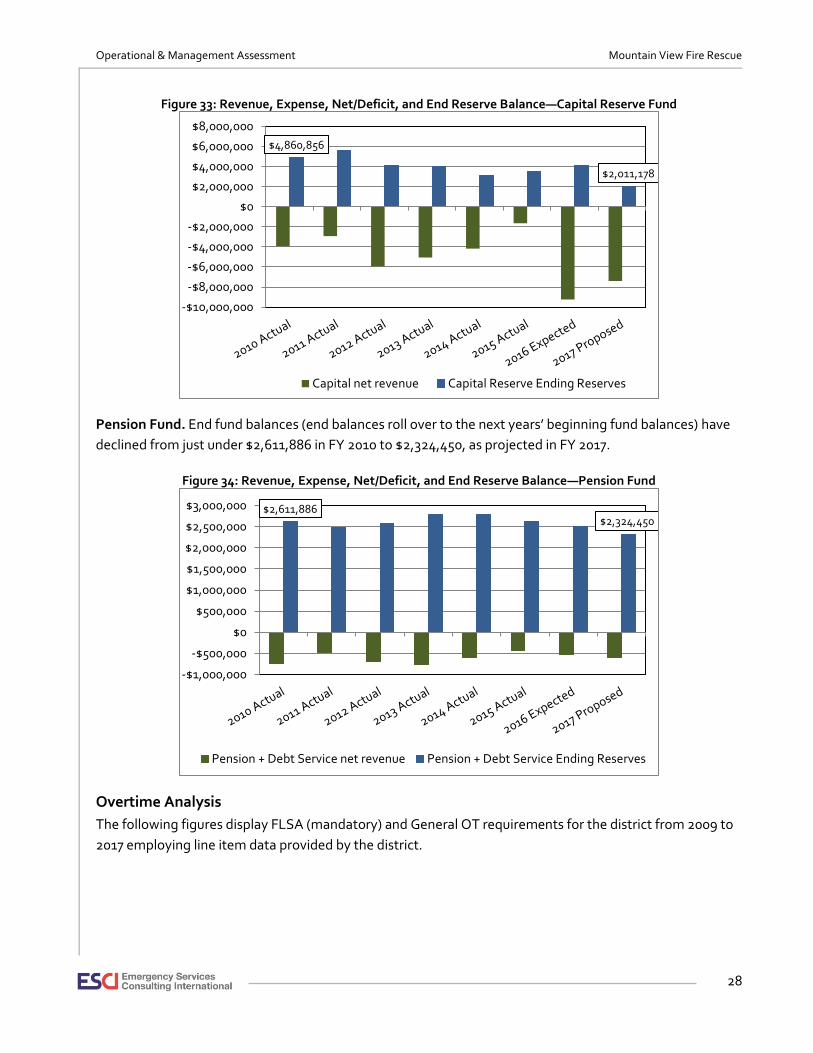
Capital Reserve Fund. End fund balances (end balances roll over to the next years’ beginning fund balances) have declined from just under $4,860,856 in FY 2010 to $2,011,178, as projected in FY 2017.
$2,693,176
$3,808,709
-$2,000,000
-$1,000,000
$0
$1,000,000
$2,000,000
$3,000,000
$4,000,000
$5,000,000
GF net revenue GF Ending Reserves
Operational & Management Assessment Mountain View Fire Rescue
28
Figure 33: Revenue, Expense, Net/Deficit, and End Reserve Balance—Capital Reserve Fund
Pension Fund. End fund balances (end balances roll over to the next years’ beginning fund balances) have
declined from just under $2,611,886 in FY 2010 to $2,324,450, as projected in FY 2017.
Figure 34: Revenue, Expense, Net/Deficit, and End Reserve Balance—Pension Fund
Overtime Analysis
The following figures display FLSA (mandatory) and General OT requirements for the district from 2009 to
2017 employing line item data provided by the district.
$4,860,856
$2,011,178
-$10,000,000
-$8,000,000
-$6,000,000
-$4,000,000
-$2,000,000
$0
$2,000,000
$4,000,000
$6,000,000
$8,000,000
Capital net revenue Capital Reserve Ending Reserves
$2,611,886$2,324,450
-$1,000,000
-$500,000
$0
$500,000
$1,000,000
$1,500,000
$2,000,000
$2,500,000
$3,000,000
Pension + Debt Service net revenue Pension + Debt Service Ending Reserves
Operational & Management Assessment Mountain View Fire Rescue
29
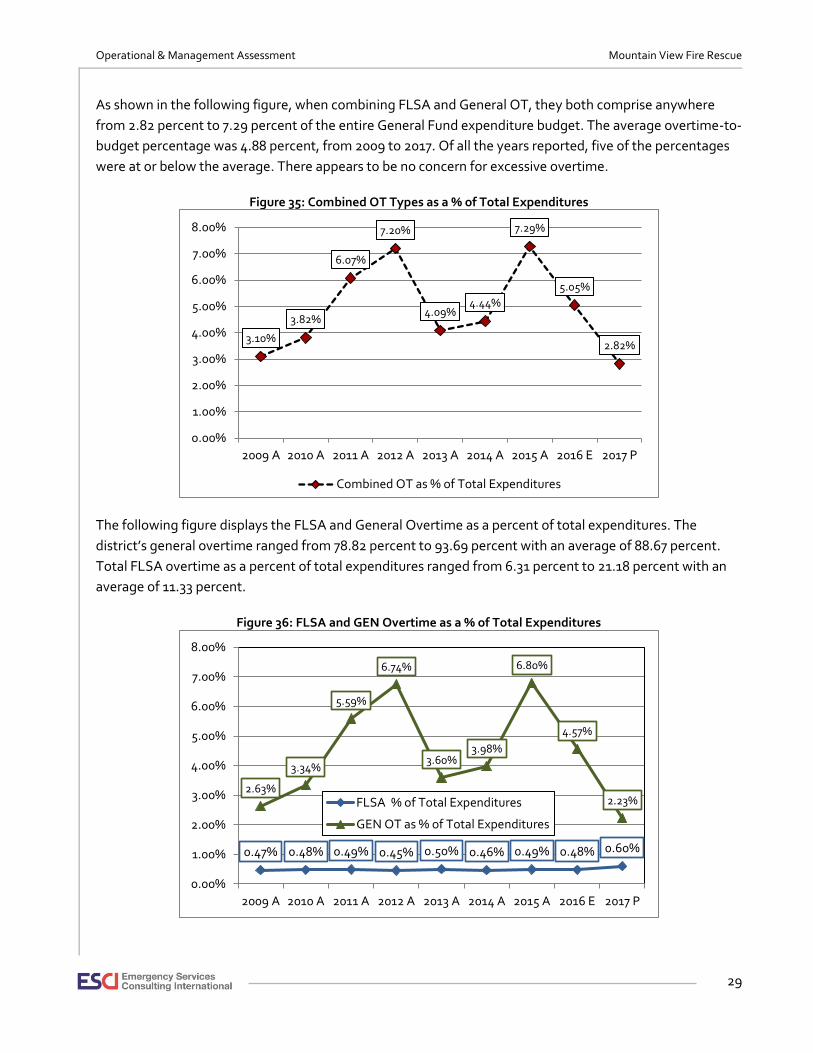
As shown in the following figure, when combining FLSA and General OT, they both comprise anywhere
from 2.82 percent to 7.29 percent of the entire General Fund expenditure budget. The average overtime-to-
budget percentage was 4.88 percent, from 2009 to 2017. Of all the years reported, five of the percentages
were at or below the average. There appears to be no concern for excessive overtime.
Figure 35: Combined OT Types as a % of Total Expenditures
The following figure displays the FLSA and General Overtime as a percent of total expenditures. The
district’s general overtime ranged from 78.82 percent to 93.69 percent with an average of 88.67 percent.
Total FLSA overtime as a percent of total expenditures ranged from 6.31 percent to 21.18 percent with an
average of 11.33 percent.
Figure 36: FLSA and GEN Overtime as a % of Total Expenditures
3.10%
3.82%
6.07%
7.20%
4.09%4.44%
7.29%
5.05%
2.82%
0.00%
1.00%
2.00%
3.00%
4.00%
5.00%
6.00%
7.00%
8.00%
2009 A 2010 A 2011 A 2012 A 2013 A 2014 A 2015 A 2016 E 2017 P
Combined OT as % of Total Expenditures
0.47% 0.48% 0.49% 0.45% 0.50% 0.46% 0.49% 0.48% 0.60%
2.63%
3.34%
5.59%
6.74%
3.60%3.98%
6.80%
4.57%
2.23%
0.00%
1.00%
2.00%
3.00%
4.00%
5.00%
6.00%
7.00%
8.00%
2009 A 2010 A 2011 A 2012 A 2013 A 2014 A 2015 A 2016 E 2017 P
FLSA % of Total Expenditures
GEN OT as % of Total Expenditures

Operational & Management Assessment Mountain View Fire Rescue
30
Figure 37: FLSA & GEN Overtime as a % of Total Overtime
Figure 37 displays the two categories (FLSA and General Overtime) as a percent of overtime combined.
General overtime ranges from 79 percent to 94 percent of all OT with FLSA ranging from 6 to 21 percent.
The year with the lowest overtime cost was 2010 ($329,212) and the highest year was 2015 ($957,237).
Financial Scenario
ESCI developed a forecast of revenues and expenditures to assess the financial sustainability of current
operations at the current burn rate over the next five years. The forecast is based upon historical actual
revenues and expenditures and informed assumptions about how those revenues and expenditures will
change in the future. The key assumptions used in the forecast are presented in the next figure followed by
the forecast results and selected metrics.
This scenario has been prepared for stakeholder consideration. This is considered a “current burn rate”
service level scenario with no new positions to add and comparative year over year growth assumptions in
revenues and expenses with anticipated future needs in capital improvements.
15% 12%8% 6%
12% 10%7% 10%
21%
85%88%
92% 94%88% 90%
93%90%
79%
0%
10%
20%
30%
40%
50%
60%
70%
80%
90%
100%
2009 A 2010 A 2011 A 2012 A 2013 A 2014 A 2015 A 2016 E 2017 P
FLSA % of all OT
GEN OT % of all OT

Operational & Management Assessment Mountain View Fire Rescue
31
Financial Scenario—Assumptions
Revenue/Resource Inputs
Figure 38: Financial Revenue Assumptions
• Property and specific ownership taxes:
▪ Property taxes. Assessed values have increased an average of 7.2 percent from 2010 to 2017. It appears that, with some variability, there is an upward trend. The forecast assumes 7.2 AV percent increase annually. The 7.2 percent property tax rate is subject to the current mil rate and a collection rate of 99.5 percent.
▪ Specific ownership taxes have averaged 7 percent annually since 2010. The model assumes a 7 percent increase in our forecast based on the current and historical conditions.
• EMS and wildland revenue:
▪ The forecast assumes that, for this scenario, the EMS revenue will increase at 1.4 percent annually.
▪ The forecast also assumes that, wildland revenues will increase 24.02 percent annually.
• Other Revenue Sources:
▪ Forecast assumes that misc. revenue will increase at a rate of 11.6 percent through the forecast period.
▪ Forecast assumes an annual rate of increase of 2.7 percent for penalties and interest.
▪ The forecast does not anticipate any grant funding for either the General Fund or Capital Reserve Fund.
• Capital Reserve and Pension Fund revenues:
▪ General Fund transfers into the Capital Reserve has fluctuated widely since 2010, therefore we have based our transfer amounts on capital reserve plans provided by the department and what is available on the website for public use. Again, these amounts do not include any potential grant revenue.
▪ This scenario assumes a two percent increase based on historical averages for the Pension Fund.
Financial Resources
By Type Assumptions
AV 7.2%
Levied $ 7.2%
Collection Rate 99.5%
Mil rate Fixed at current rate
GF Beginning Reserve Balance Prior year end fund balance
CAP Beginning Reserve Balance Prior year end fund balance
Pension + Debt Beginning Reserve Balance Prior year end fund balance
Property taxes 7.2% AV increase at 99.5% collection
EMS Revenue (MV/JRA/ADJ) 1.4%
Specific ownership taxes 7.0%
Wildland 24.02%
Misc. Revenue 11.6%
Penalties & Interest 2.7%
Grants Fixed at $0
General Fund Revenue Total Sum of activities
Capital Reserve Revenue Total Matched to capital reserve plan (does not include potential grants, etc).
Pension + Debt Service Total 2.0%
Grand Total Sum of activities

Operational & Management Assessment Mountain View Fire Rescue
32
Expenditure Inputs
Figure 39: Financial Expenditure Assumptions
• Salaries/Wages:
▪ For purposes of this forecast, it is assumed that the wages will increase by 8.37 percent each year.
• Benefits:
▪ Forecast uses a 10.78 percent increase each year for benefits.
• Other Services/Charges:
▪ The forecast assumes an average annual increase of 7.98 percent.
• Materials and Supplies:
▪ The forecast uses an annual increase of 11.46 percent for materials and supplies.
• Transfer into Capital Fund:
▪ The General Fund forecast assumes transfer amounts based on currently available capital plan amounts.
• General Fund Capital Outlay:
▪ Forecast for all scenarios assumes a base case amount of $5,000.
• Debt Service:
▪ The forecast assumes the district will continue with zero debt.
Financial Expenditures
By Type
Wages 8.37%
Benefits 10.78%
Other services/charges 7.98%
Transfer to Capital Reserve Matched capital reserve plan totals
Materials and supplies 11.46%
Capital outlay Fixed at $5000
General Fund Expense Total Sum of activities
Adminisration Based on CAPITAL RESERVE RECAP - 2012 - 2022 (from website) & CAPITAL RESERVE RECAP - 2014 - 2014
Fleet Based on CAPITAL RESERVE RECAP - 2012 - 2022 (from website) & CAPITAL RESERVE RECAP - 2014 - 2015
Stations & Grounds Based on CAPITAL RESERVE RECAP - 2012 - 2022 (from website) & CAPITAL RESERVE RECAP - 2014 - 2016
Capital Reserve Expenditure Total Sum of activities
Pension Fund 4.56%
Debt Service Fund Zero debt
Pension + Debt Service Total Sum of activities
Grand Total Sum of activities
GF net revenue Revenues - expenses
Capital net revenue Revenues - expenses
Pension + Debt Service net revenue Revenues - expenses
All fund net revenue Revenues - expenses
GF Ending Reserves Beg balance + revenues - expenses
Capital Reserve Ending Reserves Beg balance + revenues - expenses
Pension + Debt Service Ending Reserves Beg balance + revenues - expenses
All fund net end balance Sum of all balances
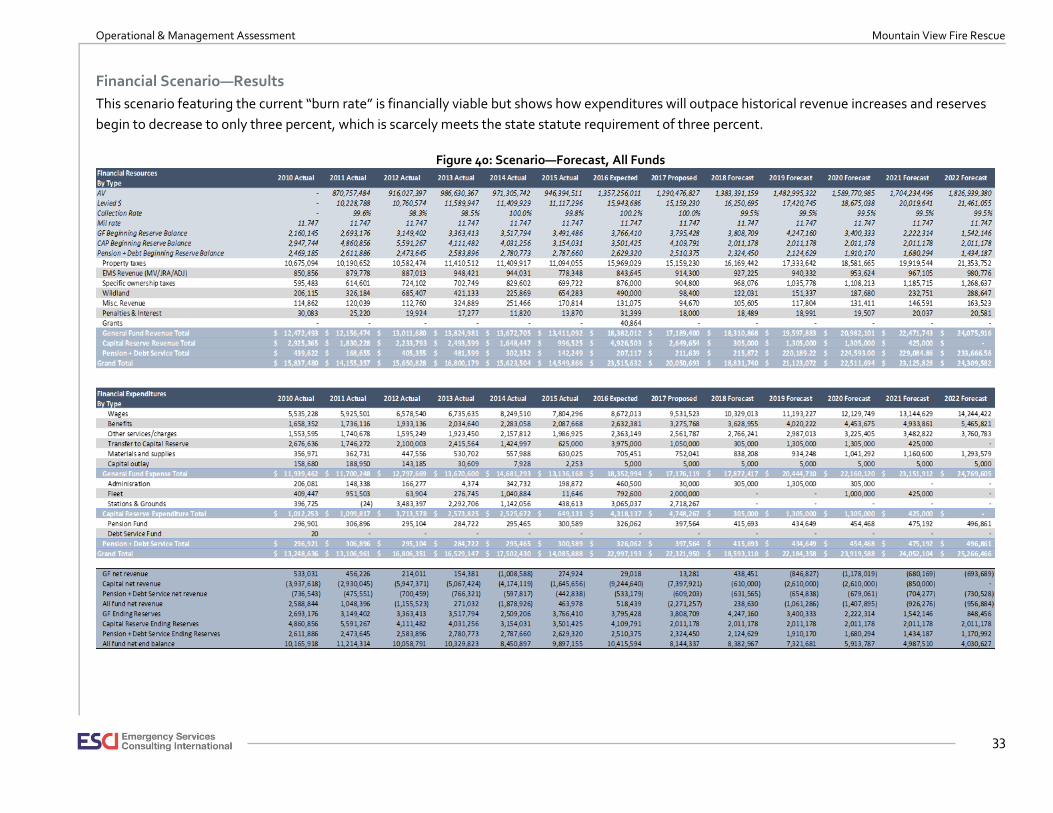
Operational & Management Assessment Mountain View Fire Rescue
33
Financial Scenario—Results
This scenario featuring the current “burn rate” is financially viable but shows how expenditures will outpace historical revenue increases and reserves
begin to decrease to only three percent, which is scarcely meets the state statute requirement of three percent.
Figure 40: Scenario—Forecast, All Funds
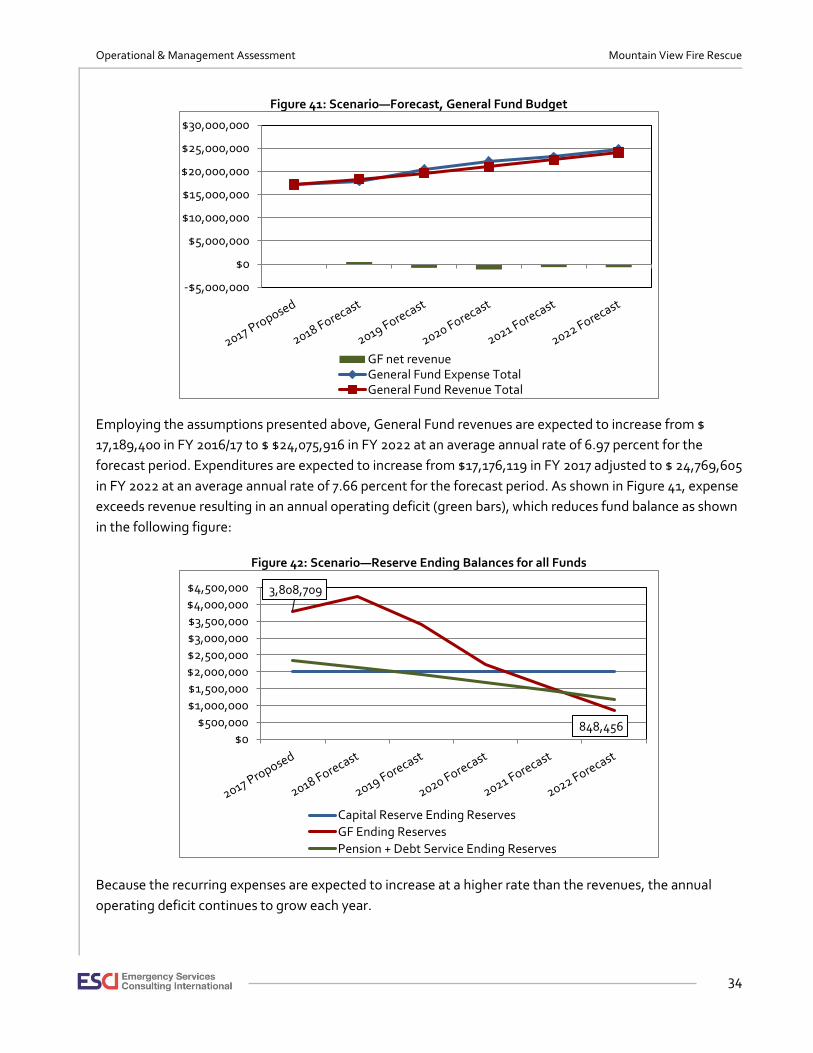
Operational & Management Assessment Mountain View Fire Rescue
34
Figure 41: Scenario—Forecast, General Fund Budget
Employing the assumptions presented above, General Fund revenues are expected to increase from $
17,189,400 in FY 2016/17 to $ $24,075,916 in FY 2022 at an average annual rate of 6.97 percent for the
forecast period. Expenditures are expected to increase from $17,176,119 in FY 2017 adjusted to $ 24,769,605
in FY 2022 at an average annual rate of 7.66 percent for the forecast period. As shown in Figure 41, expense
exceeds revenue resulting in an annual operating deficit (green bars), which reduces fund balance as shown
in the following figure:
Figure 42: Scenario—Reserve Ending Balances for all Funds
Because the recurring expenses are expected to increase at a higher rate than the revenues, the annual
operating deficit continues to grow each year.
-$5,000,000
$0
$5,000,000
$10,000,000
$15,000,000
$20,000,000
$25,000,000
$30,000,000
GF net revenueGeneral Fund Expense TotalGeneral Fund Revenue Total
3,808,709
848,456 $0
$500,000
$1,000,000
$1,500,000
$2,000,000
$2,500,000
$3,000,000
$3,500,000
$4,000,000
$4,500,000
Capital Reserve Ending Reserves
GF Ending Reserves
Pension + Debt Service Ending Reserves
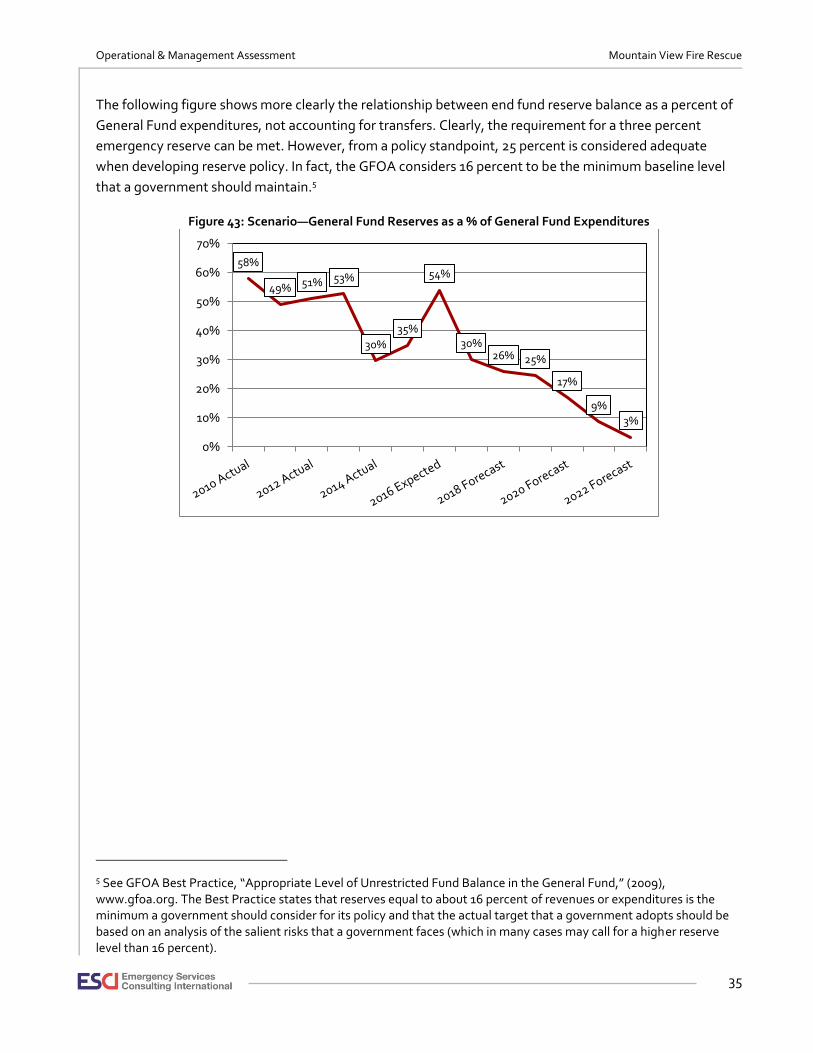
Operational & Management Assessment Mountain View Fire Rescue
35
The following figure shows more clearly the relationship between end fund reserve balance as a percent of
General Fund expenditures, not accounting for transfers. Clearly, the requirement for a three percent
emergency reserve can be met. However, from a policy standpoint, 25 percent is considered adequate
when developing reserve policy. In fact, the GFOA considers 16 percent to be the minimum baseline level
that a government should maintain.5
Figure 43: Scenario—General Fund Reserves as a % of General Fund Expenditures
5 See GFOA Best Practice, “Appropriate Level of Unrestricted Fund Balance in the General Fund,” (2009), www.gfoa.org. The Best Practice states that reserves equal to about 16 percent of revenues or expenditures is the minimum a government should consider for its policy and that the actual target that a government adopts should be based on an analysis of the salient risks that a government faces (which in many cases may call for a higher reserve level than 16 percent).
58%
49% 51% 53%
30%
35%
54%
30%26% 25%
17%
9%
3%
0%
10%
20%
30%
40%
50%
60%
70%

Operational & Management Assessment Mountain View Fire Rescue
36
Best Practices in Financial Management
As part of the fiscal analysis, our project team explored various data collection and site visit notes to
examine measures of effective organizational performance in comparison to industry standards. The
following figure includes select industry best practices and methods for performance improvement. The
practices listed do not encompass every facet of the finance function, rather key targets for the district
should/continue to monitor as a performance measurement.
Figure 44: Best Practices in Financial Management
Best Practices in Finance
Procedures are in place to monitor, adopt and amend budgets.
The budget process includes performance measures, goals, objectives, etc.
The government body is recogonized by the GFOA for its budget (GFOA Distinguished Presentation Award).
A five year financial plan is in place.
Written policies and procedures have been developed and updated.
Finance department monitors actuals versus budgeted expenditures
A fund reserve policy is in place.
New hires, reclassifications, and position changes are signed off (budget sign off).
Financial reports are provided to key stakholders such as the Fire Chief and the Board of Directors.
Written policy is in place for purchasing goods, services, etc.
Reasonable purchase limits and levels are in place.
Policies exist for excessive equipment and vehicles.
Training is provided regarding purchasing.
Finance functions are cross trained.
Accounting policies are in place and enforced.
Accounts payable disbursements include proper documentation.
Invoices are approved/reviewed prior to payment.
AP is processed in a a timely manner.
Monthly reconciliation, financial reports, and audits are handled in a timely manner.
Payroll is distributed in a timely manner.
Debt management policy is in place.
Budgeting
Purchasing and Risk
Accounting
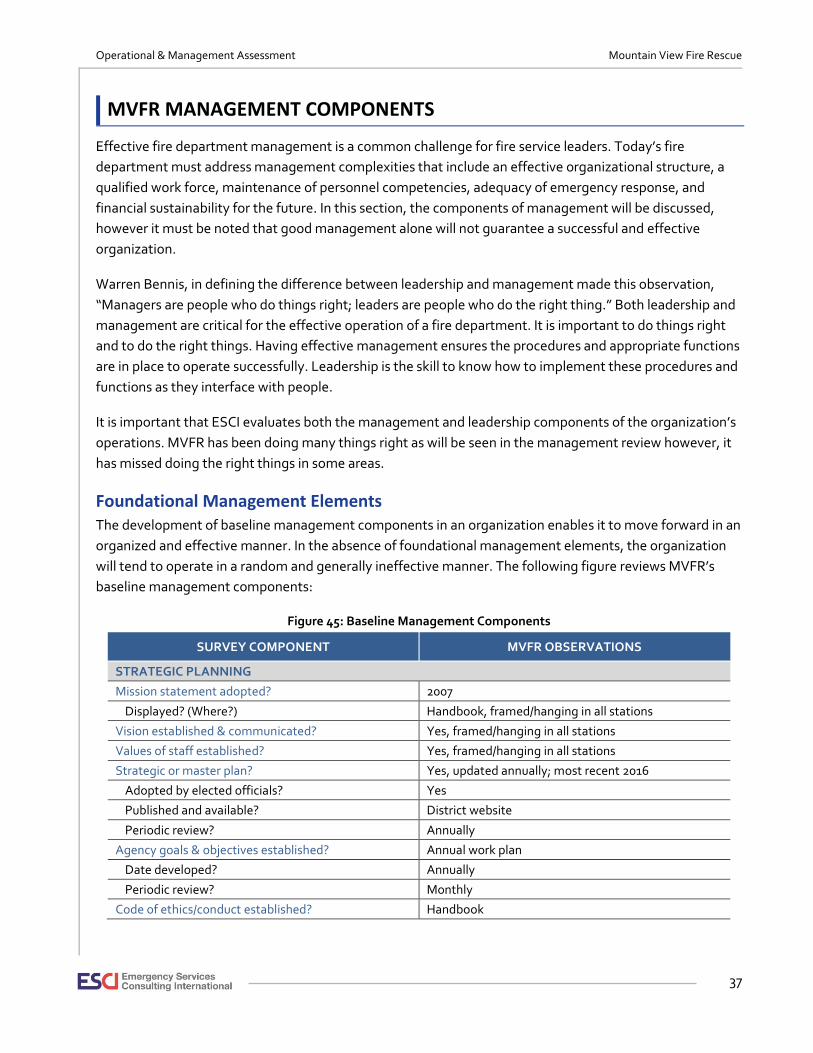
Operational & Management Assessment Mountain View Fire Rescue
37
MVFR MANAGEMENT COMPONENTS
Effective fire department management is a common challenge for fire service leaders. Today’s fire
department must address management complexities that include an effective organizational structure, a
qualified work force, maintenance of personnel competencies, adequacy of emergency response, and
financial sustainability for the future. In this section, the components of management will be discussed,
however it must be noted that good management alone will not guarantee a successful and effective
organization.
Warren Bennis, in defining the difference between leadership and management made this observation,
“Managers are people who do things right; leaders are people who do the right thing.” Both leadership and
management are critical for the effective operation of a fire department. It is important to do things right
and to do the right things. Having effective management ensures the procedures and appropriate functions
are in place to operate successfully. Leadership is the skill to know how to implement these procedures and
functions as they interface with people.
It is important that ESCI evaluates both the management and leadership components of the organization’s
operations. MVFR has been doing many things right as will be seen in the management review however, it
has missed doing the right things in some areas.
Foundational Management Elements The development of baseline management components in an organization enables it to move forward in an
organized and effective manner. In the absence of foundational management elements, the organization
will tend to operate in a random and generally ineffective manner. The following figure reviews MVFR’s
baseline management components:
Figure 45: Baseline Management Components
SURVEY COMPONENT MVFR OBSERVATIONS
STRATEGIC PLANNING
Mission statement adopted? 2007
Displayed? (Where?) Handbook, framed/hanging in all stations
Vision established & communicated? Yes, framed/hanging in all stations
Values of staff established? Yes, framed/hanging in all stations
Strategic or master plan? Yes, updated annually; most recent 2016
Adopted by elected officials? Yes
Published and available? District website
Periodic review? Annually
Agency goals & objectives established? Annual work plan
Date developed? Annually
Periodic review? Monthly
Code of ethics/conduct established? Handbook
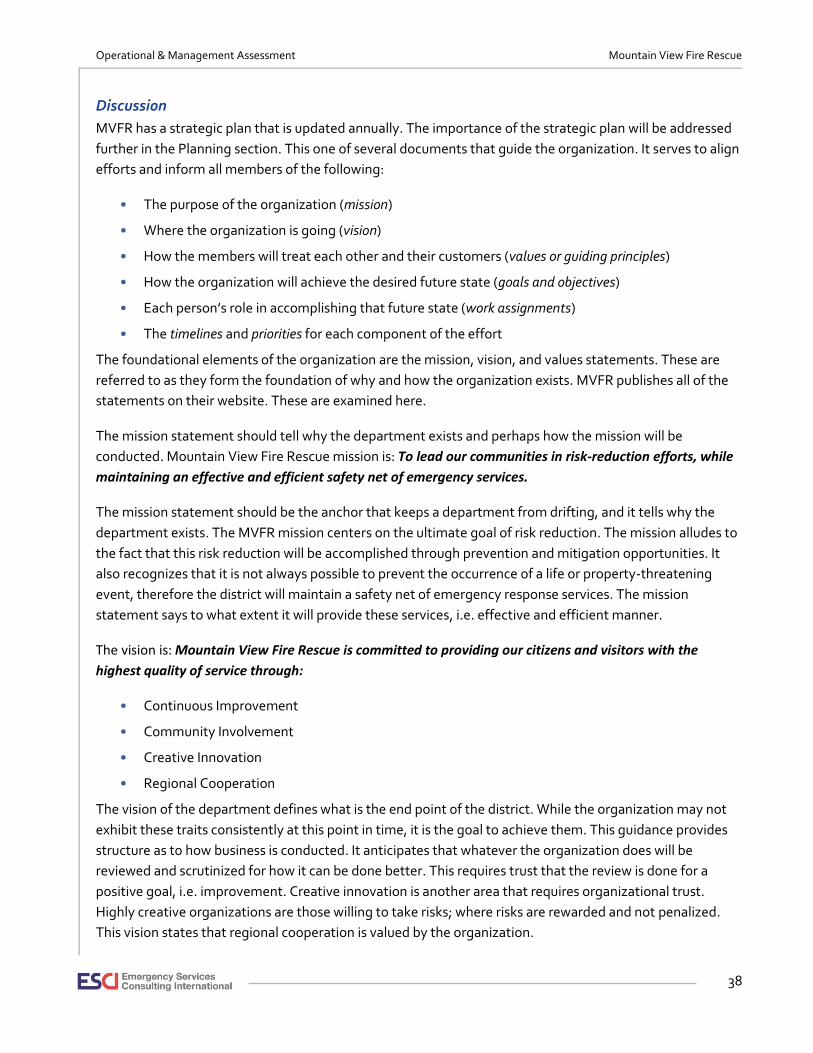
Operational & Management Assessment Mountain View Fire Rescue
38
Discussion
MVFR has a strategic plan that is updated annually. The importance of the strategic plan will be addressed
further in the Planning section. This one of several documents that guide the organization. It serves to align
efforts and inform all members of the following:
• The purpose of the organization (mission)
• Where the organization is going (vision)
• How the members will treat each other and their customers (values or guiding principles)
• How the organization will achieve the desired future state (goals and objectives)
• Each person’s role in accomplishing that future state (work assignments)
• The timelines and priorities for each component of the effort
The foundational elements of the organization are the mission, vision, and values statements. These are
referred to as they form the foundation of why and how the organization exists. MVFR publishes all of the
statements on their website. These are examined here.
The mission statement should tell why the department exists and perhaps how the mission will be
conducted. Mountain View Fire Rescue mission is: To lead our communities in risk-reduction efforts, while
maintaining an effective and efficient safety net of emergency services.
The mission statement should be the anchor that keeps a department from drifting, and it tells why the
department exists. The MVFR mission centers on the ultimate goal of risk reduction. The mission alludes to
the fact that this risk reduction will be accomplished through prevention and mitigation opportunities. It
also recognizes that it is not always possible to prevent the occurrence of a life or property-threatening
event, therefore the district will maintain a safety net of emergency response services. The mission
statement says to what extent it will provide these services, i.e. effective and efficient manner.
The vision is: Mountain View Fire Rescue is committed to providing our citizens and visitors with the
highest quality of service through:
• Continuous Improvement
• Community Involvement
• Creative Innovation
• Regional Cooperation
The vision of the department defines what is the end point of the district. While the organization may not
exhibit these traits consistently at this point in time, it is the goal to achieve them. This guidance provides
structure as to how business is conducted. It anticipates that whatever the organization does will be
reviewed and scrutinized for how it can be done better. This requires trust that the review is done for a
positive goal, i.e. improvement. Creative innovation is another area that requires organizational trust.
Highly creative organizations are those willing to take risks; where risks are rewarded and not penalized.
This vision states that regional cooperation is valued by the organization.

Operational & Management Assessment Mountain View Fire Rescue
39
To cooperate with other organizations often will require some modification of methods. If the organization
feels the need to invent it here, this will be a difficult goal to achieve. Organizational humility is needed.
MVFR recognizes that community involvement is important. It is unclear to what extent MVFR seeks
community (or communities) involvement. There is a significant challenge to involve the many
communities that MVFR serves in a meaningful way.
ESCI determined that MVFR lacks organizational trust and, in fact, there was a perceived environment of
mistrust and intimidation which stifles innovation. Regional cooperation was not practiced across the board
as there is at least one agency that has been legally challenged by the district.
The values are stated as:
We believe that the highest form of human interaction takes place when we treat each other the way we
ourselves wish to be treated. Further, we take the lead in doing the right thing for the right reasons at all
times. In so doing we are not ashamed to be guided by our conscience and timeless principles. We choose
to do the right thing even if others around us decline, or fail, to do so.
These values are lofty and important principles for an organization. The values statement should
enumerate those the common standards and principals held by nearly, if not all, of the members. It is the
social contract whereby everyone in the organization agrees to be held accountable. It can form the
framework for the code of conduct. It makes accountability clearer if the values have been violated. It is
mandatory that the leadership of the organization model these values. ESCI has determined that many in
the organization do not believe this statement represents the way the department has been operated.
As ESCI interviewed members of the department, it became clear that not everyone believes that
leadership has modeled these values. Some of the issues that MVFR faces is due to the failure to treat one
another within the department in the same way we would be want to be treated. Threatening physical
harm or retaliation is not in keeping with the values of the organization. Some officers may believe that
they are doing the right thing for the right reason. Courage to stick to one’s conscience is certainly
commendable but if leadership believes they have a corner on what is right this courage will be a deficit.
Being in charge does not necessarily make one right. In fact, when in a position of power, it is even more
important to be sure you are right because many others are affected by your decisions.
For MVFR to post these statements in multiple places is commendable. Even more important is the ability
of the members to, if not be able to quote verbatim, articulate the meaning of the statements. ESCI
recommends a review with a cross-section of the organization to determine if these are the values that the
organization holds or if more specificity is needed.
Agency goals and objectives are stated in an annual workplan. This a commendable way to move the
organization forward. The annual workplan should be posted for all members to see, and completion of the
objectives each year should be celebrated by the entire organization.
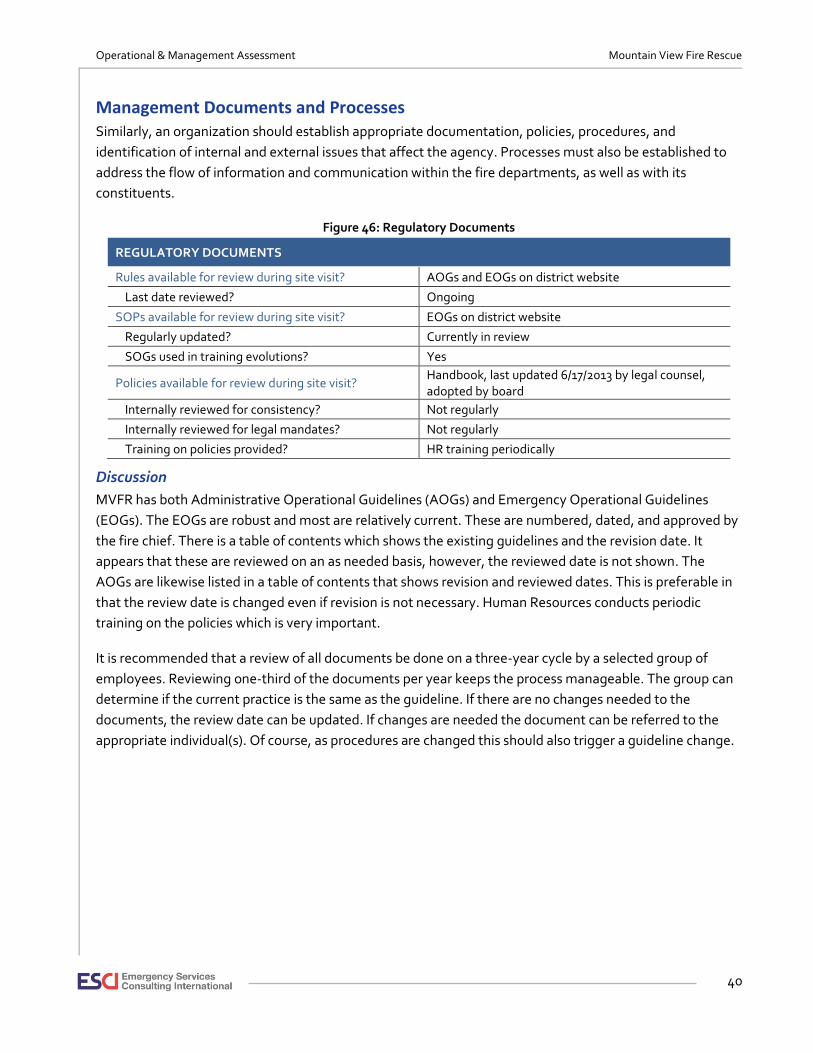
Operational & Management Assessment Mountain View Fire Rescue
40
Management Documents and Processes Similarly, an organization should establish appropriate documentation, policies, procedures, and
identification of internal and external issues that affect the agency. Processes must also be established to
address the flow of information and communication within the fire departments, as well as with its
constituents.
Figure 46: Regulatory Documents
REGULATORY DOCUMENTS
Rules available for review during site visit? AOGs and EOGs on district website
Last date reviewed? Ongoing
SOPs available for review during site visit? EOGs on district website
Regularly updated? Currently in review
SOGs used in training evolutions? Yes
Policies available for review during site visit? Handbook, last updated 6/17/2013 by legal counsel, adopted by board
Internally reviewed for consistency? Not regularly
Internally reviewed for legal mandates? Not regularly
Training on policies provided? HR training periodically
Discussion
MVFR has both Administrative Operational Guidelines (AOGs) and Emergency Operational Guidelines
(EOGs). The EOGs are robust and most are relatively current. These are numbered, dated, and approved by
the fire chief. There is a table of contents which shows the existing guidelines and the revision date. It
appears that these are reviewed on an as needed basis, however, the reviewed date is not shown. The
AOGs are likewise listed in a table of contents that shows revision and reviewed dates. This is preferable in
that the review date is changed even if revision is not necessary. Human Resources conducts periodic
training on the policies which is very important.
It is recommended that a review of all documents be done on a three-year cycle by a selected group of
employees. Reviewing one-third of the documents per year keeps the process manageable. The group can
determine if the current practice is the same as the guideline. If there are no changes needed to the
documents, the review date can be updated. If changes are needed the document can be referred to the
appropriate individual(s). Of course, as procedures are changed this should also trigger a guideline change.
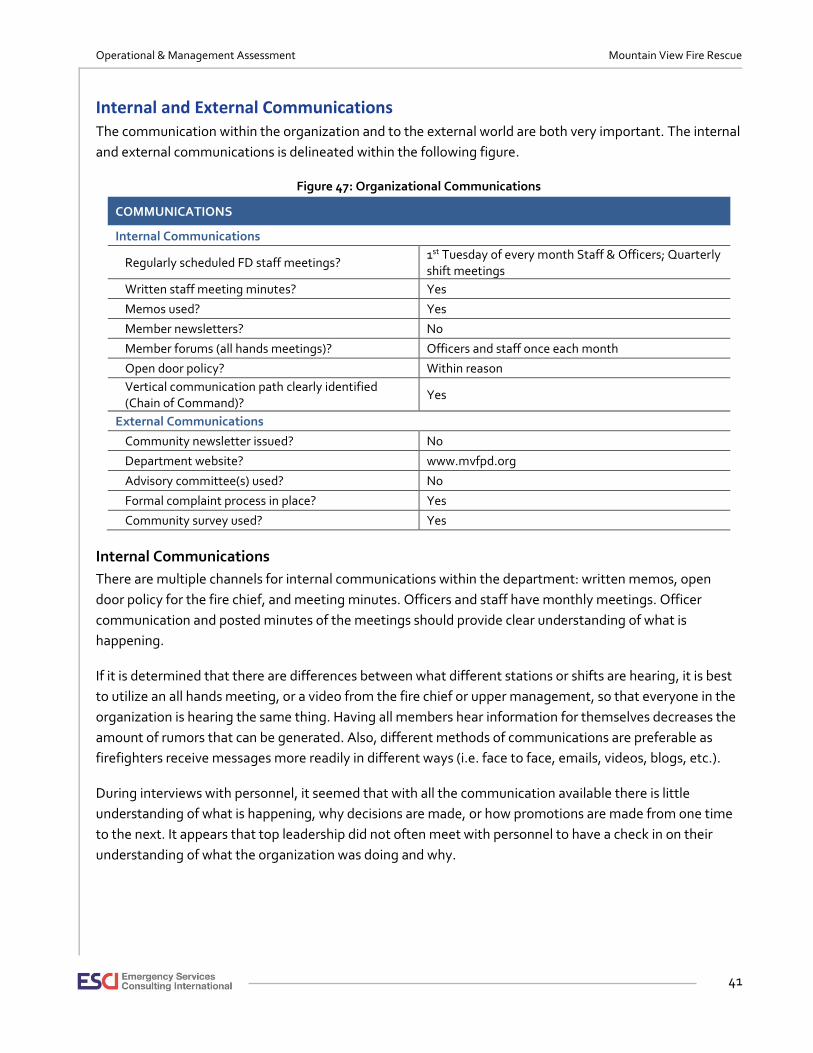
Operational & Management Assessment Mountain View Fire Rescue
41
Internal and External Communications The communication within the organization and to the external world are both very important. The internal
and external communications is delineated within the following figure.
Figure 47: Organizational Communications
COMMUNICATIONS
Internal Communications
Regularly scheduled FD staff meetings? 1st Tuesday of every month Staff & Officers; Quarterly shift meetings
Written staff meeting minutes? Yes
Memos used? Yes
Member newsletters? No
Member forums (all hands meetings)? Officers and staff once each month
Open door policy? Within reason
Vertical communication path clearly identified (Chain of Command)?
Yes
External Communications
Community newsletter issued? No
Department website? www.mvfpd.org
Advisory committee(s) used? No
Formal complaint process in place? Yes
Community survey used? Yes
Internal Communications
There are multiple channels for internal communications within the department: written memos, open
door policy for the fire chief, and meeting minutes. Officers and staff have monthly meetings. Officer
communication and posted minutes of the meetings should provide clear understanding of what is
happening.
If it is determined that there are differences between what different stations or shifts are hearing, it is best
to utilize an all hands meeting, or a video from the fire chief or upper management, so that everyone in the
organization is hearing the same thing. Having all members hear information for themselves decreases the
amount of rumors that can be generated. Also, different methods of communications are preferable as
firefighters receive messages more readily in different ways (i.e. face to face, emails, videos, blogs, etc.).
During interviews with personnel, it seemed that with all the communication available there is little
understanding of what is happening, why decisions are made, or how promotions are made from one time
to the next. It appears that top leadership did not often meet with personnel to have a check in on their
understanding of what the organization was doing and why.
Operational & Management Assessment Mountain View Fire Rescue
42
ESCI was asked to specifically determine the level of communications within the organization. A
comprehensive survey of all personnel was conducted, as well as face to face meetings with personnel. The
following is a sampling of how communications are viewed from the members. There is much more analysis
of communications in the full survey report.6
Over half of the members of the department disagreed that new ideas are welcome, constructive criticism
is known how to be given and taken, communication is directed at problem-solving rather than blaming,
and that senior leadership is transparent about what is going on. Nearly three-quarters disagreed that
everyone gets the same information at roughly the same time. Over half of the members disagree that they
are given the information necessary for them to understand decisions made by leadership.
Members strongly agree that they are able to share concerns or mistakes with their immediate supervisor.
Further they feel that their superior gives them clear expectations to their workgroup or shift.
External Communications
ESCI was scheduled to meet with external stakeholder from the communities, but none showed up to the
planned meeting. Two stakeholders requested interviews since they were unable to make the meeting.
Personal interviews were held with them. Due to the limited input, ESCI was unable to access the
effectiveness of external communications or their knowledge about MVFR.
There is no district newsletter distributed each year, however, based on a review of the website and annual
report there is an effort to keep the citizens of the district informed. The annual report for 2015 was a very
informative and well laid out document. The website is organized and a citizen or business owner in the
district should be able to find answers there. As with internal communications, external communications
are best handled by multiple avenues. The citizens served by MVFR will gravitate to the type of media that
they like. Typically, this stratifies along age groups but not necessarily. MVFR currently uses a website and
Facebook.
6 For a more complete report of the strategies and results of the survey see the report in the Appendix.
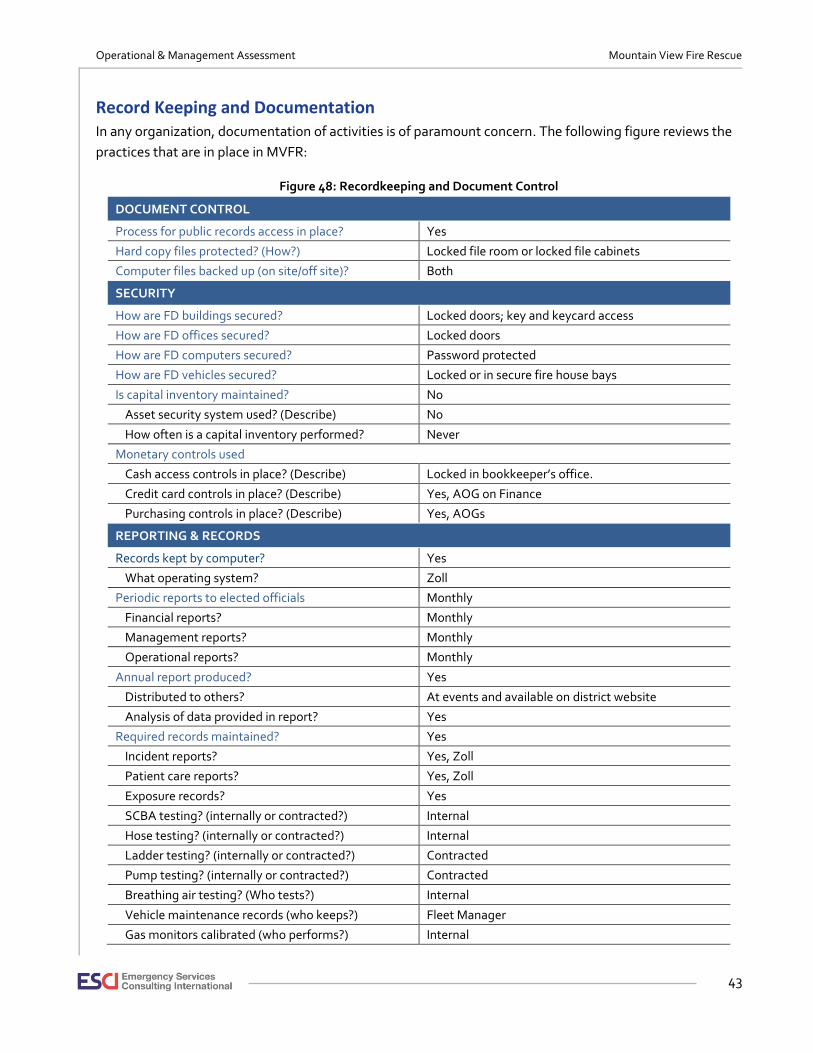
Operational & Management Assessment Mountain View Fire Rescue
43
Record Keeping and Documentation In any organization, documentation of activities is of paramount concern. The following figure reviews the
practices that are in place in MVFR:
Figure 48: Recordkeeping and Document Control
DOCUMENT CONTROL
Process for public records access in place? Yes
Hard copy files protected? (How?) Locked file room or locked file cabinets
Computer files backed up (on site/off site)? Both
SECURITY
How are FD buildings secured? Locked doors; key and keycard access
How are FD offices secured? Locked doors
How are FD computers secured? Password protected
How are FD vehicles secured? Locked or in secure fire house bays
Is capital inventory maintained? No
Asset security system used? (Describe) No
How often is a capital inventory performed? Never
Monetary controls used
Cash access controls in place? (Describe) Locked in bookkeeper’s office.
Credit card controls in place? (Describe) Yes, AOG on Finance
Purchasing controls in place? (Describe) Yes, AOGs
REPORTING & RECORDS
Records kept by computer? Yes
What operating system? Zoll
Periodic reports to elected officials Monthly
Financial reports? Monthly
Management reports? Monthly
Operational reports? Monthly
Annual report produced? Yes
Distributed to others? At events and available on district website
Analysis of data provided in report? Yes
Required records maintained? Yes
Incident reports? Yes, Zoll
Patient care reports? Yes, Zoll
Exposure records? Yes
SCBA testing? (internally or contracted?) Internal
Hose testing? (internally or contracted?) Internal
Ladder testing? (internally or contracted?) Contracted
Pump testing? (internally or contracted?) Contracted
Breathing air testing? (Who tests?) Internal
Vehicle maintenance records (who keeps?) Fleet Manager
Gas monitors calibrated (who performs?) Internal
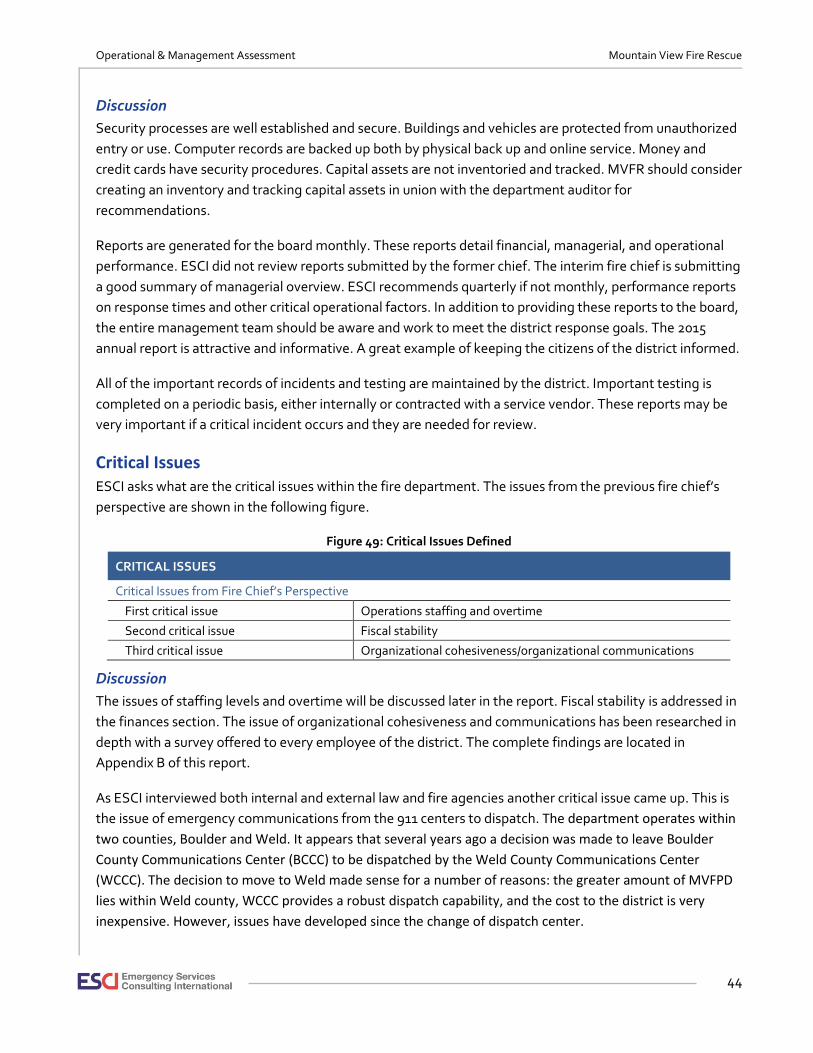
Operational & Management Assessment Mountain View Fire Rescue
44
Discussion
Security processes are well established and secure. Buildings and vehicles are protected from unauthorized
entry or use. Computer records are backed up both by physical back up and online service. Money and
credit cards have security procedures. Capital assets are not inventoried and tracked. MVFR should consider
creating an inventory and tracking capital assets in union with the department auditor for
recommendations.
Reports are generated for the board monthly. These reports detail financial, managerial, and operational
performance. ESCI did not review reports submitted by the former chief. The interim fire chief is submitting
a good summary of managerial overview. ESCI recommends quarterly if not monthly, performance reports
on response times and other critical operational factors. In addition to providing these reports to the board,
the entire management team should be aware and work to meet the district response goals. The 2015
annual report is attractive and informative. A great example of keeping the citizens of the district informed.
All of the important records of incidents and testing are maintained by the district. Important testing is
completed on a periodic basis, either internally or contracted with a service vendor. These reports may be
very important if a critical incident occurs and they are needed for review.
Critical Issues ESCI asks what are the critical issues within the fire department. The issues from the previous fire chief’s
perspective are shown in the following figure.
Figure 49: Critical Issues Defined
CRITICAL ISSUES
Critical Issues from Fire Chief’s Perspective
First critical issue Operations staffing and overtime
Second critical issue Fiscal stability
Third critical issue Organizational cohesiveness/organizational communications
Discussion
The issues of staffing levels and overtime will be discussed later in the report. Fiscal stability is addressed in
the finances section. The issue of organizational cohesiveness and communications has been researched in
depth with a survey offered to every employee of the district. The complete findings are located in
Appendix B of this report.
As ESCI interviewed both internal and external law and fire agencies another critical issue came up. This is
the issue of emergency communications from the 911 centers to dispatch. The department operates within
two counties, Boulder and Weld. It appears that several years ago a decision was made to leave Boulder
County Communications Center (BCCC) to be dispatched by the Weld County Communications Center
(WCCC). The decision to move to Weld made sense for a number of reasons: the greater amount of MVFPD
lies within Weld county, WCCC provides a robust dispatch capability, and the cost to the district is very
inexpensive. However, issues have developed since the change of dispatch center.
Operational & Management Assessment Mountain View Fire Rescue
45
There are two Public Safety Answering Points (PSAP) that service MVFPD. One is the Boulder County
Sheriff in Boulder County and the other is Weld County Communications in Weld County. It is the
responsibility of the PSAP to answer the 911 calls and route them to the appropriate service provider
depending on the emergency. Weld Communications Center operates as both as a PSAP and the dispatch
center. As dispatch provider, the center alerts stations or units and tracks unit times for en route, arrival,
and cleared. In addition, they are responsible for maintaining communications with the incident
commander in order to provide any additional needs. This could be additional units—either MVFPD units or
mutual aid units—or to order utility providers to the scene. The department uses mobile data terminals
(MDT) in the fire apparatus. MDTs display routing for the fire apparatus to be directed to the scene. They
also allow firefighters to make status changes by pressing buttons in the unit. These status changes create a
timestamp within the Computer Aided Dispatch system (CAD). These are then available to be put into the
department’s records management system (RMS) which is RescueNet Fire RMS, often referred to by
manufacturer as the Zoll System.
Currently, data from the CAD such as address, timestamps, and actions taken and ordered have to be
entered into the RescueNet system by hand after the call. This is an inefficient and mistake prone method.
For some time, MVFPD has requested that an interface between the Spillman CAD system and the Zoll
RMS be built to automate the data transfer from CAD into the RMS, eliminating the manual entry. Due to
unresolved issues with the Spillman CAD over the last three years, WCCC has not yet made the interface
connection.
Boulder County Communications Center, operated by the sheriff, is the other 911 PSAP. Its philosophy is
that due to the fact that Boulder county citizens pay a surcharge on their telephone service to operate the
PSAP that it has a responsibility to answer and maintain control over the call from beginning to end. For
that reason, it does not transfer the caller to the Weld County Communications Center so that the WCCC
dispatcher can question the caller directly about the emergency. Instead, BCCC asks questions of the caller
and calls WCCC to let them know the location and nature of the call. BCCC, while in the process of
extracting the information from the caller, enters it into their CAD system, determines the closest station,
and pre-alerts that station for a call. When WCCC has the information, they enter into their CAD and
dispatch the appropriate unit(s). If the call is in Boulder County, responding units must report status both to
BCCC and WCCC.
Operational & Management Assessment Mountain View Fire Rescue
46
This system is causing a number of inefficiencies and potential failure points. BCCC reported to ESCI that
nearly 40 hours of time was spent on the telephone to WCCC transferring information. Even when
operating on a call in Weld County, nearly all mutual aid requests are responded from Boulder County. If
another unit is requested by MVFR through their dispatch center, then WCCC must call BCCC to order the
unit’s response. MVFPD reported that units repeating their status changes on both the BCCC and WCCC
channels is time consuming and distracting. The units that frequently operate in Boulder County are fairly
proficient in doing this as it is their norm, however, if a station outside of Boulder County responds into the
county they are much more unlikely to remember to operate outside of their norm which is reporting to
only WCCC. These redundant communications distract the officer from concentrating on more pressing
issues when arriving on the scene of an incident. The officer needs to concentrate on ensuring the driver is
fully aware of directions, or changes in routes due to construction, traffic accidents, etc. Upon arrival, the
officer must determine a plan of action based on the incident demand, as well as if additional resources are
needed. Frequently, citizens are waiting to talk to arriving firefighters about some unusual circumstances,
such as location of their pet or trapped individuals.
Boulder County believes that all citizens of the county must be served by the BCCC and the sheriff. WCCC
believes as the dispatching authority for MVFPD, it is responsible to maintain communications for safety
and resource tracking. This dual sense of responsibility has created an inefficient process.
There are technical ways to solve the issue. If both PSAPs are also going to provide dispatch services as
they do now, then the MVFR mobile data terminals (MDTs) must operate on both CAD systems
simultaneously. When dispatched by one of the two centers, responders would place their unit out of
service on the other system CAD and respond to the CAD system by which they were dispatched. The ways
to have the MDTs operate with two CADs may require custom software be written, which may require an
upgrade whenever the CAD systems are changed at potentially significant cost.
Another solution would be to tie the two CAD systems together so that either center could dispatch the
units, and the other center would receive and recognize that the unit is no longer available for a call. This
solution is also problematic as Weld County is reluctant to do a CAD-to-CAD interface until they are certain
that the operational issues with the Spillman CAD have been resolved. Even if all issues were resolved and
both agencies could move forward it may be years before the interface is written. Again, the interface may
be affected by upgrading either CAD system. If the both centers were to use the same CAD system server
this method could be streamlined as no interface would be required and updates would not affect the
operation.
A solution is possible that is not a technical one but would require Boulder changing their current stance on
operations. Other fire agencies within the state operate with multiple PSAPs and law enforcement agencies
transferring the 911 caller to the fire dispatch facility after determining the nature of the emergency. This
eliminates long transfer times and the transferring PSAP could remain on the line to listen to the caller’s
response to the fire dispatcher questions. This allows law enforcement to send the appropriate law
response if there is something that might affect scene safety. Emergency medical dispatching (EMD) from
the fire dispatch center can provides pre-arrival instructions to the caller.

Operational & Management Assessment Mountain View Fire Rescue
47
This may include methods to control bleeding, or starting CPR, or just to reassure the caller that help is on
the way. EMD also is designed to elicit information that can be invaluable to the responding units.
An additional issue is the use of two different communications systems in the two counties. Weld county
uses an 700/800 MHz digital trunked radio system. Boulder county uses a VHF analog system but also has
the capability of 700/800 MHz using the statewide Digital Trunked Radio System (DTRS). There is the
ability to connect the VHF and the FRCC system used by WCCC for tactical channels on the incident. Both
systems also have capability to use the statewide mutual aid channels (MACs) through an interconnection.
The details and procedures for connecting the two systems needs to be understood by dispatch personnel
in both centers and its capability understood by fire personnel.
This is a critical issue that needs to be resolved for firefighter safety, as well as greater efficiency and
effectiveness. ESCI recommends researching each of these possibilities and determine potential
opportunities, timeline, and costs, both initially and on-going.
RECOMMENDATIONS:
• Review values statement with a task force comprised of a cross-section of the organization to determine if this still reflects the values desired.
• Post the annual workplan for all members to see and celebrate completion.
• Review EOGs and AOGs on a three-year cycle to assure they are current to practice and law.
• Determine how capital assets should be inventoried and tracked. Implement a system based on best practices.
• Publish performance reports on response times and other critical operational factors quarterly if not monthly. Assure that all members can review these.
• Research possible solutions for emergency communications issues and implement the best solution.
Operational & Management Assessment Mountain View Fire Rescue
48
CAPITAL ASSETS & CAPITAL IMPROVEMENT PROGRAMS
Facilities MVFD is fortunate to have an inventory of multiple fire stations, all in varying conditions. Of the active
response stations, all of the facilities have either been constructed, or substantially remodeled since 2006.
The oldest is Station 6 in Erie, which was upgraded in 2005.
On the following pages, ESCI offers a non-architectural review of the MVFD facilities.
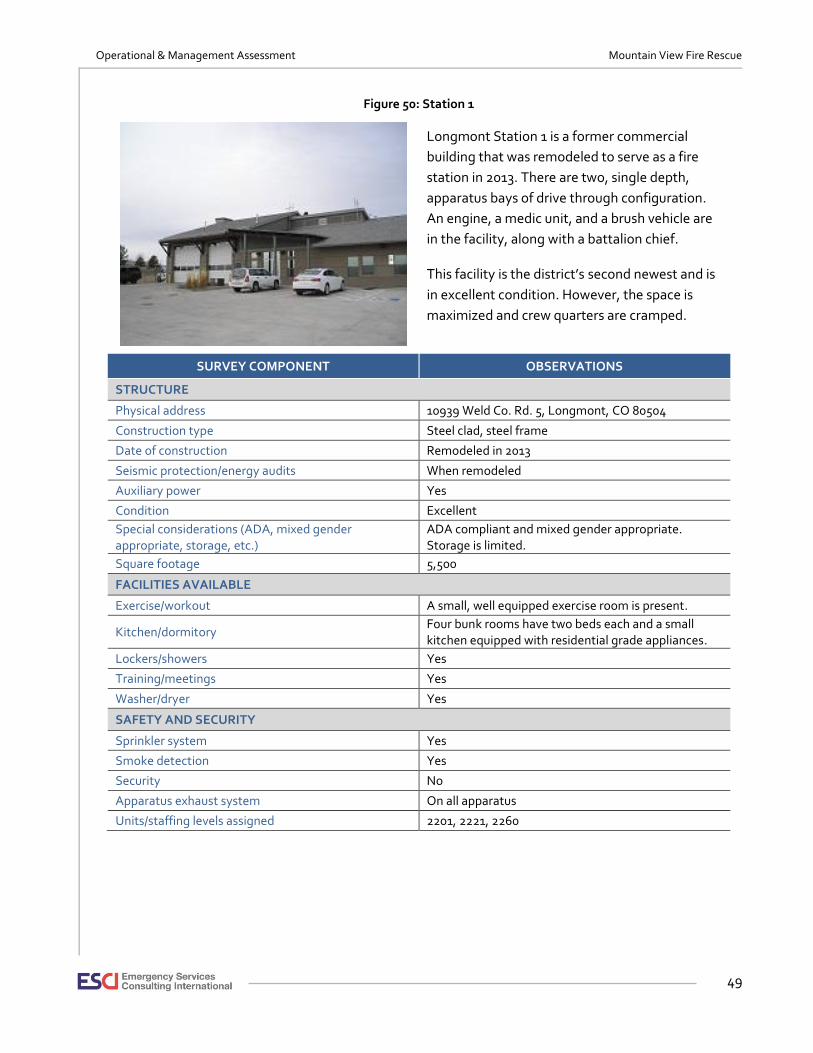
Operational & Management Assessment Mountain View Fire Rescue
49
Figure 50: Station 1
Longmont Station 1 is a former commercial
building that was remodeled to serve as a fire
station in 2013. There are two, single depth,
apparatus bays of drive through configuration.
An engine, a medic unit, and a brush vehicle are
in the facility, along with a battalion chief.
This facility is the district’s second newest and is
in excellent condition. However, the space is
maximized and crew quarters are cramped.
SURVEY COMPONENT OBSERVATIONS
STRUCTURE
Physical address 10939 Weld Co. Rd. 5, Longmont, CO 80504
Construction type Steel clad, steel frame
Date of construction Remodeled in 2013
Seismic protection/energy audits When remodeled
Auxiliary power Yes
Condition Excellent
Special considerations (ADA, mixed gender appropriate, storage, etc.)
ADA compliant and mixed gender appropriate. Storage is limited.
Square footage 5,500
FACILITIES AVAILABLE
Exercise/workout A small, well equipped exercise room is present.
Kitchen/dormitory Four bunk rooms have two beds each and a small kitchen equipped with residential grade appliances.
Lockers/showers Yes
Training/meetings Yes
Washer/dryer Yes
SAFETY AND SECURITY
Sprinkler system Yes
Smoke detection Yes
Security No
Apparatus exhaust system On all apparatus
Units/staffing levels assigned 2201, 2221, 2260
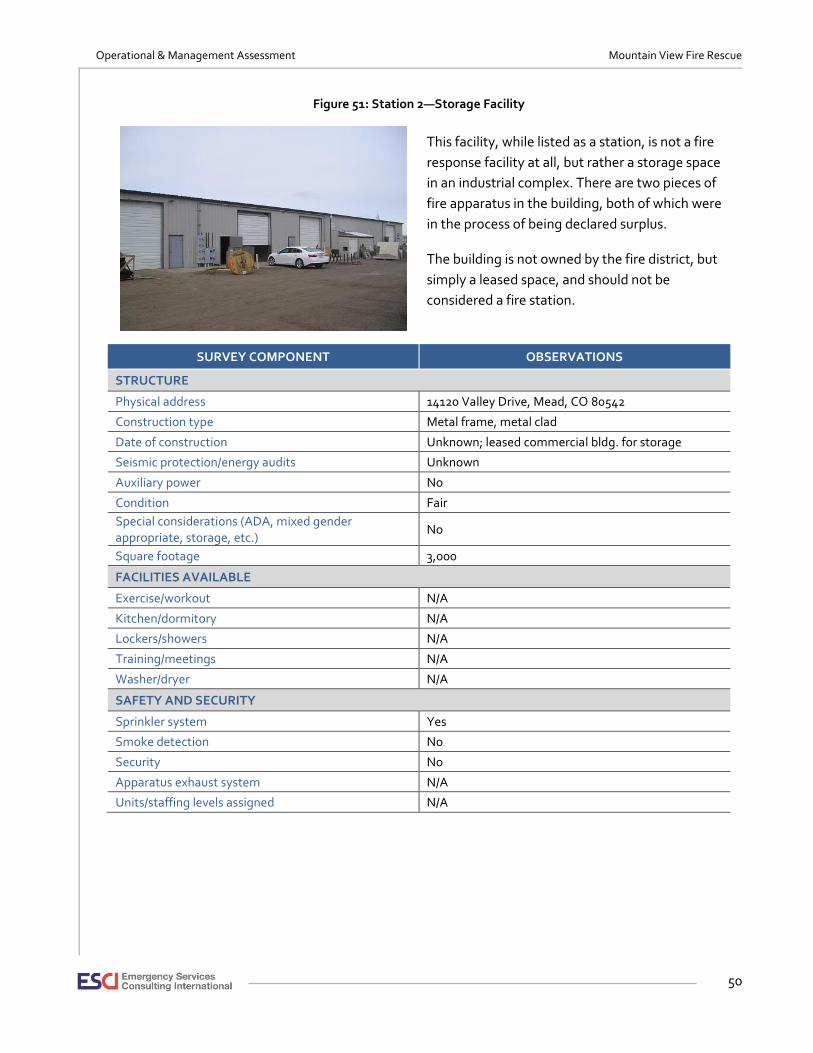
Operational & Management Assessment Mountain View Fire Rescue
50
Figure 51: Station 2—Storage Facility
This facility, while listed as a station, is not a fire
response facility at all, but rather a storage space
in an industrial complex. There are two pieces of
fire apparatus in the building, both of which were
in the process of being declared surplus.
The building is not owned by the fire district, but
simply a leased space, and should not be
considered a fire station.
SURVEY COMPONENT OBSERVATIONS
STRUCTURE
Physical address 14120 Valley Drive, Mead, CO 80542
Construction type Metal frame, metal clad
Date of construction Unknown; leased commercial bldg. for storage
Seismic protection/energy audits Unknown
Auxiliary power No
Condition Fair
Special considerations (ADA, mixed gender appropriate, storage, etc.)
No
Square footage 3,000
FACILITIES AVAILABLE
Exercise/workout N/A
Kitchen/dormitory N/A
Lockers/showers N/A
Training/meetings N/A
Washer/dryer N/A
SAFETY AND SECURITY
Sprinkler system Yes
Smoke detection No
Security No
Apparatus exhaust system N/A
Units/staffing levels assigned N/A
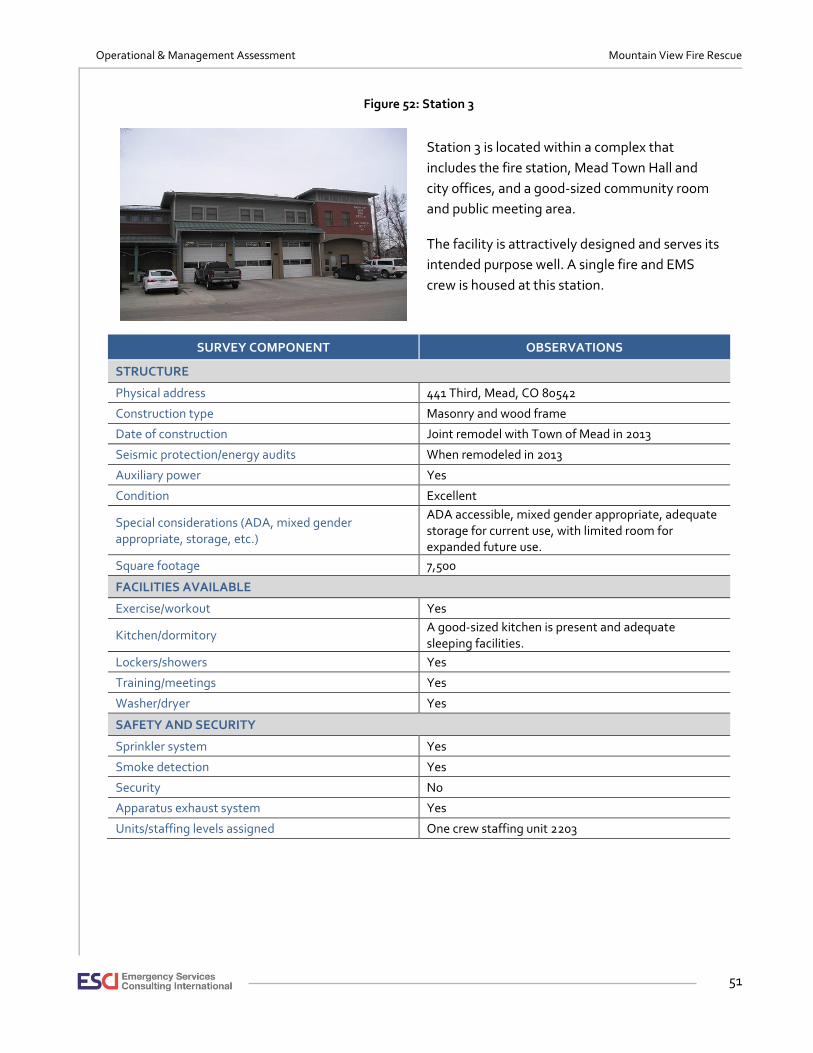
Operational & Management Assessment Mountain View Fire Rescue
51
Figure 52: Station 3
Station 3 is located within a complex that
includes the fire station, Mead Town Hall and
city offices, and a good-sized community room
and public meeting area.
The facility is attractively designed and serves its
intended purpose well. A single fire and EMS
crew is housed at this station.
SURVEY COMPONENT OBSERVATIONS
STRUCTURE
Physical address 441 Third, Mead, CO 80542
Construction type Masonry and wood frame
Date of construction Joint remodel with Town of Mead in 2013
Seismic protection/energy audits When remodeled in 2013
Auxiliary power Yes
Condition Excellent
Special considerations (ADA, mixed gender appropriate, storage, etc.)
ADA accessible, mixed gender appropriate, adequate storage for current use, with limited room for expanded future use.
Square footage 7,500
FACILITIES AVAILABLE
Exercise/workout Yes
Kitchen/dormitory A good-sized kitchen is present and adequate sleeping facilities.
Lockers/showers Yes
Training/meetings Yes
Washer/dryer Yes
SAFETY AND SECURITY
Sprinkler system Yes
Smoke detection Yes
Security No
Apparatus exhaust system Yes
Units/staffing levels assigned One crew staffing unit 2203
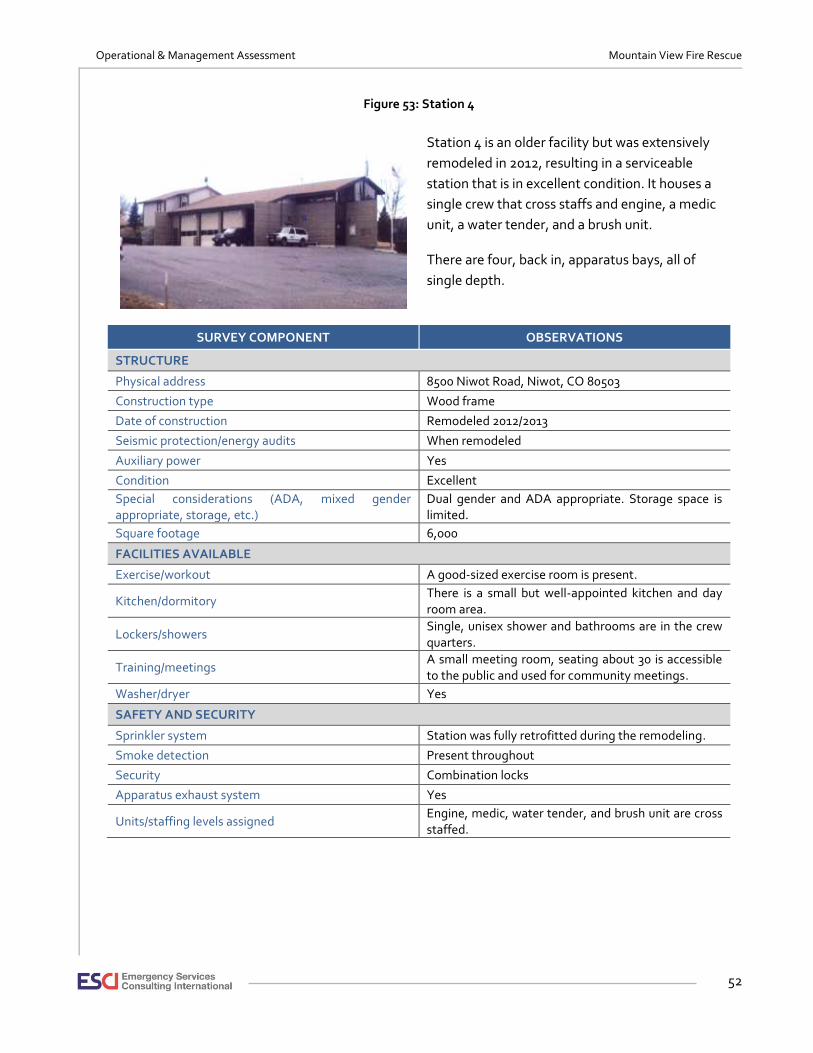
Operational & Management Assessment Mountain View Fire Rescue
52
Figure 53: Station 4
Station 4 is an older facility but was extensively
remodeled in 2012, resulting in a serviceable
station that is in excellent condition. It houses a
single crew that cross staffs and engine, a medic
unit, a water tender, and a brush unit.
There are four, back in, apparatus bays, all of
single depth.
SURVEY COMPONENT OBSERVATIONS
STRUCTURE
Physical address 8500 Niwot Road, Niwot, CO 80503
Construction type Wood frame
Date of construction Remodeled 2012/2013
Seismic protection/energy audits When remodeled
Auxiliary power Yes
Condition Excellent
Special considerations (ADA, mixed gender appropriate, storage, etc.)
Dual gender and ADA appropriate. Storage space is limited.
Square footage 6,000
FACILITIES AVAILABLE
Exercise/workout A good-sized exercise room is present.
Kitchen/dormitory There is a small but well-appointed kitchen and day room area.
Lockers/showers Single, unisex shower and bathrooms are in the crew quarters.
Training/meetings A small meeting room, seating about 30 is accessible to the public and used for community meetings.
Washer/dryer Yes
SAFETY AND SECURITY
Sprinkler system Station was fully retrofitted during the remodeling.
Smoke detection Present throughout
Security Combination locks
Apparatus exhaust system Yes
Units/staffing levels assigned Engine, medic, water tender, and brush unit are cross staffed.
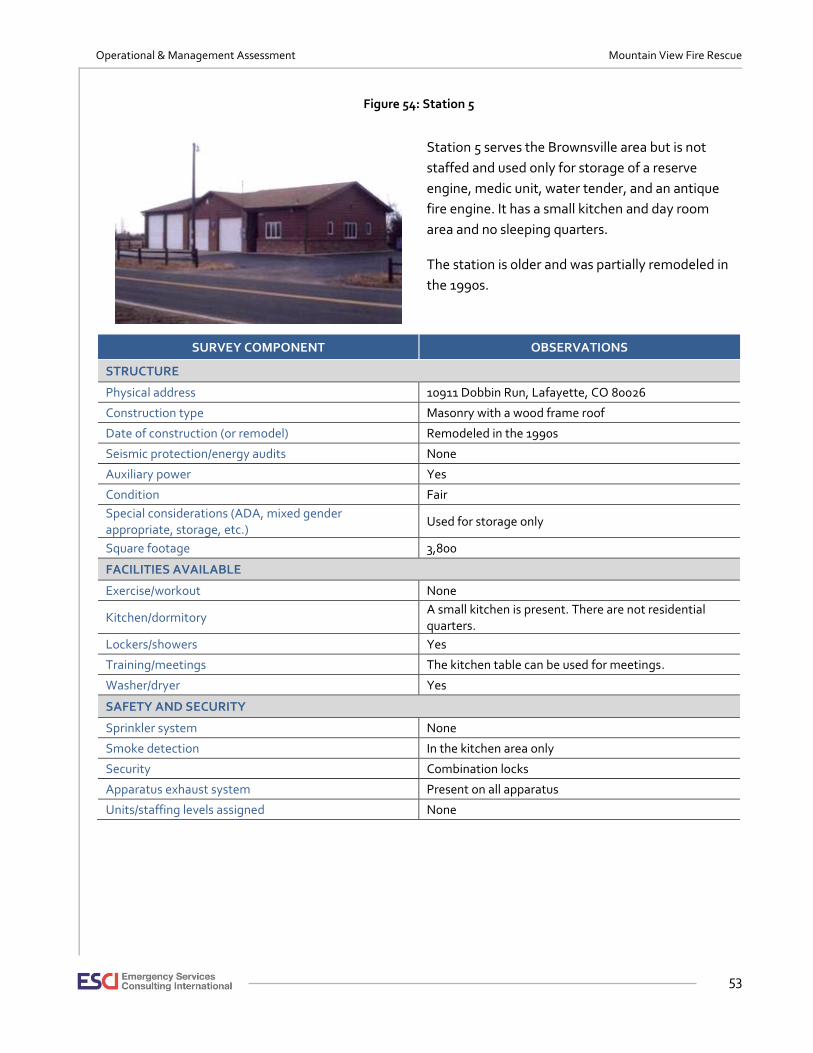
Operational & Management Assessment Mountain View Fire Rescue
53
Figure 54: Station 5
Station 5 serves the Brownsville area but is not
staffed and used only for storage of a reserve
engine, medic unit, water tender, and an antique
fire engine. It has a small kitchen and day room
area and no sleeping quarters.
The station is older and was partially remodeled in
the 1990s.
SURVEY COMPONENT OBSERVATIONS
STRUCTURE
Physical address 10911 Dobbin Run, Lafayette, CO 80026
Construction type Masonry with a wood frame roof
Date of construction (or remodel) Remodeled in the 1990s
Seismic protection/energy audits None
Auxiliary power Yes
Condition Fair
Special considerations (ADA, mixed gender appropriate, storage, etc.)
Used for storage only
Square footage 3,800
FACILITIES AVAILABLE
Exercise/workout None
Kitchen/dormitory A small kitchen is present. There are not residential quarters.
Lockers/showers Yes
Training/meetings The kitchen table can be used for meetings.
Washer/dryer Yes
SAFETY AND SECURITY
Sprinkler system None
Smoke detection In the kitchen area only
Security Combination locks
Apparatus exhaust system Present on all apparatus
Units/staffing levels assigned None
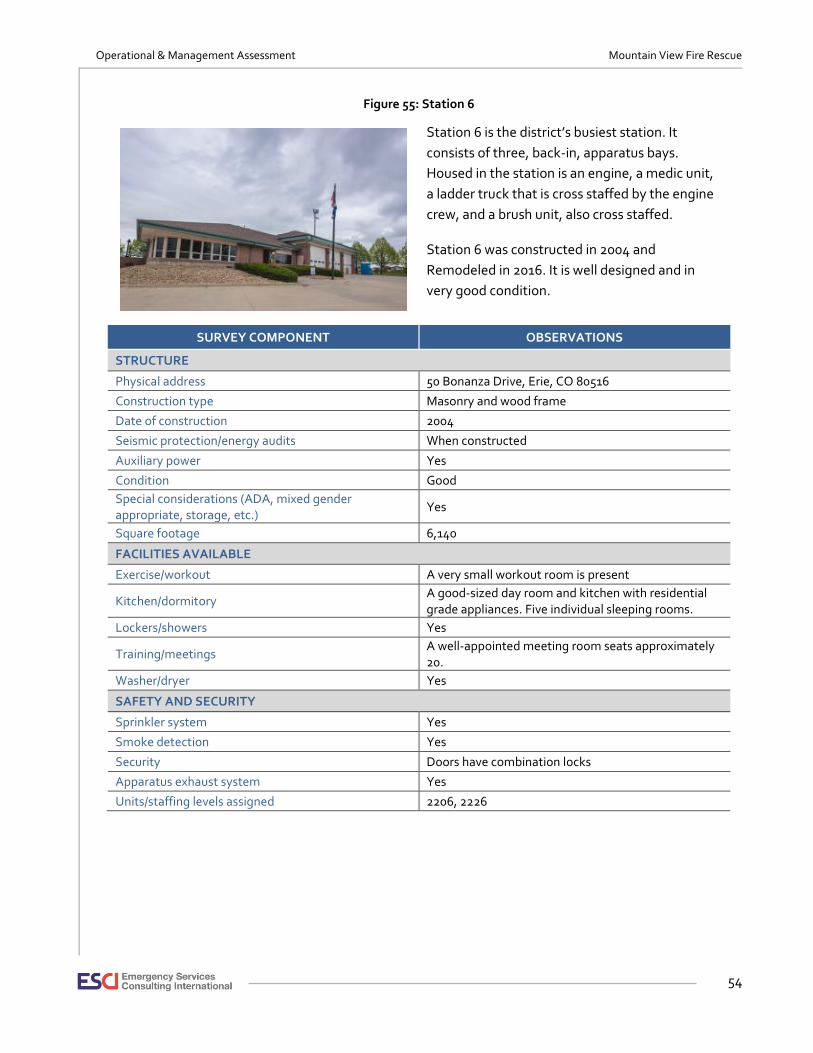
Operational & Management Assessment Mountain View Fire Rescue
54
Figure 55: Station 6
Station 6 is the district’s busiest station. It
consists of three, back-in, apparatus bays.
Housed in the station is an engine, a medic unit,
a ladder truck that is cross staffed by the engine
crew, and a brush unit, also cross staffed.
Station 6 was constructed in 2004 and
Remodeled in 2016. It is well designed and in
very good condition.
SURVEY COMPONENT OBSERVATIONS
STRUCTURE
Physical address 50 Bonanza Drive, Erie, CO 80516
Construction type Masonry and wood frame
Date of construction 2004
Seismic protection/energy audits When constructed
Auxiliary power Yes
Condition Good
Special considerations (ADA, mixed gender appropriate, storage, etc.)
Yes
Square footage 6,140
FACILITIES AVAILABLE
Exercise/workout A very small workout room is present
Kitchen/dormitory A good-sized day room and kitchen with residential grade appliances. Five individual sleeping rooms.
Lockers/showers Yes
Training/meetings A well-appointed meeting room seats approximately 20.
Washer/dryer Yes
SAFETY AND SECURITY
Sprinkler system Yes
Smoke detection Yes
Security Doors have combination locks
Apparatus exhaust system Yes
Units/staffing levels assigned 2206, 2226

Operational & Management Assessment Mountain View Fire Rescue
55
Figure 56: Station 7
Home to a single crew, staffing one engine,
Station 7 also houses the district’s hazardous
materials response resources, a brush vehicle,
and a foam unit. There are three, double depth,
drive through apparatus bays.
This facility is newer, well designed and will
remain serviceable well into the future.
SURVEY COMPONENT OBSERVATIONS
STRUCTURE
Physical address 161 Perry Lane, Dacono, CO 80514
Construction type Masonry
Date of construction 2009
Seismic protection/energy audits When originally constructed
Auxiliary power Yes
Condition Very Good
Special considerations (ADA, mixed gender appropriate, storage, etc.)
ADA compliant, dual gender appropriate, good storage space.
Square footage 9,634
FACILITIES AVAILABLE
Exercise/workout A very small exercise room is present.
Kitchen/dormitory There is a well-appointed kitchen with residential quality appliances. Six single sleeping rooms are present.
Lockers/showers Yes
Training/meetings A meeting room seats approximately 20.
Washer/dryer Yes
SAFETY AND SECURITY
Sprinkler system Yes
Smoke detection Yes
Security A key card lock system is present
Apparatus exhaust system Yes
Units/staffing levels assigned Engine 2207
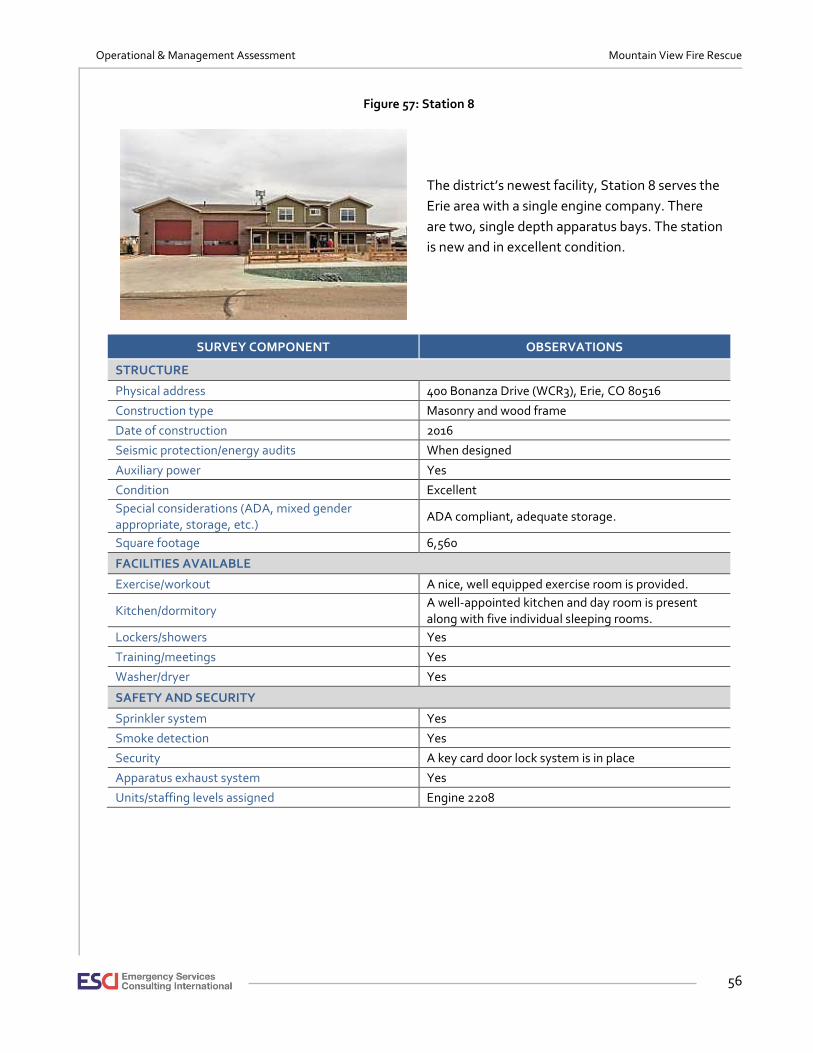
Operational & Management Assessment Mountain View Fire Rescue
56
Figure 57: Station 8
The district’s newest facility, Station 8 serves the
Erie area with a single engine company. There
are two, single depth apparatus bays. The station
is new and in excellent condition.
SURVEY COMPONENT OBSERVATIONS
STRUCTURE
Physical address 400 Bonanza Drive (WCR3), Erie, CO 80516
Construction type Masonry and wood frame
Date of construction 2016
Seismic protection/energy audits When designed
Auxiliary power Yes
Condition Excellent
Special considerations (ADA, mixed gender appropriate, storage, etc.)
ADA compliant, adequate storage.
Square footage 6,560
FACILITIES AVAILABLE
Exercise/workout A nice, well equipped exercise room is provided.
Kitchen/dormitory A well-appointed kitchen and day room is present along with five individual sleeping rooms.
Lockers/showers Yes
Training/meetings Yes
Washer/dryer Yes
SAFETY AND SECURITY
Sprinkler system Yes
Smoke detection Yes
Security A key card door lock system is in place
Apparatus exhaust system Yes
Units/staffing levels assigned Engine 2208

Operational & Management Assessment Mountain View Fire Rescue
57
Figure 58: Station 9—Maintenance Facility
Station 9 is not a responding fire station, but
rather the district’s apparatus maintenance
facility. It is a small, three bay metal building
with some office and storage space.
This facility is in poor condition and is due for
replacement. It is not considered as a response
station.
SURVEY COMPONENT OBSERVATIONS
STRUCTURE
Physical address 100 S. Forrest, Dacono, CO 80514 – Maintenance
Construction type Metal Building
Date of construction 1970's
Seismic protection/energy audits None
Auxiliary power No
Condition Poor
Special considerations (ADA, mixed gender appropriate, storage, etc.)
Storage is maximized, facility is not ADA compliant.
Square footage 5500
FACILITIES AVAILABLE
Exercise/workout No
Kitchen/dormitory Yes, but not used for 24-hour housing.
Lockers/showers Yes
Training/meetings No
Washer/dryer Yes
SAFETY AND SECURITY
Sprinkler system No
Smoke detection Yes
Security No
Apparatus exhaust system Yes
Units/staffing levels assigned Vehicle Maintenance Facility

Operational & Management Assessment Mountain View Fire Rescue
58
Figure 59: Station 10—Training Facility
Station 10 is also no longer a facility from which
emergency responders are deployed. A former
fire station, this building now serves as the
district’s training offices as well as its health and
wellness program resources.
The structure is older and, while in fair condition,
will likely present ongoing and increasing
maintenance costs to the district.
SURVEY COMPONENT OBSERVATIONS
STRUCTURE
Physical address 9119 E. County Line Road, Longmont, CO 80501
Construction type Wood frame
Date of construction (or remodel) Built approx. 1970s, remodeled mid-1990s and 2016
Seismic protection/energy audits None
Auxiliary power Yes
Condition Fair
Special considerations (ADA, mixed gender appropriate, storage, etc.)
ADA accessible, dual gender appropriate and storage is adequate.
Square footage 7,000
FACILITIES AVAILABLE
Exercise/workout An extensive workout facility is present as a part of the district’s health and wellness program.
Kitchen/dormitory A kitchen is present; and two bedrooms.
Lockers/showers Yes
Training/meetings A meeting room seats approximately 40 students.
Washer/dryer Yes
FACILITIES AVAILABLE
Sprinkler system None
Smoke detection Present
Security Doors are secured with combination locks
Apparatus exhaust system Yes

Operational & Management Assessment Mountain View Fire Rescue
59
Figure 60: Administrative Building
The MVFD administrative offices are located in a
former bank that was remodeled in 2013 for the
purpose. It is an attractive and spacious facility
that serves effectively for its intended purpose.
There are 19 offices and several meeting spaces
in the building.
There are no emergency response crews located
at this facility, other than district command staff.
SURVEY COMPONENT OBSERVATIONS
STRUCTURE
Physical address 3561 N. Stagecoach Road, Longmont, CO 80504
Construction type Wood frame
Date Built 1990's, remodeled 2013
Seismic protection/energy audits When remodeled
Auxiliary power No
Condition Very Good
Special considerations (ADA, mixed gender appropriate, storage, etc.)
Building is ADA compliant, mixed gender appropriate and has adequate space and storage.
Square footage 8,000
FACILITIES AVAILABLE
Exercise/workout No
Kitchen/dormitory Kitchen, no dormitory
Lockers/showers No
Training/meetings Yes
Washer/dryer No
FACILITIES AVAILABLE
Sprinkler system Yes
Smoke detection Yes
Security Electronic card locks
Apparatus exhaust system No
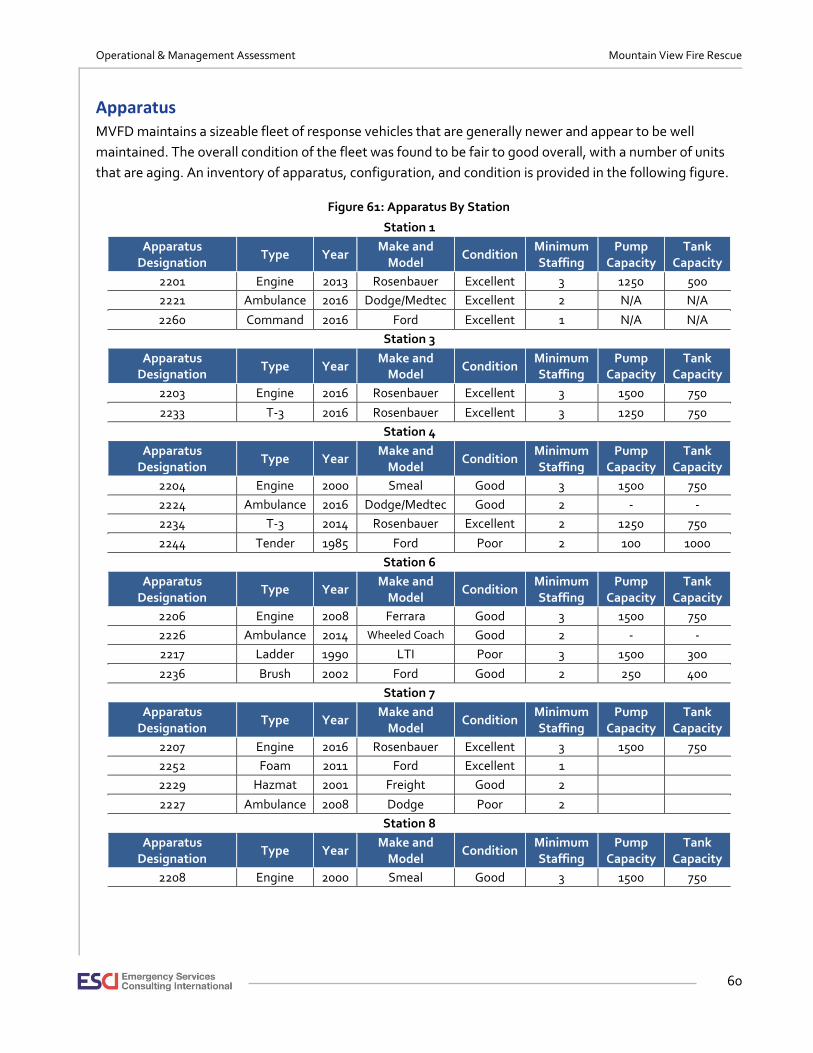
Operational & Management Assessment Mountain View Fire Rescue
60
Apparatus MVFD maintains a sizeable fleet of response vehicles that are generally newer and appear to be well
maintained. The overall condition of the fleet was found to be fair to good overall, with a number of units
that are aging. An inventory of apparatus, configuration, and condition is provided in the following figure.
Figure 61: Apparatus By Station
Station 1
Apparatus Designation
Type Year Make and
Model Condition
Minimum Staffing
Pump Capacity
Tank Capacity
2201 Engine 2013 Rosenbauer Excellent 3 1250 500
2221 Ambulance 2016 Dodge/Medtec Excellent 2 N/A N/A
2260 Command 2016 Ford Excellent 1 N/A N/A
Station 3
Apparatus Designation
Type Year Make and
Model Condition
Minimum Staffing
Pump Capacity
Tank Capacity
2203 Engine 2016 Rosenbauer Excellent 3 1500 750
2233 T-3 2016 Rosenbauer Excellent 3 1250 750
Station 4
Apparatus Designation
Type Year Make and
Model Condition
Minimum Staffing
Pump Capacity
Tank Capacity
2204 Engine 2000 Smeal Good 3 1500 750
2224 Ambulance 2016 Dodge/Medtec Good 2 - -
2234 T-3 2014 Rosenbauer Excellent 2 1250 750
2244 Tender 1985 Ford Poor 2 100 1000
Station 6
Apparatus Designation
Type Year Make and
Model Condition
Minimum Staffing
Pump Capacity
Tank Capacity
2206 Engine 2008 Ferrara Good 3 1500 750
2226 Ambulance 2014 Wheeled Coach Good 2 - -
2217 Ladder 1990 LTI Poor 3 1500 300
2236 Brush 2002 Ford Good 2 250 400
Station 7
Apparatus Designation
Type Year Make and
Model Condition
Minimum Staffing
Pump Capacity
Tank Capacity
2207 Engine 2016 Rosenbauer Excellent 3 1500 750
2252 Foam 2011 Ford Excellent 1
2229 Hazmat 2001 Freight Good 2
2227 Ambulance 2008 Dodge Poor 2
Station 8
Apparatus Designation
Type Year Make and
Model Condition
Minimum Staffing
Pump Capacity
Tank Capacity
2208 Engine 2000 Smeal Good 3 1500 750
Operational & Management Assessment Mountain View Fire Rescue
61
Discussion
MVFD’s vehicles range in age from one to 32 years of age, with an average of 9.3 years. Three units exceed
20 years of age and will need replacement soon, depending on their current use.
Capital Replacement Planning Fire apparatus are typically unique pieces of equipment, often very customized to operate efficiently in a
narrowly defined mission. A pumper may be engineered such that the compartments fit specific equipment
and tools, with virtually every space on the truck designated in advance for functionality. This same vehicle,
with its specialized design, cannot be expected to function in a completely different capacity, such as a
hazardous materials unit or a rescue squad. For this reason, fire apparatus is very expensive and offers little
flexibility in use and reassignment. As a result, communities across the country have sought to achieve the
longest life span possible for these vehicles.
Unfortunately, no mechanical piece of equipment can be expected to last forever. As a vehicle ages, repairs
tend to become more frequent, parts more difficult to obtain, and downtime for repair increases. Given the
emergency mission that is so critical to the community, this factor of downtime is one of the most
frequently identified reasons for apparatus replacement.
Because of the large expense of fire apparatus, most communities find the need to plan for the cost of
replacement. To properly do so, agencies often turn to the long-accepted practice of establishing a life
cycle for the apparatus that results in a replacement date being anticipated well in advance. Forward
thinking organizations then set aside incremental funds during the life of the vehicle so replacement dollars
are ready when needed.
The same holds true for fire stations, training grounds, and other fixed facilities. And as support equipment
becomes costlier, particularly EMS equipment, planning for the replacement of these items is of equal
importance.
ESCI surveyed capital replacement planning efforts at MVFR, summarized in the following figure.
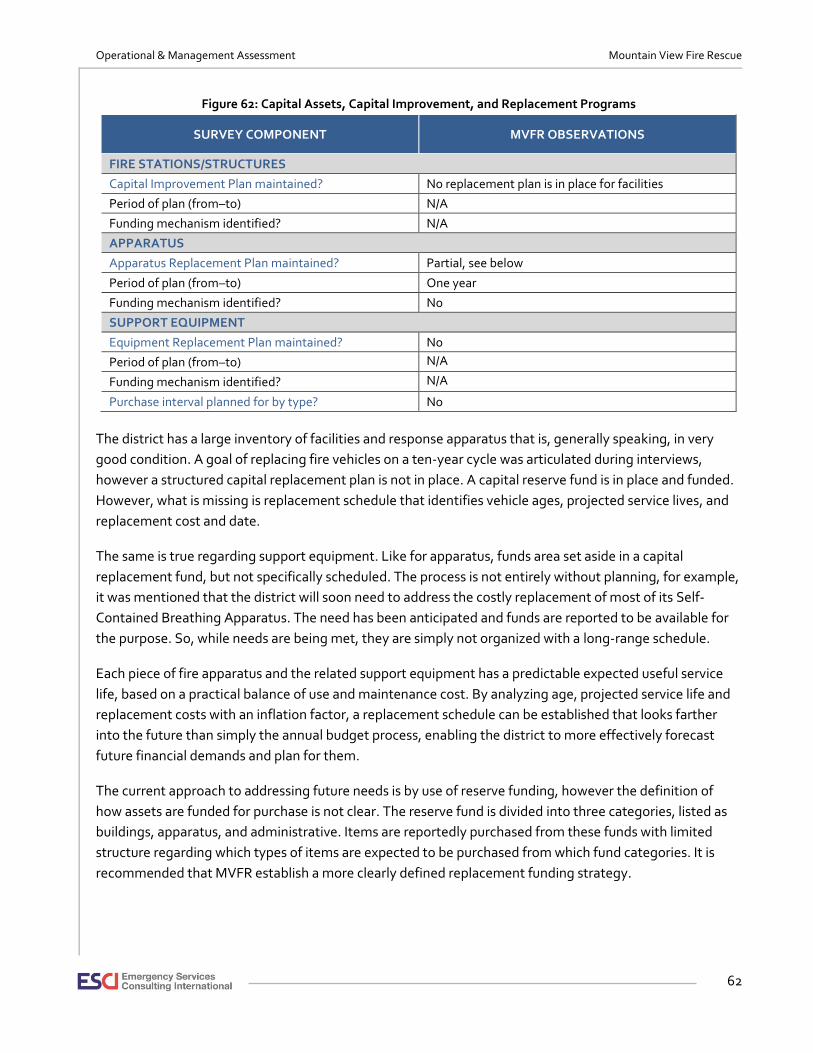
Operational & Management Assessment Mountain View Fire Rescue
62
Figure 62: Capital Assets, Capital Improvement, and Replacement Programs
SURVEY COMPONENT MVFR OBSERVATIONS
FIRE STATIONS/STRUCTURES
Capital Improvement Plan maintained? No replacement plan is in place for facilities
Period of plan (from–to) N/A
Funding mechanism identified? N/A
APPARATUS
Apparatus Replacement Plan maintained? Partial, see below
Period of plan (from–to) One year
Funding mechanism identified? No
SUPPORT EQUIPMENT
Equipment Replacement Plan maintained? No
Period of plan (from–to) N/A
Funding mechanism identified? N/A
Purchase interval planned for by type? No
The district has a large inventory of facilities and response apparatus that is, generally speaking, in very
good condition. A goal of replacing fire vehicles on a ten-year cycle was articulated during interviews,
however a structured capital replacement plan is not in place. A capital reserve fund is in place and funded.
However, what is missing is replacement schedule that identifies vehicle ages, projected service lives, and
replacement cost and date.
The same is true regarding support equipment. Like for apparatus, funds area set aside in a capital
replacement fund, but not specifically scheduled. The process is not entirely without planning, for example,
it was mentioned that the district will soon need to address the costly replacement of most of its Self-
Contained Breathing Apparatus. The need has been anticipated and funds are reported to be available for
the purpose. So, while needs are being met, they are simply not organized with a long-range schedule.
Each piece of fire apparatus and the related support equipment has a predictable expected useful service
life, based on a practical balance of use and maintenance cost. By analyzing age, projected service life and
replacement costs with an inflation factor, a replacement schedule can be established that looks farther
into the future than simply the annual budget process, enabling the district to more effectively forecast
future financial demands and plan for them.
The current approach to addressing future needs is by use of reserve funding, however the definition of
how assets are funded for purchase is not clear. The reserve fund is divided into three categories, listed as
buildings, apparatus, and administrative. Items are reportedly purchased from these funds with limited
structure regarding which types of items are expected to be purchased from which fund categories. It is
recommended that MVFR establish a more clearly defined replacement funding strategy.
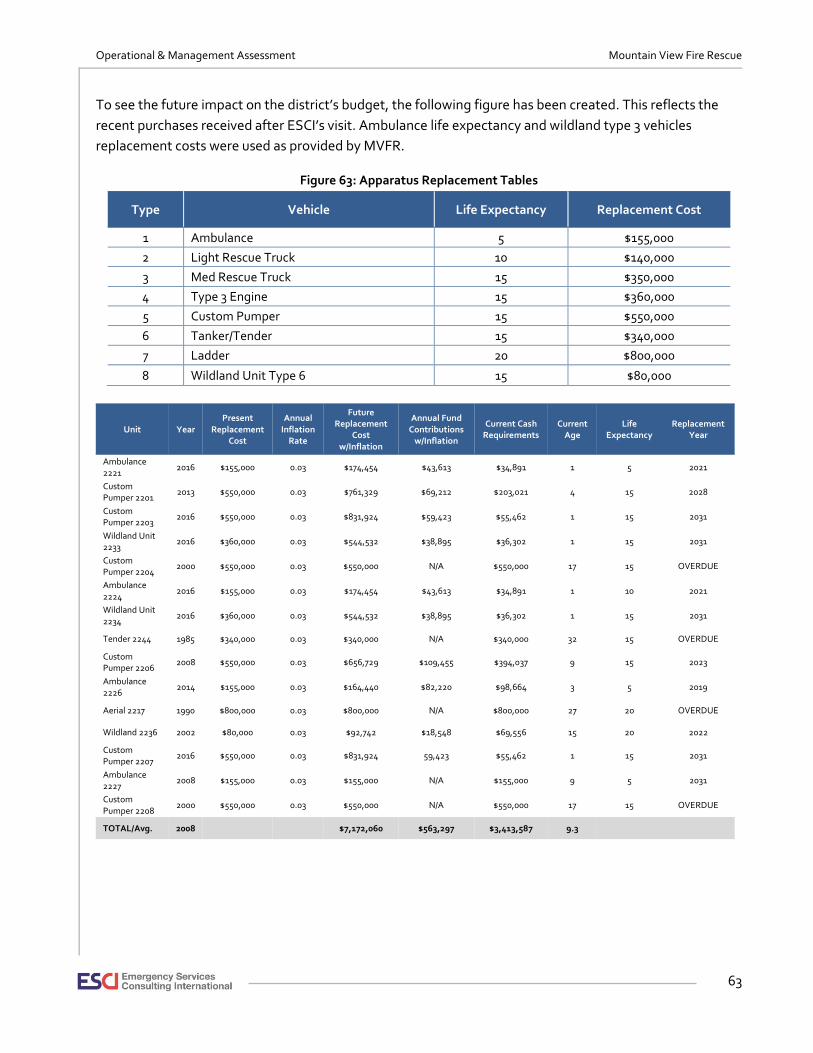
Operational & Management Assessment Mountain View Fire Rescue
63
To see the future impact on the district’s budget, the following figure has been created. This reflects the
recent purchases received after ESCI’s visit. Ambulance life expectancy and wildland type 3 vehicles
replacement costs were used as provided by MVFR.
Figure 63: Apparatus Replacement Tables
Type Vehicle Life Expectancy Replacement Cost
1 Ambulance 5 $155,000
2 Light Rescue Truck 10 $140,000
3 Med Rescue Truck 15 $350,000
4 Type 3 Engine 15 $360,000
5 Custom Pumper 15 $550,000
6 Tanker/Tender 15 $340,000
7 Ladder 20 $800,000
8 Wildland Unit Type 6 15 $80,000
Unit Year Present
Replacement Cost
Annual Inflation
Rate
Future Replacement
Cost w/Inflation
Annual Fund Contributions
w/Inflation
Current Cash Requirements
Current Age
Life Expectancy
Replacement Year
Ambulance 2221
2016 $155,000 0.03 $174,454 $43,613 $34,891 1 5 2021
Custom Pumper 2201
2013 $550,000 0.03 $761,329 $69,212 $203,021 4 15 2028
Custom Pumper 2203
2016 $550,000 0.03 $831,924 $59,423 $55,462 1 15 2031
Wildland Unit 2233
2016 $360,000 0.03 $544,532 $38,895 $36,302 1 15 2031
Custom Pumper 2204
2000 $550,000 0.03 $550,000 N/A $550,000 17 15 OVERDUE
Ambulance 2224
2016 $155,000 0.03 $174,454 $43,613 $34,891 1 10 2021
Wildland Unit 2234
2016 $360,000 0.03 $544,532 $38,895 $36,302 1 15 2031
Tender 2244 1985 $340,000 0.03 $340,000 N/A $340,000 32 15 OVERDUE
Custom Pumper 2206
2008 $550,000 0.03 $656,729 $109,455 $394,037 9 15 2023
Ambulance 2226
2014 $155,000 0.03 $164,440 $82,220 $98,664 3 5 2019
Aerial 2217 1990 $800,000 0.03 $800,000 N/A $800,000 27 20 OVERDUE
Wildland 2236 2002 $80,000 0.03 $92,742 $18,548 $69,556 15 20 2022
Custom Pumper 2207
2016 $550,000 0.03 $831,924 59,423 $55,462 1 15 2031
Ambulance 2227
2008 $155,000 0.03 $155,000 N/A $155,000 9 5 2031
Custom Pumper 2208
2000 $550,000 0.03 $550,000 N/A $550,000 17 15 OVERDUE
TOTAL/Avg. 2008 $7,172,060 $563,297 $3,413,587 9.3

Operational & Management Assessment Mountain View Fire Rescue
64
The previous figure reflects the entire fleet except for the command car, hazardous material unit, and foam
truck. The replacement costs are reflected in the top table and the assumed inflation factor is three percent
for all units. If all units were to be replaced on schedule it will cost $7,172,060. Based on what should be in
the replacement fund as of today is $3,413,587 with an annual contribution to the fund of $563,298. It is
likely that not all of these units will be replaced as some may be reserve units that will be surplused and
units replaced on front line will rotate to reserve status. Also, costs will change depending on the features
required in the replacements. The replacement costs may not be accurate for what MVFR buys. This type of
analysis helps to determine what future costs will be.
RECOMMENDATIONS:
• Establish a financial plan that fully provides for funding of the district’s apparatus replacement schedule.
• Develop a plan and funding strategy for support equipment.
• Provide additional structure to the budgeting of reserve funding and categorization of asset replacement types.
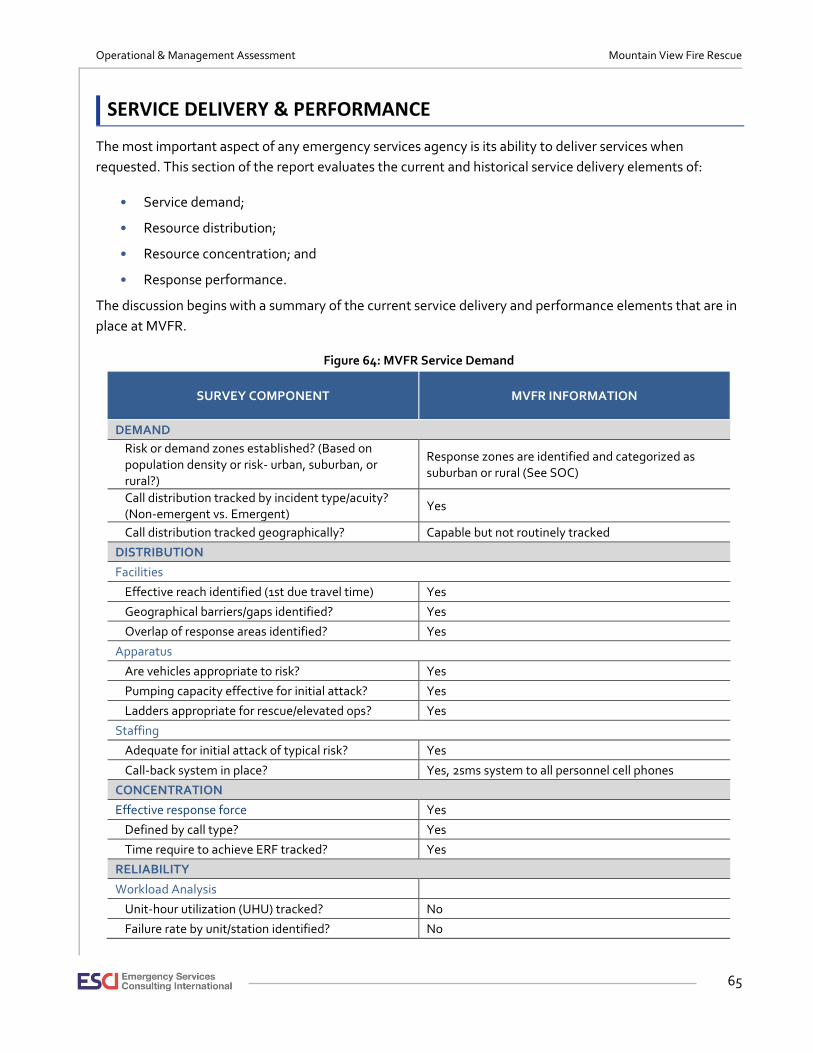
Operational & Management Assessment Mountain View Fire Rescue
65
SERVICE DELIVERY & PERFORMANCE
The most important aspect of any emergency services agency is its ability to deliver services when
requested. This section of the report evaluates the current and historical service delivery elements of:
• Service demand;
• Resource distribution;
• Resource concentration; and
• Response performance.
The discussion begins with a summary of the current service delivery and performance elements that are in
place at MVFR.
Figure 64: MVFR Service Demand
SURVEY COMPONENT MVFR INFORMATION
DEMAND
Risk or demand zones established? (Based on population density or risk- urban, suburban, or rural?)
Response zones are identified and categorized as suburban or rural (See SOC)
Call distribution tracked by incident type/acuity? (Non-emergent vs. Emergent)
Yes
Call distribution tracked geographically? Capable but not routinely tracked
DISTRIBUTION
Facilities
Effective reach identified (1st due travel time) Yes
Geographical barriers/gaps identified? Yes
Overlap of response areas identified? Yes
Apparatus
Are vehicles appropriate to risk? Yes
Pumping capacity effective for initial attack? Yes
Ladders appropriate for rescue/elevated ops? Yes
Staffing
Adequate for initial attack of typical risk? Yes
Call-back system in place? Yes, 2sms system to all personnel cell phones
CONCENTRATION
Effective response force Yes
Defined by call type? Yes
Time require to achieve ERF tracked? Yes
RELIABILITY
Workload Analysis
Unit-hour utilization (UHU) tracked? No
Failure rate by unit/station identified? No
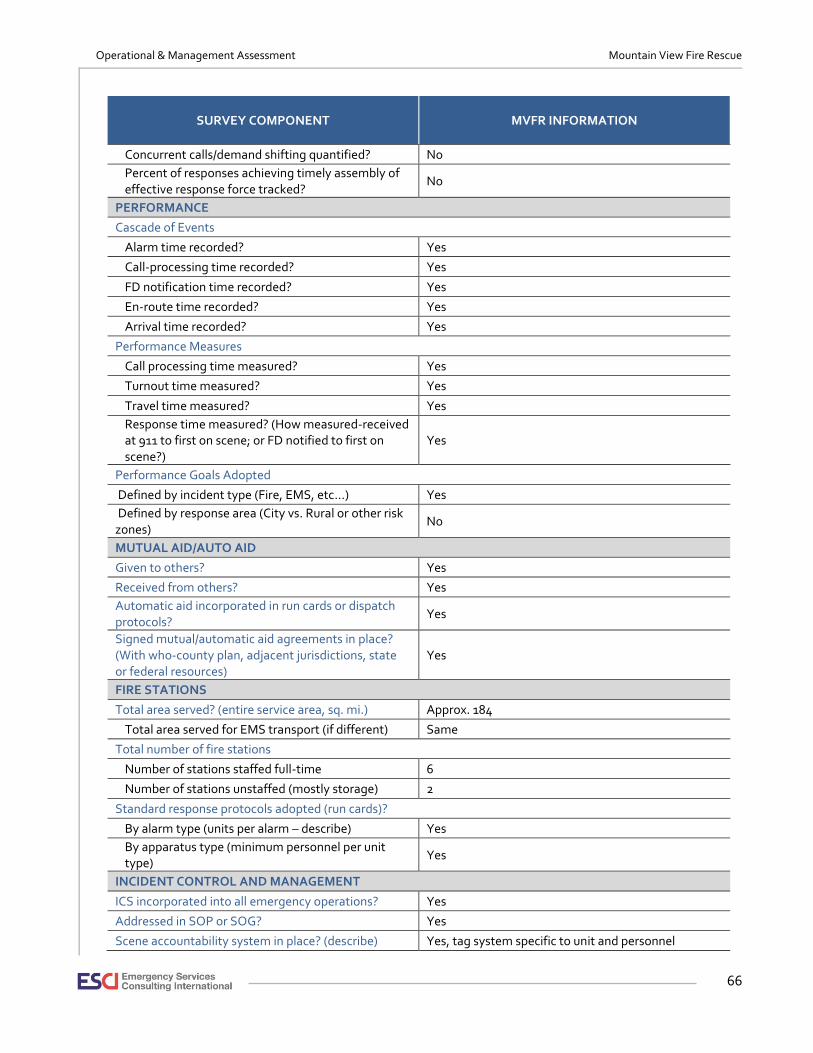
Operational & Management Assessment Mountain View Fire Rescue
66
SURVEY COMPONENT MVFR INFORMATION
Concurrent calls/demand shifting quantified? No
Percent of responses achieving timely assembly of effective response force tracked?
No
PERFORMANCE
Cascade of Events
Alarm time recorded? Yes
Call-processing time recorded? Yes
FD notification time recorded? Yes
En-route time recorded? Yes
Arrival time recorded? Yes
Performance Measures
Call processing time measured? Yes
Turnout time measured? Yes
Travel time measured? Yes
Response time measured? (How measured-received at 911 to first on scene; or FD notified to first on scene?)
Yes
Performance Goals Adopted
Defined by incident type (Fire, EMS, etc...) Yes
Defined by response area (City vs. Rural or other risk zones)
No
MUTUAL AID/AUTO AID
Given to others? Yes
Received from others? Yes
Automatic aid incorporated in run cards or dispatch protocols?
Yes
Signed mutual/automatic aid agreements in place? (With who-county plan, adjacent jurisdictions, state or federal resources)
Yes
FIRE STATIONS
Total area served? (entire service area, sq. mi.) Approx. 184
Total area served for EMS transport (if different) Same
Total number of fire stations
Number of stations staffed full-time 6
Number of stations unstaffed (mostly storage) 2
Standard response protocols adopted (run cards)?
By alarm type (units per alarm – describe) Yes
By apparatus type (minimum personnel per unit type)
Yes
INCIDENT CONTROL AND MANAGEMENT
ICS incorporated into all emergency operations? Yes
Addressed in SOP or SOG? Yes
Scene accountability system in place? (describe) Yes, tag system specific to unit and personnel
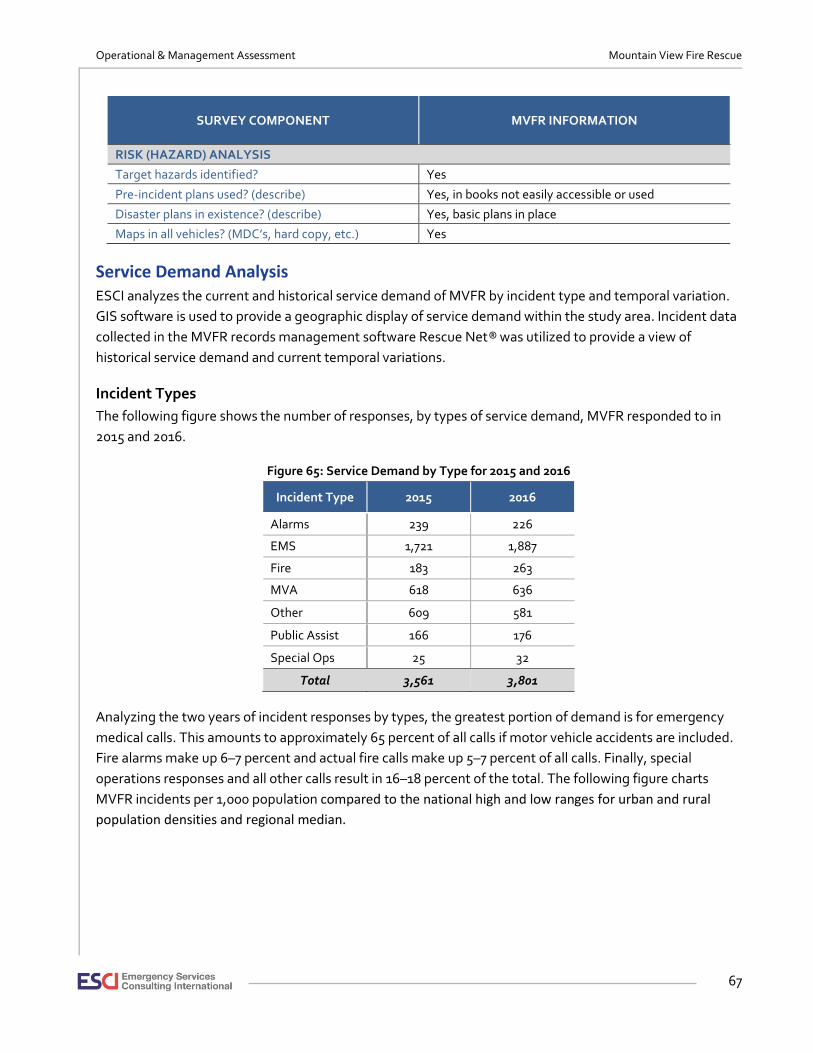
Operational & Management Assessment Mountain View Fire Rescue
67
SURVEY COMPONENT MVFR INFORMATION
RISK (HAZARD) ANALYSIS
Target hazards identified? Yes
Pre-incident plans used? (describe) Yes, in books not easily accessible or used
Disaster plans in existence? (describe) Yes, basic plans in place
Maps in all vehicles? (MDC’s, hard copy, etc.) Yes
Service Demand Analysis ESCI analyzes the current and historical service demand of MVFR by incident type and temporal variation.
GIS software is used to provide a geographic display of service demand within the study area. Incident data
collected in the MVFR records management software Rescue Net® was utilized to provide a view of
historical service demand and current temporal variations.
Incident Types
The following figure shows the number of responses, by types of service demand, MVFR responded to in
2015 and 2016.
Figure 65: Service Demand by Type for 2015 and 2016
Incident Type 2015 2016
Alarms 239 226
EMS 1,721 1,887
Fire 183 263
MVA 618 636
Other 609 581
Public Assist 166 176
Special Ops 25 32
Total 3,561 3,801
Analyzing the two years of incident responses by types, the greatest portion of demand is for emergency
medical calls. This amounts to approximately 65 percent of all calls if motor vehicle accidents are included.
Fire alarms make up 6–7 percent and actual fire calls make up 5–7 percent of all calls. Finally, special
operations responses and all other calls result in 16–18 percent of the total. The following figure charts
MVFR incidents per 1,000 population compared to the national high and low ranges for urban and rural
population densities and regional median.
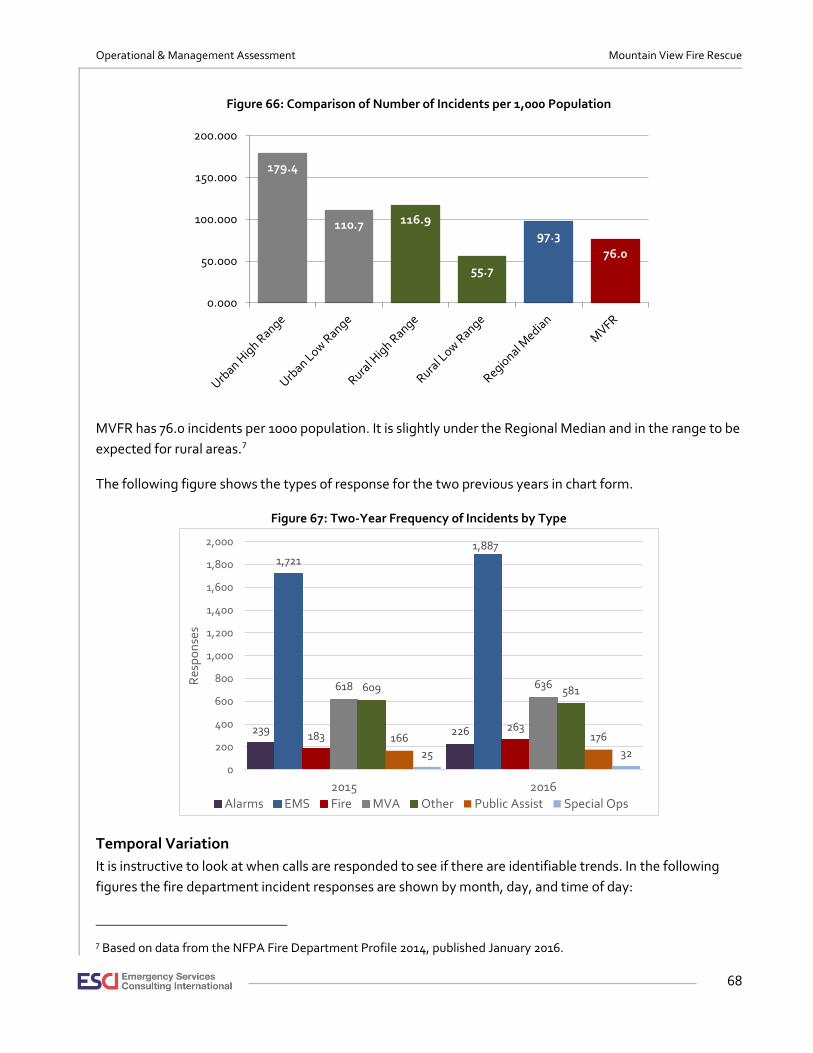
Operational & Management Assessment Mountain View Fire Rescue
68
Figure 66: Comparison of Number of Incidents per 1,000 Population
MVFR has 76.0 incidents per 1000 population. It is slightly under the Regional Median and in the range to be
expected for rural areas.7
The following figure shows the types of response for the two previous years in chart form.
Figure 67: Two-Year Frequency of Incidents by Type
Temporal Variation
It is instructive to look at when calls are responded to see if there are identifiable trends. In the following
figures the fire department incident responses are shown by month, day, and time of day:
7 Based on data from the NFPA Fire Department Profile 2014, published January 2016.
179.4
110.7 116.9
55.7
97.3
76.0
0.000
50.000
100.000
150.000
200.000
239 226
1,7211,887
183263
618 636609 581
166 176
25 32
0
200
400
600
800
1,000
1,200
1,400
1,600
1,800
2,000
2015 2016
Res
po
nse
s
Alarms EMS Fire MVA Other Public Assist Special Ops
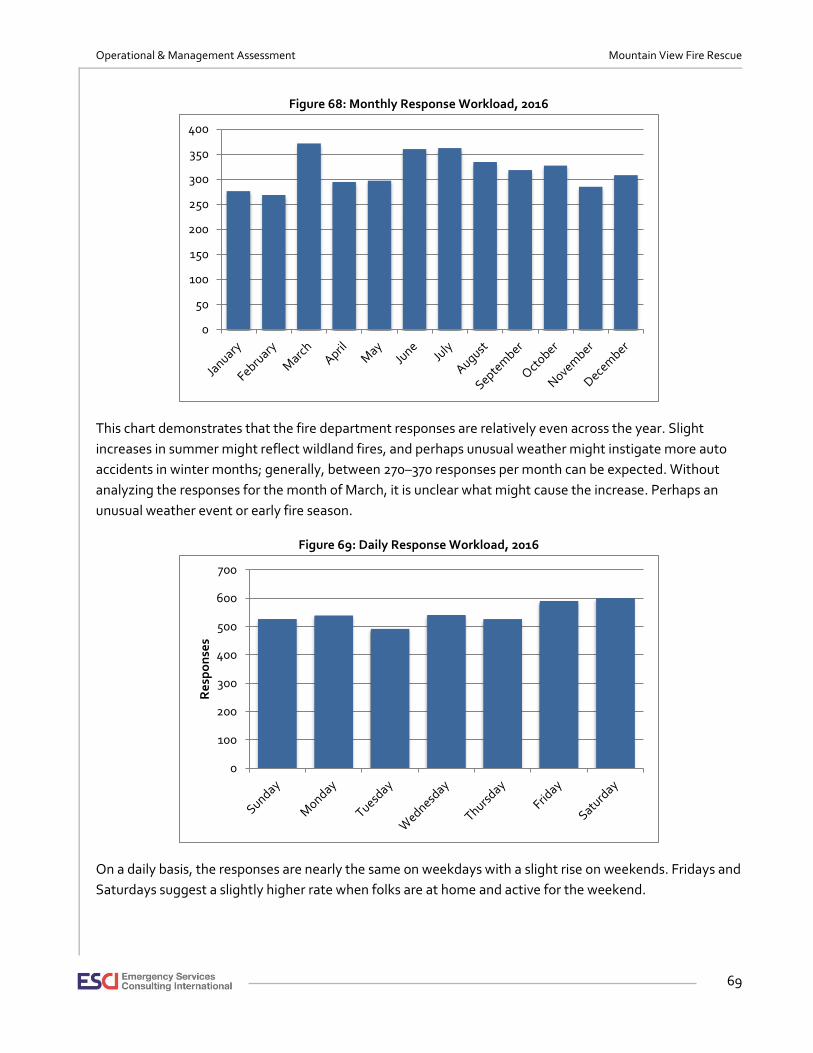
Operational & Management Assessment Mountain View Fire Rescue
69
Figure 68: Monthly Response Workload, 2016
This chart demonstrates that the fire department responses are relatively even across the year. Slight
increases in summer might reflect wildland fires, and perhaps unusual weather might instigate more auto
accidents in winter months; generally, between 270–370 responses per month can be expected. Without
analyzing the responses for the month of March, it is unclear what might cause the increase. Perhaps an
unusual weather event or early fire season.
Figure 69: Daily Response Workload, 2016
On a daily basis, the responses are nearly the same on weekdays with a slight rise on weekends. Fridays and
Saturdays suggest a slightly higher rate when folks are at home and active for the weekend.
0
50
100
150
200
250
300
350
400
0
100
200
300
400
500
600
700
Re
spo
nse
s
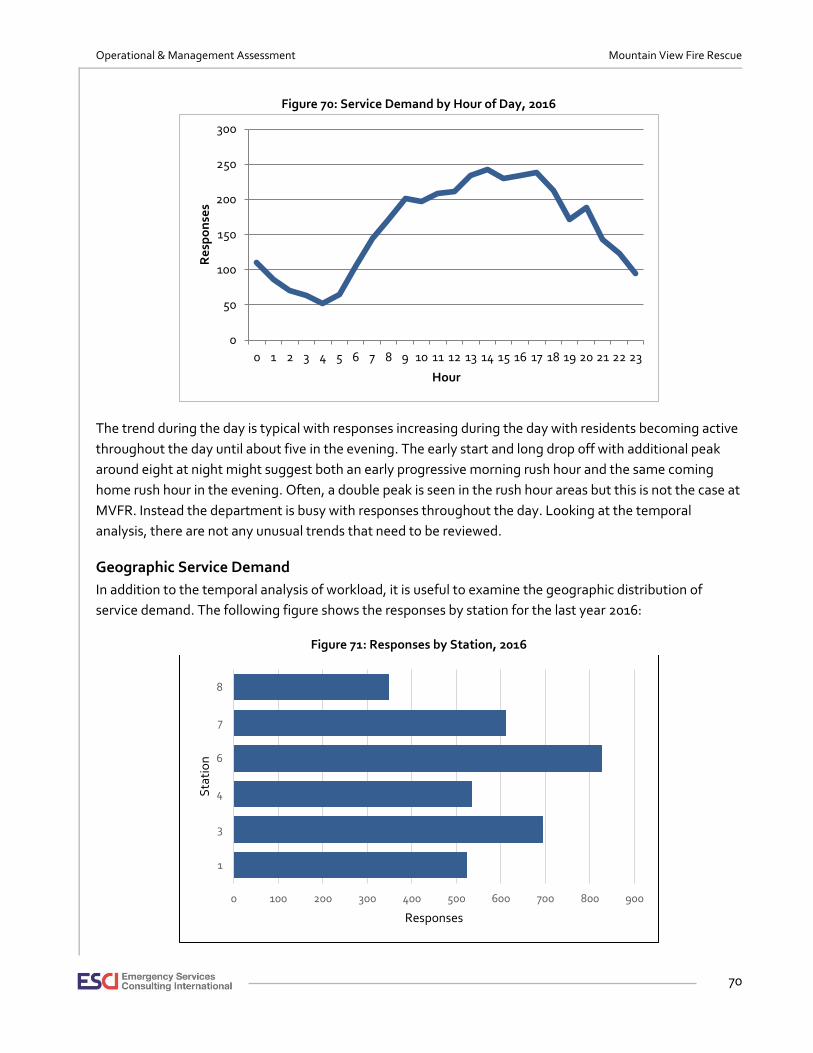
Operational & Management Assessment Mountain View Fire Rescue
70
Figure 70: Service Demand by Hour of Day, 2016
The trend during the day is typical with responses increasing during the day with residents becoming active
throughout the day until about five in the evening. The early start and long drop off with additional peak
around eight at night might suggest both an early progressive morning rush hour and the same coming
home rush hour in the evening. Often, a double peak is seen in the rush hour areas but this is not the case at
MVFR. Instead the department is busy with responses throughout the day. Looking at the temporal
analysis, there are not any unusual trends that need to be reviewed.
Geographic Service Demand
In addition to the temporal analysis of workload, it is useful to examine the geographic distribution of
service demand. The following figure shows the responses by station for the last year 2016:
Figure 71: Responses by Station, 2016
0
50
100
150
200
250
300
0 1 2 3 4 5 6 7 8 9 10 11 12 13 14 15 16 17 18 19 20 21 22 23
Re
spo
nse
s
Hour
0 100 200 300 400 500 600 700 800 900
1
3
4
6
7
8
Responses
Sta
tio
n
Operational & Management Assessment Mountain View Fire Rescue
71
Stations three, six, and seven are the busiest stations on an annual basis. While Station 8 was only
operational for a short time in 2016, the responses for that station were counted if occurring in Station 8’s
first due response area. The percentages of total call volume run from Station 8 at 9.2 percent to Station 6
at nearly 22 percent. Service demand is allocated by geographical location of population relative to the
station location, so it is difficult to closely balance all stations. A unit utilization and reliability analysis will
determine if units are overloaded and if a strategy to rebalance the call load is necessary. The following
figures will show the locations of incident responses geographically.
GIS Incident Density
ESCI uses geographic information systems software (GIS) to plot the location of incidents within the MVFR
study area, during 2015 and 2016, and calculated the mathematical density of incidents in the study area.
The next figure shows incident density over the two-year analysis period. This map shows all incidents:
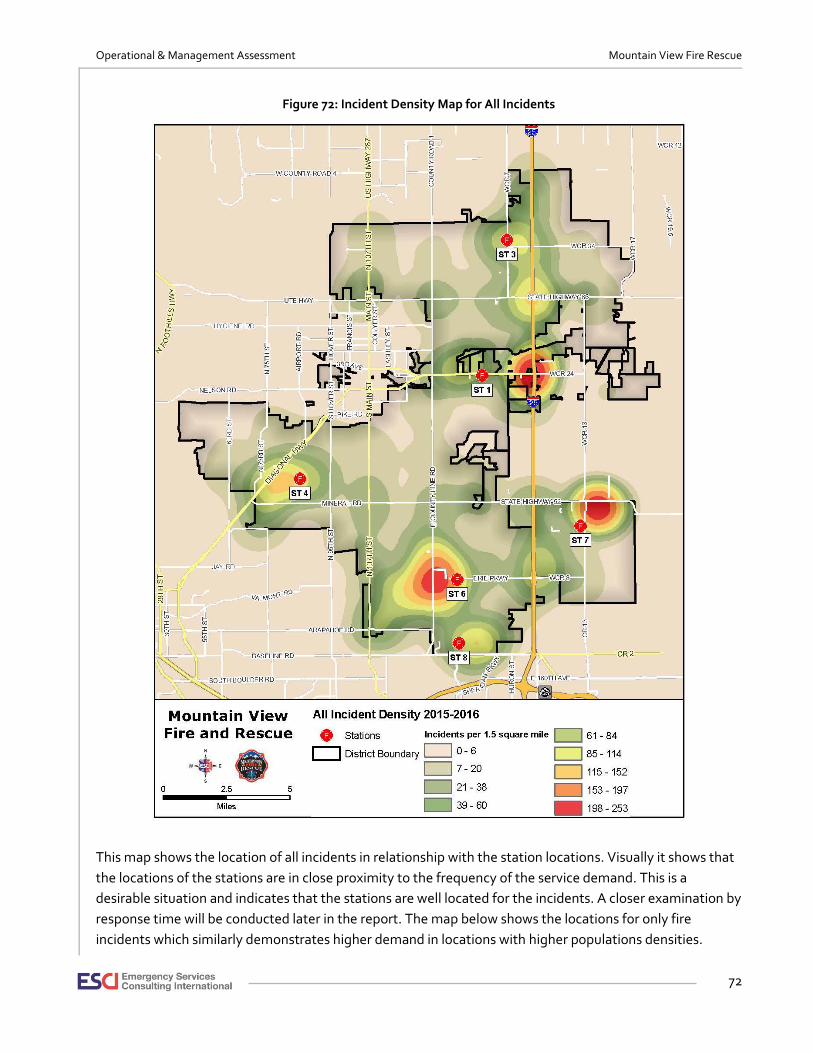
Operational & Management Assessment Mountain View Fire Rescue
72
Figure 72: Incident Density Map for All Incidents
This map shows the location of all incidents in relationship with the station locations. Visually it shows that
the locations of the stations are in close proximity to the frequency of the service demand. This is a
desirable situation and indicates that the stations are well located for the incidents. A closer examination by
response time will be conducted later in the report. The map below shows the locations for only fire
incidents which similarly demonstrates higher demand in locations with higher populations densities.
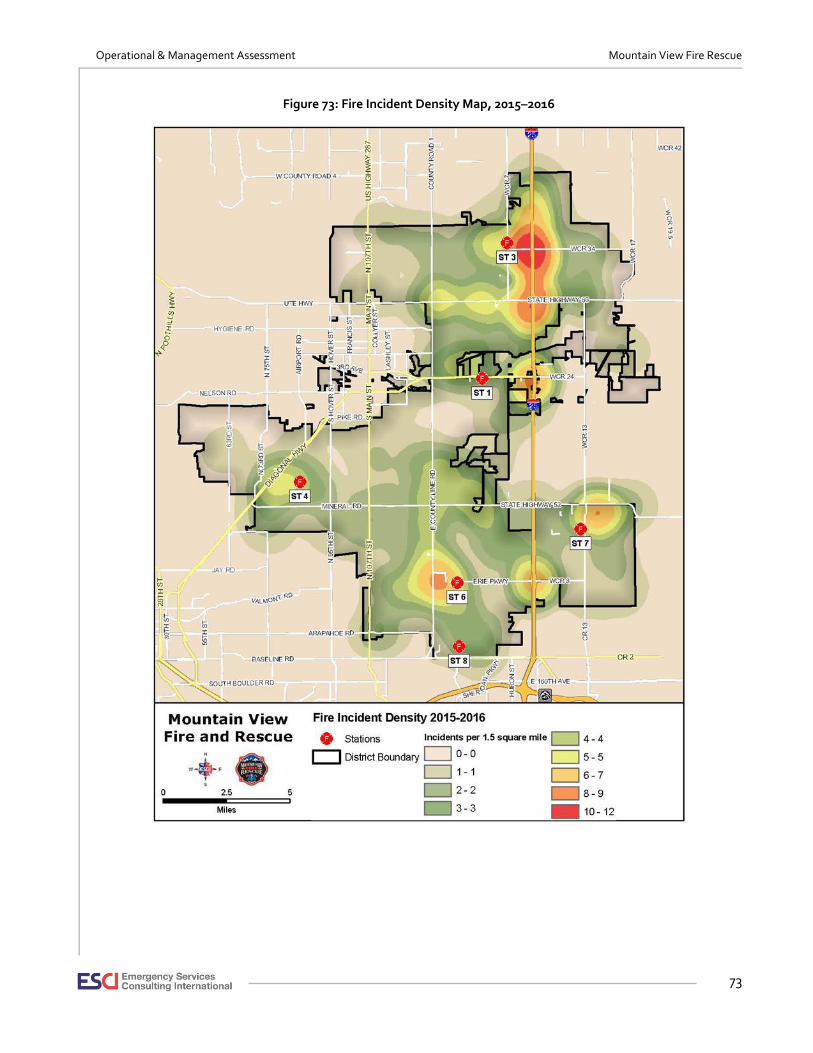
Operational & Management Assessment Mountain View Fire Rescue
73
Figure 73: Fire Incident Density Map, 2015–2016

Operational & Management Assessment Mountain View Fire Rescue
74
Population Density Areas
The number of incidents are usually directly correlated with population density. The following figure maps
population density for the district based on census data. Classified as rural, suburban, and urban, these
density categories are the same as those used in the NFPA standards to define areas where response time
performance expectation may differ.
Figure 74: MVFR Population Density Map

Operational & Management Assessment Mountain View Fire Rescue
75
It is obvious from examining the map that there are small pockets of urban and suburban densities with the
remainder of the district having rural densities. The ability to serve such an area with quick response times
is difficult as the response times are determined in part by the distance traveled. To provide quick service
stations must be located close to the more densely populated areas which will incur the great proportion of
the service demand. This overall requires more stations for the same density, but in a small footprint such
as typically seen in eastern cities.
Figure 75: Travel Times and Locations of Calls
Operational & Management Assessment Mountain View Fire Rescue
76
Resource Distribution Analysis There are two standards commonly used in the fire service for response distribution. The Insurance Services
Organization (ISO) is a national insurance industry organization that evaluates fire protection for
communities across the country. A jurisdiction’s ISO rating is an important factor when considering fire
station and apparatus distribution, since it can affect the cost of fire insurance for individuals and
businesses. To receive maximum credit for station and apparatus distribution, ISO recommends that in
urban areas, all “built upon” areas in a community be within 1.5 road miles of an engine company. If there
are more than five structures over three stories, or have a “needed fire flow” of over 3500 gpm, ISO requires
an aerial truck responding from within 2.5 miles. Additionally, ISO states that a structure must be within
five miles of a fire station to receive any fire protection rating for insurance purposes. The following figure
examine current MVFR station and engine distribution, based on rating criteria for the Insurance Services
Organization (ISO):
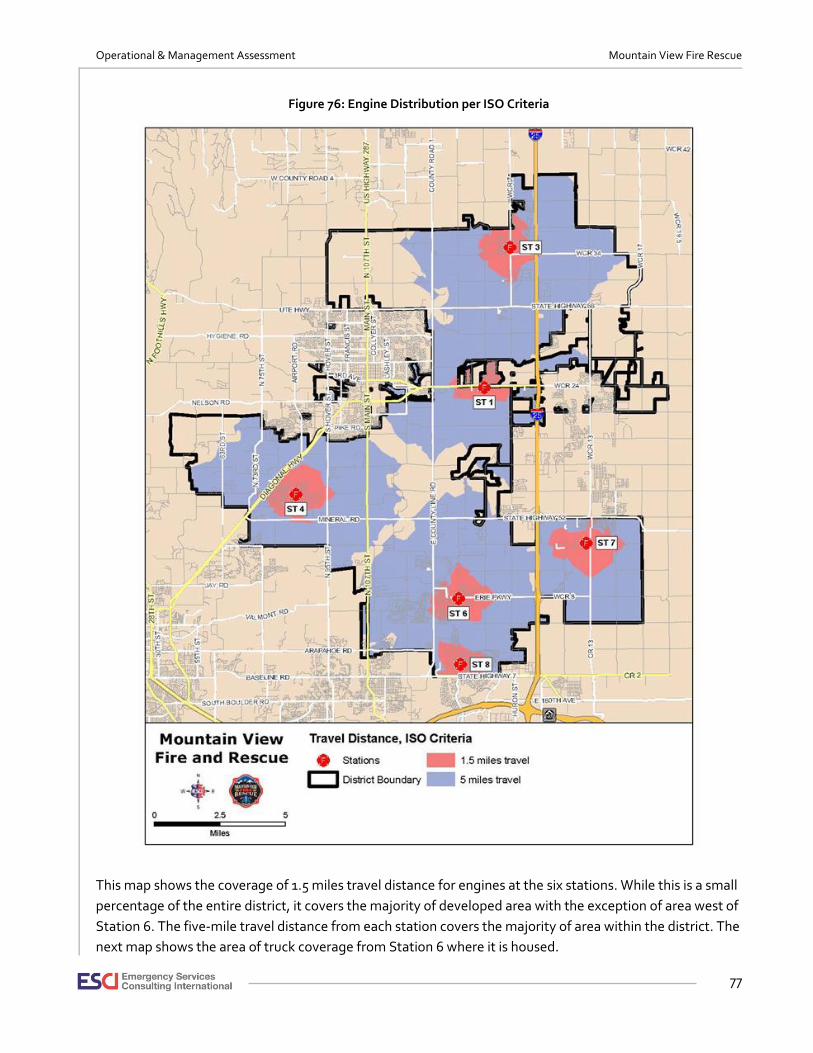
Operational & Management Assessment Mountain View Fire Rescue
77
Figure 76: Engine Distribution per ISO Criteria
This map shows the coverage of 1.5 miles travel distance for engines at the six stations. While this is a small
percentage of the entire district, it covers the majority of developed area with the exception of area west of
Station 6. The five-mile travel distance from each station covers the majority of area within the district. The
next map shows the area of truck coverage from Station 6 where it is housed.
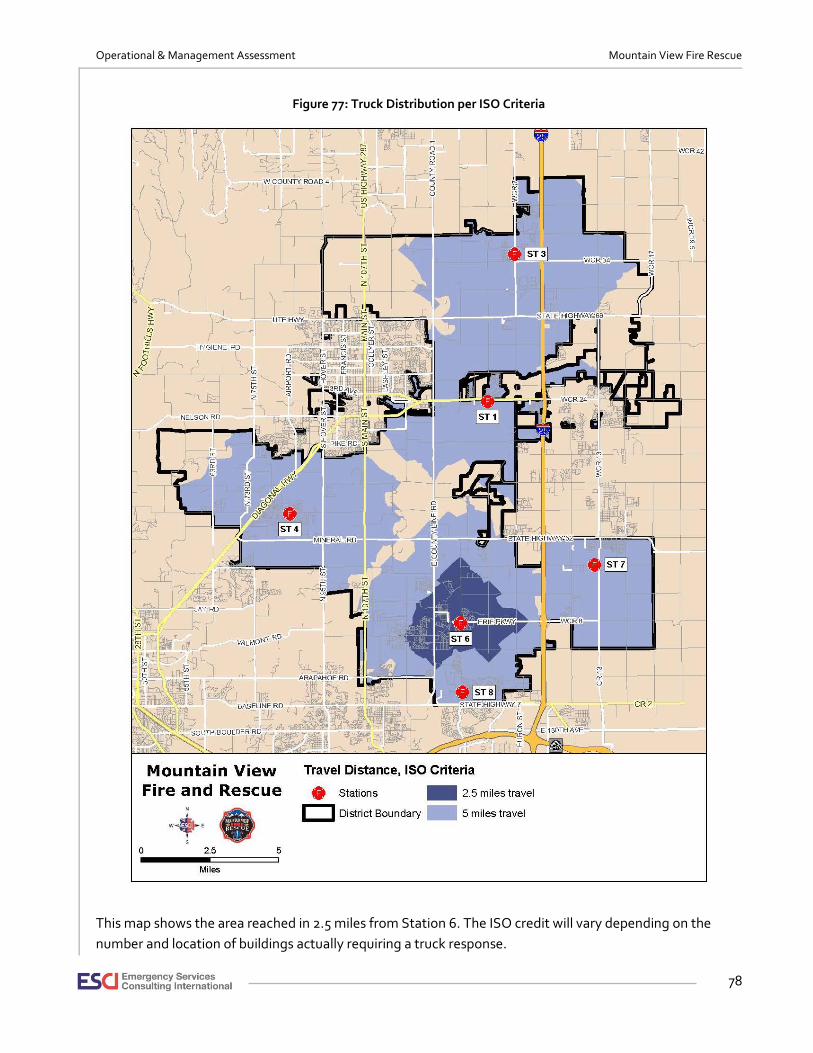
Operational & Management Assessment Mountain View Fire Rescue
78
Figure 77: Truck Distribution per ISO Criteria
This map shows the area reached in 2.5 miles from Station 6. The ISO credit will vary depending on the
number and location of buildings actually requiring a truck response.
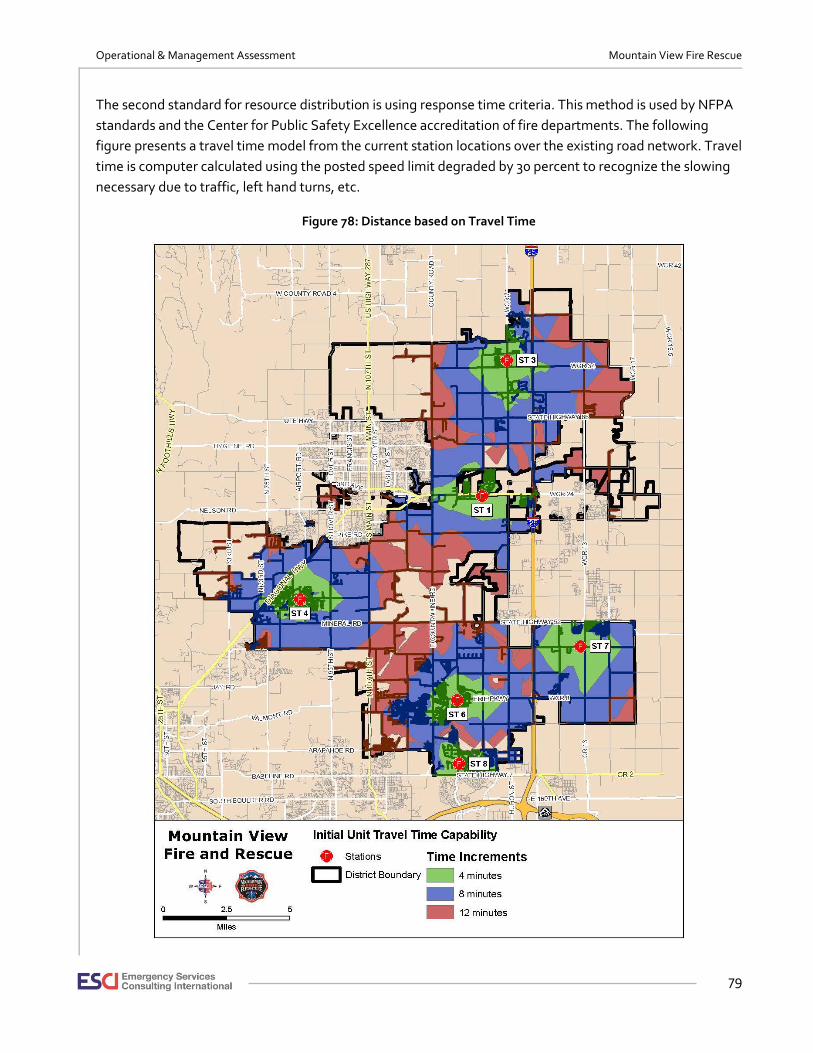
Operational & Management Assessment Mountain View Fire Rescue
79
The second standard for resource distribution is using response time criteria. This method is used by NFPA
standards and the Center for Public Safety Excellence accreditation of fire departments. The following
figure presents a travel time model from the current station locations over the existing road network. Travel
time is computer calculated using the posted speed limit degraded by 30 percent to recognize the slowing
necessary due to traffic, left hand turns, etc.
Figure 78: Distance based on Travel Time

Operational & Management Assessment Mountain View Fire Rescue
80
Figure 79: Four-Minute Travel Time Coverage
National consensus standards, such as NFPA 1710, specify that a career staffed, urban fire department’s
objective should deploy resources such that 90 percent of emergency service demand can be reached in
four-minutes’ travel or less.8 Based on the population density map shown previously in this report, most
urban areas are within the four-minute travel time. Much of the suburban density is covered within the four-
minute response as well.
8 NFPA 1710, Standard for the Organization and Deployment of Fire Suppression Operations, Emergency Medical Operations, and Special Operations to the Public by Career Fire Departments (National Fire Protection Association 2016 ed.), Sections 4.1.2.1(3) and 4.1.2.4.
Operational & Management Assessment Mountain View Fire Rescue
81
Response Analysis Perhaps the most publicly visible component of an emergency services delivery system is that of response
performance. Policy makers and citizens want to know how quickly they can expect to receive emergency
services.
ESCI measures at the 90th percentile times unless otherwise specified. The use of percentile calculations for
response performance follows industry best practices and is considered a more accurate measure of
performance than “average” calculations. The most important reason for not using the average to measure
response performance or establish performance goals is that it may not accurately reflect the performance
for the entire data set and may be skewed by data outliers. A few extremely good or bad values can skew
the average for the entire data set. Percentile measurements are a better measure of performance since
they show that the large majority of the data set has achieved a particular level of performance. For
instance, response performance measured at the 90th percentile demonstrates that the first apparatus
arrived at 90 percent of incidents in the stated time or less.
In the performance analysis, ESCI examines response performance within the MVFR jurisdiction. The data
for this analysis is 2016 incidents extracted from the department’s records management software (RMS).
The benchmarks adopted in 2013 when MVFR underwent the Accreditation process are shown in the
following figure. The current level of performance will be shown against the benchmark or target.
The time continuum (that is, the time between when the caller dials 911 and when assistance arrives) is
comprised of several different components:
• Call Processing Time—The amount of time between when a dispatcher answers the 911 call and
when resources are dispatched.
• Turnout Time—The amount of time between when units are notified of the incident and when they
are en route.
• Travel Time—The amount of time the responding unit spends on the road to the incident. This is a
function of speed and distance.
• Total Response Time equals the combination of “Call Processing Time,” “Turnout Time,” and
“Travel Time.”

Operational & Management Assessment Mountain View Fire Rescue
82
Figure 80: Response Time Segment—NFPA Standard and MVFR Standard Comparison
Time Segment NFPA 1710
(All times at 90th Percent) MVFR SOC
(All times at 90th Percent)
Call Processing Time 1:04 (min:sec) 1:00 (min:sec)
Turnout Time Fire – 1:20 (min:sec) EMS – 1:00 (min:sec)
Fire – 1:20 (min:sec) EMS – 1:00 (min:sec)
Travel Time for Fire and EMS BLS 4:00 (min:sec)9 Suburban – 5:00 (min:sec) Rural – 10:00 (min:sec)
Travel Time for EMS ALS Suburban – 10:00 (min:sec) Rural – 14:00 (min:sec)
Total Response Time—Suburban Fire – 6:24 (min:sec) EMS – 6:04 (min:sec)
Fire – 7:20 (min:sec) EMS – 7:00 (min:sec) EMS ALS – 12:00 (min:sec)
Total Response Time—Rural No rural responses Fire – 12:20 (min:sec) EMS – 12:00 (min:sec) EMS ALS – 16:00 (min:sec)
Call Processing Time Performance
Call processing time is the time it takes for dispatch to receive the call from the 911 caller and determine the
appropriate jurisdiction and units to send to the call. This requires determining the type of call, and the
number and type of units that are needed to respond. NFPA 1221 sets the standard for fire communications
and that standard is repeated in NFPA 1710. As shown in the previous figure, the standard set by the latest
NFPA standard is 64 seconds. The adopted benchmark is 60 seconds. The actual performance based on all
types of incidents is 2:15 (min:sec). The quickest is fire alarms which are 1:42 (min:sec) and the longest is
public assists at 2:40 (min:sec).
Figure 81: Call Processing Time Performance—90th Percentile, 2016
9 NFPA 1710 assumes urban densities of a city environment.
02:15
01:42
02:06
02:00
02:35
02:32
02:40
02:33
00:00 00:30 01:00 01:30 02:00 02:30 03:00
All Incidents
Alarms
EMS
Fire
MVA
Other
Public Assist
Special Ops

Operational & Management Assessment Mountain View Fire Rescue
83
Turnout Time Performance
The last component of response time is turnout time. Turnout times are specified differently in NFPA 1710
for fire or special operations and for EMS calls. The rationale for this is that the firefighters have more
protective clothing to put on for a fire or special operations, whereas station clothing, gloves, and safety
glasses may well be acceptable for a medical call. The standard recommends an 80 second (1 minute, 20
seconds) turnout for fire and special operations; and 60 seconds (1 minute, 0 seconds) turnout time for EMS
at the 90th percentile. MVFR adopted the same as the NFPA 1710 standard for their turnout time standard.
MVFR’s actual turnout performance is shown in the following figure:
Figure 82: Turnout Time Performance at the 90th Percentile
Figure 83: Turnout by Hour of Day
The previous figure demonstrates turnout time at the 90th percentile level for each hour. As one would
expect the turnout times are slightly longer in night and early morning hours than during the day. The
range is from 1:38 (min:sec) during the day to 3:34 (min:sec) early in the morning.
02:02
02:11
02:03
02:18
01:58
01:54
02:12
01:25
00:00 00:30 01:00 01:30 02:00 02:30
Total
Alarms
EMS
Fire
MVA
Other
Public Assist
Special Ops
0
50
100
150
200
250
00:0000:3001:0001:3002:0002:3003:0003:3004:00
0 1 2 3 4 5 6 7 8 9 10 11 12 13 14 15 16 17 18 19 20 21 22 23
Tu
rno
ut
Min
ute
s
Hour of Day
Turnout 90th By Hour Num Incidents
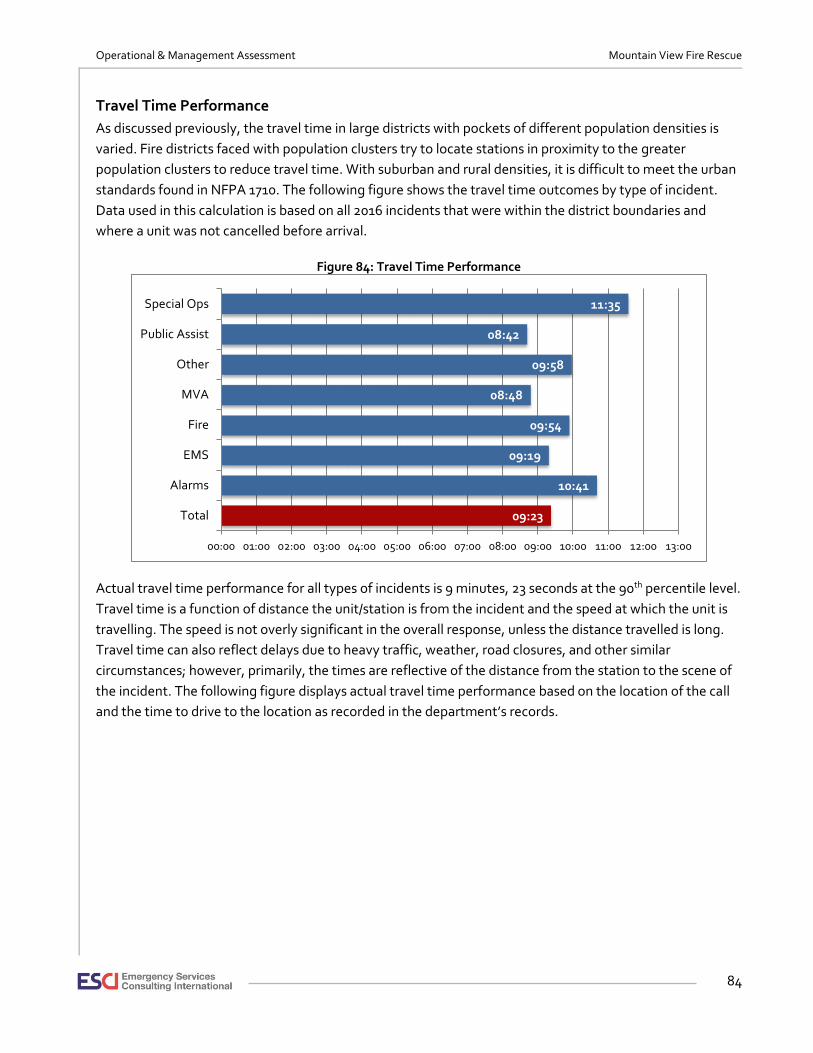
Operational & Management Assessment Mountain View Fire Rescue
84
Travel Time Performance
As discussed previously, the travel time in large districts with pockets of different population densities is
varied. Fire districts faced with population clusters try to locate stations in proximity to the greater
population clusters to reduce travel time. With suburban and rural densities, it is difficult to meet the urban
standards found in NFPA 1710. The following figure shows the travel time outcomes by type of incident.
Data used in this calculation is based on all 2016 incidents that were within the district boundaries and
where a unit was not cancelled before arrival.
Figure 84: Travel Time Performance
Actual travel time performance for all types of incidents is 9 minutes, 23 seconds at the 90th percentile level.
Travel time is a function of distance the unit/station is from the incident and the speed at which the unit is
travelling. The speed is not overly significant in the overall response, unless the distance travelled is long.
Travel time can also reflect delays due to heavy traffic, weather, road closures, and other similar
circumstances; however, primarily, the times are reflective of the distance from the station to the scene of
the incident. The following figure displays actual travel time performance based on the location of the call
and the time to drive to the location as recorded in the department’s records.
09:23
10:41
09:19
09:54
08:48
09:58
08:42
11:35
00:00 01:00 02:00 03:00 04:00 05:00 06:00 07:00 08:00 09:00 10:00 11:00 12:00 13:00
Total
Alarms
EMS
Fire
MVA
Other
Public Assist
Special Ops
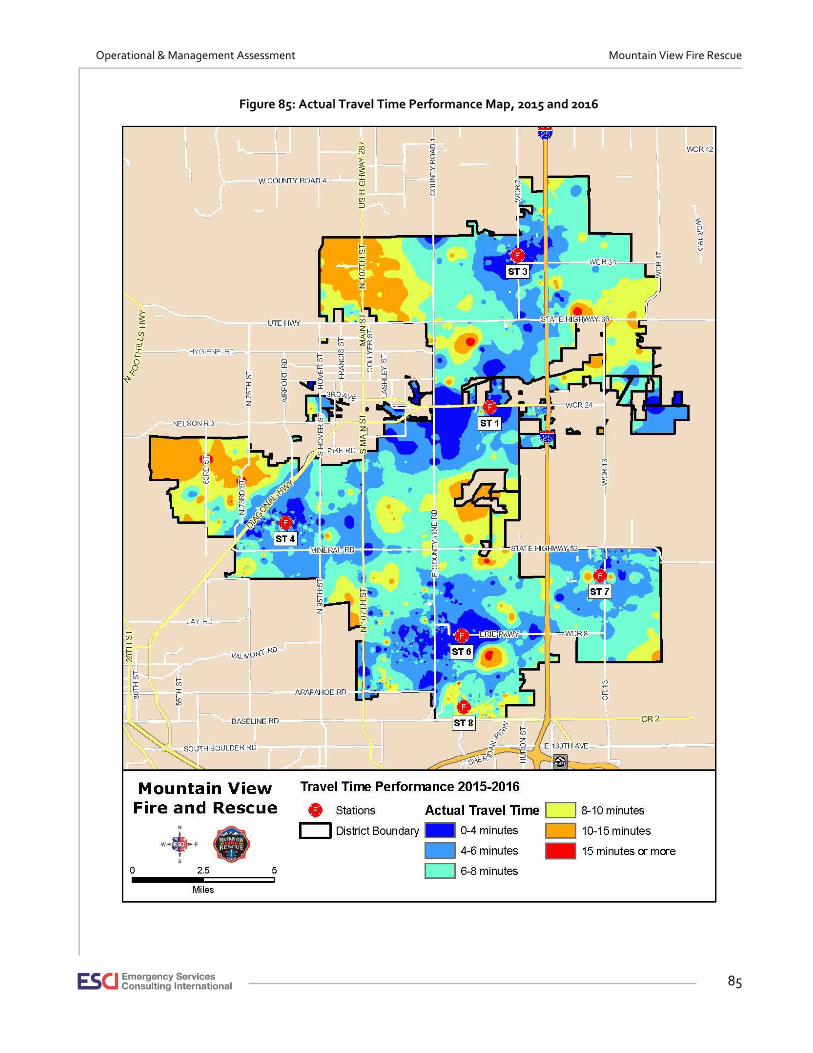
Operational & Management Assessment Mountain View Fire Rescue
85
Figure 85: Actual Travel Time Performance Map, 2015 and 2016

Operational & Management Assessment Mountain View Fire Rescue
86
As to be expected the areas closest to the stations have the lowest travel time. As areas fill in with more
residential density, travel time will continue to be longer than the standard and additional stations will
needed in order to reduce the time.
Figure 86: Travel Time by Hour of Day
Examining the travel time plotted against hour of the day demonstrates fairly consistent travel time around
the clock with an increase during the period from 10 PM to 5 AM. Intuitively one would assume a longer
travel time during the day rather than the middle of the night. It is unclear what is causing the rise in travel
time during that time. There were a significant number of calls to be distorted by merely a few distant
locations.
0
20
40
60
80
100
120
140
160
180
200
00:0001:0002:0003:0004:0005:0006:0007:0008:0009:0010:0011:0012:0013:00
0 1 2 3 4 5 6 7 8 9 10 11 12 13 14 15 16 17 18 19 20 21 22 23
Tra
vel T
ime
in M
inu
tes
Hour of Day
Travel Time 90th Num Incidents
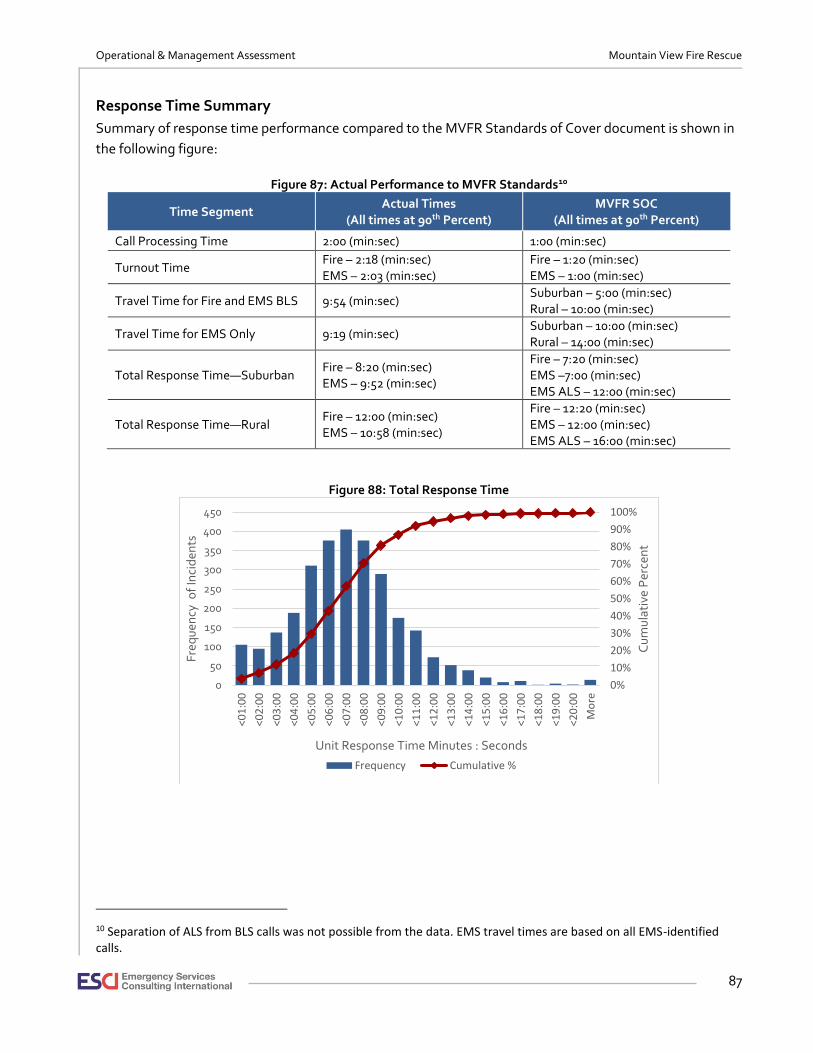
Operational & Management Assessment Mountain View Fire Rescue
87
Response Time Summary
Summary of response time performance compared to the MVFR Standards of Cover document is shown in
the following figure:
Figure 87: Actual Performance to MVFR Standards10
Time Segment Actual Times
(All times at 90th Percent) MVFR SOC
(All times at 90th Percent)
Call Processing Time 2:00 (min:sec) 1:00 (min:sec)
Turnout Time Fire – 2:18 (min:sec) EMS – 2:03 (min:sec)
Fire – 1:20 (min:sec) EMS – 1:00 (min:sec)
Travel Time for Fire and EMS BLS 9:54 (min:sec) Suburban – 5:00 (min:sec) Rural – 10:00 (min:sec)
Travel Time for EMS Only 9:19 (min:sec) Suburban – 10:00 (min:sec) Rural – 14:00 (min:sec)
Total Response Time—Suburban Fire – 8:20 (min:sec) EMS – 9:52 (min:sec)
Fire – 7:20 (min:sec) EMS –7:00 (min:sec) EMS ALS – 12:00 (min:sec)
Total Response Time—Rural Fire – 12:00 (min:sec) EMS – 10:58 (min:sec)
Fire – 12:20 (min:sec) EMS – 12:00 (min:sec) EMS ALS – 16:00 (min:sec)
Figure 88: Total Response Time
10 Separation of ALS from BLS calls was not possible from the data. EMS travel times are based on all EMS-identified calls.
0%
10%
20%
30%
40%
50%
60%
70%
80%
90%
100%
0
50
100
150
200
250
300
350
400
450
<01
:00
<02
:00
<03
:00
<04
:00
<05
:00
<06
:00
<07
:00
<08
:00
<09
:00
<10
:00
<11
:00
<12
:00
<13
:00
<14
:00
<15
:00
<16
:00
<17
:00
<18
:00
<19
:00
<20
:00
Mo
re
Cu
mu
lati
ve P
erce
nt
Fre
qu
ency
of
Inci
den
ts
Unit Response Time Minutes : Seconds
Frequency Cumulative %
Operational & Management Assessment Mountain View Fire Rescue
88
It is difficult to have strong confidence in the data that has been analyzed in this section. Previously,
ESCI discussed the issues related to call processing and transmittal to units. Since there can be delays in
contacting dispatch due to radio protocols or failure to record times as they occur the data may not be as
accurate as it could be. The use of MDTs is the best practice to assuring the timestamp from the unit is
recorded accurately. Further ESCI was not able to accurately differentiate between ALS-only calls and BLS
calls to measure the ALS-only responses.
Nevertheless, monitoring these time parameters is important. These times should be published each
month for everyone in the organization to see. These are part of the performance reporting that should be
given to the board each month as well. MVFR has already set response time standards for itself with the
Standards of Cover (SOC) document. ESCI recommends implementing regular reporting of performance
compared to the department-adopted response standards.
Resource Concentration Analysis Accepted firefighting procedures call for the arrival of the Effective Response Force (ERF), which is the
needed personnel to effectively mitigate the type of emergency, based on its level of risk within a
reasonable amount of time. This is to ensure that enough people and equipment arrive soon enough to
safely control a fire or mitigate any emergency before there is substantial damage or injury. MVFR operates
from six stations and uses automatic aid to add to the initial response in order to meet the standard of
cover. The following figure illustrates the concentration of MVFR resources available within ten-minutes’
travel time or less, as specified by MVFR SOC benchmark:
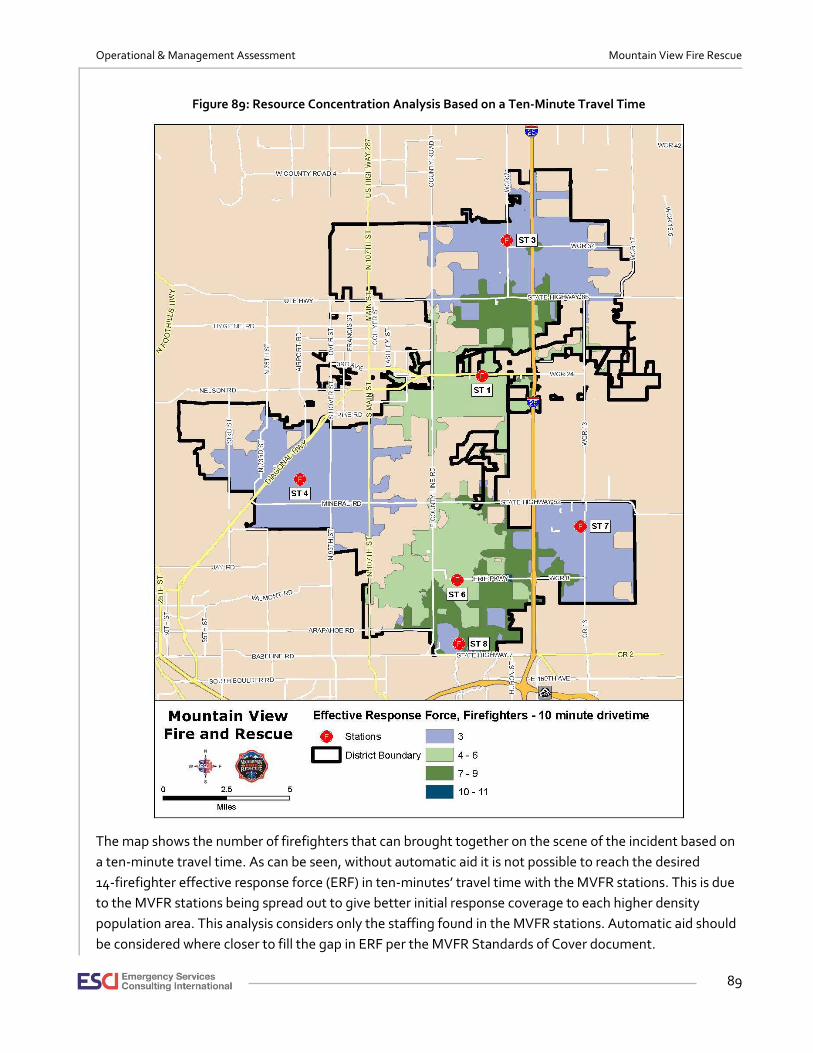
Operational & Management Assessment Mountain View Fire Rescue
89
Figure 89: Resource Concentration Analysis Based on a Ten-Minute Travel Time
The map shows the number of firefighters that can brought together on the scene of the incident based on
a ten-minute travel time. As can be seen, without automatic aid it is not possible to reach the desired
14-firefighter effective response force (ERF) in ten-minutes’ travel time with the MVFR stations. This is due
to the MVFR stations being spread out to give better initial response coverage to each higher density
population area. This analysis considers only the staffing found in the MVFR stations. Automatic aid should
be considered where closer to fill the gap in ERF per the MVFR Standards of Cover document.

Operational & Management Assessment Mountain View Fire Rescue
90
Response Reliability The workload of emergency response units can be a factor in response time performance. Concurrent
incidents, or the amount of time individual units are committed to an incident, can affect a jurisdiction’s
ability to muster sufficient resources to respond to additional emergencies.
Figure 90: MVFR Concurrent Incidents 2016
Station Number Concurrent Non-Concurrent Total Number of
Incidents Percentage
1 22 463 485 4.5%
3 41 611 652 6.3%
4 22 469 491 4.5%
6 54 718 772 7.0%
7 73 507 580 12.6%
8 12 304 316 3.8%
Figure 90 shows the number of concurrent calls and percentage for each station. For this analysis, even
though Station 8 was not open the entirety of 2015 and 2016, the location of the call determined whether it
was within the first due area for the station. This provides a more accurate analysis of the impact of Station
8 and its effect on concurrency. Station 7 has the greatest potential to be out of service on another call
when a second call is received. This will require another unit closest to the call to respond. This will extend
the travel time and the overall response time.
Another factor affecting reliability is unit hour utilization. Unit hour utilization (UHU) describes the amount
of time that a unit is not available for response because it is already committed to another incident. The
larger the number, the greater its utilization and the less available it is for assignment to subsequent calls
for service. The following figure analyzes the total time MVFR apparatus were committed to an incident
during 2016 and expresses this as a percentage of the available time in the total year:

Operational & Management Assessment Mountain View Fire Rescue
91
Figure 91: MVFR Unit Hour Utilization (UHU)
Unit Name Unit Type Number of Incidents UHU UHU Percent
TN-2244 Tender 4 5:37:47 0.06%
M-2227 Ambulance 7 17:25:51 0.20%
M-2226 Ambulance 1,237 1074:37:14 12.23%
M-2224 Ambulance 237 225:42:37 2.57%
M-2221 Ambulance 935 1272:27:07 14.49%
L-2217 Ladder 9 6:26:05 0.07%
F-2252 Foam 3 16:45:11 0.19%
E-220811 Engine 5 1:54:12 0.02%
E-2207 Engine 587 373:14:11 4.25%
E-2206 Engine 1,082 574:44:15 6.54%
E-2204 Engine 390 248:04:43 2.82%
E-2203 Engine 634 397:35:17 4.53%
E-2201 Engine 712 1170:43:39 13.33%
COM-2260 Comm 330 372:58:29 4.25%
BRE-2233 T-3 13 36:13:57 0.41%
BR-2236 Brush 54 348:18:05 3.97%
BR-2234 Brush 19 28:45:56 0.33%
Units that exceed a 10 percent unit hour utilization begin to fail to achieve the desired response time
criteria and should be reviewed for an alternative response strategy. The CPSE/CFAI Standards of Cover, 8th
Edition suggests that UHU rates in the range of 25 to 30 percent for fire and EMS units can lead to employee
burnout issues and can negatively affect station and unit reliability. Currently, UHU rates in the study area
do not exceed these levels. Note that as unit hour utilization increases, not only are units less available for
emergency responses but also less likely to complete other duties, such as inspections, training, public
education, and maintenance. The highest unit hour utilization is M-2221 at 14.49 percent. If changes are
made that would increase the workload of the stations, this would be an important parameter to monitor.
11 Unit E-2208 was only operational for a short time in 2016.
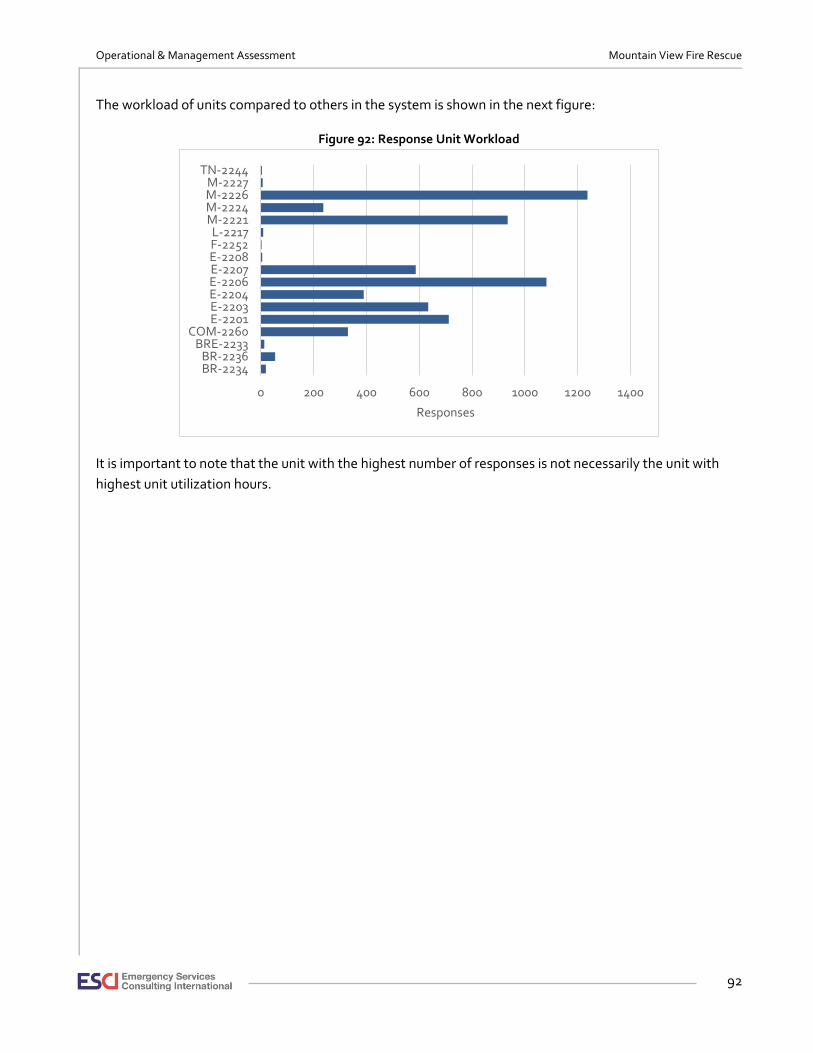
Operational & Management Assessment Mountain View Fire Rescue
92
The workload of units compared to others in the system is shown in the next figure:
Figure 92: Response Unit Workload
It is important to note that the unit with the highest number of responses is not necessarily the unit with
highest unit utilization hours.
0 200 400 600 800 1000 1200 1400
BR-2234BR-2236
BRE-2233COM-2260
E-2201E-2203E-2204E-2206E-2207E-2208F-2252L-2217
M-2221M-2224M-2226M-2227
TN-2244
Responses
Operational & Management Assessment Mountain View Fire Rescue
93
PLANNING FOR FIRE PROTECTION & EMS
Emergency services exist in a rapidly changing environment. Along with improved tools and technologies
used to provide service, there is the increased regulation of activities, new risks to protect, and other
challenges that can quickly catch the unwary off guard. Only through continuous internal and external
environmental awareness and periodic course corrections can an organization stay on the leading edge.
To do a better job with available resources, the organization must focus on improving services while
identifying programs or activities that may no longer serve its changing needs. Through appropriate
planning, a fire department can establish a vision for the future, create a framework within which decisions
are made, and chart its course to the future. The quality and accuracy of the planning function determines
the success of the organization.
To be truly effective, an emergency services agency must consider planning on five distinct levels:
1. Tactical planning
2. Operational planning
3. Master planning
4. Strategic planning
5. Emergency management planning
Tactical, or pre-incident, planning is the development of strategies for potential emergency incidents.
Operational planning is the organization of day-to-day activities—as primarily outlined by a district’s
standard operating guidelines and procedures—and the integration of the agency into other local, regional,
or national response networks. Master planning is preparation for the long-term effectiveness of the
agency as the operating environment changes over time. Finally, strategic planning is a process of
identifying an organization’s mission, vision, and values and prioritizing goals and objectives for things that
need to be accomplished in the near future.
MVFD performs some fundamental, short-term planning in the form of the annual budget development
process, which is used to define the activities and priorities identified for the upcoming year. However,
establishing a long-term planning perspective for the fire district is important as well. Without a plan, it is
impossible for an organization to know when it is reaching milestones or providing exceptional services to
its constituency.
The following figure details the current planning efforts in place in MVFD.
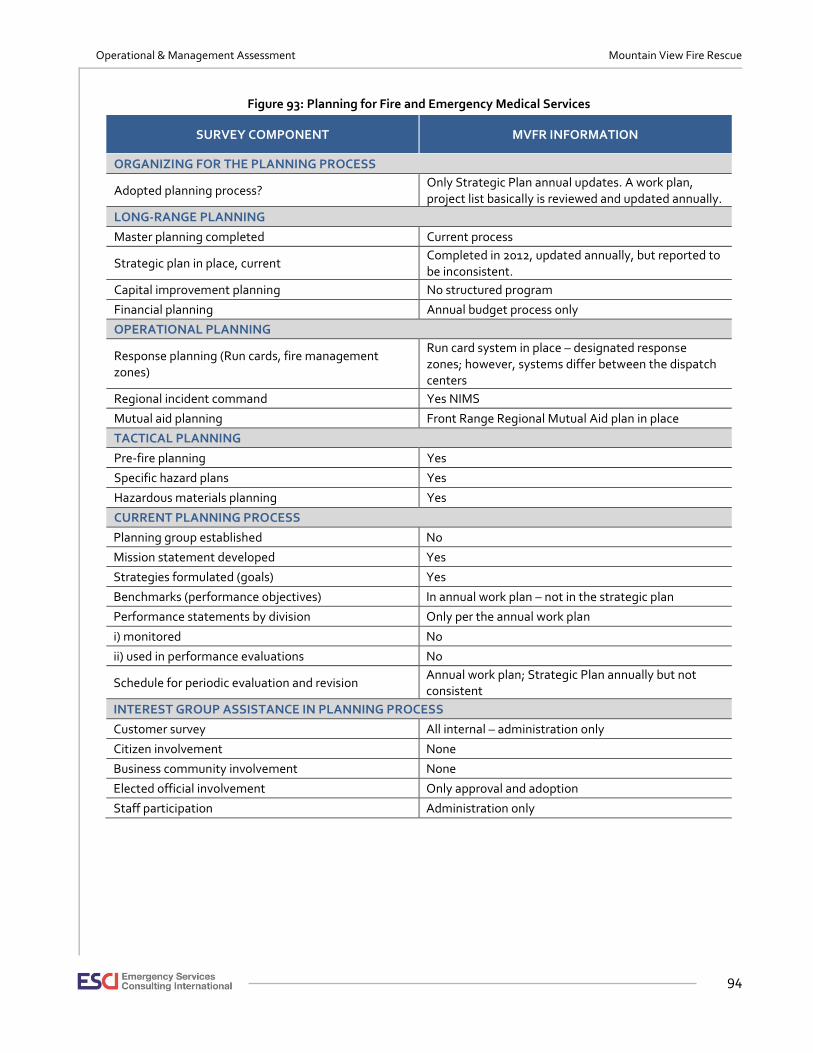
Operational & Management Assessment Mountain View Fire Rescue
94
Figure 93: Planning for Fire and Emergency Medical Services
SURVEY COMPONENT MVFR INFORMATION
ORGANIZING FOR THE PLANNING PROCESS
Adopted planning process? Only Strategic Plan annual updates. A work plan, project list basically is reviewed and updated annually.
LONG-RANGE PLANNING
Master planning completed Current process
Strategic plan in place, current Completed in 2012, updated annually, but reported to be inconsistent.
Capital improvement planning No structured program
Financial planning Annual budget process only
OPERATIONAL PLANNING
Response planning (Run cards, fire management zones)
Run card system in place – designated response zones; however, systems differ between the dispatch centers
Regional incident command Yes NIMS
Mutual aid planning Front Range Regional Mutual Aid plan in place
TACTICAL PLANNING
Pre-fire planning Yes
Specific hazard plans Yes
Hazardous materials planning Yes
CURRENT PLANNING PROCESS
Planning group established No
Mission statement developed Yes
Strategies formulated (goals) Yes
Benchmarks (performance objectives) In annual work plan – not in the strategic plan
Performance statements by division Only per the annual work plan
i) monitored No
ii) used in performance evaluations No
Schedule for periodic evaluation and revision Annual work plan; Strategic Plan annually but not consistent
INTEREST GROUP ASSISTANCE IN PLANNING PROCESS
Customer survey All internal – administration only
Citizen involvement None
Business community involvement None
Elected official involvement Only approval and adoption
Staff participation Administration only
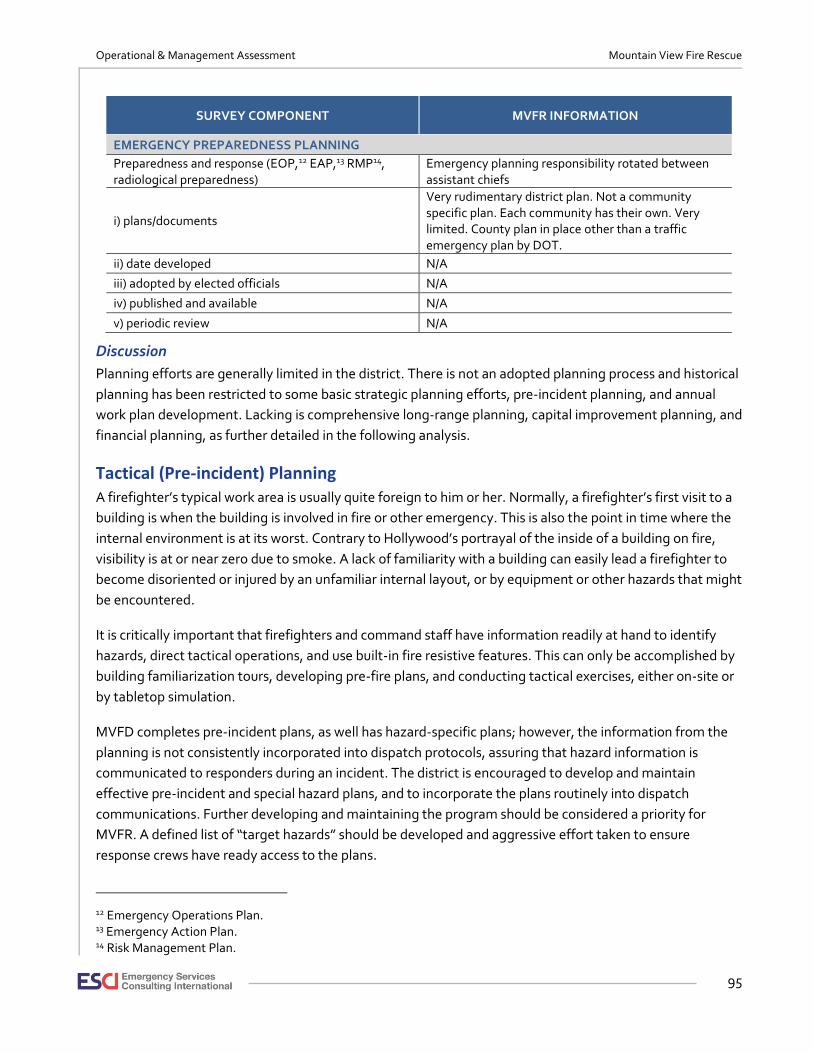
Operational & Management Assessment Mountain View Fire Rescue
95
SURVEY COMPONENT MVFR INFORMATION
EMERGENCY PREPAREDNESS PLANNING
Preparedness and response (EOP,12 EAP,13 RMP14, radiological preparedness)
Emergency planning responsibility rotated between assistant chiefs
i) plans/documents
Very rudimentary district plan. Not a community specific plan. Each community has their own. Very limited. County plan in place other than a traffic emergency plan by DOT.
ii) date developed N/A
iii) adopted by elected officials N/A
iv) published and available N/A
v) periodic review N/A
Discussion
Planning efforts are generally limited in the district. There is not an adopted planning process and historical
planning has been restricted to some basic strategic planning efforts, pre-incident planning, and annual
work plan development. Lacking is comprehensive long-range planning, capital improvement planning, and
financial planning, as further detailed in the following analysis.
Tactical (Pre-incident) Planning A firefighter’s typical work area is usually quite foreign to him or her. Normally, a firefighter’s first visit to a
building is when the building is involved in fire or other emergency. This is also the point in time where the
internal environment is at its worst. Contrary to Hollywood’s portrayal of the inside of a building on fire,
visibility is at or near zero due to smoke. A lack of familiarity with a building can easily lead a firefighter to
become disoriented or injured by an unfamiliar internal layout, or by equipment or other hazards that might
be encountered.
It is critically important that firefighters and command staff have information readily at hand to identify
hazards, direct tactical operations, and use built-in fire resistive features. This can only be accomplished by
building familiarization tours, developing pre-fire plans, and conducting tactical exercises, either on-site or
by tabletop simulation.
MVFD completes pre-incident plans, as well has hazard-specific plans; however, the information from the
planning is not consistently incorporated into dispatch protocols, assuring that hazard information is
communicated to responders during an incident. The district is encouraged to develop and maintain
effective pre-incident and special hazard plans, and to incorporate the plans routinely into dispatch
communications. Further developing and maintaining the program should be considered a priority for
MVFR. A defined list of “target hazards” should be developed and aggressive effort taken to ensure
response crews have ready access to the plans.
12 Emergency Operations Plan. 13 Emergency Action Plan. 14 Risk Management Plan.

Operational & Management Assessment Mountain View Fire Rescue
96
Target hazards are defined by:
• Buildings with large potential occupant loads
• Buildings with populations who are partially or completely non-ambulatory
• Buildings of large size (greater than 12,000 square feet)
• Buildings that contain process hazards, such as hazardous materials or equipment
Pre-incident plans should be easy to use, quick reference tools for company officers and command staff. At
a minimum, a pre-incident plan should include information such as:
• Building construction
• Occupant characteristics
• Incorporated fire protection systems
• Capabilities of public or industrial responding personnel
• Water supply
• Exposure factors
• Facility layouts
NFPA 1620 provides excellent information on the development and use of pre-incident plans and should be
used as a reference. Once pre-plans are established and/or updated, training should be provided to all
personnel who may respond to an incident at those locations. In addition, copies of pre-incident plans and
drawings should be available on each response vehicle and incorporated into dispatch procedures.
Operational Planning Operational planning includes the establishment of minimum staffing policies, standardized response plans
or protocols, regional incident command, mutual aid and automatic aid (locally and regionally), resource
identification, and disaster planning.
Within an agency, operational plans should be in place that assure that adequate volumes of the
appropriate types of resources are deployed to an emergency. Doing so involves:
• Identification of potential risk types;
• Determination of resources needed to mitigate an incident affecting the particular risk type; and
• A methodology assuring adequate resources are dispatched to an incident via 911 center protocols.
Looking beyond the agency’s own resources, operational plans need to address the timely implementation
of mutual and automatic aid. To do so, the identified risk exposures and resource needs are incorporated
into mutual aid agreements. Further, of significant importance, automatic activation of mutual aid
deployment is seamlessly incorporated into the 911 center’s Computer Aided Dispatch (CAD) systems.

Operational & Management Assessment Mountain View Fire Rescue
97
MVFR has entered into a mutual aid agreement as a participant in the Front Range Regional Mutual Aid
Plan, a well-developed group response planning group. Automatic mutual aid, the use or pre-programed
dispatch of mutual aid resources, without the need for an incident commander to ask for them, are in place;
however, fully automated mutual aid is made more difficult by the existence of two 911 centers that both
dispatch Mountain View resources. Each is independent of the other and their computer aided dispatch
systems do not communicate with each other. As a result, operational planning elements cannot be
coordinated effectively. ESCI recommends that, to the extent possible, dispatch practices be centralized
and standardized.
Master Planning Master planning, also called long range master planning, is a process that seeks to answer three questions:
• Where is our organization today?
• Where are we going to need to be in the future? And,
• How do we get there?
The Mountain View Fire Protection District has wisely recognized the need for a long-range planning effort
by undertaking this master planning process. This plan gives the district a clear idea of where it is today,
based on the Evaluation of Current Conditions, along with its future needs and strategies for meeting them,
detailed in the Future Service Demand and Future Strategies sections of the report. This Master Plan is
designed to provide a view of the organization in a 15-year time frame.
Strategic Planning A strategic plan involves a three to five-year planning window and establishes prioritized goals and
objectives for the organization. The planning approach is particularly important when a master plan has
been completed. The reason being that a master plan identifies multiple recommendations and future
strategies, which are then evaluated and prioritized via the strategic plan.
Establishing a customer-oriented strategic plan accomplishes the following:
• Development of a mission statement giving careful attention to the services currently provided and
which logically can be provided in the future
• Development of a vision statement of the agency’s for moving forward
• Establish the values of the members of the agency
• Identification of the strengths, weaknesses, opportunities, and challenges of the agency
• Determination of the community’s service priorities
• Understanding of the community’s expectations of the agency
• Establishment of realistic goals and objectives for the future
• Identifications of implementation tasks for each objective
• Definition of service outcomes in the form of measurable performance objectives and targets
Operational & Management Assessment Mountain View Fire Rescue
98
The district completed a strategic plan in 2012, which is now outdated, and indications from several
stakeholder interviews were that, while one was completed, it is not actively adhered to or maintained.
However, an annual work plan is in place which, to some extent, serves a similar need as that of a strategic
plan. The work plan was described as, essentially, a “project list,” and that plan is reviewed and updated
annually.
Completion of a strategic plan upon completion of this Master Plan is highly recommended. ESCI can assist
with the process.
Emergency Management Planning Emergency management, once a low priority in the mind of the public, has risen to the conscious level of
everyday life. Nonexistent before 2001, the DHS (Department of Homeland Security), terrorist threat
warnings, the Transportation Safety Administration (TSA) screenings on public transportation, and security
checks at sporting events and concerts are now common parts of urban life.
Mindful community governments prepare themselves, other institutions, businesses, and the public to
survive disaster by mitigating hazards to eliminate or reduce risk. By developing and maintaining
emergency action plans, and by exercising and updating the plans regularly, municipal governments help
limit (or manage) the consequences of a disaster. The common term for governmental disaster
preparedness is emergency management.
The Superfund Amendment and Reauthorization Act, found in Title III of the Federal Code (SARA Title III),
defines requirements for the tracking of hazardous materials used in fixed facilities and establishes
requirements for emergency response planning. The district should be involved with the Local Emergency
Planning Committee (LEPC) in place at the county level. The LEPC is charged with the responsibility to
identify and collect information on the use of hazardous materials by private and public entities.
Information collected includes the type of material, quantity, and location at each site. Additionally, the
LEPC is charged with ensuring local response plans are adequate based on potential risk.
SARA Title III requires industries that use over a threshold limit of certain highly hazardous materials
(extremely hazardous substance facilities – EHS) must develop comprehensive emergency plans for their
facility. The act requires that local fire departments coordinate with the involved industry to ensure a
quality response to the emergency.
MVFR, in concert with the LEPC, needs to confirm that all EHS facilities within its service area have been
identified, ensure that a local plan has been developed, and that fire department operations have been
coordinated with it. Additionally, MVFR needs to confirm that mandated Tier II reporting forms are being
received, reviewed, properly filed, and available for training and use during emergency responses. The
status of this process is in question.
Operational & Management Assessment Mountain View Fire Rescue
99
The district has not developed plans for responding to disasters and has chosen to rely on the county-wide
emergency management functions of the Bolder and Weld County Sheriff’s Office. The district has had
some input to these plans and exercises have been infrequent. It is paramount that MVFD staff be well
informed of their content and the district’s role in their execution. ESCI recommends that the district take
an active role in the development of emergency management planning with the county, as well as
internally.
RECOMMENDATIONS:
• Develop and maintain effective pre-incident plans and incorporate dispatch procedures.
• Establish effective automatic aid practices with area fire departments.
• Upon completion of this Master Plan, complete a Strategic Plan to process implementation of the recommendations herein.
• Actively engage in emergency planning efforts with the counties and the Local Emergency Planning Committee (LEPC).
• Strive to ensure that extremely hazardous substance facilities (EHS) have been properly identified within the district.
• Establish an internal planning group, dedicated planning position, and update planning efforts annually.
• Centralize and standardize dispatch practices for run cards and apparatus dispatch criteria.
• Establish a funded capital replacement plan.
• Develop long-range financial planning strategies.

Operational & Management Assessment Mountain View Fire Rescue
100
STAFFING & PERSONNEL MANAGEMENT
The most valuable asset of any organization is its people. The effective management of human resources
requires a balance between the maximum utilization of the overall workforce and the experience of a high
level of job satisfaction by individual workers. To achieve this goal consistently, management must
combine reliability with a safe working environment, fair treatment, the opportunity to provide input, and
recognition of the individual’s commitment and sacrifice. Job satisfaction depends upon this combination
of factors.
One of the ways to provide a reliable work environment is through the adoption of clear and
understandable rules and policies in the workplace. In the fire service, this is usually accomplished by a
combination of policies, guidelines or procedures, and other governing documents. These might include
labor agreements and civil service regulations. At MVFR, with the exception of civil service regulations, all
of these, as well as an employee handbook, are utilized.
Reports & Records In any organization, documentation of activities is of paramount concern. Sound management decisions
cannot be assured without accurate data, and organizational transparency to the public will be impeded if
the department cannot explain what it is doing. The documentation of activities must be routine. An added
issue is state regulations requiring the preservation, security, and confidentiality of various personnel-
related records. It is of highest importance that these documents be saved and secured according to state
statutes.
Figure 94: Record Management
SURVEY COMPONENT MVFR INFORMATION
POLICIES, RULES, REGULATIONS, & OPERATIONAL GUIDELINES
Human resource manager (Name) Melissa Meehan )
Personnel policy manual maintained? Yes
Manual provided at initial hiring? Yes
Training provided? New hires sign a document that they have read it
Periodically reviewed & updated? (Frequency) Last done in 2013
Outdated policies retained? Some
REPORTS & RECORDS
Personnel records maintained?
Application retained? Yes
Historical records archived? Not routinely
Performance evaluations retained? Yes
Injury & accident records retained? Yes
Health & exposure records maintained? Yes
Operational & Management Assessment Mountain View Fire Rescue
101
Discussion
Mountain View Fire Rescue is clearly concerned with providing written direction to its personnel regarding
organizational performance expectations. However, staff have recognized that the department has not
always been consistent in providing new members with all of the resources available to help them learn
what the organization expects of them. These expectations are transmitted formally and informally
through MVFR’s supervisory and training staff, and its overall culture. When possible, the district’s
managers should strive to make this information available in documentable form. Having new hires sign a
form acknowledging that they have read the personnel policies is not the same as taking the time to review
them with employees, soliciting feedback to ensure that they understand them. Failing to do so interrupts
the communications loop that validates understanding. In short, a new employee’s signature attesting to
his or her having read the employee handbook is no guarantee that he or she understands unequivocally
what the department intends to have communicated.
MVFR has adopted a number of administrative guidelines—the Administrative Operating Guidelines
(AOGs). However, they do not appear to be organized in any easily discernable fashion. District managers
should adopt a plan for organizing the AOGs by similar subject matter or by divisional responsibility. All
finance related guidelines should be found in the same section of the AOG manual. The same should be
true for human resources subjects, fire prevention, and so on. Using such an organizing principal will make
it easier for all employees to find the guidelines relevant to their concerns.
Another concern is that the current AOGs do not cover many of MVFR’s processes. Policies are one way
that organizations transmit to new employees how things are done. Given recent administrative turnover
and the realistic expectation that retirements will create more change in personnel in the near future, the
district should be aware that as experienced, senior employees hand responsibilities off to newer, less
experienced staff, more standard practices will be exposed as in need of codification in the form of written
policy. By doing so, future staff transitions will proceed more smoothly.
Some policies are in need of review regarding best practices. For example, the substance abuse policy
found in the Employee Handbook describes behaviors that are in violation of the policy but contains no
information regarding who is responsible for reporting suspected violations, nor to whom such suspicions
should be reported. Also missing is any mention of what counseling opportunities may be available to an
employee who recognizes that he or she may have a substance abuse problem and need assistance.
Another area reviewed by ESCI was job descriptions. Generally, the format is consistent with best practices,
but some updating and corrections are in order. Some examples include misspellings and editing errors in
the various descriptions. The HR Manager position, for example, is in a document called HR Director.
Another issue that the department should begin to address is the personalization of some descriptions. For
example, Finance Director positions in fire agencies similar to Mountain View Fire Rescue require a CPA
certification. The current Finance Director for MVFR is qualified by and through her long experience in the
field, but an updated job description should be developed to bring the position description into line with
industry expectations.

Operational & Management Assessment Mountain View Fire Rescue
102
There is an Administrative Assistant II job description but no Administrative Assistant I, and the job
description is dated 2009 even though the district has recently made a new hire for the position. Best
practice is to review and update job descriptions when a new hire is in process, or every three to five years.
Incumbent employees with an interest in promoting or transitioning to another position in an organization
will often use job descriptions as a guide for how to prepare for an eventual vacancy. When job descriptions
are kept out of date in deference to a current job holder, the changes in job description that occur when the
job becomes open and applications are accepted can be viewed by internal applicants as a ploy to exclude
them from a promotional opportunity. Anecdotally, that is how some members of MVFR interpreted
changes to the district’s job description for Captain. Best practice is to give reasonable advance notice
dependent upon the degree of change in requirements.
A specific issue raised during stakeholder interviews was the requirement in the Captain job description for
applicants to possess a bachelor’s degree. For a full-time employee with a family, earning a four-year
degree is a significant undertaking. This was very unusual at the time that it was implemented. In a survey
of other regional fire agencies, no one currently requires captains to have obtained a four-year college
degree. North Metro Fire will require a bachelor’s degree for Captain applicants starting in 2020—a
requirement it announced in 2015, giving current employees five years to plan for it. In the case of other fire
departments, a degree was required for the Battalion Chief position, but even then, a combination of
experience and other education could be substituted. MVFR’s job descriptions do not allow such flexibility.
It is not our point that district managers and policy makers cannot make the decision to set standards and
qualifications for the positions established within the department, but there should always be a well-
articulated and reasonable explanation—especially when they fall outside the norms of the industry.
RECOMMENDATIONS:
• Include a review of the employee handbook in the new hire orientation process.
• Organize the AOG manual into sections dedicated to each division.
• Use the transition of long time staff to newer personnel to identify processes and practices that should be included in the AOG or other policy manual.
• Revise the substance abuse policy to include important, missing information.
• Human Resources should conduct a review of current job descriptions to assure that they are up to date and reflect current best practice.
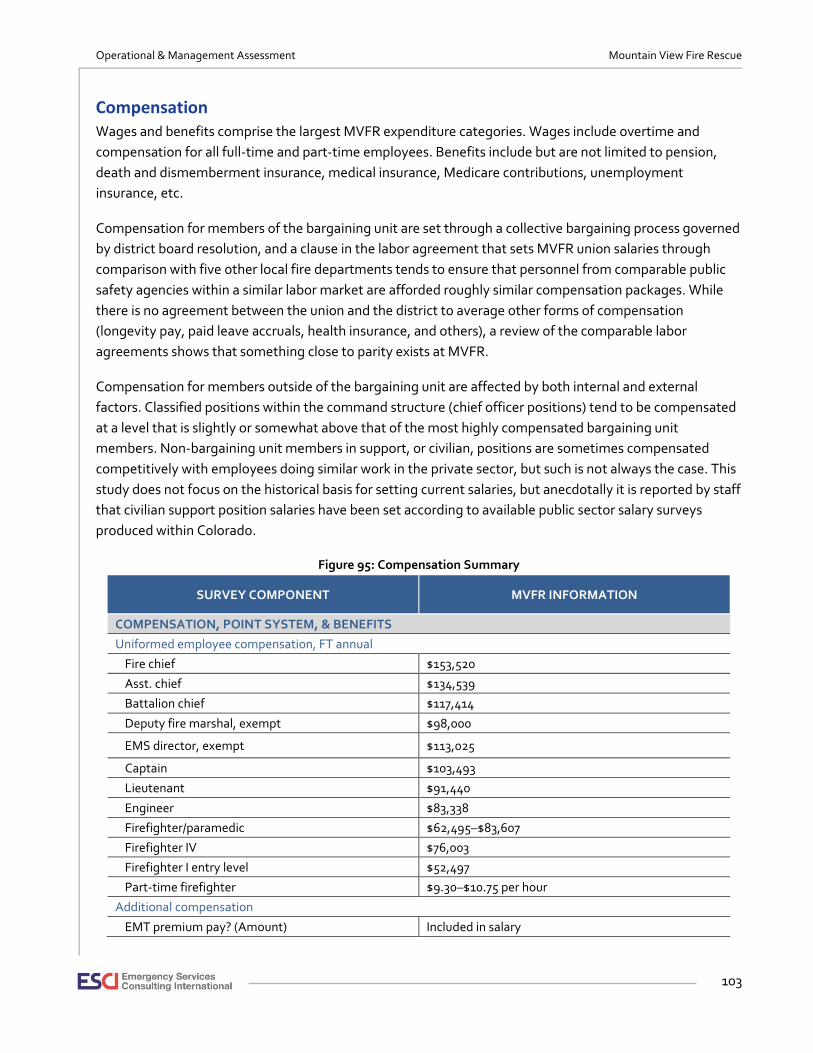
Operational & Management Assessment Mountain View Fire Rescue
103
Compensation Wages and benefits comprise the largest MVFR expenditure categories. Wages include overtime and
compensation for all full-time and part-time employees. Benefits include but are not limited to pension,
death and dismemberment insurance, medical insurance, Medicare contributions, unemployment
insurance, etc.
Compensation for members of the bargaining unit are set through a collective bargaining process governed
by district board resolution, and a clause in the labor agreement that sets MVFR union salaries through
comparison with five other local fire departments tends to ensure that personnel from comparable public
safety agencies within a similar labor market are afforded roughly similar compensation packages. While
there is no agreement between the union and the district to average other forms of compensation
(longevity pay, paid leave accruals, health insurance, and others), a review of the comparable labor
agreements shows that something close to parity exists at MVFR.
Compensation for members outside of the bargaining unit are affected by both internal and external
factors. Classified positions within the command structure (chief officer positions) tend to be compensated
at a level that is slightly or somewhat above that of the most highly compensated bargaining unit
members. Non-bargaining unit members in support, or civilian, positions are sometimes compensated
competitively with employees doing similar work in the private sector, but such is not always the case. This
study does not focus on the historical basis for setting current salaries, but anecdotally it is reported by staff
that civilian support position salaries have been set according to available public sector salary surveys
produced within Colorado.
Figure 95: Compensation Summary
SURVEY COMPONENT MVFR INFORMATION
COMPENSATION, POINT SYSTEM, & BENEFITS
Uniformed employee compensation, FT annual
Fire chief $153,520
Asst. chief $134,539
Battalion chief $117,414
Deputy fire marshal, exempt $98,000
EMS director, exempt $113,025
Captain $103,493
Lieutenant $91,440
Engineer $83,338
Firefighter/paramedic $62,495–$83,607
Firefighter IV $76,003
Firefighter I entry level $52,497
Part-time firefighter $9.30–$10.75 per hour
Additional compensation
EMT premium pay? (Amount) Included in salary
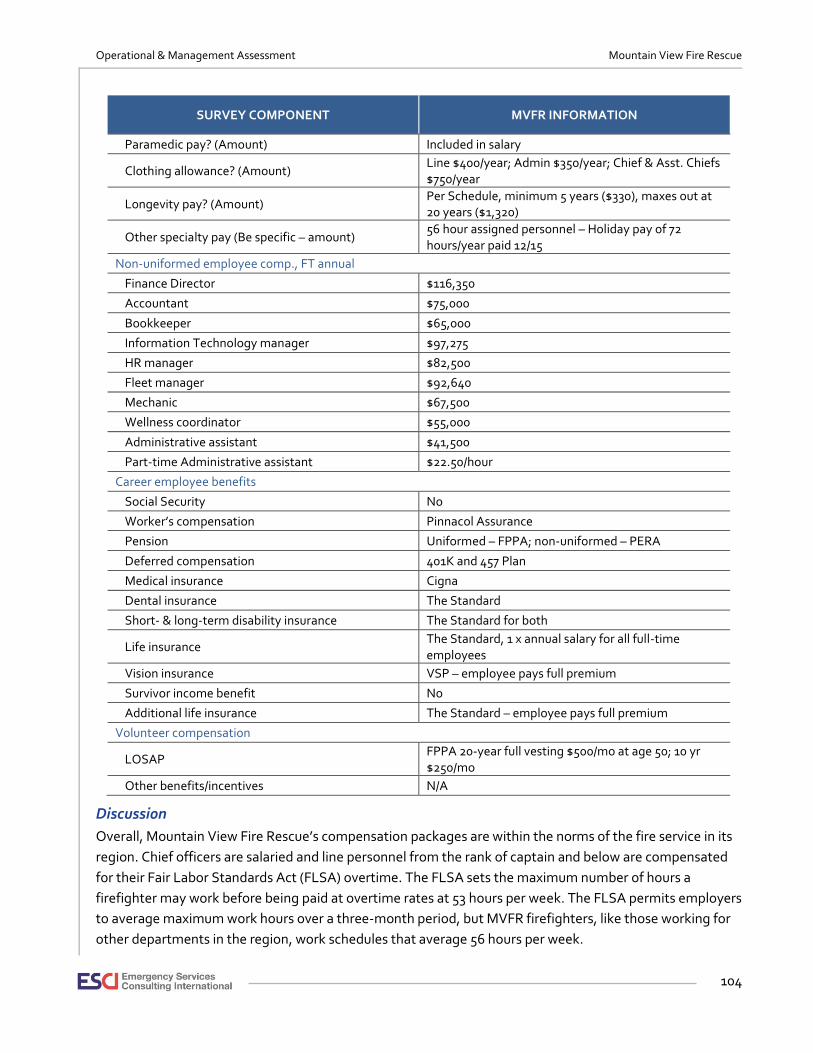
Operational & Management Assessment Mountain View Fire Rescue
104
SURVEY COMPONENT MVFR INFORMATION
Paramedic pay? (Amount) Included in salary
Clothing allowance? (Amount) Line $400/year; Admin $350/year; Chief & Asst. Chiefs $750/year
Longevity pay? (Amount) Per Schedule, minimum 5 years ($330), maxes out at 20 years ($1,320)
Other specialty pay (Be specific – amount) 56 hour assigned personnel – Holiday pay of 72 hours/year paid 12/15
Non-uniformed employee comp., FT annual
Finance Director $116,350
Accountant $75,000
Bookkeeper $65,000
Information Technology manager $97,275
HR manager $82,500
Fleet manager $92,640
Mechanic $67,500
Wellness coordinator $55,000
Administrative assistant $41,500
Part-time Administrative assistant $22.50/hour
Career employee benefits
Social Security No
Worker’s compensation Pinnacol Assurance
Pension Uniformed – FPPA; non-uniformed – PERA
Deferred compensation 401K and 457 Plan
Medical insurance Cigna
Dental insurance The Standard
Short- & long-term disability insurance The Standard for both
Life insurance The Standard, 1 x annual salary for all full-time employees
Vision insurance VSP – employee pays full premium
Survivor income benefit No
Additional life insurance The Standard – employee pays full premium
Volunteer compensation
LOSAP FPPA 20-year full vesting $500/mo at age 50; 10 yr $250/mo
Other benefits/incentives N/A
Discussion
Overall, Mountain View Fire Rescue’s compensation packages are within the norms of the fire service in its
region. Chief officers are salaried and line personnel from the rank of captain and below are compensated
for their Fair Labor Standards Act (FLSA) overtime. The FLSA sets the maximum number of hours a
firefighter may work before being paid at overtime rates at 53 hours per week. The FLSA permits employers
to average maximum work hours over a three-month period, but MVFR firefighters, like those working for
other departments in the region, work schedules that average 56 hours per week.
Operational & Management Assessment Mountain View Fire Rescue
105
This results in an employer obligation to pay three hours per week of pay at overtime rates. Employers
must also set an FLSA “cycle” for the purpose of measuring the overtime liability. This cycle can be from 7
days to 28 days. Fire departments utilizing the 48 hours on, 96 hours off shift schedule commonly settle on
a 24-day cycle because is produces an easier payroll process.
The 48/96 schedule is relatively new for the fire service and has been adopted by some, but not all, of the
region’s fire departments. After the end of World War II, the 24-hour shift with 48 consecutive hours off
became the common work schedule, with variations or modifications intended to either reduce the average
work week to 53 hours (or fewer) or schedule more hours in a shorter period in order to create a longer
period of off time. The 48/96 is one example. In return for working a longer shift (twice the 24-hour previous
norm) the employee has 96 consecutive hours off (twice what was typical under the 24/48 schedule). The
48/96 has proven to be popular with many firefighters. It has created concerns for some fire managers
which will be discussed below.
Other incentive pays are common in the fire service. For example, in other regions firefighters may be paid
extra for advanced EMS certifications. At MVFR, as is found in surrounding departments, pay for EMT
ratings (basic and paramedic certifications) are included in base salaries. Specialty teams—Hazardous
Materials, Technical Rescue, and Wildland—are likewise considered to be compensated as a part of
firefighter base salaries.
All positions at Mountain View Fire Rescue are salaried except for the two part-time classifications
(administrative assistant and part-time firefighter) are paid at hourly rates. Again, this is a fire industry
norm. Not within the scope of this study is the issue of whether MVFR has set its civilian position salaries in
accord with similar private sector positions in the region, however, as noted above, the district does
benchmark to similar positions in the local public sector.
The district provides the usual range of benefits, including medical, dental, vision, disability, and life
insurances. Employees pay a portion of the monthly premium cost with the majority being paid for by
MVFR. The district provides a Length of Service Award Plan (LOSAP) for its volunteers through the FFPA,
but there is currently only one reported active volunteer firefighter. MVFR employees do not participate in
the Social Security system, saving employees and the employer significantly, but denying them retirement
and disability benefits available through that system unless they earn them from another employer.
Through the collective bargaining agreement and through policy for its non-union employees, MVFR
provides for a matching deferred compensation plan. The district matches employee contributions to a
certain level. Mountain View Fire Rescue also includes a longevity bonus in its compensation plan,
rewarding employees for time of service with the district.
The following figure shows MVFR union compensation relative to its closest neighbors. It appears that the
practice of keeping salaries equal to the average of the comparator departments’ previous year’s salaries
has had the desired effect with the local labor market.
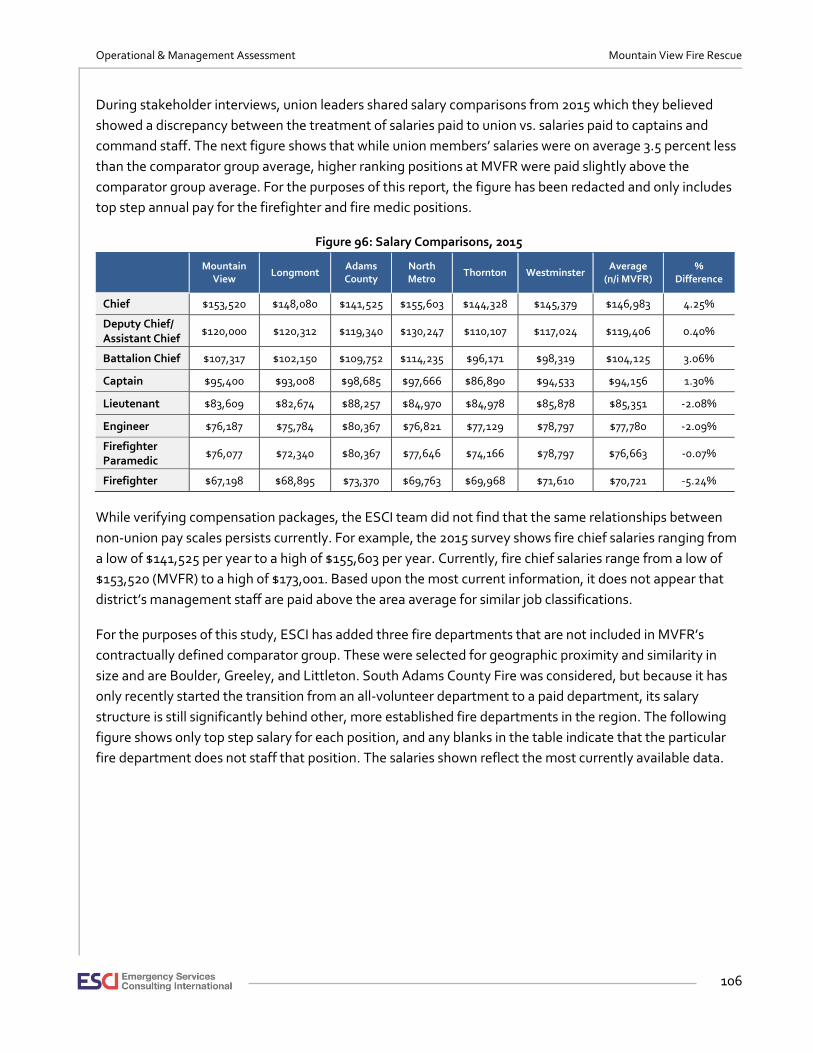
Operational & Management Assessment Mountain View Fire Rescue
106
During stakeholder interviews, union leaders shared salary comparisons from 2015 which they believed
showed a discrepancy between the treatment of salaries paid to union vs. salaries paid to captains and
command staff. The next figure shows that while union members’ salaries were on average 3.5 percent less
than the comparator group average, higher ranking positions at MVFR were paid slightly above the
comparator group average. For the purposes of this report, the figure has been redacted and only includes
top step annual pay for the firefighter and fire medic positions.
Figure 96: Salary Comparisons, 2015
Mountain View
Longmont Adams County
North Metro
Thornton Westminster Average
(n/i MVFR) %
Difference
Chief $153,520 $148,080 $141,525 $155,603 $144,328 $145,379 $146,983 4.25%
Deputy Chief/ Assistant Chief
$120,000 $120,312 $119,340 $130,247 $110,107 $117,024 $119,406 0.40%
Battalion Chief $107,317 $102,150 $109,752 $114,235 $96,171 $98,319 $104,125 3.06%
Captain $95,400 $93,008 $98,685 $97,666 $86,890 $94,533 $94,156 1.30%
Lieutenant $83,609 $82,674 $88,257 $84,970 $84,978 $85,878 $85,351 -2.08%
Engineer $76,187 $75,784 $80,367 $76,821 $77,129 $78,797 $77,780 -2.09%
Firefighter Paramedic
$76,077 $72,340 $80,367 $77,646 $74,166 $78,797 $76,663 -0.07%
Firefighter $67,198 $68,895 $73,370 $69,763 $69,968 $71,610 $70,721 -5.24%
While verifying compensation packages, the ESCI team did not find that the same relationships between
non-union pay scales persists currently. For example, the 2015 survey shows fire chief salaries ranging from
a low of $141,525 per year to a high of $155,603 per year. Currently, fire chief salaries range from a low of
$153,520 (MVFR) to a high of $173,001. Based upon the most current information, it does not appear that
district’s management staff are paid above the area average for similar job classifications.
For the purposes of this study, ESCI has added three fire departments that are not included in MVFR’s
contractually defined comparator group. These were selected for geographic proximity and similarity in
size and are Boulder, Greeley, and Littleton. South Adams County Fire was considered, but because it has
only recently started the transition from an all-volunteer department to a paid department, its salary
structure is still significantly behind other, more established fire departments in the region. The following
figure shows only top step salary for each position, and any blanks in the table indicate that the particular
fire department does not staff that position. The salaries shown reflect the most currently available data.
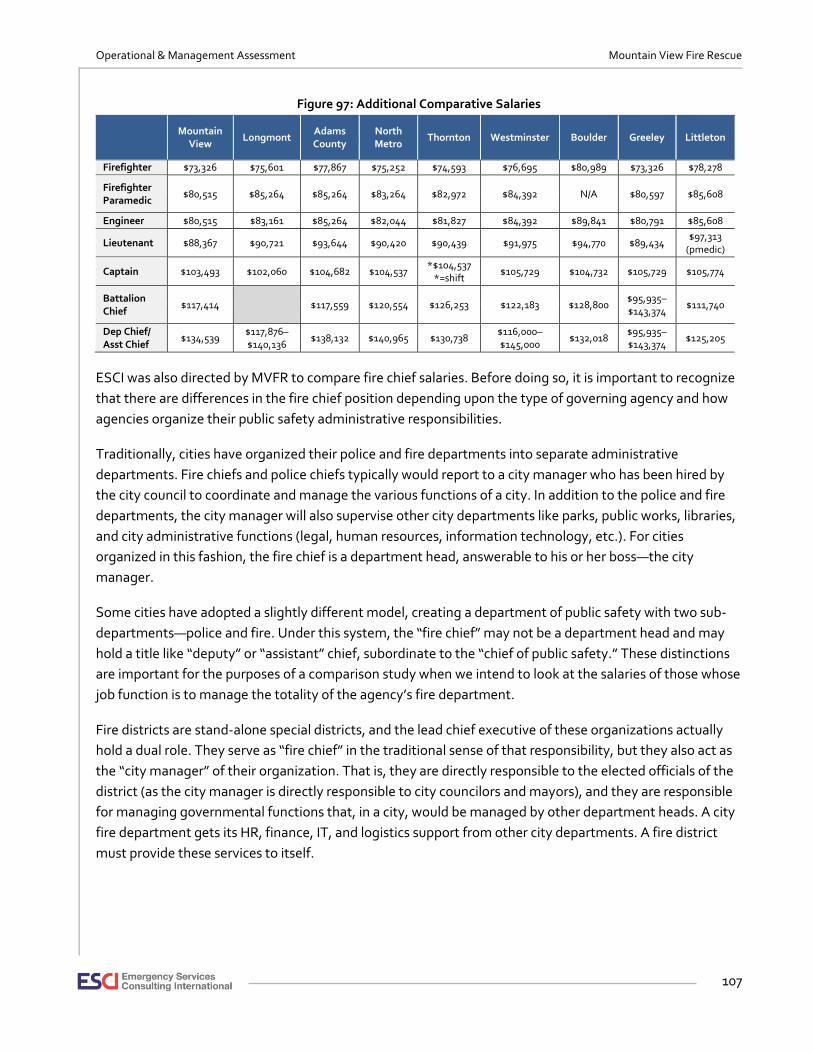
Operational & Management Assessment Mountain View Fire Rescue
107
Figure 97: Additional Comparative Salaries
Mountain View
Longmont Adams County
North Metro
Thornton Westminster Boulder Greeley Littleton
Firefighter $73,326 $75,601 $77,867 $75,252 $74,593 $76,695 $80,989 $73,326 $78,278
Firefighter Paramedic
$80,515 $85,264 $85,264 $83,264 $82,972 $84,392 N/A $80,597 $85,608
Engineer $80,515 $83,161 $85,264 $82,044 $81,827 $84,392 $89,841 $80,791 $85,608
Lieutenant $88,367 $90,721 $93,644 $90,420 $90,439 $91,975 $94,770 $89,434 $97,313
(pmedic)
Captain $103,493 $102,060 $104,682 $104,537 *$104,537
*=shift $105,729 $104,732 $105,729 $105,774
Battalion Chief
$117,414 $117,559 $120,554 $126,253 $122,183 $128,800 $95,935– $143,374
$111,740
Dep Chief/ Asst Chief
$134,539 $117,876–$140,136
$138,132 $140,965 $130,738 $116,000– $145,000
$132,018 $95,935– $143,374
$125,205
ESCI was also directed by MVFR to compare fire chief salaries. Before doing so, it is important to recognize
that there are differences in the fire chief position depending upon the type of governing agency and how
agencies organize their public safety administrative responsibilities.
Traditionally, cities have organized their police and fire departments into separate administrative
departments. Fire chiefs and police chiefs typically would report to a city manager who has been hired by
the city council to coordinate and manage the various functions of a city. In addition to the police and fire
departments, the city manager will also supervise other city departments like parks, public works, libraries,
and city administrative functions (legal, human resources, information technology, etc.). For cities
organized in this fashion, the fire chief is a department head, answerable to his or her boss—the city
manager.
Some cities have adopted a slightly different model, creating a department of public safety with two sub-
departments—police and fire. Under this system, the “fire chief” may not be a department head and may
hold a title like “deputy” or “assistant” chief, subordinate to the “chief of public safety.” These distinctions
are important for the purposes of a comparison study when we intend to look at the salaries of those whose
job function is to manage the totality of the agency’s fire department.
Fire districts are stand-alone special districts, and the lead chief executive of these organizations actually
hold a dual role. They serve as “fire chief” in the traditional sense of that responsibility, but they also act as
the “city manager” of their organization. That is, they are directly responsible to the elected officials of the
district (as the city manager is directly responsible to city councilors and mayors), and they are responsible
for managing governmental functions that, in a city, would be managed by other department heads. A city
fire department gets its HR, finance, IT, and logistics support from other city departments. A fire district
must provide these services to itself.

Operational & Management Assessment Mountain View Fire Rescue
108
There are positive and negative sides to the difference between managing a fire district and managing a
city fire department. The fire chief of a district does not have to compete with other department heads for
resources and priority, but the chief of a district does have to act as the arbiter of the managers in his or her
chain of command who are competing for the resources available to the organization. The fire department
is only one of many priorities for a city; but for a fire district, fire protection is the only priority.
There are two outcomes we see as a result of these factors. One is that some argue that of two fire chiefs
managing two equal-sized departments, the chief of a district has a more complex job because he or she
a) answers directly to elected officials, and b) is responsible for managing a wider array of support functions
as part of his or her regular portfolio. City chiefs can disagree with these points, arguing that the challenge
of competing with other department heads while maintaining professional relationships with other
managers and elected officials, present equivalent challenges. It is not the purpose of this study to take a
side in this argument, only to assure that the board members are aware of it.
A final issue to this discussion is whether fire chiefs, in general, enjoy employment contracts or serve
employers in an at will capacity. The previous MVFR fire chief was employed under a six-year contract. Fire
chief associations across the United States promote the idea of employment agreements for fire chiefs as a
way of securing some job security for a position, whether within a city or a district, that can fall under
political influence and other pressures that have little to do with actual job performance. For whatever
reason, in the region closest to MVFR employment contracts are not common in city fire departments and
are found only about half of the time in fire districts. This difference may reflect a recognition that a
position answering directly to the organization’s elected officials is inherently more subject to political
influence. It may also be reflective of the fact that when a fire district makes the decision to offer its chief
executive an employment agreement, it affects only one individual. The same decision made within the
structure of a city would raise the issue of employment contracts for all department heads.
A concern of the board’s is the issue of whether MVFR has been paying “out of market” for the position of
fire chief. The following figure shows that, in fact, the former fire chief was being paid below market.
Although his employment contract called for him to be evaluated annually and for him to be eligible for
“merit” increases based upon his performance, there is no record that he was evaluated or compensated in
the form of either an increase in salary or a bonus of any kind. His benefit package does not seem to be out
of line in a significant way with his peers in the region with the exception of a provision for educational
reimbursement of up to $20,000 over the period that the contract was to be in effect. If pro-rated over the
life of the employment agreement—even without adjusting for the $2,000 per year that MVFR offers all
employees—the educational reimbursement package does not bring the fire chief’s salary to equivalency
with the regional average. The salaries shown reflect the most currently available data.
Figure 98: Fire Chief Salary Comparison
Mt. View
Longmont Adams County
North Metro
Thornton Westminster Boulder Greeley Littleton
Fire Chief
$153,520 $147,348– $175,176
$170,173 $173,093 $126,180– $174,132
$144,000– $180,000
$126,120– $192,096
$112,862–$169,333
$142,334
Contract Y N Y Y N N N N N
Operational & Management Assessment Mountain View Fire Rescue
109
The board has considered whether it needs to offer a fire chief salary that is competitive with its region
given the fact that prospective candidates for the position of fire chief may come from other parts of the
state or the country where salaries are not as high as is found in the region north of Denver. This is an
option that the board may choose to explore, but it should be noted that when there is a robust job market
and an organization—public or private—compensates employees below its regional and industrial averages,
employee turnover tends to rise and the quality of job applicants, generally, wanes. To attract the best
talent, MVFR does not need to offer the highest compensation package in its region, but it will be taking a
risk if it offers a package that is significantly outside of what others in its market are offering.
In the course of soliciting stakeholder input regarding individual concerns and observations, some
management staff raised the issue of the apparent increase in injuries during the second half of 48-hour
shifts. ESCI teams have heard similar concerns in other departments utilizing or contemplating the
adoption of the 48/96 shift model. The issue is the potential effect of worker fatigue on safety and
performance, especially if emergency responders are not getting enough quality sleep during their
extended shifts. Provided with on-the-job injury records from 2012 to the present, a brief review revealed
the following: of 140 injury reports, 39 occurred during the first half of a 48-hour tour while 77 occurred
during the second half. An additional 24 injury reports resulted from shifts that were the part of a 72-hour
tour or an overtime shift worked separate from the individual’s regular 48-hour tour.
We do not know how often firefighters work tours that extend beyond the 48-hour regular shift, and there
are many variables regarding what is going on for a firefighter who comes in to work a shift that falls during
the four days that he or she would normally be off. We do know that all shift employees normally work two
24-hour days back to back and that the injury rate on the second day is almost twice that of the first day.
When we add the additional 24 injuries that occurred when employees were working outside of the normal
48-on, 96-off routine, we can see that there is a pattern that warrants further study.
The records that ESCI was given to review did not include important variables that may be relevant. Were
there more injuries in busier stations or during busier shifts? Is there a pattern regarding the age or relative
seniority/experience of those who were injured? The service delivery section of this report should give
district staff some idea of how to track this issue going forward.
Another question raised during stakeholder interviews was mandatory overtime. At MVFR when a vacancy
cannot be filled with on-duty relief personnel, off-duty personnel are offered the opportunity to volunteer
to fill that shift. Even though these extra work tours are paid at overtime rates, the district cannot always
find someone to work voluntarily. In those instances, firefighters are ordered to work even though they
would prefer not to. Some firefighters believe this problem is the result of MVFR’s understaffing its relief
pool. At least one chief officer reported that in his experience the only mandatory overtime that creates a
problem is the fire and EMS standby time at the local speedway.
It is not possible to access the kind of data that would be helpful in analyzing this issue. Overtime is not
coded as mandatory or voluntary for payroll purposes. The firefighters’ union requested a review of this
staffing problem from its international office, and they report that the International Association of Fire
Operational & Management Assessment Mountain View Fire Rescue
110
Fighters (IAFF) concludes that Mountain View Fire Rescue should have 3.5 FTEs for each minimum-staffed
position on its fire equipment. However, MVFR managers report that they carry four relief personnel per
shift, and given the department’s daily staffing, this pool should be adequate for coverage.
One possible hindrance is MVFR’s practice of moving personnel up and hiring back at the firefighter level. In
its most extreme situation, this can mean that when a battalion chief takes a shift off, a captain is moved up
to fill that position, a lieutenant is moved up to fill that spot, and an engineer or firefighter is moved up to
fill that spot. If hiring back is necessary, it will be at the firefighter level. This practice used to be common in
the fire service as a money-saving tactic. Not considered was the amount of payroll activity this causes.
Instead of one overtime entry, this practice results in two to four changes in normal payroll as each
successive move up creates a payroll entry. This practice also tends to concentrate overtime at the
firefighter position.
Finally, in this section of the report we should address one more issue relative to compensation raised
during stakeholder interviews. Representatives of the firefighters’ union reported that the district has had a
practice of providing compensation increases to non-union staff that is greater than increases granted to
the bargaining unit. Their interpretation is that this has been intended to “reward” employees for not being
in the union. A comparison of MVFR salaries with the salaries paid at the district’s historic comparable
departments does show a discrepancy of between three and four percent when looking at the average
salaries of bargaining unit positions vs. the captain and battalion chief positions. There can be legitimate
reasons for creating salary spreads that look like this, but a transparent organization should have a
rationale for such disparity.
Firefighters also shared their belief that civilian staff were the recipients of the more expensive health care
option at no additional cost than was made available to union members. Executive staff reported to the
ESCI team that this used to be true but is no longer the case.
RECOMMENDATIONS:
• Use the service delivery findings of this report to inform a continued study of the effect of extended tours of duty on workers’ compensation injuries and other possible symptoms of fatigue.
• Engage with bargaining unit leaders to jointly address the issue of the appropriate relief staff and alternative staffing strategies for unpopular work assignments. Would part-time firefighters be attracted to the opportunity for seasonal work at the speedway?
• If there are assignment or job responsibility reasons for creating enhanced compensation packages for some segments of the district’s work force, identify and endorse such rationale at the board level.
• Assure that benefits and compensation policy are in written form and included in the AOGs.
• The board should determine whether, as a matter of policy, it will establish employment agreements for future fire chiefs and set a competitive comprehensive range of compensation before employing the district’s next fire chief.
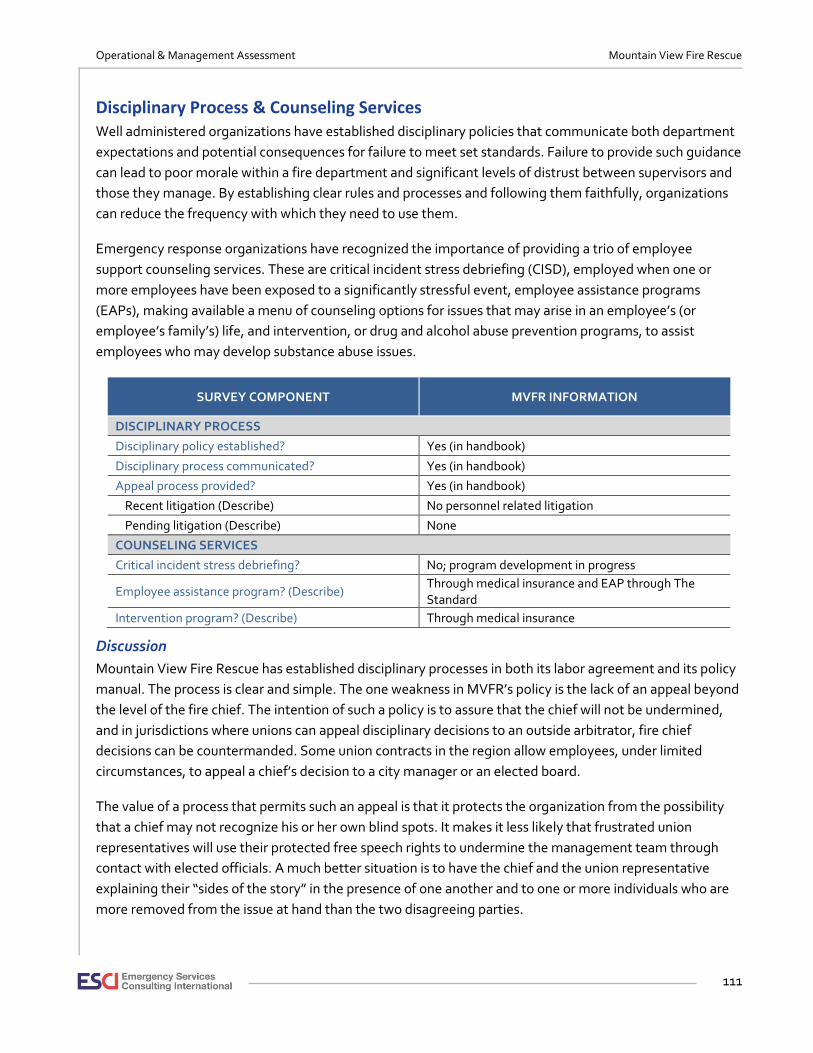
Operational & Management Assessment Mountain View Fire Rescue
111
Disciplinary Process & Counseling Services Well administered organizations have established disciplinary policies that communicate both department
expectations and potential consequences for failure to meet set standards. Failure to provide such guidance
can lead to poor morale within a fire department and significant levels of distrust between supervisors and
those they manage. By establishing clear rules and processes and following them faithfully, organizations
can reduce the frequency with which they need to use them.
Emergency response organizations have recognized the importance of providing a trio of employee
support counseling services. These are critical incident stress debriefing (CISD), employed when one or
more employees have been exposed to a significantly stressful event, employee assistance programs
(EAPs), making available a menu of counseling options for issues that may arise in an employee’s (or
employee’s family’s) life, and intervention, or drug and alcohol abuse prevention programs, to assist
employees who may develop substance abuse issues.
SURVEY COMPONENT MVFR INFORMATION
DISCIPLINARY PROCESS
Disciplinary policy established? Yes (in handbook)
Disciplinary process communicated? Yes (in handbook)
Appeal process provided? Yes (in handbook)
Recent litigation (Describe) No personnel related litigation
Pending litigation (Describe) None
COUNSELING SERVICES
Critical incident stress debriefing? No; program development in progress
Employee assistance program? (Describe) Through medical insurance and EAP through The Standard
Intervention program? (Describe) Through medical insurance
Discussion
Mountain View Fire Rescue has established disciplinary processes in both its labor agreement and its policy
manual. The process is clear and simple. The one weakness in MVFR’s policy is the lack of an appeal beyond
the level of the fire chief. The intention of such a policy is to assure that the chief will not be undermined,
and in jurisdictions where unions can appeal disciplinary decisions to an outside arbitrator, fire chief
decisions can be countermanded. Some union contracts in the region allow employees, under limited
circumstances, to appeal a chief’s decision to a city manager or an elected board.
The value of a process that permits such an appeal is that it protects the organization from the possibility
that a chief may not recognize his or her own blind spots. It makes it less likely that frustrated union
representatives will use their protected free speech rights to undermine the management team through
contact with elected officials. A much better situation is to have the chief and the union representative
explaining their “sides of the story” in the presence of one another and to one or more individuals who are
more removed from the issue at hand than the two disagreeing parties.
Operational & Management Assessment Mountain View Fire Rescue
112
In the area of counseling and intervention the district has some work to do. It has not adopted a critical
incident stress debriefing (CISD) program, and it does not appear to be promoting the value of its Employee
Assistance Program (EAP) as a way to intervene in substance abuse or other life stressors before problems
get too big.
CISDs are activated to respond to large crises, but over time it has been learned that for emergency
personnel it can be the incremental effect of small, but emotionally painful, experiences that motivates
emergency personnel to work with mental health professionals to develop and promote the CISD concept.
MVFR staff report that they are working toward the implementation of such a program for district
employees.
While CISD programs respond to specific events, EAPs have developed to support employees and their
families in response to a host of, usually, small life events. The EAP model has been adopted both inside
and outside of the emergency response community. It provides access to counseling and support for family,
financial, and other issues that are part of many lives. Like CISD, EAPs only work when supervisors and
informal leaders remind their co-workers of their value and existence.
MVFR, like all well run fire departments, has adopted a drug and alcohol policy. But it will only be as
effective as it is used. As already mentioned, substance abuse policies, include counseling and treatment
components, can only be effective when intervention occurs early enough to make a difference. Periodic
training in both policy and the value of peer-to-peer intervention should be scheduled.
RECOMMENDATIONS:
• Consider revising the discipline and grievance procedures found in district policy and the labor agreement to include a review of chief-level disciplinary decisions.
• Continue to implement a district CISD program.
• Schedule employee training to review district counseling and intervention services on a regular basis (every two years for example).

Operational & Management Assessment Mountain View Fire Rescue
113
Administrative and Support Staffing One of the primary responsibilities of a fire department’s administration is to ensure that the operational
segment of the organization has the ability and means to respond to and mitigate emergencies in a safe
and efficient manner. An effective administration and support services system is critical to the success of a
fire agency.
The management team is led by the fire chief, who acts as the chief executive officer for the district. His
responsibilities include providing organizational leadership consistent with the guidance provided by the
board of directors; keeping the board of directors informed about issues important to the policy-makers;
implementing district policy as set by the board; administering the district budget as approved by the
board; hiring, firing, and administering discipline to the workforce; representing the fire district to the
public; and performing other tasks consistent with a CEO’s duties.
Mountain View Fire Rescue employs three assistant chiefs and a fire marshal. The previous fire chief had
been rotating the three assistants through different areas of responsibility—operations and different areas
of support activities. The fire marshal has been a part-time position, but MVFR staff report that a new fire
marshal will be full-time. The rest of the district’s administrative and support staff is made up of both
uniformed and civilian personnel coordinating or performing training, EMS, community outreach, IT, fleet
maintenance, financial, and human resource services. Total administration and support staff is reported as
20 although that count includes part-time personnel who work varying hours (and some of whom could be
described as “casuals,” having no set schedule or hourly obligation). These comprise between 19 and 20
percent of the career work force. For fire districts, which do not enjoy the support services that city fire
departments receive from their city infrastructure, this percentage is within the range of similar fire
departments.
Like any other organization, administration and support need appropriate resources to function properly.
By analyzing the administrative and support positions within an organization we can create a common
understanding of the relative resources committed to this function compared to industry best practices and
similar organizations. The appropriate balance of administration and support compared to operational
resources and service levels is critical to the success of the department in accomplishing its mission and
responsibilities.
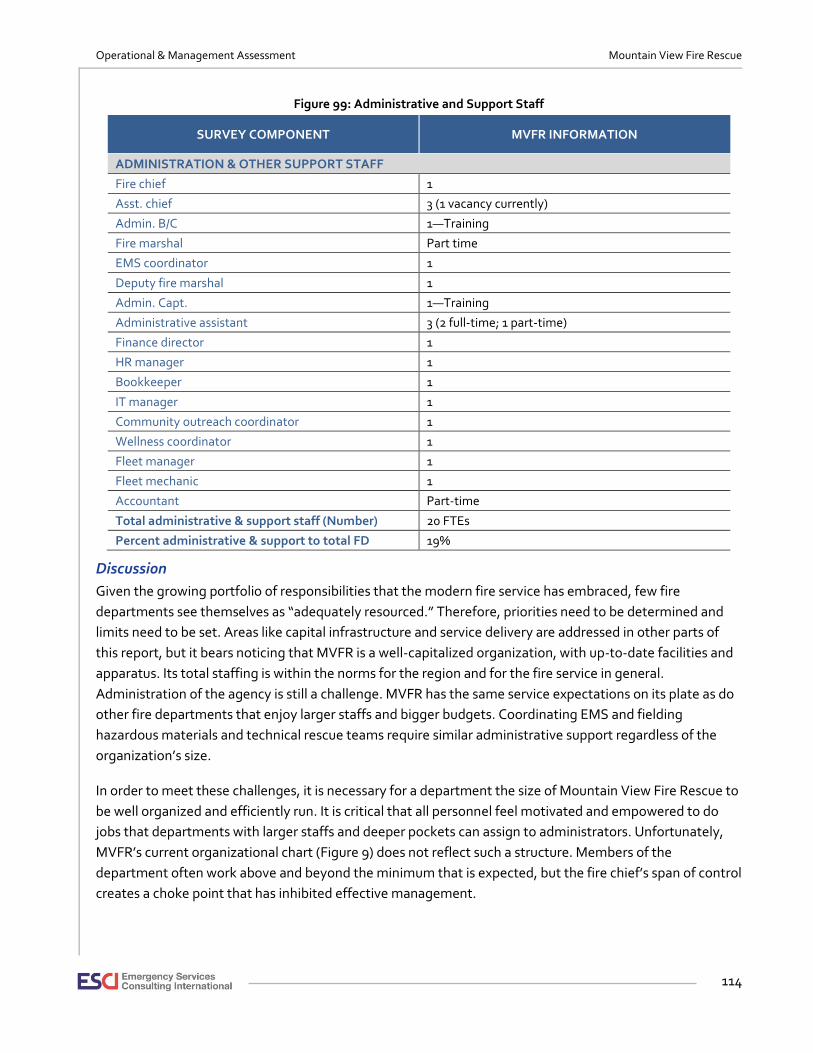
Operational & Management Assessment Mountain View Fire Rescue
114
Figure 99: Administrative and Support Staff
SURVEY COMPONENT MVFR INFORMATION
ADMINISTRATION & OTHER SUPPORT STAFF
Fire chief 1
Asst. chief 3 (1 vacancy currently)
Admin. B/C 1—Training
Fire marshal Part time
EMS coordinator 1
Deputy fire marshal 1
Admin. Capt. 1—Training
Administrative assistant 3 (2 full-time; 1 part-time)
Finance director 1
HR manager 1
Bookkeeper 1
IT manager 1
Community outreach coordinator 1
Wellness coordinator 1
Fleet manager 1
Fleet mechanic 1
Accountant Part-time
Total administrative & support staff (Number) 20 FTEs
Percent administrative & support to total FD 19%
Discussion
Given the growing portfolio of responsibilities that the modern fire service has embraced, few fire
departments see themselves as “adequately resourced.” Therefore, priorities need to be determined and
limits need to be set. Areas like capital infrastructure and service delivery are addressed in other parts of
this report, but it bears noticing that MVFR is a well-capitalized organization, with up-to-date facilities and
apparatus. Its total staffing is within the norms for the region and for the fire service in general.
Administration of the agency is still a challenge. MVFR has the same service expectations on its plate as do
other fire departments that enjoy larger staffs and bigger budgets. Coordinating EMS and fielding
hazardous materials and technical rescue teams require similar administrative support regardless of the
organization’s size.
In order to meet these challenges, it is necessary for a department the size of Mountain View Fire Rescue to
be well organized and efficiently run. It is critical that all personnel feel motivated and empowered to do
jobs that departments with larger staffs and deeper pockets can assign to administrators. Unfortunately,
MVFR’s current organizational chart (Figure 9) does not reflect such a structure. Members of the
department often work above and beyond the minimum that is expected, but the fire chief’s span of control
creates a choke point that has inhibited effective management.

Operational & Management Assessment Mountain View Fire Rescue
115
Chief officers create systems that cause all work to flow through themselves out of good intention, but the
effect is to overburden the manager at the center of the system in the name of accountability and to reduce
the efficiency of the rest of the team. Another well-intentioned practice with negative organizational
consequences was the transferring of responsibilities among the assistant chiefs. The goal was to prepare
personnel for succession planning. The actual result appears to have been a lack of leadership continuity for
the different divisions, insecurity among the chief officers, and a loss of accountability throughout the
organization.
ESCI team members studying functions within the department will provide specific feedback regarding
staffing needs within each division. For example, MVFR has reached the size where the function of
managing and maintaining its apparatus fleet requires both a mechanic and a manager (who still works on
vehicles). This does not mean that the division’s functions are being managed as effectively as they could
be. The Capital section of this report provides constructive feedback in that area.
The issue of proper administrative staffing arises in more than one context. Is the fire department placing
too much emphasis on the administrative side and not enough on the operational side? Or, is the
department providing appropriate support staffing to its divisions in accordance with priorities developed
by the fire chief and the board of directors? As stated previously, Mountain View Fire Rescue’s balance
between operational and support staff is within the range of what ESCI commonly finds in fire districts.15
Our survey of other regional fire departments suggests that MVFR’s fire prevention division relatively
understaffed, but ESCI’s evaluation of MVFR’s fire prevention division shows that current staffing is
appropriate for the community it serves. Likewise, three assistant chiefs represent a slight overstaffing at
that level of the organization. That FTE might be better served at the staff battalion chief or captain level,
depending upon assignments and priorities.
The most important need for the administrative and support staff function at Mountain View Fire Rescue is
a revised organization chart that limits span of control at the top of the department. The fire chief should
supervise no more than four administrators and an administrative assistant or executive administrative
assistant. In some fire departments, the finance “director” is a direct report to the fire chief. In others, that
position reports to an assistant or deputy who may be assigned to supervise the finance and HR functions
(and other administrative functions as well—IT, for example). In some departments, the administrative
assistants work as a “pool;” while in others they are assigned to support specific divisions or functions. Both
approaches have pros and cons.
In smaller organizations, cross-training support personnel is an important way to reduce the dysfunction
that may occur when a key employee leaves the workplace—whether temporarily due to vacation or a
medical issue, or permanently due to retirement or to another job. When one or more employees work in a
parallel environment, cross-training can be arranged between peers through supervisory support. When
workers do not have parallel assignments, it falls to supervisors to initiate vertical cross-training.
15 Municipal fire departments tend to have a smaller ratio of support to operations because HR, finance, IT, and facilities maintenance functions are supplied to the fire department by other city departments.

Operational & Management Assessment Mountain View Fire Rescue
116
That means that supervisors need to learn the rudiments of subordinates’ duties, and subordinates need to
learn some part of their supervisors’ duties. Doing so increases the likelihood that a supervisor can help
train a subsequent hire if or when a subordinate vacates a position; simultaneously creating a succession
plan if the supervisor is the one who vacates. A subordinate may want to move into the supervisory role, or
that same subordinate might stay in his or her position and assist in the training of a new supervisor.
Some administrative assistant duties are appropriate for civilian volunteers. Civilian volunteers with
administrative skills can be a potential pool of candidates when vacancies occur within the administrative
team. This additional volunteer staffing can free existing staff to do more complex tasks. Administrative
assistants performing higher order support duties make it easier for chief officers to turn attention to higher
order planning and managerial priorities. When managers get too bogged down in day-to-day minutiae,
the larger organization suffers.
Mountain View Fire Rescue has not kept up with its IT support, but current staff report that software and
other improvements are being implemented or are in the planning stages. These efforts should continue to
be a high priority.
RECOMMENDATIONS:
• Reorganize the administrative support team using span of control principles and existing personnel in the most effective way possible.
• Within each assistant chief’s area of responsibility, identify staffing needs and priorities.
• Continue implementation of updated finance and HR software.
• If needed, consider recruiting non-traditional volunteers to assist with administrative support functions.
• Encourage cross-training between supervisors and subordinates.
Operational & Management Assessment Mountain View Fire Rescue
117
Emergency Service Staffing It takes an adequate and properly trained staff of emergency responders to put the appropriate emergency
apparatus and equipment to its best use in mitigating incidents. Insufficient staffing at an operational scene
decreases the effectiveness of the response and increases the risk of injury to all individuals involved.
Career personnel of Mountain View Fire Rescue perform fire and emergency medical first response (and
transport) from six stations that are always staffed with six pumpers (engines), three medic units, and a
shift battalion chief. One of the medics is staffed by the engine crew when needed; the other two medics
are always staffed. The district is a transporting agency, meaning that its medics serve as ambulances,
transporting patients to the hospital. For larger incidents, MVFR relies upon neighboring agencies for
assistance, providing mutual assistance in return.
Emergency medical responses run from the minor—a person in physical but not life-threatening distress, to
major—multiple critical patients at a major vehicle accident, for example. Fire departments are expected to
develop protocols for handling various kinds of emergencies.
For fires, it is also a best practice to develop plans for responding to and performing the many tasks that
must be performed at the scene. These tasks can be broken down into two key components—life safety
and fire flow. Life safety tasks are based on the number of building occupants, and their location, status,
and ability to take self-preservation action. Life safety related tasks involve search, rescue, and evacuation
of victims. The fire flow component involves delivering sufficient water to extinguish the fire and create an
environment within the building that allows entry by firefighters.
The number and types of tasks needing simultaneous action will dictate the minimum number of
firefighters required to combat different types of fires (ERF). In the absence of adequate personnel to
perform concurrent action, the command officer must prioritize the tasks and complete some in
chronological order, rather than concurrently. These tasks include:
• Command
• Scene safety
• Search and rescue
• Fire attack
• Water supply
• Pump operation
• Ventilation
• Back-up/rapid intervention
The first 15 minutes is the most crucial period in the suppression of a fire. How effectively and efficiently
firefighters perform during this period has a significant impact on the overall outcome of the event. This
general concept is applicable to fire, rescue, and medical situations. Critical tasks must be conducted in a
timely manner in order to control a fire or to treat a patient. MVFR is responsible for assuring that
responding companies are capable of performing all of the described tasks in a prompt, efficient, and safe
manner.
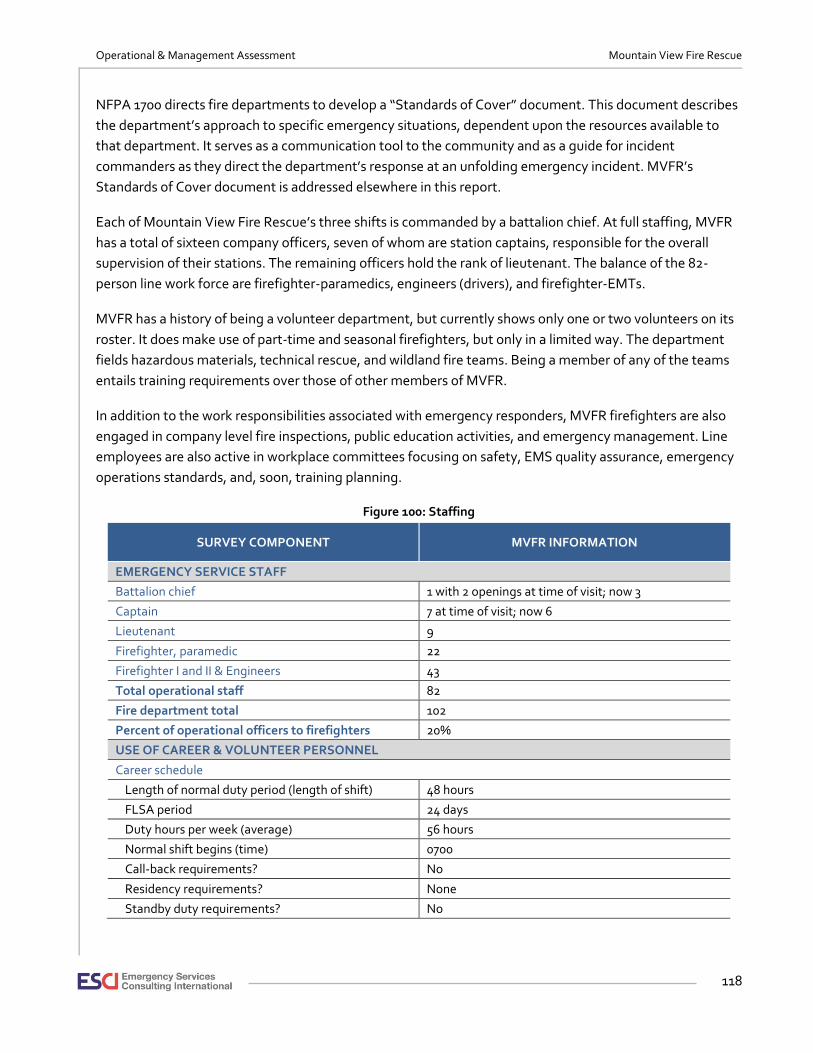
Operational & Management Assessment Mountain View Fire Rescue
118
NFPA 1700 directs fire departments to develop a “Standards of Cover” document. This document describes
the department’s approach to specific emergency situations, dependent upon the resources available to
that department. It serves as a communication tool to the community and as a guide for incident
commanders as they direct the department’s response at an unfolding emergency incident. MVFR’s
Standards of Cover document is addressed elsewhere in this report.
Each of Mountain View Fire Rescue’s three shifts is commanded by a battalion chief. At full staffing, MVFR
has a total of sixteen company officers, seven of whom are station captains, responsible for the overall
supervision of their stations. The remaining officers hold the rank of lieutenant. The balance of the 82-
person line work force are firefighter-paramedics, engineers (drivers), and firefighter-EMTs.
MVFR has a history of being a volunteer department, but currently shows only one or two volunteers on its
roster. It does make use of part-time and seasonal firefighters, but only in a limited way. The department
fields hazardous materials, technical rescue, and wildland fire teams. Being a member of any of the teams
entails training requirements over those of other members of MVFR.
In addition to the work responsibilities associated with emergency responders, MVFR firefighters are also
engaged in company level fire inspections, public education activities, and emergency management. Line
employees are also active in workplace committees focusing on safety, EMS quality assurance, emergency
operations standards, and, soon, training planning.
Figure 100: Staffing
SURVEY COMPONENT MVFR INFORMATION
EMERGENCY SERVICE STAFF
Battalion chief 1 with 2 openings at time of visit; now 3
Captain 7 at time of visit; now 6
Lieutenant 9
Firefighter, paramedic 22
Firefighter I and II & Engineers 43
Total operational staff 82
Fire department total 102
Percent of operational officers to firefighters 20%
USE OF CAREER & VOLUNTEER PERSONNEL
Career schedule
Length of normal duty period (length of shift) 48 hours
FLSA period 24 days
Duty hours per week (average) 56 hours
Normal shift begins (time) 0700
Call-back requirements? No
Residency requirements? None
Standby duty requirements? No
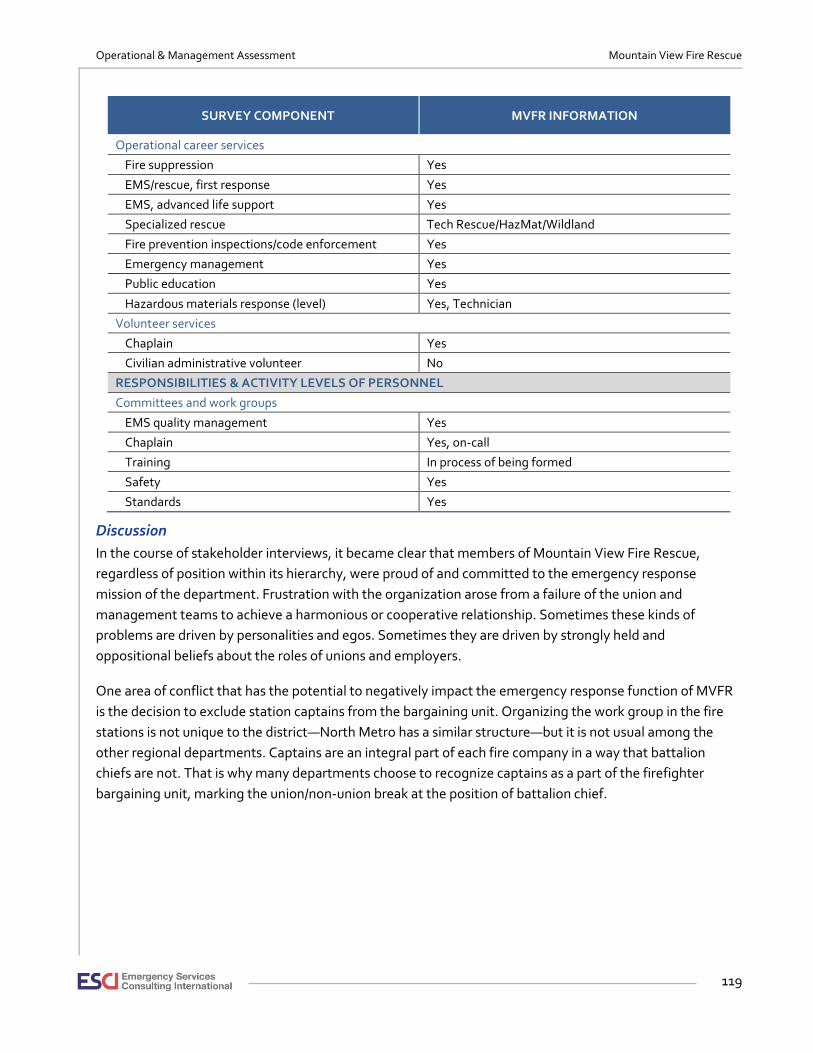
Operational & Management Assessment Mountain View Fire Rescue
119
SURVEY COMPONENT MVFR INFORMATION
Operational career services
Fire suppression Yes
EMS/rescue, first response Yes
EMS, advanced life support Yes
Specialized rescue Tech Rescue/HazMat/Wildland
Fire prevention inspections/code enforcement Yes
Emergency management Yes
Public education Yes
Hazardous materials response (level) Yes, Technician
Volunteer services
Chaplain Yes
Civilian administrative volunteer No
RESPONSIBILITIES & ACTIVITY LEVELS OF PERSONNEL
Committees and work groups
EMS quality management Yes
Chaplain Yes, on-call
Training In process of being formed
Safety Yes
Standards Yes
Discussion
In the course of stakeholder interviews, it became clear that members of Mountain View Fire Rescue,
regardless of position within its hierarchy, were proud of and committed to the emergency response
mission of the department. Frustration with the organization arose from a failure of the union and
management teams to achieve a harmonious or cooperative relationship. Sometimes these kinds of
problems are driven by personalities and egos. Sometimes they are driven by strongly held and
oppositional beliefs about the roles of unions and employers.
One area of conflict that has the potential to negatively impact the emergency response function of MVFR
is the decision to exclude station captains from the bargaining unit. Organizing the work group in the fire
stations is not unique to the district—North Metro has a similar structure—but it is not usual among the
other regional departments. Captains are an integral part of each fire company in a way that battalion
chiefs are not. That is why many departments choose to recognize captains as a part of the firefighter
bargaining unit, marking the union/non-union break at the position of battalion chief.
Operational & Management Assessment Mountain View Fire Rescue
120
Unfortunately, the district has created an apparent double standard in response to the contradiction that
always occurs at the juncture between union and non-union. Supervisors at that dividing line who have to
work closely with both sides often struggle with divided feelings. The labor agreement contains a clause
forbidding treating anyone badly for deciding not to join the union. It is not unknown in the fire service for
some chief officers to maintain their membership in their former IAFF local until they retire. It is not a sign
of disloyalty to their employers. However, MVFR managers have adopted a policy prohibiting any captain
from maintaining his or her union membership. In other words, bargaining unit members can choose not to
join the union without fear of recrimination, but a non-bargaining unit member cannot choose to maintain
an affiliation with the IAFF without being in violation of department policy. This does not send a message of
respect and dignity to union leaders and the employees they represent.
It is within the scope of management’s rights and prerogatives to set the standards for promotions within
the department, but the combination of application prerequisites and anti-union animus have resulted in a
larger number of mid-level supervisors than usual to be hired from outside of MVFR. In the fire service this
can lead to alienation between line personnel and supervisory personnel. Again, stakeholder interviews
with managers and firefighters indicate that this problem exists at Mountain View Fire Rescue. By
considering the adoption of modified job requirements as a temporary response to the number of captain
and battalion chief vacancies that currently exist (at least three), the district may be able to fill these
vacancies while elevating line personnel who are able to demonstrate competence into positions where
they can help model a more cooperative attitude between line employees and managers.
RECOMMENDATIONS:
• Consider modifying mid-level supervisory position requirements in order to fill current vacancies with qualified and competent incumbent personnel.
• Reconsider the decision to exclude the captain position from the bargaining unit, basing any conclusion on rationale that promotes the mission of the organization.
• Withdraw any policy that prohibits employee participation in associations that do not bring negative attention to the organization.

Operational & Management Assessment Mountain View Fire Rescue
121
SUPPORT PROGRAMS
Training Program A comprehensive training program is one the most critical factors for helping to ensure the safe and
effective provision of emergency services. This is especially true of integrated organizations such as
Mountain View Fire Rescue, that provide a broad range services throughout the community. To ensure
maximum effectiveness and safety in complex environments, firefighters and officers must acquire and
maintain sufficient initial training, ongoing training, and continuing medical education (CME). Failure to
provide necessary training endangers firefighters and citizens, and exposes the fire department to liability.
In addition, a well-trained workforce substantially contributes to better emergency incident outcomes and
community services.
Newly hired firefighters must participate in probationary firefighting training. The National Fire Protection
Association—in its standard NFPA 1001 (Firefighter I and II)—identifies the minimum training requirements
that can serve as the basis for entry-level firefighters. The NFPA recommends other standards that address
initial and ongoing training for firefighters and officers in a variety of specific topics.
Following initial training, firefighters (i.e., all emergency services personnel) should actively participate in
ongoing training that includes testing and ensuring practical skills and knowledge is maintained. In Fire &
Emergency Service Self-Assessment Manual (8th edition), the Commission on Fire Accreditation
International (CFAI) addresses “Training and Competency,” and lists a number of performance indicators
under the headings of training and education program requirements, performance, and resources.
To accomplish this, emergency services organizations must have access to qualified instructors and training
resources—either within the organization, externally with regional partners, or both. Training programs
must go beyond simply fulfilling mandatory hours. Emergency services training administrators and
instructors must ensure that firefighters, EMS personnel, and officers are not only competent, but also self-
confident in the variety of skills necessary to perform effectively in high-stress situations.
In the following section, ESCI has reviewed the various training practices and resources of MVFR, compared
them to assorted standards and best practices, and made recommendations where indicated.
Training Division Responsibilities
The primary responsibilities of the MVFR Training Division are described as follows:
• Probationary Firefighter Training • Technical Rescue Training
• Advanced Firefighter Training • Wildland Firefighter Refresher Courses
• Firefighter Grade Promotions • Company Standards Training
• Officer Development Courses • Firefighter Safety and Survival
• Driver/Operator Certification Courses • Instructional Methodology for Fire Instructor I
• Hazardous Materials Training • Delivery & Development of Annual Training Plan

Operational & Management Assessment Mountain View Fire Rescue
122
Training Administration
ESCI evaluated the administrative functions, staffing, and resources of the MVFR Training Division. The
Division maintains a training calendar and develops an annual training plan. The following figure lists
several of the administrative components related to training.
Figure 101: MVFR Training Division Administrative Components
SURVEY COMPONENT MVFR INFORMATION
Director of Training Program One assistant chief and one battalion chief in division; a full-time captain is also assigned to the training division
Training goals & objectives identified? Annual training plan developed
Certified instructors used? (qualifications) Colorado State Fire Instructor certifications (all officers)
Annual training report produced? Yes
Priority by management toward training? Yes
Procedures manual developed & used? Yes; related to the annual training plan
Support assigned to training administration? Part-time administrative staff
Administrative & Clerical Support
The Mountain View Fire Rescue Training Division is overseen by a full-time assistant chief, with a
subordinate battalion chief. The division has one individual assigned part-time to provide administrative
support services.
Instructors & Instructor Requirements
All MVFR officers are required to be certified as a Colorado Fire Instructor I, in accordance with the
mandatory requirements of the Colorado Division of Fire Prevention & Control (CDFPC). The CDFPC
requirements are consistent with the NFPA Fire Instructor I standard (2012). MVFR has a number of subject
matter experts (SME) that are capable of conducting specific training topics.
Training Budget
MVFR maintains a current annual operating budget for training of $452,377 (2017), which includes staff
salaries and benefits. Within this budget, $85,000 has been allocated annually to attend training courses
and seminars. No reserve funds have been allocated for the Training Division.
Training Records & Recordkeeping
Training and continuing medical education records are maintained both electronically and on paper. The
Training Division is responsible for entering and maintaining class records, as well as individual records for
all personnel in the department. Officers, firefighters, and other staff are also accountable for maintaining
their individual training and continuing education records. The following figure lists information regarding
training records and recordkeeping.
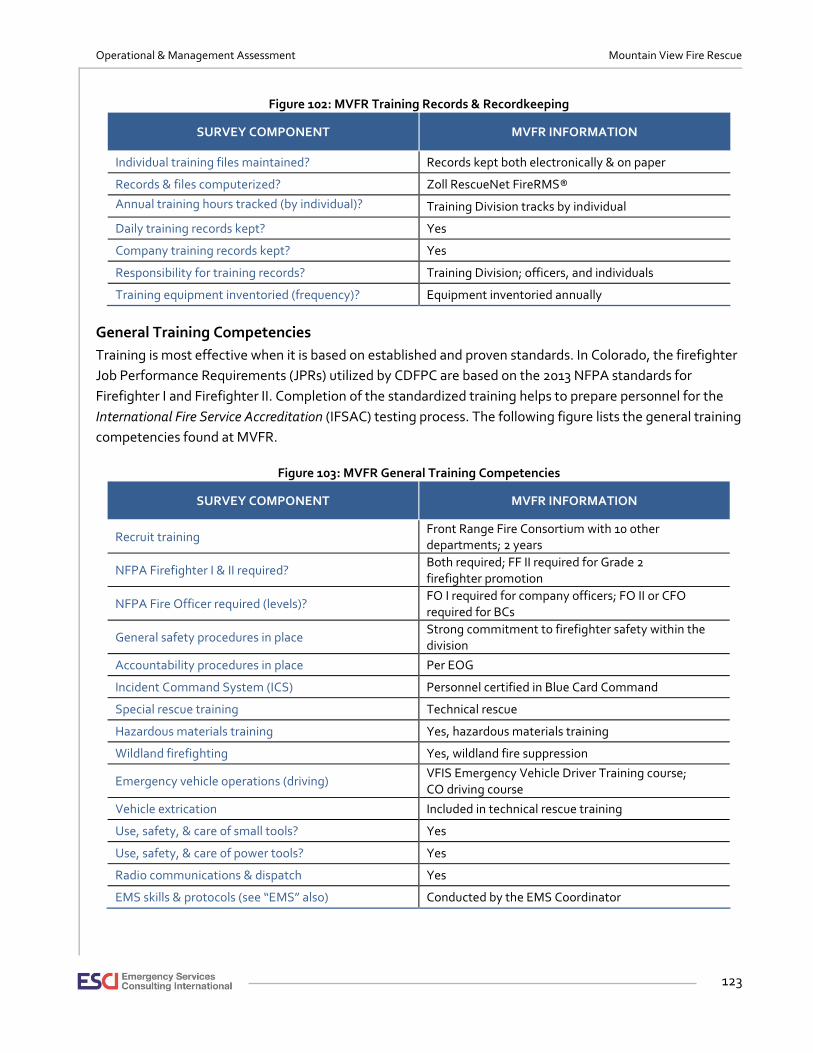
Operational & Management Assessment Mountain View Fire Rescue
123
Figure 102: MVFR Training Records & Recordkeeping
SURVEY COMPONENT MVFR INFORMATION
Individual training files maintained? Records kept both electronically & on paper
Records & files computerized? Zoll RescueNet FireRMS®
Annual training hours tracked (by individual)? Training Division tracks by individual
Daily training records kept? Yes
Company training records kept? Yes
Responsibility for training records? Training Division; officers, and individuals
Training equipment inventoried (frequency)? Equipment inventoried annually
General Training Competencies
Training is most effective when it is based on established and proven standards. In Colorado, the firefighter
Job Performance Requirements (JPRs) utilized by CDFPC are based on the 2013 NFPA standards for
Firefighter I and Firefighter II. Completion of the standardized training helps to prepare personnel for the
International Fire Service Accreditation (IFSAC) testing process. The following figure lists the general training
competencies found at MVFR.
Figure 103: MVFR General Training Competencies
SURVEY COMPONENT MVFR INFORMATION
Recruit training Front Range Fire Consortium with 10 other departments; 2 years
NFPA Firefighter I & II required? Both required; FF II required for Grade 2 firefighter promotion
NFPA Fire Officer required (levels)? FO I required for company officers; FO II or CFO required for BCs
General safety procedures in place Strong commitment to firefighter safety within the division
Accountability procedures in place Per EOG
Incident Command System (ICS) Personnel certified in Blue Card Command
Special rescue training Technical rescue
Hazardous materials training Yes, hazardous materials training
Wildland firefighting Yes, wildland fire suppression
Emergency vehicle operations (driving) VFIS Emergency Vehicle Driver Training course; CO driving course
Vehicle extrication Included in technical rescue training
Use, safety, & care of small tools? Yes
Use, safety, & care of power tools? Yes
Radio communications & dispatch Yes
EMS skills & protocols (see “EMS” also) Conducted by the EMS Coordinator
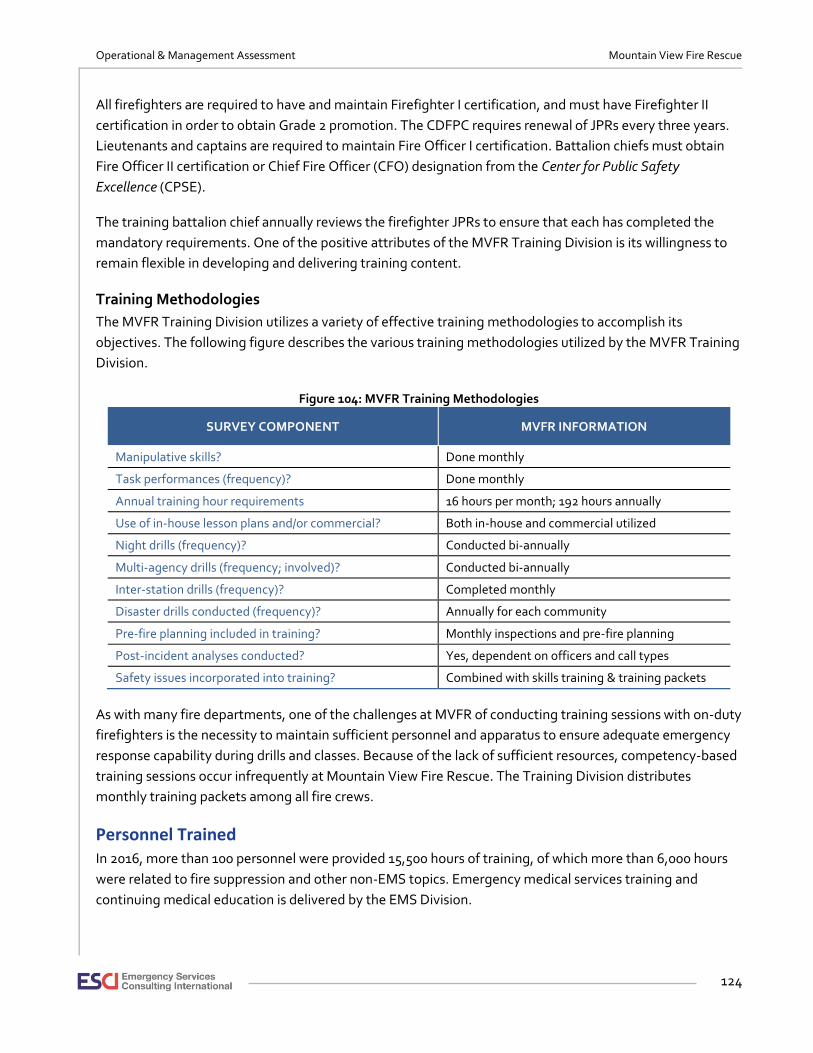
Operational & Management Assessment Mountain View Fire Rescue
124
All firefighters are required to have and maintain Firefighter I certification, and must have Firefighter II
certification in order to obtain Grade 2 promotion. The CDFPC requires renewal of JPRs every three years.
Lieutenants and captains are required to maintain Fire Officer I certification. Battalion chiefs must obtain
Fire Officer II certification or Chief Fire Officer (CFO) designation from the Center for Public Safety
Excellence (CPSE).
The training battalion chief annually reviews the firefighter JPRs to ensure that each has completed the
mandatory requirements. One of the positive attributes of the MVFR Training Division is its willingness to
remain flexible in developing and delivering training content.
Training Methodologies
The MVFR Training Division utilizes a variety of effective training methodologies to accomplish its
objectives. The following figure describes the various training methodologies utilized by the MVFR Training
Division.
Figure 104: MVFR Training Methodologies
SURVEY COMPONENT MVFR INFORMATION
Manipulative skills? Done monthly
Task performances (frequency)? Done monthly
Annual training hour requirements 16 hours per month; 192 hours annually
Use of in-house lesson plans and/or commercial? Both in-house and commercial utilized
Night drills (frequency)? Conducted bi-annually
Multi-agency drills (frequency; involved)? Conducted bi-annually
Inter-station drills (frequency)? Completed monthly
Disaster drills conducted (frequency)? Annually for each community
Pre-fire planning included in training? Monthly inspections and pre-fire planning
Post-incident analyses conducted? Yes, dependent on officers and call types
Safety issues incorporated into training? Combined with skills training & training packets
As with many fire departments, one of the challenges at MVFR of conducting training sessions with on-duty
firefighters is the necessity to maintain sufficient personnel and apparatus to ensure adequate emergency
response capability during drills and classes. Because of the lack of sufficient resources, competency-based
training sessions occur infrequently at Mountain View Fire Rescue. The Training Division distributes
monthly training packets among all fire crews.
Personnel Trained In 2016, more than 100 personnel were provided 15,500 hours of training, of which more than 6,000 hours
were related to fire suppression and other non-EMS topics. Emergency medical services training and
continuing medical education is delivered by the EMS Division.
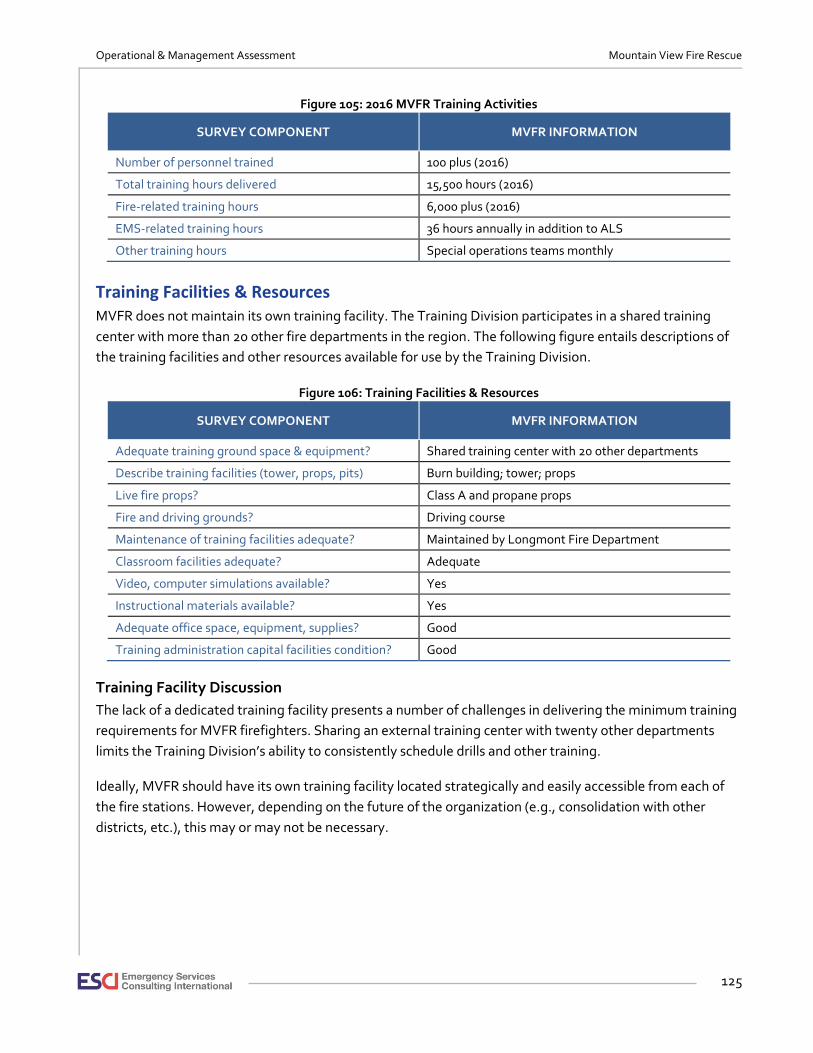
Operational & Management Assessment Mountain View Fire Rescue
125
Figure 105: 2016 MVFR Training Activities
SURVEY COMPONENT MVFR INFORMATION
Number of personnel trained 100 plus (2016)
Total training hours delivered 15,500 hours (2016)
Fire-related training hours 6,000 plus (2016)
EMS-related training hours 36 hours annually in addition to ALS
Other training hours Special operations teams monthly
Training Facilities & Resources MVFR does not maintain its own training facility. The Training Division participates in a shared training
center with more than 20 other fire departments in the region. The following figure entails descriptions of
the training facilities and other resources available for use by the Training Division.
Figure 106: Training Facilities & Resources
SURVEY COMPONENT MVFR INFORMATION
Adequate training ground space & equipment? Shared training center with 20 other departments
Describe training facilities (tower, props, pits) Burn building; tower; props
Live fire props? Class A and propane props
Fire and driving grounds? Driving course
Maintenance of training facilities adequate? Maintained by Longmont Fire Department
Classroom facilities adequate? Adequate
Video, computer simulations available? Yes
Instructional materials available? Yes
Adequate office space, equipment, supplies? Good
Training administration capital facilities condition? Good
Training Facility Discussion
The lack of a dedicated training facility presents a number of challenges in delivering the minimum training
requirements for MVFR firefighters. Sharing an external training center with twenty other departments
limits the Training Division’s ability to consistently schedule drills and other training.
Ideally, MVFR should have its own training facility located strategically and easily accessible from each of
the fire stations. However, depending on the future of the organization (e.g., consolidation with other
districts, etc.), this may or may not be necessary.
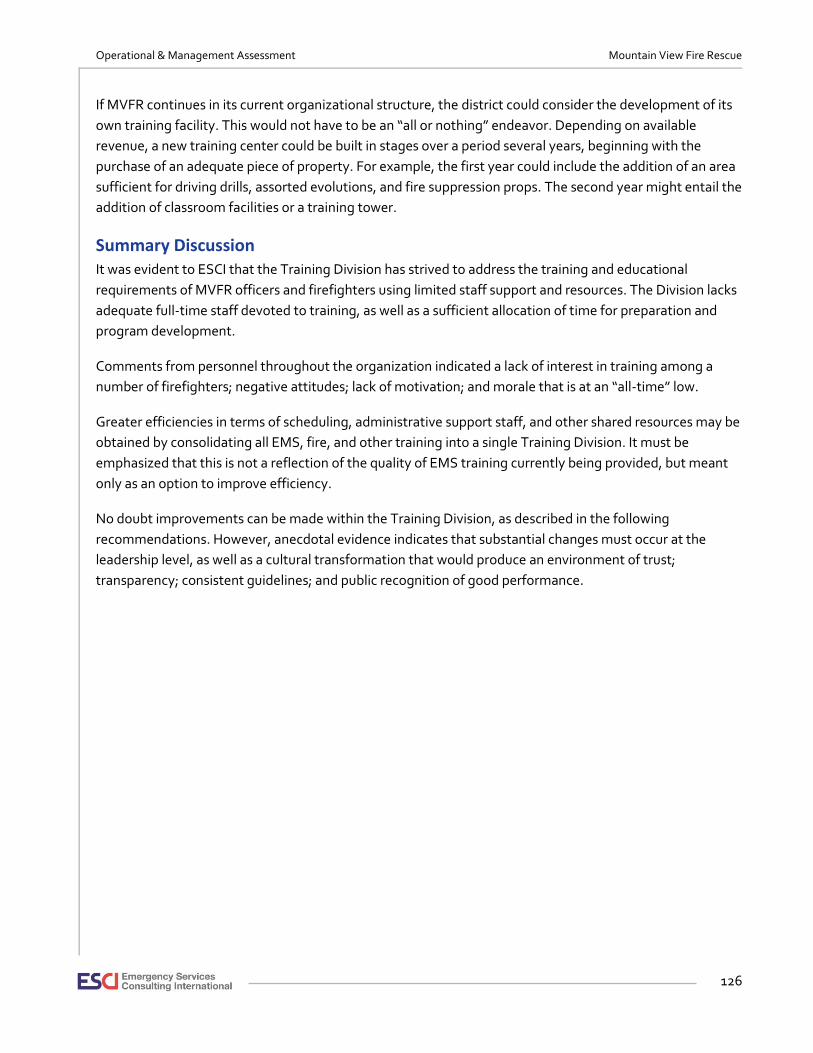
Operational & Management Assessment Mountain View Fire Rescue
126
If MVFR continues in its current organizational structure, the district could consider the development of its
own training facility. This would not have to be an “all or nothing” endeavor. Depending on available
revenue, a new training center could be built in stages over a period several years, beginning with the
purchase of an adequate piece of property. For example, the first year could include the addition of an area
sufficient for driving drills, assorted evolutions, and fire suppression props. The second year might entail the
addition of classroom facilities or a training tower.
Summary Discussion It was evident to ESCI that the Training Division has strived to address the training and educational
requirements of MVFR officers and firefighters using limited staff support and resources. The Division lacks
adequate full-time staff devoted to training, as well as a sufficient allocation of time for preparation and
program development.
Comments from personnel throughout the organization indicated a lack of interest in training among a
number of firefighters; negative attitudes; lack of motivation; and morale that is at an “all-time” low.
Greater efficiencies in terms of scheduling, administrative support staff, and other shared resources may be
obtained by consolidating all EMS, fire, and other training into a single Training Division. It must be
emphasized that this is not a reflection of the quality of EMS training currently being provided, but meant
only as an option to improve efficiency.
No doubt improvements can be made within the Training Division, as described in the following
recommendations. However, anecdotal evidence indicates that substantial changes must occur at the
leadership level, as well as a cultural transformation that would produce an environment of trust;
transparency; consistent guidelines; and public recognition of good performance.
Operational & Management Assessment Mountain View Fire Rescue
127
RECOMMENDATIONS:
• Add qualified instructors/training staff to the Training Division.
▪ Recruit individuals (internally and/or externally) who have a genuine passion for training, along with the necessary education and experience to perform well.
▪ Avoid recruiting individuals who desire a temporary assignment to the division as a means of improving their opportunity for promotion.
• The part-time administrative support staff should be assigned full-time to the Training Division.
• Institute web-based, online training management software that includes, at a minimum, courses for Firefighter I and II, and Company Officer (e.g., TargetSolutions™).
• Develop collaborative training opportunities with other agencies, through shared instructors and costs, and joint training sessions.
• Consider consolidating fire, EMS, and other training into the Training Division (so long as sufficient staff is assigned to the division).
• Depending on the future of the district and availability of revenue, consider purchasing property in a strategic location, which could be utilized to build a future training center.
▪ Whether built in stages or all at once, MVFR should develop a comprehensive plan to identify priorities and future training needs that should be incorporated into a training facility.

Operational & Management Assessment Mountain View Fire Rescue
128
PREVENTION & LIFE-SAFETY SERVICES
According to MVFR staff, the group of individuals responsible for prevention, life safety, fire investigations,
and public education, do not have a formal name for the “division.” For the purposes of this section of
ESCI’s report, this group will be referred to as the “Fire Prevention Division” (FPD).
A comprehensive prevention and life-safety services program enables a fire department to minimize life
and property loss and injuries associated with fires and other events. The essential components of a fire
prevention program are described in the following figure:
Figure 107: Fire Prevention Program Components
FIRE PREVENTION PROGRAM COMPONENTS PROGRAM ELEMENTS
Fire Code Enforcement • Proposed construction & plans review
• New construction inspections
• Existing structure/occupancy inspections
• Internal protection systems design review
• Storage and handling of hazardous materials
Public Fire & Life-Safety Education • Public education • Specialized education • Juvenile fire setter intervention • Prevention information dissemination
Fire Cause Investigation • Fire cause and origin determination • Fire death investigation • Arson investigation & prosecution
Organizational Structure In the organizational chart provided by MVFR and dated January 31, 2017, personnel responsible for these
activities are overseen by a recently hired deputy fire marshal (DFM).
The fire marshal (FM), who is a half-time employee, is supervised by the DFM. According to staff, the DFM
will eventually be given the title of fire marshal. Currently, the fire marshal’s primary activities involve plans
review for new construction.
Within this group is a part-time fire investigator. The organizational chart refers to this position as the
“Investigator Coordinator.” However, this position has previously been known as the “Chief Investigator”
since June 2016, and responsible for fire investigations. The position has two subordinate part-time
investigators—one paid and one who serves as a volunteer. According to MVFR staff, the deputy fire
marshal will temporarily report to the chief investigator until such time as the DFM is formally appointed as
the fire marshal. At that point, the chief investigator will be subordinate to the FM.
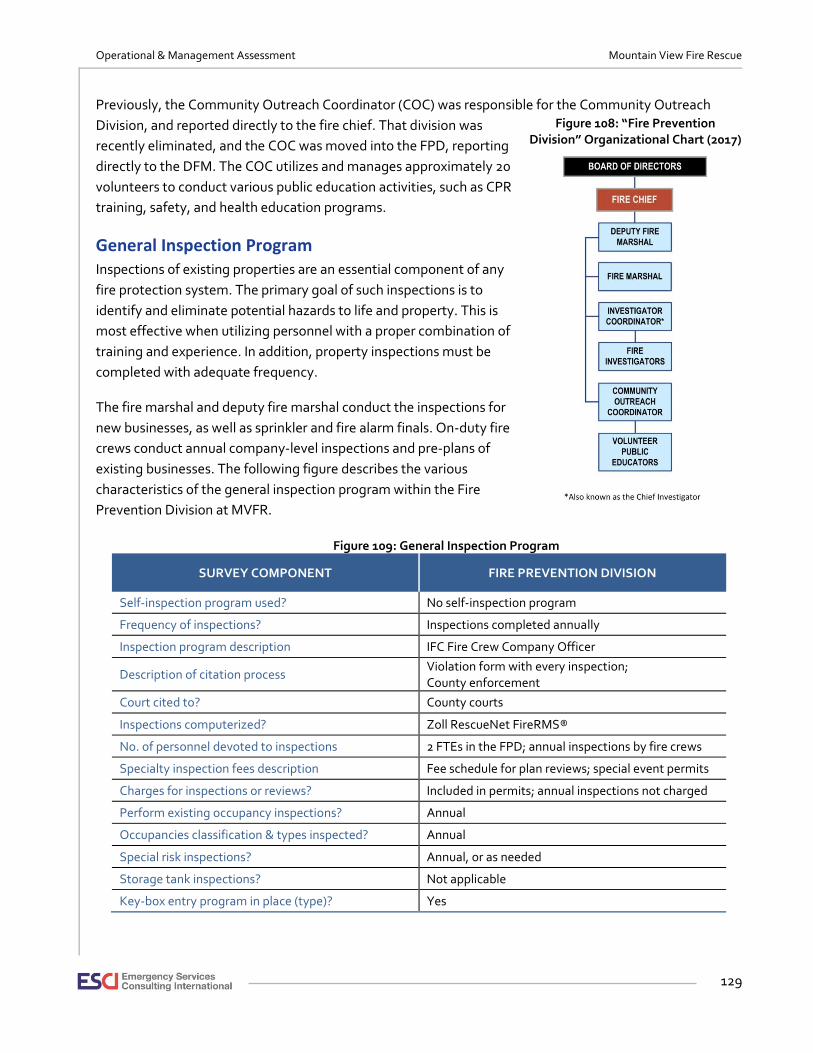
Operational & Management Assessment Mountain View Fire Rescue
129
Previously, the Community Outreach Coordinator (COC) was responsible for the Community Outreach
Division, and reported directly to the fire chief. That division was
recently eliminated, and the COC was moved into the FPD, reporting
directly to the DFM. The COC utilizes and manages approximately 20
volunteers to conduct various public education activities, such as CPR
training, safety, and health education programs.
General Inspection Program Inspections of existing properties are an essential component of any
fire protection system. The primary goal of such inspections is to
identify and eliminate potential hazards to life and property. This is
most effective when utilizing personnel with a proper combination of
training and experience. In addition, property inspections must be
completed with adequate frequency.
The fire marshal and deputy fire marshal conduct the inspections for
new businesses, as well as sprinkler and fire alarm finals. On-duty fire
crews conduct annual company-level inspections and pre-plans of
existing businesses. The following figure describes the various
characteristics of the general inspection program within the Fire
Prevention Division at MVFR.
Figure 109: General Inspection Program
SURVEY COMPONENT FIRE PREVENTION DIVISION
Self-inspection program used? No self-inspection program
Frequency of inspections? Inspections completed annually
Inspection program description IFC Fire Crew Company Officer
Description of citation process Violation form with every inspection; County enforcement
Court cited to? County courts
Inspections computerized? Zoll RescueNet FireRMS®
No. of personnel devoted to inspections 2 FTEs in the FPD; annual inspections by fire crews
Specialty inspection fees description Fee schedule for plan reviews; special event permits
Charges for inspections or reviews? Included in permits; annual inspections not charged
Perform existing occupancy inspections? Annual
Occupancies classification & types inspected? Annual
Special risk inspections? Annual, or as needed
Storage tank inspections? Not applicable
Key-box entry program in place (type)? Yes
Figure 108: “Fire Prevention Division” Organizational Chart (2017)
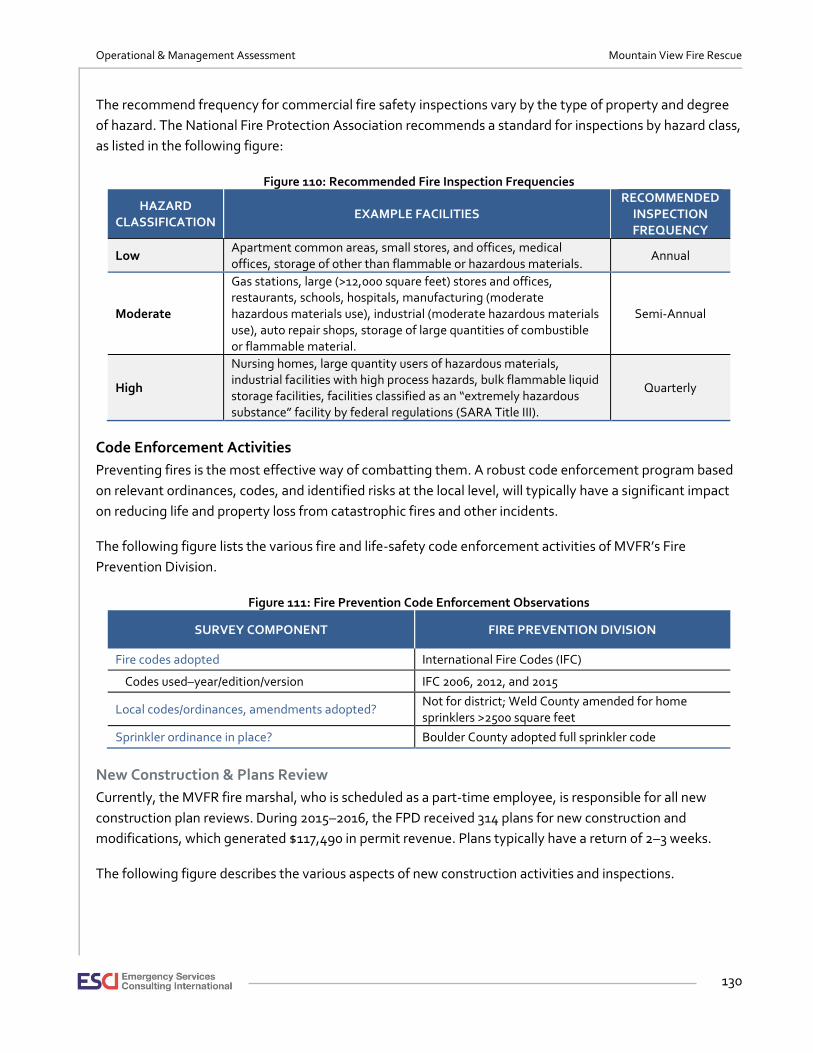
Operational & Management Assessment Mountain View Fire Rescue
130
The recommend frequency for commercial fire safety inspections vary by the type of property and degree
of hazard. The National Fire Protection Association recommends a standard for inspections by hazard class,
as listed in the following figure:
Figure 110: Recommended Fire Inspection Frequencies
HAZARD CLASSIFICATION
EXAMPLE FACILITIES RECOMMENDED
INSPECTION FREQUENCY
Low Apartment common areas, small stores, and offices, medical offices, storage of other than flammable or hazardous materials.
Annual
Moderate
Gas stations, large (>12,000 square feet) stores and offices, restaurants, schools, hospitals, manufacturing (moderate hazardous materials use), industrial (moderate hazardous materials use), auto repair shops, storage of large quantities of combustible or flammable material.
Semi-Annual
High
Nursing homes, large quantity users of hazardous materials, industrial facilities with high process hazards, bulk flammable liquid storage facilities, facilities classified as an “extremely hazardous substance” facility by federal regulations (SARA Title III).
Quarterly
Code Enforcement Activities
Preventing fires is the most effective way of combatting them. A robust code enforcement program based
on relevant ordinances, codes, and identified risks at the local level, will typically have a significant impact
on reducing life and property loss from catastrophic fires and other incidents.
The following figure lists the various fire and life-safety code enforcement activities of MVFR’s Fire
Prevention Division.
Figure 111: Fire Prevention Code Enforcement Observations
SURVEY COMPONENT FIRE PREVENTION DIVISION
Fire codes adopted International Fire Codes (IFC)
Codes used–year/edition/version IFC 2006, 2012, and 2015
Local codes/ordinances, amendments adopted? Not for district; Weld County amended for home sprinklers >2500 square feet
Sprinkler ordinance in place? Boulder County adopted full sprinkler code
New Construction & Plans Review
Currently, the MVFR fire marshal, who is scheduled as a part-time employee, is responsible for all new
construction plan reviews. During 2015–2016, the FPD received 314 plans for new construction and
modifications, which generated $117,490 in permit revenue. Plans typically have a return of 2–3 weeks.
The following figure describes the various aspects of new construction activities and inspections.
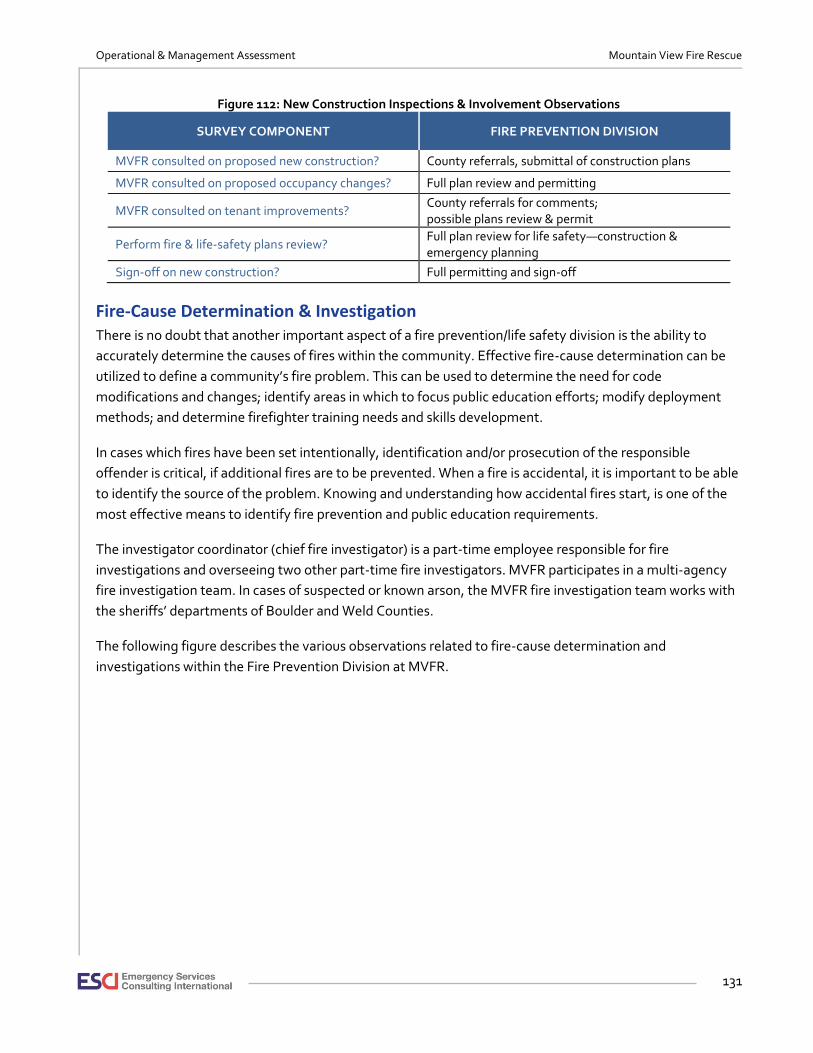
Operational & Management Assessment Mountain View Fire Rescue
131
Figure 112: New Construction Inspections & Involvement Observations
SURVEY COMPONENT FIRE PREVENTION DIVISION
MVFR consulted on proposed new construction? County referrals, submittal of construction plans
MVFR consulted on proposed occupancy changes? Full plan review and permitting
MVFR consulted on tenant improvements? County referrals for comments; possible plans review & permit
Perform fire & life-safety plans review? Full plan review for life safety—construction & emergency planning
Sign-off on new construction? Full permitting and sign-off
Fire-Cause Determination & Investigation There is no doubt that another important aspect of a fire prevention/life safety division is the ability to
accurately determine the causes of fires within the community. Effective fire-cause determination can be
utilized to define a community’s fire problem. This can be used to determine the need for code
modifications and changes; identify areas in which to focus public education efforts; modify deployment
methods; and determine firefighter training needs and skills development.
In cases which fires have been set intentionally, identification and/or prosecution of the responsible
offender is critical, if additional fires are to be prevented. When a fire is accidental, it is important to be able
to identify the source of the problem. Knowing and understanding how accidental fires start, is one of the
most effective means to identify fire prevention and public education requirements.
The investigator coordinator (chief fire investigator) is a part-time employee responsible for fire
investigations and overseeing two other part-time fire investigators. MVFR participates in a multi-agency
fire investigation team. In cases of suspected or known arson, the MVFR fire investigation team works with
the sheriffs’ departments of Boulder and Weld Counties.
The following figure describes the various observations related to fire-cause determination and
investigations within the Fire Prevention Division at MVFR.
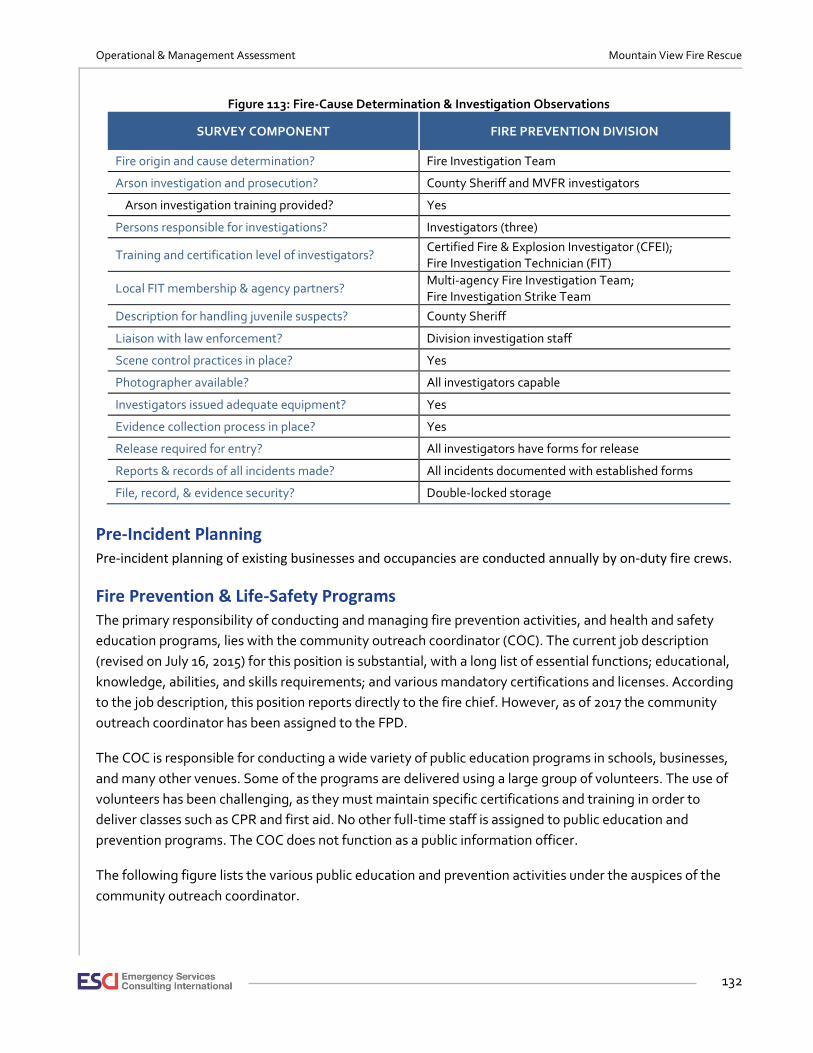
Operational & Management Assessment Mountain View Fire Rescue
132
Figure 113: Fire-Cause Determination & Investigation Observations
SURVEY COMPONENT FIRE PREVENTION DIVISION
Fire origin and cause determination? Fire Investigation Team
Arson investigation and prosecution? County Sheriff and MVFR investigators
Arson investigation training provided? Yes
Persons responsible for investigations? Investigators (three)
Training and certification level of investigators? Certified Fire & Explosion Investigator (CFEI); Fire Investigation Technician (FIT)
Local FIT membership & agency partners? Multi-agency Fire Investigation Team; Fire Investigation Strike Team
Description for handling juvenile suspects? County Sheriff
Liaison with law enforcement? Division investigation staff
Scene control practices in place? Yes
Photographer available? All investigators capable
Investigators issued adequate equipment? Yes
Evidence collection process in place? Yes
Release required for entry? All investigators have forms for release
Reports & records of all incidents made? All incidents documented with established forms
File, record, & evidence security? Double-locked storage
Pre-Incident Planning Pre-incident planning of existing businesses and occupancies are conducted annually by on-duty fire crews.
Fire Prevention & Life-Safety Programs The primary responsibility of conducting and managing fire prevention activities, and health and safety
education programs, lies with the community outreach coordinator (COC). The current job description
(revised on July 16, 2015) for this position is substantial, with a long list of essential functions; educational,
knowledge, abilities, and skills requirements; and various mandatory certifications and licenses. According
to the job description, this position reports directly to the fire chief. However, as of 2017 the community
outreach coordinator has been assigned to the FPD.
The COC is responsible for conducting a wide variety of public education programs in schools, businesses,
and many other venues. Some of the programs are delivered using a large group of volunteers. The use of
volunteers has been challenging, as they must maintain specific certifications and training in order to
deliver classes such as CPR and first aid. No other full-time staff is assigned to public education and
prevention programs. The COC does not function as a public information officer.
The following figure lists the various public education and prevention activities under the auspices of the
community outreach coordinator.
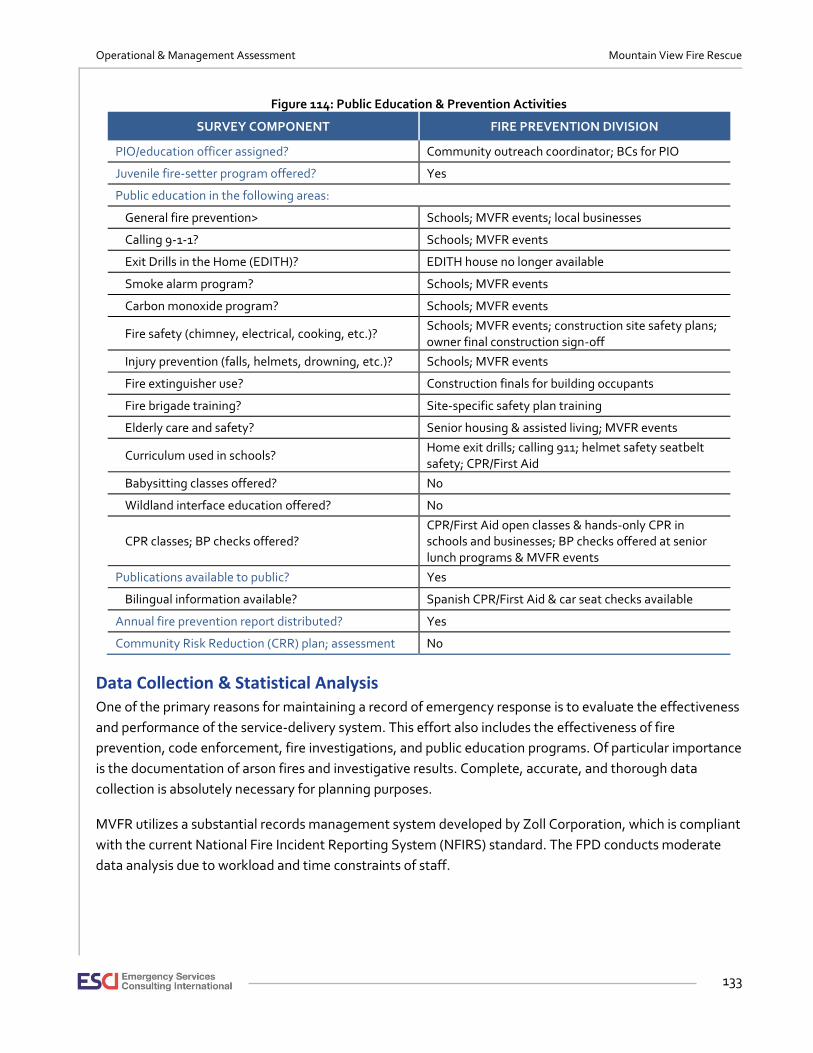
Operational & Management Assessment Mountain View Fire Rescue
133
Figure 114: Public Education & Prevention Activities
SURVEY COMPONENT FIRE PREVENTION DIVISION
PIO/education officer assigned? Community outreach coordinator; BCs for PIO
Juvenile fire-setter program offered? Yes
Public education in the following areas:
General fire prevention> Schools; MVFR events; local businesses
Calling 9-1-1? Schools; MVFR events
Exit Drills in the Home (EDITH)? EDITH house no longer available
Smoke alarm program? Schools; MVFR events
Carbon monoxide program? Schools; MVFR events
Fire safety (chimney, electrical, cooking, etc.)? Schools; MVFR events; construction site safety plans; owner final construction sign-off
Injury prevention (falls, helmets, drowning, etc.)? Schools; MVFR events
Fire extinguisher use? Construction finals for building occupants
Fire brigade training? Site-specific safety plan training
Elderly care and safety? Senior housing & assisted living; MVFR events
Curriculum used in schools? Home exit drills; calling 911; helmet safety seatbelt safety; CPR/First Aid
Babysitting classes offered? No
Wildland interface education offered? No
CPR classes; BP checks offered? CPR/First Aid open classes & hands-only CPR in schools and businesses; BP checks offered at senior lunch programs & MVFR events
Publications available to public? Yes
Bilingual information available? Spanish CPR/First Aid & car seat checks available
Annual fire prevention report distributed? Yes
Community Risk Reduction (CRR) plan; assessment No
Data Collection & Statistical Analysis One of the primary reasons for maintaining a record of emergency response is to evaluate the effectiveness
and performance of the service-delivery system. This effort also includes the effectiveness of fire
prevention, code enforcement, fire investigations, and public education programs. Of particular importance
is the documentation of arson fires and investigative results. Complete, accurate, and thorough data
collection is absolutely necessary for planning purposes.
MVFR utilizes a substantial records management system developed by Zoll Corporation, which is compliant
with the current National Fire Incident Reporting System (NFIRS) standard. The FPD conducts moderate
data analysis due to workload and time constraints of staff.
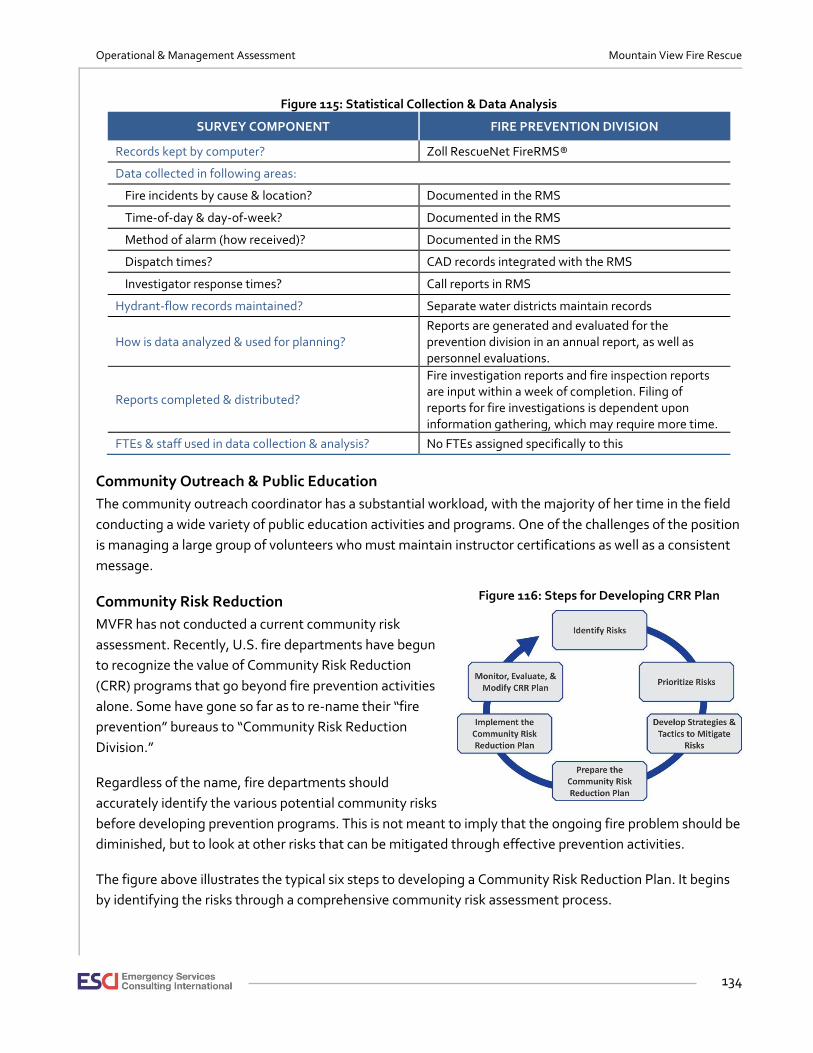
Operational & Management Assessment Mountain View Fire Rescue
134
Figure 115: Statistical Collection & Data Analysis
SURVEY COMPONENT FIRE PREVENTION DIVISION
Records kept by computer? Zoll RescueNet FireRMS®
Data collected in following areas:
Fire incidents by cause & location? Documented in the RMS
Time-of-day & day-of-week? Documented in the RMS
Method of alarm (how received)? Documented in the RMS
Dispatch times? CAD records integrated with the RMS
Investigator response times? Call reports in RMS
Hydrant-flow records maintained? Separate water districts maintain records
How is data analyzed & used for planning? Reports are generated and evaluated for the prevention division in an annual report, as well as personnel evaluations.
Reports completed & distributed?
Fire investigation reports and fire inspection reports are input within a week of completion. Filing of reports for fire investigations is dependent upon information gathering, which may require more time.
FTEs & staff used in data collection & analysis? No FTEs assigned specifically to this
Community Outreach & Public Education
The community outreach coordinator has a substantial workload, with the majority of her time in the field
conducting a wide variety of public education activities and programs. One of the challenges of the position
is managing a large group of volunteers who must maintain instructor certifications as well as a consistent
message.
Community Risk Reduction
MVFR has not conducted a current community risk
assessment. Recently, U.S. fire departments have begun
to recognize the value of Community Risk Reduction
(CRR) programs that go beyond fire prevention activities
alone. Some have gone so far as to re-name their “fire
prevention” bureaus to “Community Risk Reduction
Division.”
Regardless of the name, fire departments should
accurately identify the various potential community risks
before developing prevention programs. This is not meant to imply that the ongoing fire problem should be
diminished, but to look at other risks that can be mitigated through effective prevention activities.
The figure above illustrates the typical six steps to developing a Community Risk Reduction Plan. It begins
by identifying the risks through a comprehensive community risk assessment process.
Figure 116: Steps for Developing CRR Plan
Operational & Management Assessment Mountain View Fire Rescue
135
Discussion
Several of the staff expressed frustration regarding the lack of a formal name for their “division,” as well as
confusion as to where they fit within the chain of command. There was consistency among the group
concerning a lack of direction and leadership within the department overall. With the appointment of a new
deputy fire marshal, who will eventually become the fire marshal, ESCI anticipates that the leadership and
organizational activities will begin to improve.
The threat of potential annexation of large areas of the district may substantially reduce the demand on the
Fire Prevention Division for inspections, code enforcement, and other activities. MFVR will need to re-
evaluate the role of the FPD and its staffing, should this occur. On the other hand, if MVFR eventually
merges with another fire district, a stronger role with additional staffing may need to be considered.
Finally, it must be noted that it was ESCI’s impression from multiple interviews and other sources, that the
district staff have a sincere desire and dedication to perform their responsibilities effectively and efficiently,
and that they genuinely care about the success of MVFR. Some expressed that they are paid well, and that
the full-time staff receive excellent benefits.
RECOMMENDATIONS:
• MVFR should create a division, with a formal name, for those positions within the organization that perform the typical activities found in other fire departments with fire prevention divisions.
• The deputy fire marshal should be immediately promoted to the position of fire marshal, with a clearly defined job description and the responsibility of organizing and overseeing the FPD.
• The roles and responsibilities of each staff member, and their position within the division, and titles should be clearly defined through written guidelines.
• The Fire Prevention Division may be understaffed in its ability to perform general inspection activities. MVFR should consider adding sufficient personnel to accomplish minimum inspection requirements and code enforcement.
• MVFR should consider training and appointing one fire investigator assigned to each shift.
• Consider beginning the process of developing a CRR Plan by conducting a comprehensive community risk assessment.
▪ FPD staffing needs should be driven by the results of the community risk assessment.
• Based on the results of the community risk assessment, the community outreach coordinator should conduct programs and activities that address those risks that have been prioritized for mitigation.
▪ Depending on the results of a community risk assessment, MVFR should consider the potential of adding 1–2 FTEs.
▪ There may be some value in assigning the COC the duties of a PIO during major incidents.
Operational & Management Assessment Mountain View Fire Rescue
136
EMERGENCY MEDICAL SERVICES
Mountain View Fire Rescue is an example of a fire department that is uniquely positioned to respond rapidly
to time-critical events. Having medically trained personnel responding from fire stations shortens the time
between a life-threatening medical event and fire department intervention. This has proven to save lives.
From a fiscal perspective, fire-based Emergency Medical Services (EMS) systems with cross-trained/dual-
role firefighters allow the department to provide a broader range of services to its residents. Since
firefighters are already at the scene of an emergency and providing care, it is logical that they provide
ambulance transport to an appropriate healthcare facility. For area taxpayers, it is more fiscally
advantageous to have a single, publicly owned provider versus paying for two service-providers—one of
which is privately owned and profit-based.
Other advantages to a fire-service delivery model are the greater depth of resources. A fire department
with numerous fire stations and trained personnel can usually provide more personnel than a private
company. Fire service members historically have greater service longevity than private agencies, which
translates to more experienced personnel at the scene. Overall, the participation of the fire service in the
delivery of EMS has contributed positively in reducing death and long-term disability among victims of
sudden illness and injury in the prehospital (or out-of-facility) environment.
The goal of high-performance EMS systems is to deliver high quality, patient-centered care that produces
the best outcomes for its patients. In order to accomplish this most effectively, EMS must include a number
of inter-dependent components that comprise an emergency medical services delivery system. Each
element of a comprehensive and effective EMS system contributes to the outcome of ill and injured
patients. In addition, for optimal EMS delivery, the system should also be integrated within a community’s
overall healthcare system. Having a single provider overseeing the management of these services creates a
more nimble and flexible system to implement data-driven changes for improvements.
NFPA 450, Guide for Emergency Medical Services & Systems (2017) is a consensus document prepared by the
Technical Committee on Emergency Medical Services. This document serves as a comprehensive guide to
addressing the multiple components of EMS systems, and will be utilized where applicable throughout this
section of the report. In addition, current EMS standards from the Commission on Fire Accreditation
International will be referenced.
The MVFR EMS Delivery System As typically found in most communities, the emergency medical services delivery system in the Mountain
View Fire Rescue district is comprised of multiple components. MVFR provides medical first-response
(MFR) at a minimum of the BLS level through deployment of engine companies, along with advanced life
support ground emergency medical transport (GEMT) with three rescue units—one of which is cross-staffed
with an engine.
Operational & Management Assessment Mountain View Fire Rescue
137
EMS Administration & Oversight EMS administration and operations is overseen by an assistant chief (AC), who also has responsibility for
other divisions and functions within the department. The AC has the overall span of control over the EMS
Division. The AC’s role primarily involves the budget; strategic planning; liaison to upper management; and
working with the medical director and other EMS Division staff.
The battalion chief of EMS is responsible for the daily activities related to the administrative elements of
EMS, which includes:
• Providing monthly continuing medical education (CME) to MVFR staff.
• EMS quality management, including the identification of EMS providers needing remediation and
track key performance indicators/benchmarks.
• Resolution of patient and hospital issues.
• Serves as the infection control officer.
• Maintains EMS certification records and assists personnel with certification/recertification process.
• Participates in the development of patient-care protocols and EMS-related standard operating
guidelines.
• Attends assorted intradepartmental meetings, and serves as liaison to MVFR battalion chiefs,
hospital administrations, and state-level organizations.
The EMS Division lacks sufficient administrative staff at the officer level. Currently, there is an EMS
education coordinator. However, as suggested in this report in the section on training, there may be
increased efficiencies in consolidating all training into the Training Division—as long as adequate staff is
assigned to that division.
Medical Control
The medical director is a board-certified emergency physician who enjoys an excellent reputation among
the firefighters and EMS Division staff. He has frequent interaction with MVFR EMS providers, is closely
involved with quality management, and does regular ride-alongs on the rescues. The medical director does
not have a formal job description within MVFR, but is obligated to meet Colorado rules and regulations
applicable to physicians serving as a medical director.
Off-line medical control is provided through written patient-care protocols approved by the medical
director. All operations personnel are provided with a copy, which are also available for download from a
website. On-line medical control is provided by the various hospitals in which patients are transported.
EMS Records Management & Data Collection
Patient-care records are entered into the RescueNet ePCR® (ZOLL Medical Corporation, Broomfield, CO)
records management system (RMS). The application is compliant with the NEMSIS, NFIRS, and HIPAA
requirements. Patient-refusals are documented as well. MVFR maintains a separate ZOLL application to
document fires and other non-EMS incidents.
Operational & Management Assessment Mountain View Fire Rescue
138
EMS Quality Management
Continuous quality improvement (CQI), total quality management (TQM), quality assurance (QA), and
quality management (QM) are terms often used interchangeably in emergency medical services.
Regardless of what term is used, it is a process intended to ensure both patient-care and EMS operational
standards are being met. For the purposes of this report, the term QM will be used.
A comprehensive clinical QM program should include three components: A retrospective review of patient
care reports after the fact; a concurrent real-time evaluation of patient care; and a prospective evaluation of
any activity that occurs prior to being assigned to an incident. QM can also include EMS operational
performance evaluations. A good clinical QM program tends to be non-threatening and non-punitive in
instances of genuine clinical errors, with the primary goal of achieving the best care possible.
The EMS Division, along with the medical director, is responsible for EMS quality management. A part-time
paramedic (without a specific job description) reviews electronic patient records (ePCR) and benchmark
cases, and provides feedback to individual firefighters. MVFR does not have an established EMS QM
committee to evaluate clinical and operational performance.
The division has recently established 14 separate benchmarks (sometimes referred to as key performance
indicators or KPIs), that are reviewed regularly, with results published and distributed throughout the
department. These include the following:
• Asthma • Non-traumatic chest pain • STEMI
• Cardiac arrest • Pain management • Stroke
• COPD • Patient refusal • Trauma BP <90 (bolus)
• Hypoglycemia • Pulmonary edema (CHF) • Trauma scene time
• Medical BP <90 (bolus) • Seizure
The part-time paramedic spot-checks patient-care reports for accuracy, and reviews 100 percent of all
patient-refusals of care and/or transport. The EMS Division tracks advanced and other clinical skills success-
rates by individual members in the ePCRs. When frequent EMS system users are identified, hospital
representatives are contacted to assist in addressing the patient’s needs.
EMS Operational Performance Standards
Mountain View Fire Rescue has not established EMS operational performance benchmarks, such as
turnout-times and emergency response times.
Patient Outcomes
Identification of patient outcomes is another key performance indicator for EMS systems. Determining if
the results of an agency’s interventions resulted in a positive impact (reductions in mortality and morbidity)
on its patients helps to identify the effectiveness of the EMS system. As found in many communities, MVFR
does not regularly track patient outcomes. To do so is challenging for most EMS organizations, but not
entirely impossible. Currently, the MVFR EMS Division only determines patient outcomes in questionable
cases. This is accomplished by contacting one of the EMS liaisons from the various local hospitals.
Operational & Management Assessment Mountain View Fire Rescue
139
EMS Equipment & Supplies
MVFR maintains adequate and state-of-the-art EMS capital equipment, disposable supplies, medications,
and durable equipment. The department owns eight relatively new (2014) ZOLL X Series® cardiac
monitor/defibrillators, and four ZOLL Automated External Defibrillators (AED). Rescues are equipped with
Stryker® Power-PRO stretchers.
Capital and durable medical equipment is maintained through contracts with the various manufacturers.
Inventory control is done through daily PAR list and the RTA Fleet Management Software application.
Scheduled (controlled) medications are kept in a locked cabinet on every apparatus. Replacement supplies
are kept in a locked refrigerator at every fire station.
Logistical Support
The EMS Division has a policy for maintaining and re-stocking EMS supplies and medications. When
necessary, the part-time paramedic re-stocks the supplies at each station.
Training & Continuing Medical Education
All EMS training and CME is delivered by the EMS Division. By all accounts, the division provides high-
quality EMS education. Additional opportunities for EMS training and continuing medical education are
acquired through distance learning programs and occasional EMS conference attendance.
Individual CME records are documented in an electronic RMS to ensure mandatory state and local
requirements are met for EMS recertification. New members participate in an EMS Field Training &
Evaluation Program (FTEP), utilizing four paramedics and five EMT Field Instructors. Instructors and
training/CME classes are monitored regularly for compliance to standards.
As discussed in the training section of this report, there may be benefits and improved efficiencies to
moving EMS training and CME into the Training Division—but not without caveats. That is, a full-time
individual should be appointed to the Training Division with the sole responsibility of EMS. This individual
should be supplemented by part-time internal and external (guest) instructors.
Engine & Rescue Deployment
Medical First Response
Three stations are staffed with a minimum of three career EMT-Basics deployed on engine companies.
They are dispatched to provide MFR basic life support (BLS) services in addition to the rescue units.
Stations 1, 4, 5, 6, 7, and 8 are staffed with career personnel, while no personnel are assigned to Stations 2
and 3.
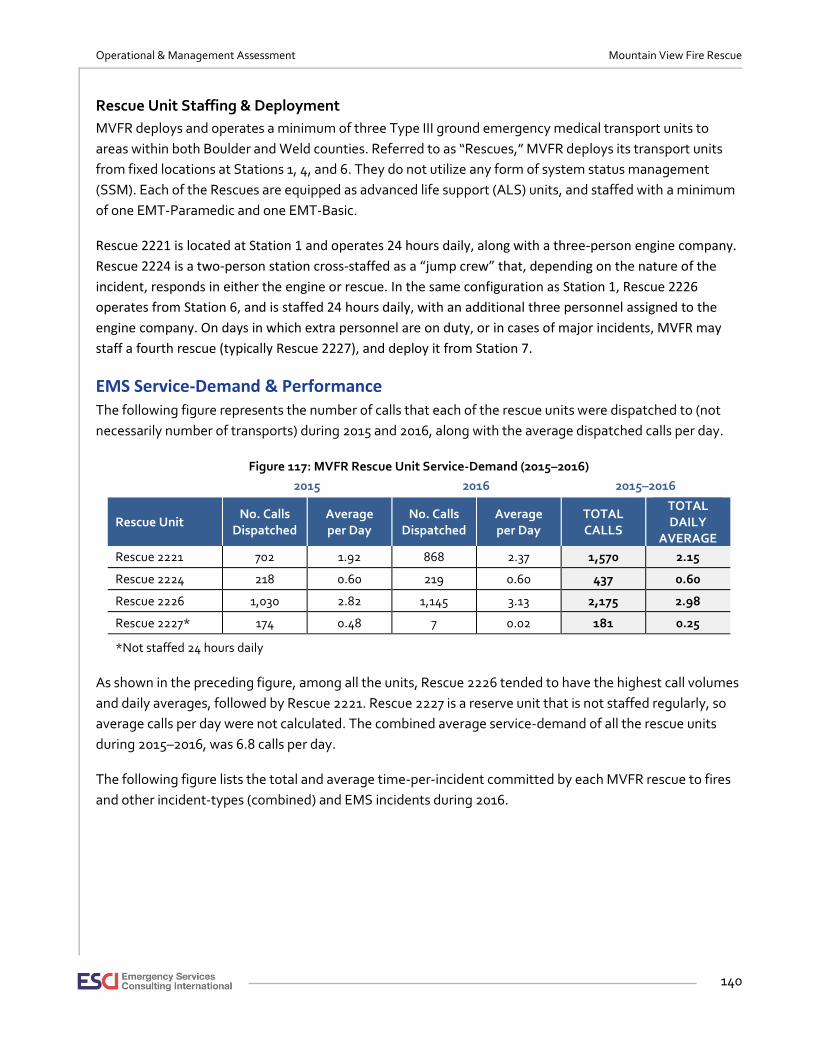
Operational & Management Assessment Mountain View Fire Rescue
140
Rescue Unit Staffing & Deployment
MVFR deploys and operates a minimum of three Type III ground emergency medical transport units to
areas within both Boulder and Weld counties. Referred to as “Rescues,” MVFR deploys its transport units
from fixed locations at Stations 1, 4, and 6. They do not utilize any form of system status management
(SSM). Each of the Rescues are equipped as advanced life support (ALS) units, and staffed with a minimum
of one EMT-Paramedic and one EMT-Basic.
Rescue 2221 is located at Station 1 and operates 24 hours daily, along with a three-person engine company.
Rescue 2224 is a two-person station cross-staffed as a “jump crew” that, depending on the nature of the
incident, responds in either the engine or rescue. In the same configuration as Station 1, Rescue 2226
operates from Station 6, and is staffed 24 hours daily, with an additional three personnel assigned to the
engine company. On days in which extra personnel are on duty, or in cases of major incidents, MVFR may
staff a fourth rescue (typically Rescue 2227), and deploy it from Station 7.
EMS Service-Demand & Performance The following figure represents the number of calls that each of the rescue units were dispatched to (not
necessarily number of transports) during 2015 and 2016, along with the average dispatched calls per day.
Figure 117: MVFR Rescue Unit Service-Demand (2015–2016)
2015 2016 2015–2016
Rescue Unit No. Calls
Dispatched Average per Day
No. Calls Dispatched
Average per Day
TOTAL CALLS
TOTAL DAILY
AVERAGE
Rescue 2221 702 1.92 868 2.37 1,570 2.15
Rescue 2224 218 0.60 219 0.60 437 0.60
Rescue 2226 1,030 2.82 1,145 3.13 2,175 2.98
Rescue 2227* 174 0.48 7 0.02 181 0.25
*Not staffed 24 hours daily
As shown in the preceding figure, among all the units, Rescue 2226 tended to have the highest call volumes
and daily averages, followed by Rescue 2221. Rescue 2227 is a reserve unit that is not staffed regularly, so
average calls per day were not calculated. The combined average service-demand of all the rescue units
during 2015–2016, was 6.8 calls per day.
The following figure lists the total and average time-per-incident committed by each MVFR rescue to fires
and other incident-types (combined) and EMS incidents during 2016.

Operational & Management Assessment Mountain View Fire Rescue
141
Figure 118: Time Committed to Incidents by Rescue Units (2016)
Fires & Other Incident Types EMS Incidents Only
Rescue Unit Total Time Committed
Average Time Committed
Total Time Committed
Average Time Committed
Rescue 2221 325:40 000:57 651:57 001:14
Rescue 2224 018:21 000:47 156:29 000:47
Rescue 2226 267:24 000:54 748:26 000:52
Rescue 2227* 013:00 004:20 004:25 001:06 *Not staffed 24 hours daily Time format: hhh:mm
As shown in the preceding figure, on fires and other incident-types, MVFR Rescues averaged less than an
hour. As expected, Rescues had substantially longer time-commitments on EMS incidents, with
Rescue 2221 having the highest average of 74 minutes per call. Rescue 2224 and Rescue 2226 averages
ranged from 22–27 minutes less than Rescue 2221.
Concurrent or simultaneous incidents can impact a department’s ability to assemble adequate resources to
respond to additional emergencies. The following figure demonstrates the percentage of time MVFR
Rescues were committed to more than one EMS incident during 2016, and 2015–2016 combined.
Figure 119: Concurrent EMS Incidents (2015 & 2016)
Concurrent EMS Incidents 2016 2015–2016 Combined
Single Incident 87% 88%
Two Incidents 12% 11%
Three Incidents 1% 1%
Four or more 0% 0%
As shown in the preceding figure, 87–88 percent of EMS service demand occurred as single incident in 2015
and 2016. More than two EMS incidents occurring simultaneously occurred rarely during that period. It is
important to note that these results represent EMS incidents only, and do not consider other non-EMS
incidents that may be occurring concurrently.
Unit-Hour Utilization
Unit hour utilization (UHU) is a calculation that measures productivity. Essentially, UHU measures the
percentage of on-duty time consumed by emergency operations. UHU is one of the most widely used and
often misunderstood performance-measurement metrics. A unit-hour (UH) is defined as one hour of service
by a fully equipped unit available for dispatch or assigned to a call. A 24-hour unit consumes 8,760 hours
annually. The four MVFR Rescue units, when staffed 24 hours daily, consume a total of 35,040 hours per
year (8,760 hours x 4 units).
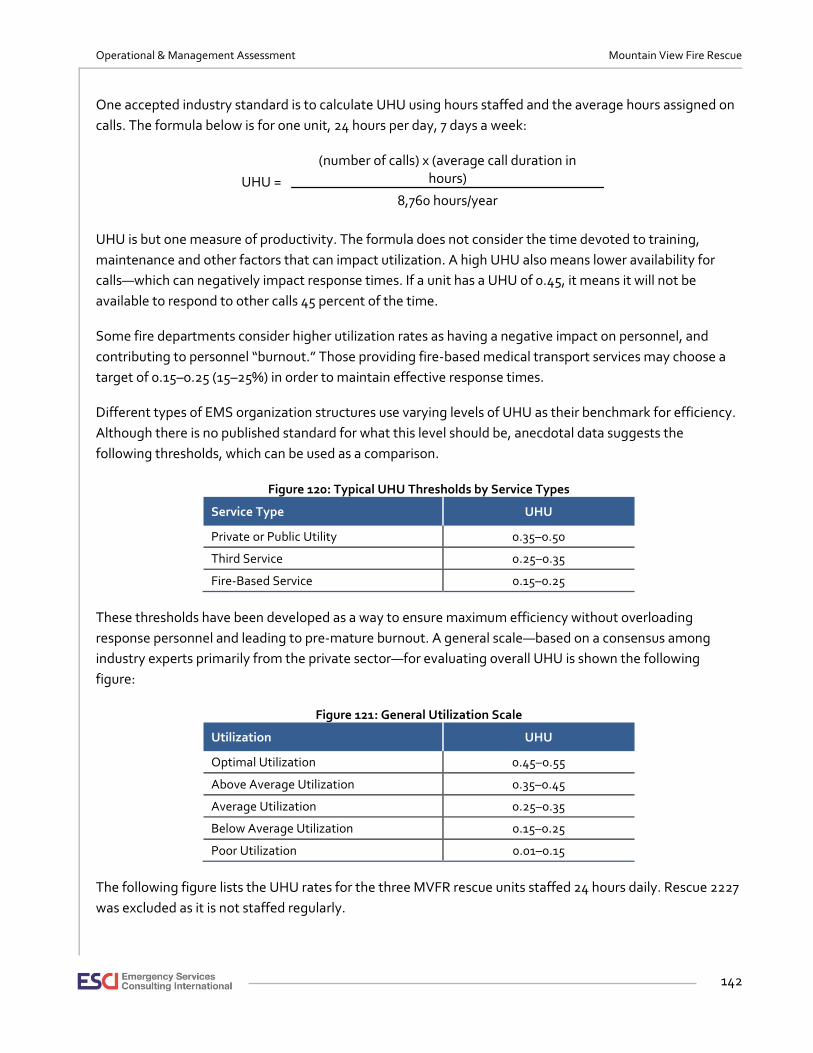
Operational & Management Assessment Mountain View Fire Rescue
142
One accepted industry standard is to calculate UHU using hours staffed and the average hours assigned on
calls. The formula below is for one unit, 24 hours per day, 7 days a week:
UHU =
(number of calls) x (average call duration in hours)
8,760 hours/year
UHU is but one measure of productivity. The formula does not consider the time devoted to training,
maintenance and other factors that can impact utilization. A high UHU also means lower availability for
calls—which can negatively impact response times. If a unit has a UHU of 0.45, it means it will not be
available to respond to other calls 45 percent of the time.
Some fire departments consider higher utilization rates as having a negative impact on personnel, and
contributing to personnel “burnout.” Those providing fire-based medical transport services may choose a
target of 0.15–0.25 (15–25%) in order to maintain effective response times.
Different types of EMS organization structures use varying levels of UHU as their benchmark for efficiency.
Although there is no published standard for what this level should be, anecdotal data suggests the
following thresholds, which can be used as a comparison.
Figure 120: Typical UHU Thresholds by Service Types
Service Type UHU
Private or Public Utility 0.35–0.50
Third Service 0.25–0.35
Fire-Based Service 0.15–0.25
These thresholds have been developed as a way to ensure maximum efficiency without overloading
response personnel and leading to pre-mature burnout. A general scale—based on a consensus among
industry experts primarily from the private sector—for evaluating overall UHU is shown the following
figure:
Figure 121: General Utilization Scale
Utilization UHU
Optimal Utilization 0.45–0.55
Above Average Utilization 0.35–0.45
Average Utilization 0.25–0.35
Below Average Utilization 0.15–0.25
Poor Utilization 0.01–0.15
The following figure lists the UHU rates for the three MVFR rescue units staffed 24 hours daily. Rescue 2227
was excluded as it is not staffed regularly.

Operational & Management Assessment Mountain View Fire Rescue
143
Figure 122: MVFR Rescue Unit UHU Rates (2015–2016)
Rescue Unit 2015 UHU
2015 UHU %
2016 UHU
2016 UHU %
2015–2016 AGGREGATE
Rescue 2221 0.08 8% 0.11 11% 0.10 (10%)
Rescue 2224 0.02 2% 0.02 2% 0.02 (2%)
Rescue 2226 0.12 12% 0.12 12% 0.12 (12%)
Percentages rounded
When comparing the UHU results from each of the three MVFR Rescue units, all are below the typical
thresholds for fire-based ambulance service. In addition, if the general utilization scale is considered a valid
measure, then each of the rescue units were within the “Poor Utilization” category during 2015–2016.
EMS Mutual Aid
Transport mutual aid is available from the Lafayette Fire Department, American Medical Response, the
Banner Health Service Ambulance, and the North Metro Fire Rescue District. MVFR occasionally provides
transport mutual aid to several other fire departments and districts.
There has been concern that cross-staffing an engine/rescue at Station 4 has resulted in frequent mutual
aid requests for transport. To have adequate personnel on scene, the engine is selected with an ambulance
responding from another department.
EMS Response-Time Performance
Response time is considered a key benchmark. It is a metric intended to reflect one aspect of an EMS
system’s performance. Most sophisticated fire departments measure response times on a fractile basis with
a 90 percent reliability.
The NFPA defines total response time as the interval between the time the call was received at the dispatch
center and the time unit arrived on-scene. The interval between the time the call was received at 911 and
the time the first unit is dispatched is referred to the alarm-handling (or call-processing) time. Since MVFR
is dispatched by more than one PSAP/communications center, which is not within its direct control,
response times in this report are defined as the interval between the time the unit was dispatched and the
time of arrival.
As described in other sections of this report, the majority of MVFR’s response area consists of a rural
population density. MVFR engine companies typically perform in a medical first responder role on EMS
incidents. The intent is to begin patient care prior to the arrival of the ALS rescue. The following figure
shows the combined 2015–2016 response-time performance of each engine on EMS incidents by
population density, as well as all areas combined.
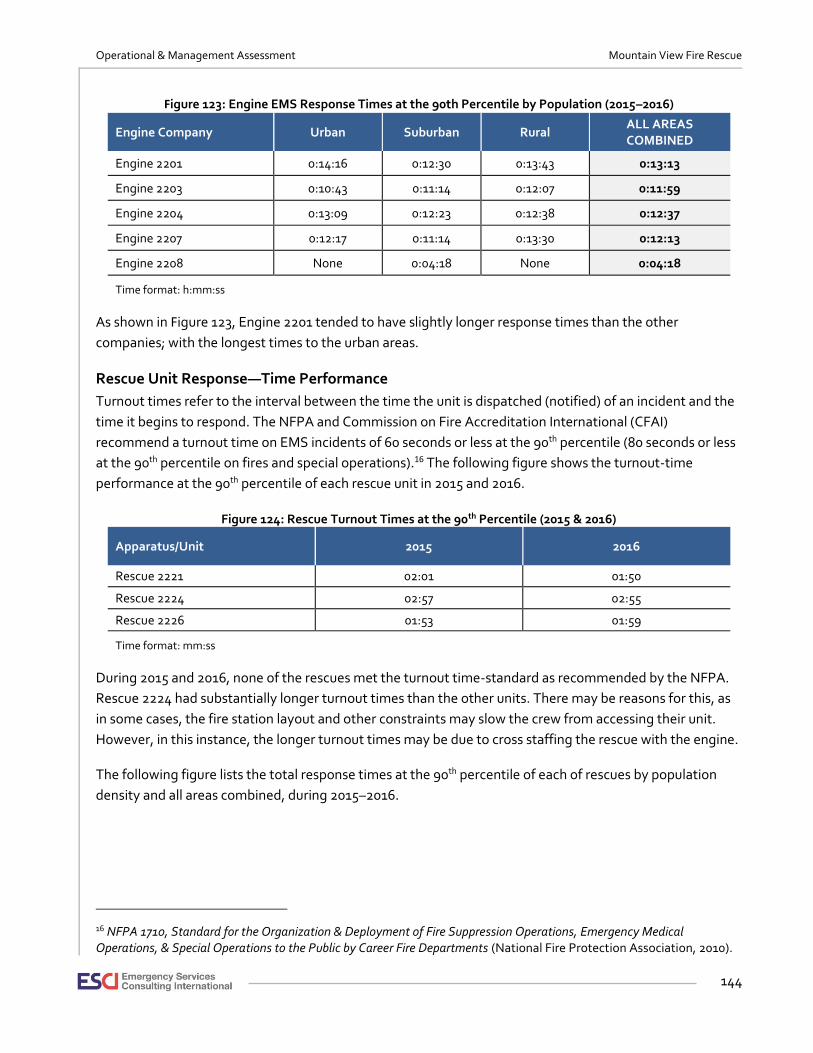
Operational & Management Assessment Mountain View Fire Rescue
144
Figure 123: Engine EMS Response Times at the 90th Percentile by Population (2015–2016)
Engine Company Urban Suburban Rural ALL AREAS COMBINED
Engine 2201 0:14:16 0:12:30 0:13:43 0:13:13
Engine 2203 0:10:43 0:11:14 0:12:07 0:11:59
Engine 2204 0:13:09 0:12:23 0:12:38 0:12:37
Engine 2207 0:12:17 0:11:14 0:13:30 0:12:13
Engine 2208 None 0:04:18 None 0:04:18
Time format: h:mm:ss
As shown in Figure 123, Engine 2201 tended to have slightly longer response times than the other
companies; with the longest times to the urban areas.
Rescue Unit Response—Time Performance
Turnout times refer to the interval between the time the unit is dispatched (notified) of an incident and the
time it begins to respond. The NFPA and Commission on Fire Accreditation International (CFAI)
recommend a turnout time on EMS incidents of 60 seconds or less at the 90th percentile (80 seconds or less
at the 90th percentile on fires and special operations).16 The following figure shows the turnout-time
performance at the 90th percentile of each rescue unit in 2015 and 2016.
Figure 124: Rescue Turnout Times at the 90th Percentile (2015 & 2016)
Apparatus/Unit 2015 2016
Rescue 2221 02:01 01:50
Rescue 2224 02:57 02:55
Rescue 2226 01:53 01:59
Time format: mm:ss
During 2015 and 2016, none of the rescues met the turnout time-standard as recommended by the NFPA.
Rescue 2224 had substantially longer turnout times than the other units. There may be reasons for this, as
in some cases, the fire station layout and other constraints may slow the crew from accessing their unit.
However, in this instance, the longer turnout times may be due to cross staffing the rescue with the engine.
The following figure lists the total response times at the 90th percentile of each of rescues by population
density and all areas combined, during 2015–2016.
16 NFPA 1710, Standard for the Organization & Deployment of Fire Suppression Operations, Emergency Medical Operations, & Special Operations to the Public by Career Fire Departments (National Fire Protection Association, 2010).

Operational & Management Assessment Mountain View Fire Rescue
145
Figure 125: Rescue Response Times at the 90th Percentile by Population Density (2015–2016)
Rescue Unit Urban Suburban Rural ALL AREAS COMBINED
Rescue 2221 0:16:29 0:14:35 0:14:50 0:14:46
Rescue 2224 0:11:44 0:12:40 0:12:33 0:12:33
Rescue 2226 0:15:13 0:13:58 0:13:55 0:14:05
Rescue 2227* 0:17:02 0:16:45 0:19:35 0:18:23
*Not staffed 24 hours daily
The following figure is a comparison of the averages, at the 90th percentile, of engine and rescue response
times to EMS incidents by population density during the period 2015–2016. The results show that the
rescues had considerably shorter average response times than the engines.
Figure 126: Comparison of EMS Average Response Times by Unit (2015–2016)
Unit Type Urban
Average* Suburban Average*
Rural Average*
Engines 0:15:07 0:14:30 0:15:13
Rescues 0:12:36 0:11:50 0:12:59
Difference 0:02:31 0:02:40 0:02:14
*Represents the average of the 90th percentile calculations
Response-Time Discussion
Since the alarm-handling times are not included in the preceding response-time results, MVFR response
times are actually longer than what is described in this report. However, it would be unfair to hold the
department accountable for alarm-handling times when they do not have direct control over the assorted
dispatch centers.
None of the MVFR engines or rescues consistently met the recommended NFPA and CFAI turnout-time
standard of 60 seconds or less at the 90th percentile. In addition, neither did they meet national response-
time standards for EMS incidents. MVFR has not established its own internal response-time performance
benchmarks for EMS.
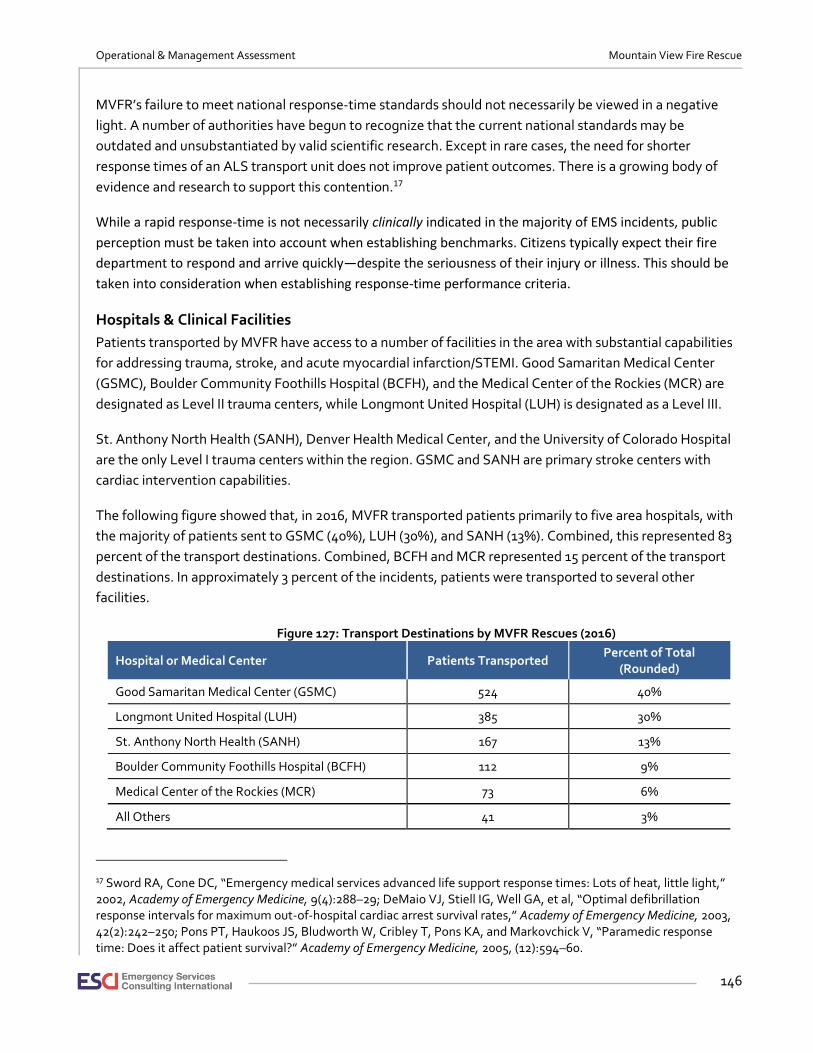
Operational & Management Assessment Mountain View Fire Rescue
146
MVFR’s failure to meet national response-time standards should not necessarily be viewed in a negative
light. A number of authorities have begun to recognize that the current national standards may be
outdated and unsubstantiated by valid scientific research. Except in rare cases, the need for shorter
response times of an ALS transport unit does not improve patient outcomes. There is a growing body of
evidence and research to support this contention.17
While a rapid response-time is not necessarily clinically indicated in the majority of EMS incidents, public
perception must be taken into account when establishing benchmarks. Citizens typically expect their fire
department to respond and arrive quickly—despite the seriousness of their injury or illness. This should be
taken into consideration when establishing response-time performance criteria.
Hospitals & Clinical Facilities
Patients transported by MVFR have access to a number of facilities in the area with substantial capabilities
for addressing trauma, stroke, and acute myocardial infarction/STEMI. Good Samaritan Medical Center
(GSMC), Boulder Community Foothills Hospital (BCFH), and the Medical Center of the Rockies (MCR) are
designated as Level II trauma centers, while Longmont United Hospital (LUH) is designated as a Level III.
St. Anthony North Health (SANH), Denver Health Medical Center, and the University of Colorado Hospital
are the only Level I trauma centers within the region. GSMC and SANH are primary stroke centers with
cardiac intervention capabilities.
The following figure showed that, in 2016, MVFR transported patients primarily to five area hospitals, with
the majority of patients sent to GSMC (40%), LUH (30%), and SANH (13%). Combined, this represented 83
percent of the transport destinations. Combined, BCFH and MCR represented 15 percent of the transport
destinations. In approximately 3 percent of the incidents, patients were transported to several other
facilities.
Figure 127: Transport Destinations by MVFR Rescues (2016)
Hospital or Medical Center Patients Transported Percent of Total
(Rounded)
Good Samaritan Medical Center (GSMC) 524 40%
Longmont United Hospital (LUH) 385 30%
St. Anthony North Health (SANH) 167 13%
Boulder Community Foothills Hospital (BCFH) 112 9%
Medical Center of the Rockies (MCR) 73 6%
All Others 41 3%
17 Sword RA, Cone DC, “Emergency medical services advanced life support response times: Lots of heat, little light,” 2002, Academy of Emergency Medicine, 9(4):288–29; DeMaio VJ, Stiell IG, Well GA, et al, “Optimal defibrillation response intervals for maximum out-of-hospital cardiac arrest survival rates,” Academy of Emergency Medicine, 2003, 42(2):242–250; Pons PT, Haukoos JS, Bludworth W, Cribley T, Pons KA, and Markovchick V, “Paramedic response time: Does it affect patient survival?” Academy of Emergency Medicine, 2005, (12):594–60.
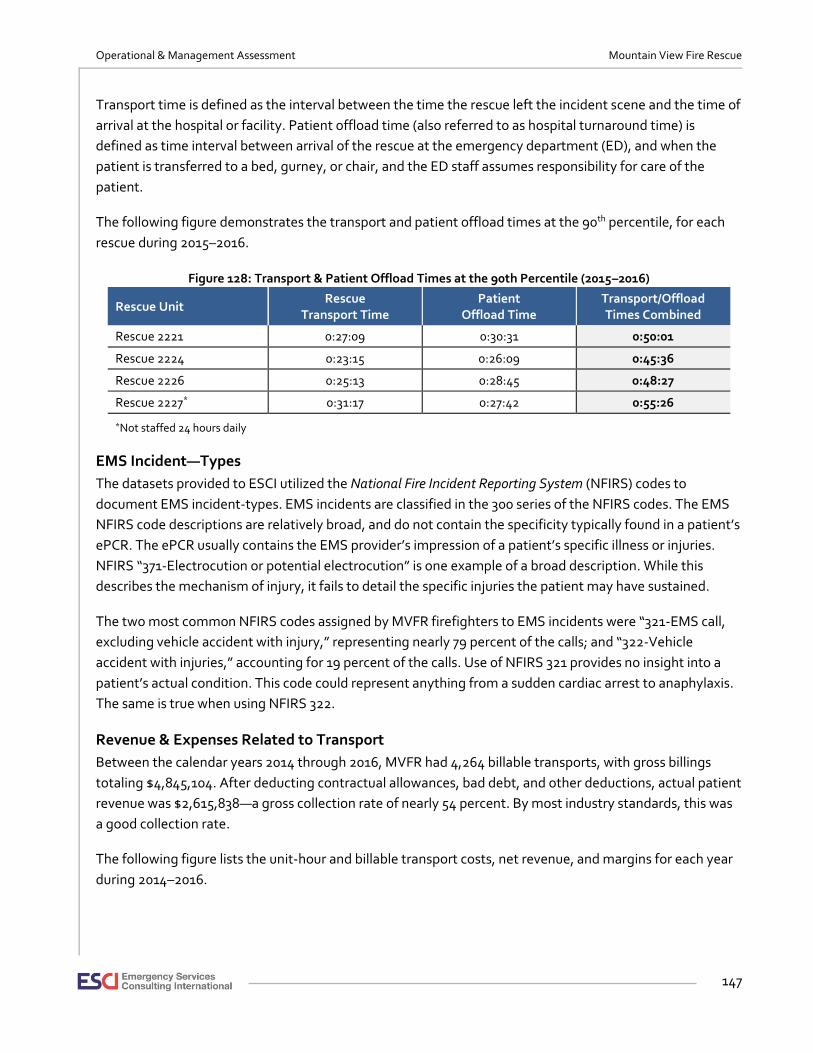
Operational & Management Assessment Mountain View Fire Rescue
147
Transport time is defined as the interval between the time the rescue left the incident scene and the time of
arrival at the hospital or facility. Patient offload time (also referred to as hospital turnaround time) is
defined as time interval between arrival of the rescue at the emergency department (ED), and when the
patient is transferred to a bed, gurney, or chair, and the ED staff assumes responsibility for care of the
patient.
The following figure demonstrates the transport and patient offload times at the 90th percentile, for each
rescue during 2015–2016.
Figure 128: Transport & Patient Offload Times at the 90th Percentile (2015–2016)
Rescue Unit Rescue
Transport Time Patient
Offload Time Transport/Offload Times Combined
Rescue 2221 0:27:09 0:30:31 0:50:01
Rescue 2224 0:23:15 0:26:09 0:45:36
Rescue 2226 0:25:13 0:28:45 0:48:27
Rescue 2227* 0:31:17 0:27:42 0:55:26
*Not staffed 24 hours daily
EMS Incident—Types
The datasets provided to ESCI utilized the National Fire Incident Reporting System (NFIRS) codes to
document EMS incident-types. EMS incidents are classified in the 300 series of the NFIRS codes. The EMS
NFIRS code descriptions are relatively broad, and do not contain the specificity typically found in a patient’s
ePCR. The ePCR usually contains the EMS provider’s impression of a patient’s specific illness or injuries.
NFIRS “371-Electrocution or potential electrocution” is one example of a broad description. While this
describes the mechanism of injury, it fails to detail the specific injuries the patient may have sustained.
The two most common NFIRS codes assigned by MVFR firefighters to EMS incidents were “321-EMS call,
excluding vehicle accident with injury,” representing nearly 79 percent of the calls; and “322-Vehicle
accident with injuries,” accounting for 19 percent of the calls. Use of NFIRS 321 provides no insight into a
patient’s actual condition. This code could represent anything from a sudden cardiac arrest to anaphylaxis.
The same is true when using NFIRS 322.
Revenue & Expenses Related to Transport
Between the calendar years 2014 through 2016, MVFR had 4,264 billable transports, with gross billings
totaling $4,845,104. After deducting contractual allowances, bad debt, and other deductions, actual patient
revenue was $2,615,838—a gross collection rate of nearly 54 percent. By most industry standards, this was
a good collection rate.
The following figure lists the unit-hour and billable transport costs, net revenue, and margins for each year
during 2014–2016.

Operational & Management Assessment Mountain View Fire Rescue
148
Figure 129: MVFR Rescue Transport & Unit-Hour Costs & Margins (2014–2016)
Description 2014 2015 2016
Unit-hour cost $14 $15 $14
Net revenue per unit-hour $33 $30 $37
Margin per unit-hour: $18 $15 $23
Cost per billable transport $240 $300 $257
Net revenue per billable transport $552 $604 $691
Margin per billable transport: $312 $304 $434
Note: Figures are rounded to the nearest dollar
Estimated annual maintenance and operation (M&O) expenses specifically for the MVFR Rescues during
the same 36-month period totaled $1,127,259. With Rescue 2224 being a cross-staffed unit, annual M&O
costs cannot be precisely determined.
Final Discussion
Although the MVFR leadership acknowledges the importance of EMS publicly, there is a perception by a
number of employees that policies and actions do not reflect that attitude. A lack of interest in the
importance and value of EMS appears to have filtered down to the lower ranks of the organization. Apathy
towards EMS among some—but not all—firefighters and company officers may be somewhat pervasive.
MVFR needs to begin promoting EMS through its actions. Members of the department with knowledge,
experience, and a genuine passion for EMS should be promoted to positions of authority. In essence, the
organization needs to begin to change the organizational culture towards EMS.
With MVFR not only providing medical first response, but also ALS transport, a strong, efficient, and
effective EMS administration is critical to the success of delivering prehospital emergency medical care and
transport. The EMS Division needs sufficient staff, support from upper management, and succession
planning in the immediate future.
The current battalion chief of EMS enjoys a positive national reputation within the EMS industry.
Unfortunately for MVFR, she is due to retire sometime in 2017. With her substantial experience, education,
positive working relationships around the industry, and strong administrative skills, it will be a challenge to
replace her with someone of equivalent capabilities.
It has been ESCI’s experience in many other systems, and supported by valid research, that a strong BLS
medical first-response system, with well-trained EMTs oriented to work with paramedics and ALS equipment
and supplies, tends to produce the best patient outcomes.
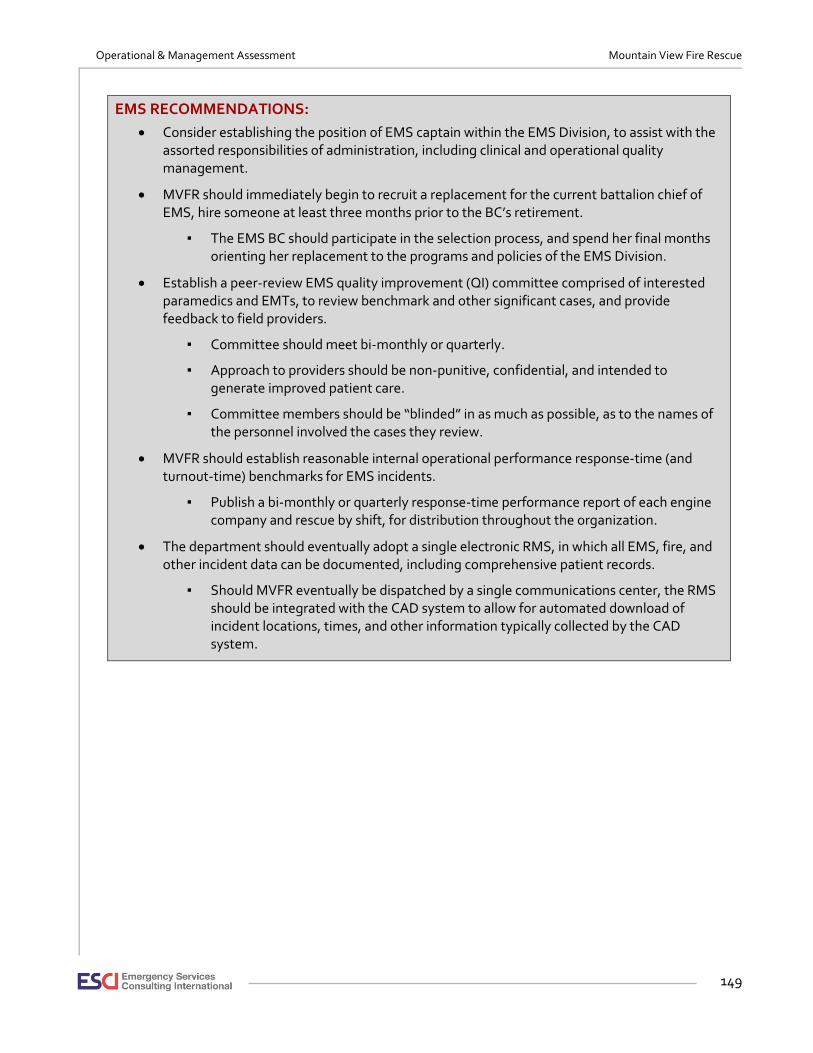
Operational & Management Assessment Mountain View Fire Rescue
149
EMS RECOMMENDATIONS:
• Consider establishing the position of EMS captain within the EMS Division, to assist with the assorted responsibilities of administration, including clinical and operational quality management.
• MVFR should immediately begin to recruit a replacement for the current battalion chief of EMS, hire someone at least three months prior to the BC’s retirement.
▪ The EMS BC should participate in the selection process, and spend her final months orienting her replacement to the programs and policies of the EMS Division.
• Establish a peer-review EMS quality improvement (QI) committee comprised of interested paramedics and EMTs, to review benchmark and other significant cases, and provide feedback to field providers.
▪ Committee should meet bi-monthly or quarterly.
▪ Approach to providers should be non-punitive, confidential, and intended to generate improved patient care.
▪ Committee members should be “blinded” in as much as possible, as to the names of the personnel involved the cases they review.
• MVFR should establish reasonable internal operational performance response-time (and turnout-time) benchmarks for EMS incidents.
▪ Publish a bi-monthly or quarterly response-time performance report of each engine company and rescue by shift, for distribution throughout the organization.
• The department should eventually adopt a single electronic RMS, in which all EMS, fire, and other incident data can be documented, including comprehensive patient records.
▪ Should MVFR eventually be dispatched by a single communications center, the RMS should be integrated with the CAD system to allow for automated download of incident locations, times, and other information typically collected by the CAD system.
Operational & Management Assessment Mountain View Fire Rescue
150
HAZMAT SERVICES SUPPORT & RESPONSE CAPABILITIES
MVFR maintains a hazardous material capability with 84 operational level personnel and 17 technician level
personnel. In addition, there are six hazardous material certified incident commanders and four safety
officers. Two personnel are trained in Weapons of Mass Destruction. Training takes place monthly.
MVFR participates with three other regional teams, Boulder County, Southwest Weld County, and
Longmont Fire. Training with the other teams takes place regularly.
Hazardous materials response is quartered in Station 7. A heavy rescue and trailer is available as well as a
foam truck, along with Engine 7. The team is equipped for both level A and B entry, air monitoring for gases
and defining hot zone, plume modelling, and spot weather forecasting. Operationally they able to handle
spill containment, offloading, and foam deployment. The team is decontamination capable as well.
Deployment of a level A entry is estimated at 15–30 minutes. The MVFR trained personnel along with
cooperation with the other available teams give very adequate hazardous material response for the
communities served.
Operational & Management Assessment Mountain View Fire Rescue
151
FUTURE SYSTEM-DEMAND PROJECTIONS
Mountain View Fire Rescue lies in two counties, Boulder and Weld. Both counties encourage urban
development to occur within municipal areas. Three such areas are notable within the fire district, Dacono,
Erie, and Mead. Erie lies across the boundary of Boulder and Weld counties. The other two towns are in
Weld county.
In order to determine the future of the fire district, ESCI reviewed the comprehensive plans of all three
cities and both counties. Dacono has a 2016 update to the 2005 plan available. The Town of Erie also has
published a 2015 update to their comprehensive plan. The Town of Mead most current comprehensive plan
is a 2009 version. Boulder County base comprehensive plan is 2009 with periodic changes. Weld county’s
plan was developed in 1974, with the latest update being 2002.
The target for this study is to determine the growth nearly 20 years into the future. In order to project
growth, two methodologies are used. One is to review the historical growth rate and one is to accept the
projections of the comprehensive plans. Greater weight is given to the cities as the areas within their
planning influence areas reduce the unincorporated areas of the counties and the higher density urban
areas will by design be within the cities’ boundaries. The following figure shows the three municipal
planning areas overlaid onto the MVFR map.
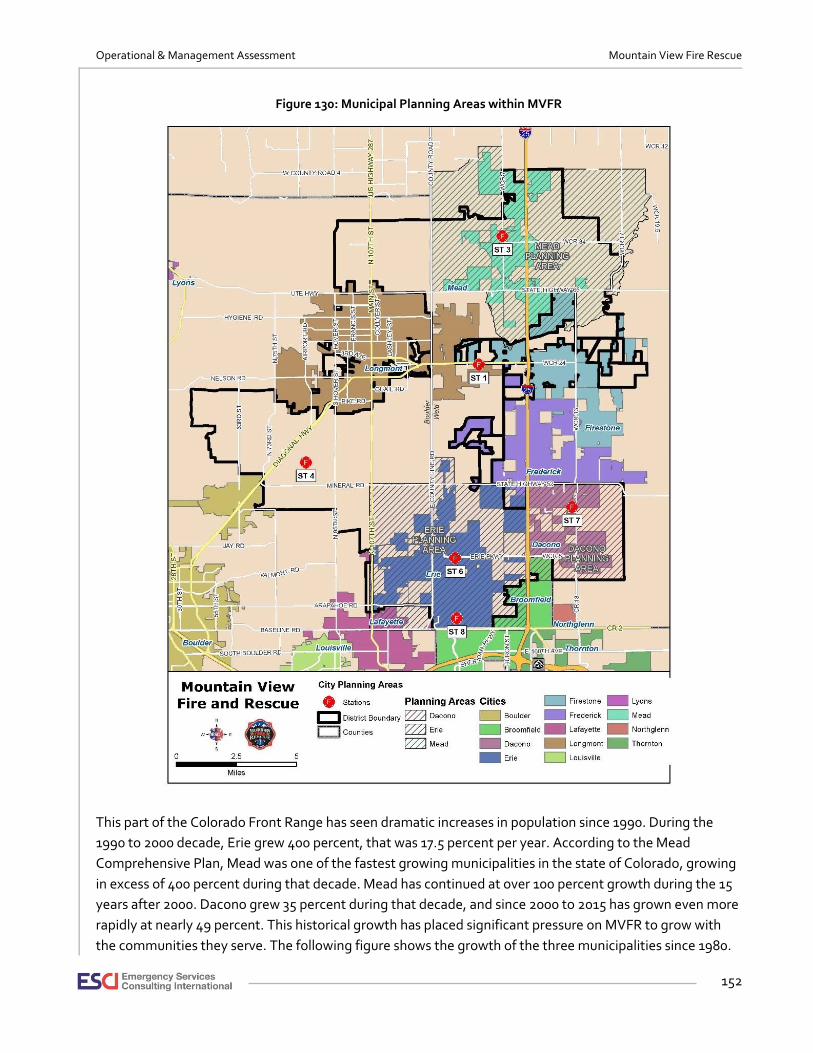
Operational & Management Assessment Mountain View Fire Rescue
152
Figure 130: Municipal Planning Areas within MVFR
This part of the Colorado Front Range has seen dramatic increases in population since 1990. During the
1990 to 2000 decade, Erie grew 400 percent, that was 17.5 percent per year. According to the Mead
Comprehensive Plan, Mead was one of the fastest growing municipalities in the state of Colorado, growing
in excess of 400 percent during that decade. Mead has continued at over 100 percent growth during the 15
years after 2000. Dacono grew 35 percent during that decade, and since 2000 to 2015 has grown even more
rapidly at nearly 49 percent. This historical growth has placed significant pressure on MVFR to grow with
the communities they serve. The following figure shows the growth of the three municipalities since 1980.
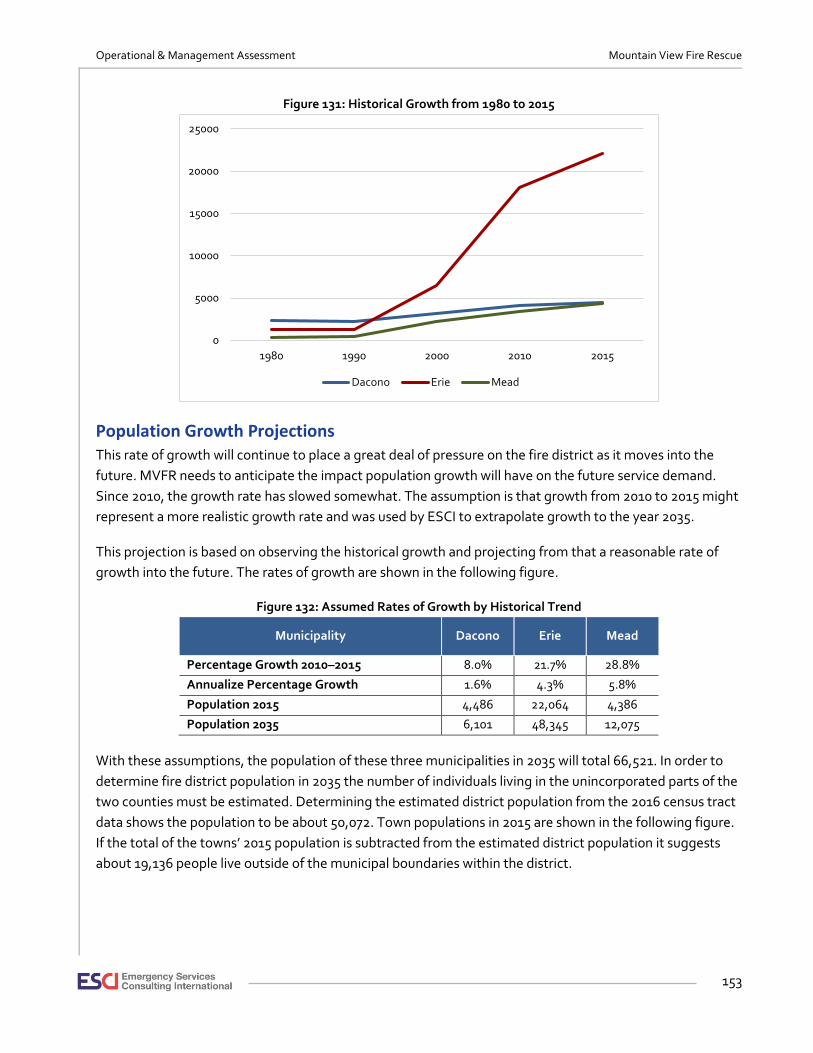
Operational & Management Assessment Mountain View Fire Rescue
153
Figure 131: Historical Growth from 1980 to 2015
Population Growth Projections This rate of growth will continue to place a great deal of pressure on the fire district as it moves into the
future. MVFR needs to anticipate the impact population growth will have on the future service demand.
Since 2010, the growth rate has slowed somewhat. The assumption is that growth from 2010 to 2015 might
represent a more realistic growth rate and was used by ESCI to extrapolate growth to the year 2035.
This projection is based on observing the historical growth and projecting from that a reasonable rate of
growth into the future. The rates of growth are shown in the following figure.
Figure 132: Assumed Rates of Growth by Historical Trend
Municipality Dacono Erie Mead
Percentage Growth 2010–2015 8.0% 21.7% 28.8%
Annualize Percentage Growth 1.6% 4.3% 5.8%
Population 2015 4,486 22,064 4,386
Population 2035 6,101 48,345 12,075
With these assumptions, the population of these three municipalities in 2035 will total 66,521. In order to
determine fire district population in 2035 the number of individuals living in the unincorporated parts of the
two counties must be estimated. Determining the estimated district population from the 2016 census tract
data shows the population to be about 50,072. Town populations in 2015 are shown in the following figure.
If the total of the towns’ 2015 population is subtracted from the estimated district population it suggests
about 19,136 people live outside of the municipal boundaries within the district.
0
5000
10000
15000
20000
25000
1980 1990 2000 2010 2015
Dacono Erie Mead
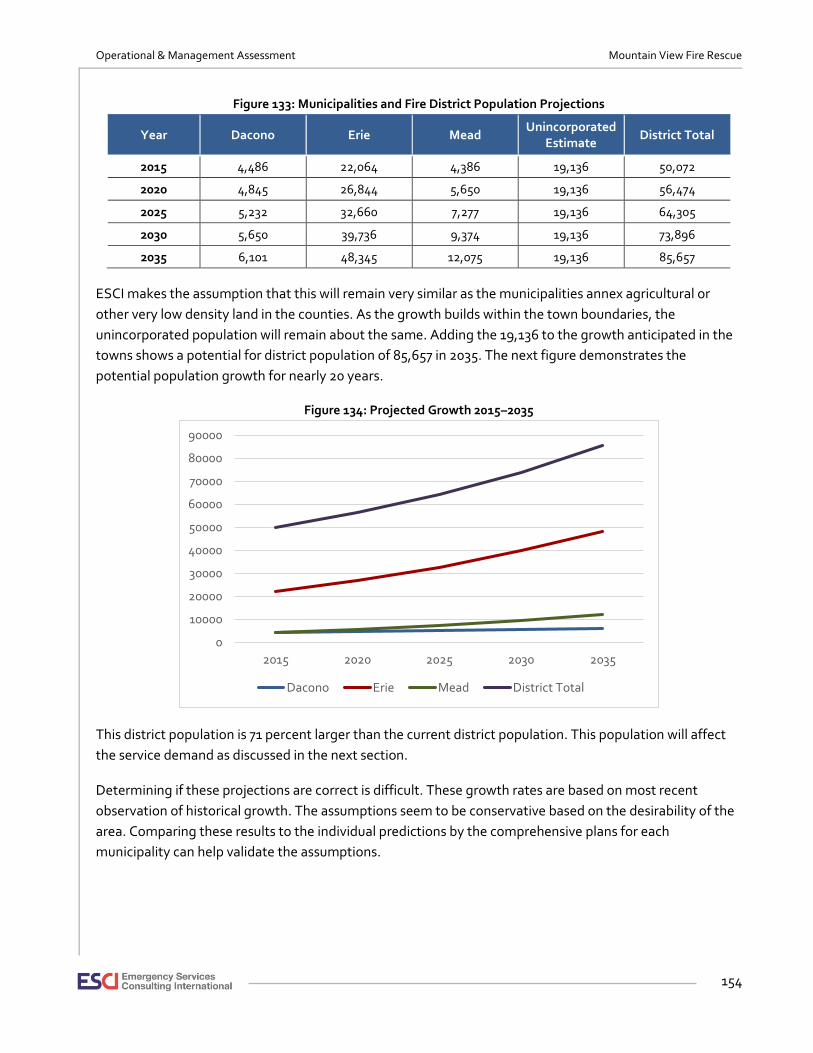
Operational & Management Assessment Mountain View Fire Rescue
154
Figure 133: Municipalities and Fire District Population Projections
Year Dacono Erie Mead Unincorporated
Estimate District Total
2015 4,486 22,064 4,386 19,136 50,072
2020 4,845 26,844 5,650 19,136 56,474
2025 5,232 32,660 7,277 19,136 64,305
2030 5,650 39,736 9,374 19,136 73,896
2035 6,101 48,345 12,075 19,136 85,657
ESCI makes the assumption that this will remain very similar as the municipalities annex agricultural or
other very low density land in the counties. As the growth builds within the town boundaries, the
unincorporated population will remain about the same. Adding the 19,136 to the growth anticipated in the
towns shows a potential for district population of 85,657 in 2035. The next figure demonstrates the
potential population growth for nearly 20 years.
Figure 134: Projected Growth 2015–2035
This district population is 71 percent larger than the current district population. This population will affect
the service demand as discussed in the next section.
Determining if these projections are correct is difficult. These growth rates are based on most recent
observation of historical growth. The assumptions seem to be conservative based on the desirability of the
area. Comparing these results to the individual predictions by the comprehensive plans for each
municipality can help validate the assumptions.
0
10000
20000
30000
40000
50000
60000
70000
80000
90000
2015 2020 2025 2030 2035
Dacono Erie Mead District Total

Operational & Management Assessment Mountain View Fire Rescue
155
The Dacono plan determines the potential growth in the “Trade Area” which is the area along the I-25
corridor. Of that total demand of dwelling units and commercial area needed, it is assumed that between
8–10 percent of the Trade Area demand will occur in the Town of Dacono.18 Taking 10 percent as Dacono’s
market share, the plan predicts an additional 1650 dwelling units (du) will occur over the next 20 years.
Assuming a 2.8 persons per dwelling unit the additional population will be 4,620 persons. Added to the
2015 population, this predicts 9,106 persons by 2035.
The Erie comprehensive plan projects a growth rate beyond 2015 to 2035 to be 3 percent.19 Using that
assumption, the 2035 population would be 39,850.
Drawing a 2035 comparison from the Mead comprehensive plan is more elusive. The plan indicates that at
build out the population of the municipality and its planning influence area will be 27,913 dwelling units;
calculated at 3.1 persons per du, the total projected population is 86,017.20 It is unclear when buildout
should occur. Barring additional precision ESCI believes the 5.8 percent annual growth may be realistic.
Growth rates seen by Dacono and Erie in the previous 10 years may be beginning in the Mead area in the
next few years as families look for homes further away from the Denver metropolitan area and as
transportation routes and methods become more readily available.
Figure 135: Comparison of Growth Assumptions
Community Calculation by Rate of Growth
2010–2015 Comprehensive Plan Numbers
Dacono 6,101 9,106
Erie 48,345 39,850
Mead 12,075 12,075
Totals 66,521 61,031
Based on minor difference between the two different methodologies the calculation rate of growth, the
historical growth rates numbers will be used to estimate service demand in the following section.
18 Dacono Draft Comprehensive Plan 2016; page 21. 19 Town of Erie Comprehensive Plan – 2015 Update; page A-7. 20 Town of Mead Comprehensive Plan March 2009; Appendix C
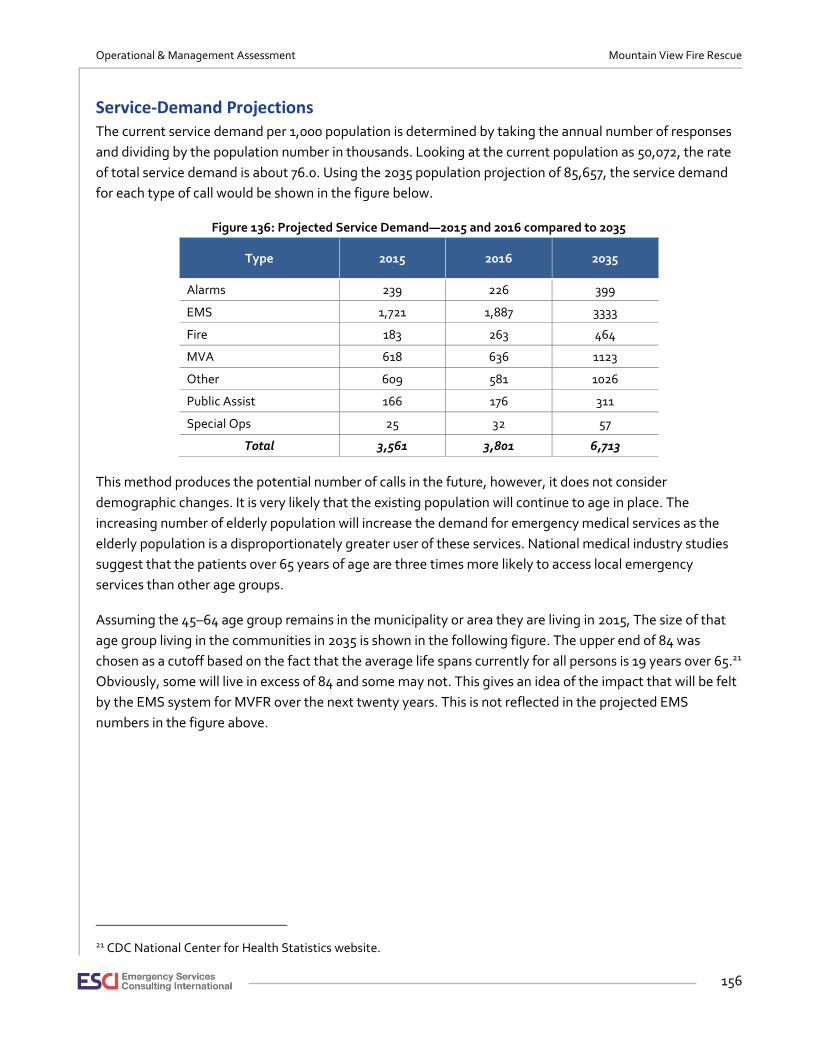
Operational & Management Assessment Mountain View Fire Rescue
156
Service-Demand Projections The current service demand per 1,000 population is determined by taking the annual number of responses
and dividing by the population number in thousands. Looking at the current population as 50,072, the rate
of total service demand is about 76.0. Using the 2035 population projection of 85,657, the service demand
for each type of call would be shown in the figure below.
Figure 136: Projected Service Demand—2015 and 2016 compared to 2035
Type 2015 2016 2035
Alarms 239 226 399
EMS 1,721 1,887 3333
Fire 183 263 464
MVA 618 636 1123
Other 609 581 1026
Public Assist 166 176 311
Special Ops 25 32 57
Total 3,561 3,801 6,713
This method produces the potential number of calls in the future, however, it does not consider
demographic changes. It is very likely that the existing population will continue to age in place. The
increasing number of elderly population will increase the demand for emergency medical services as the
elderly population is a disproportionately greater user of these services. National medical industry studies
suggest that the patients over 65 years of age are three times more likely to access local emergency
services than other age groups.
Assuming the 45–64 age group remains in the municipality or area they are living in 2015, The size of that
age group living in the communities in 2035 is shown in the following figure. The upper end of 84 was
chosen as a cutoff based on the fact that the average life spans currently for all persons is 19 years over 65.21
Obviously, some will live in excess of 84 and some may not. This gives an idea of the impact that will be felt
by the EMS system for MVFR over the next twenty years. This is not reflected in the projected EMS
numbers in the figure above.
21 CDC National Center for Health Statistics website.

Operational & Management Assessment Mountain View Fire Rescue
157
Figure 137: Population over 65 in 2015 and 203522
Community Risk Assessment Determining potential risks in the MVFR’s future helps to see if there are additional impacts to the service
demand for the fire district. In the Community Risk section of this report, there was discussion of risks that
MVFR could affect by mitigation efforts. Other potential natural and manmade hazards that could have
effect on service delivery are discussed in this section. As the fire district continues to grow and add homes,
the impact of some risks could increase dramatically.
MVFR cannot prevent most risks from happening, but as the first responder will be required to mitigate the
results and minimize loss of lives and property. MVFR has transportation routes that increase potential for
accidents and hazardous material spills. I-25 is a major north–south route for travelers and for
transportation of products. This is not likely to change in the future except to increase number of vehicles
per day. Railroads constitute the other transportation routes traversing portions of the district. These carry
additional hazards in terms of flammable and combustible liquids, and toxic chemicals in large quantity.
The district has a hazardous material group as discussed previously. Accidents involving hazardous material
are rare but may occur on these routes and have the potential for serious damage. In addition, vehicle
accidents are not uncommon and ability to respond with the needed equipment for extrication of victims is
important for MVFR to maintain.
The district is susceptible to building collapses from a number of causes; winds, snow load, or building
failure. MVFR maintains a technical rescue component and has preplanned the uses of other resources such
as mutual aid or state teams.
22 Information derived from the US Census Bureau, American Fact Finder website.
6%
11%9% 11%
26% 26%28%
42%
0%
5%
10%
15%
20%
25%
30%
35%
40%
45%
Erie Dacono Mead Niwot
% 65-84 in 2015 % 65-84 in 2035

Operational & Management Assessment Mountain View Fire Rescue
158
As the district grows residentially, the agricultural aspect may decrease over time. Farming accidents
trapping persons in equipment will continue to be a service demand. Ability to extricate individuals from
the implements will continue to be a need both of equipment and specialized training.
MVFR has a number of lakes and reservoirs within its boundaries. These will continue to provide demand
for water rescue. Rivers and streams require swift water rescues. Flooding is a potential for response. The
following figure shows the 100-year flooding potential.
Figure 138: 100-Year Flooding Potential Map
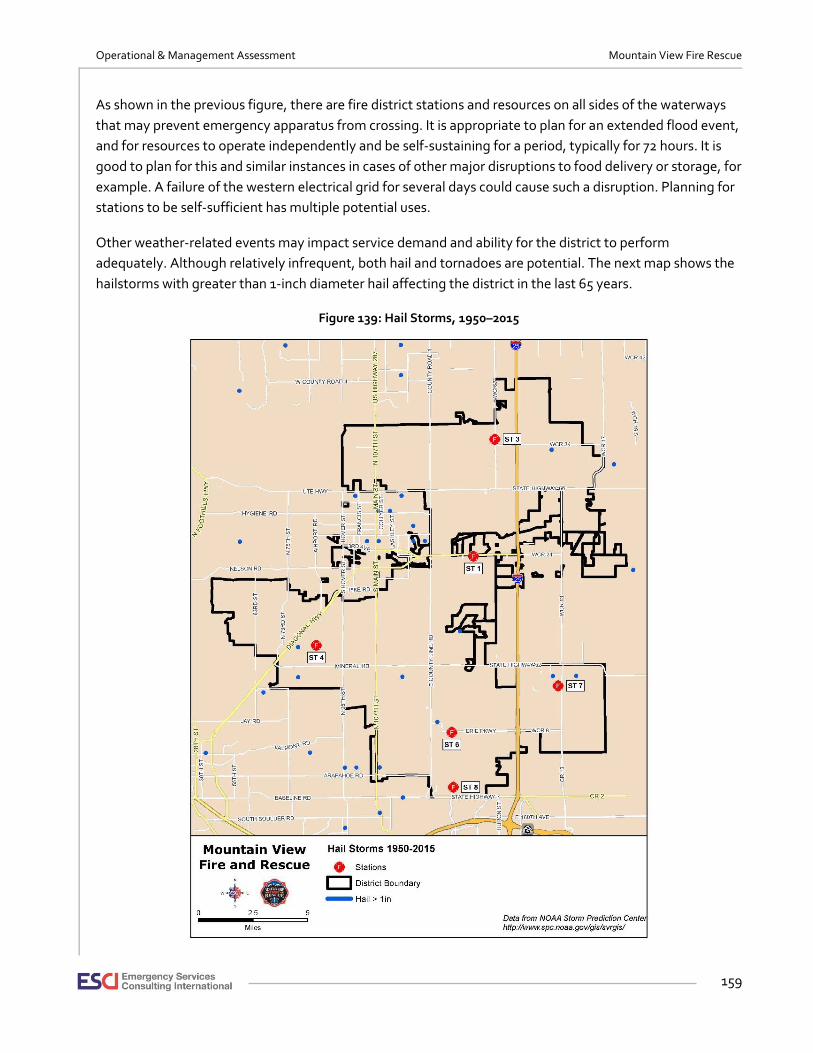
Operational & Management Assessment Mountain View Fire Rescue
159
As shown in the previous figure, there are fire district stations and resources on all sides of the waterways
that may prevent emergency apparatus from crossing. It is appropriate to plan for an extended flood event,
and for resources to operate independently and be self-sustaining for a period, typically for 72 hours. It is
good to plan for this and similar instances in cases of other major disruptions to food delivery or storage, for
example. A failure of the western electrical grid for several days could cause such a disruption. Planning for
stations to be self-sufficient has multiple potential uses.
Other weather-related events may impact service demand and ability for the district to perform
adequately. Although relatively infrequent, both hail and tornadoes are potential. The next map shows the
hailstorms with greater than 1-inch diameter hail affecting the district in the last 65 years.
Figure 139: Hail Storms, 1950–2015
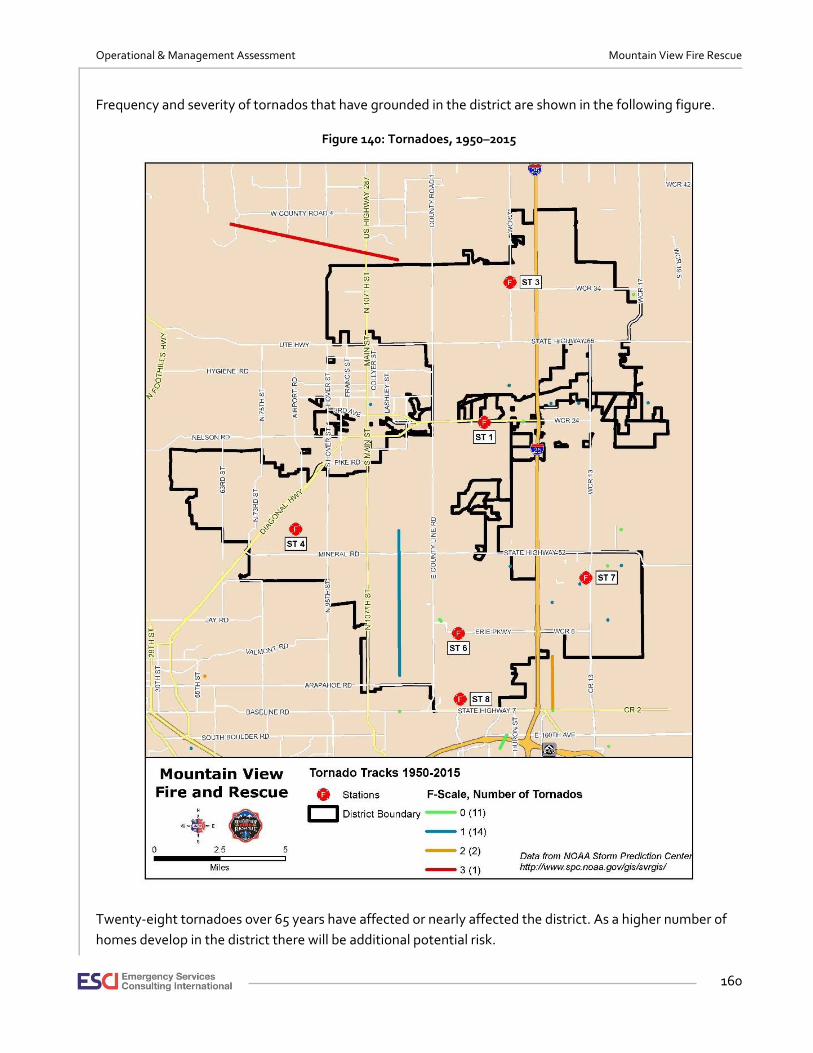
Operational & Management Assessment Mountain View Fire Rescue
160
Frequency and severity of tornados that have grounded in the district are shown in the following figure.
Figure 140: Tornadoes, 1950–2015
Twenty-eight tornadoes over 65 years have affected or nearly affected the district. As a higher number of
homes develop in the district there will be additional potential risk.
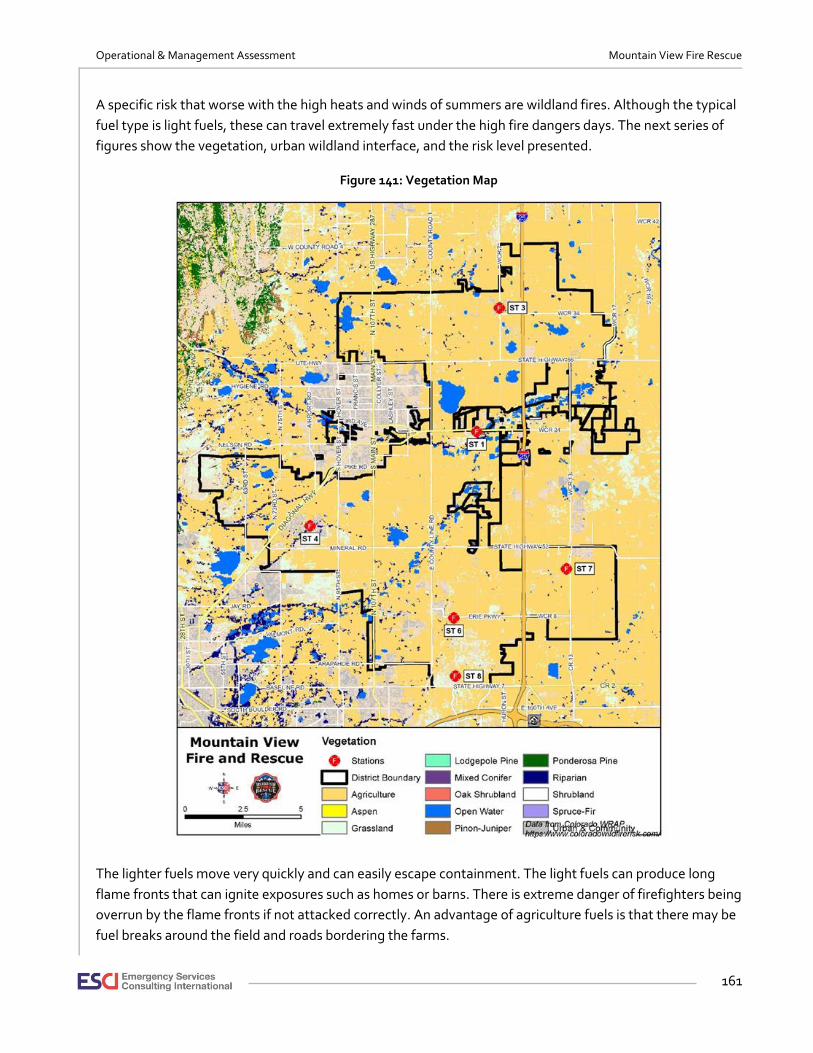
Operational & Management Assessment Mountain View Fire Rescue
161
A specific risk that worse with the high heats and winds of summers are wildland fires. Although the typical
fuel type is light fuels, these can travel extremely fast under the high fire dangers days. The next series of
figures show the vegetation, urban wildland interface, and the risk level presented.
Figure 141: Vegetation Map
The lighter fuels move very quickly and can easily escape containment. The light fuels can produce long
flame fronts that can ignite exposures such as homes or barns. There is extreme danger of firefighters being
overrun by the flame fronts if not attacked correctly. An advantage of agriculture fuels is that there may be
fuel breaks around the field and roads bordering the farms.
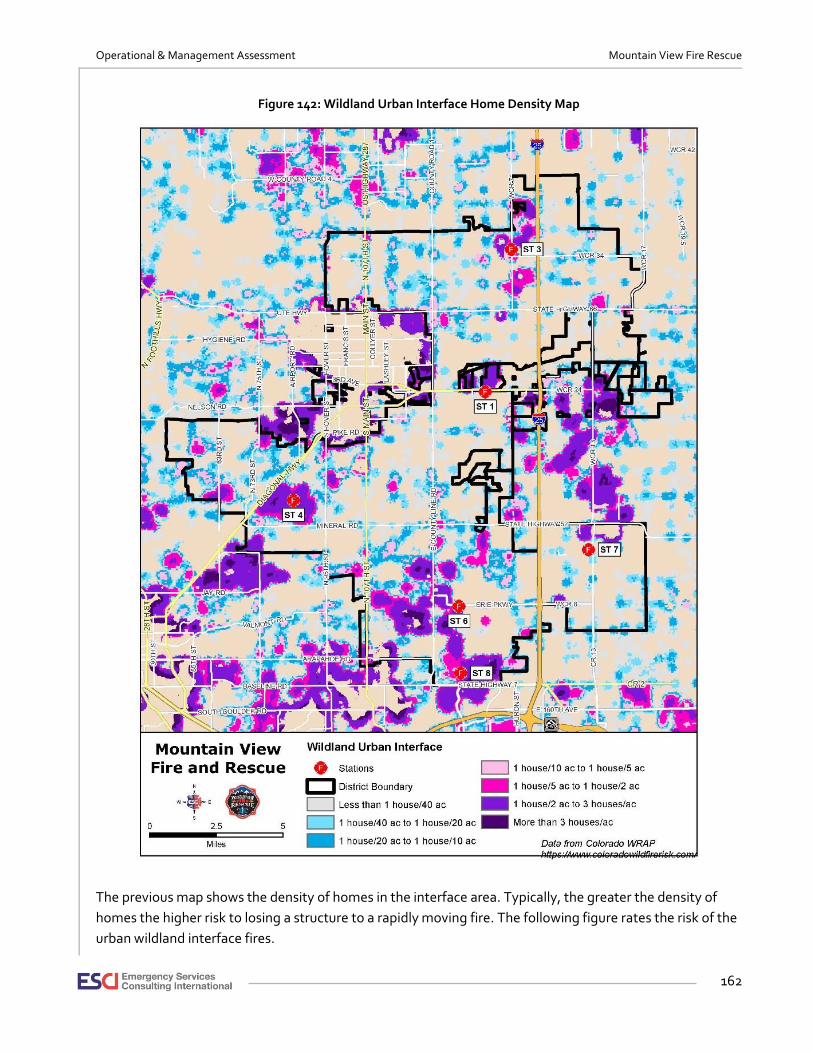
Operational & Management Assessment Mountain View Fire Rescue
162
Figure 142: Wildland Urban Interface Home Density Map
The previous map shows the density of homes in the interface area. Typically, the greater the density of
homes the higher risk to losing a structure to a rapidly moving fire. The following figure rates the risk of the
urban wildland interface fires.
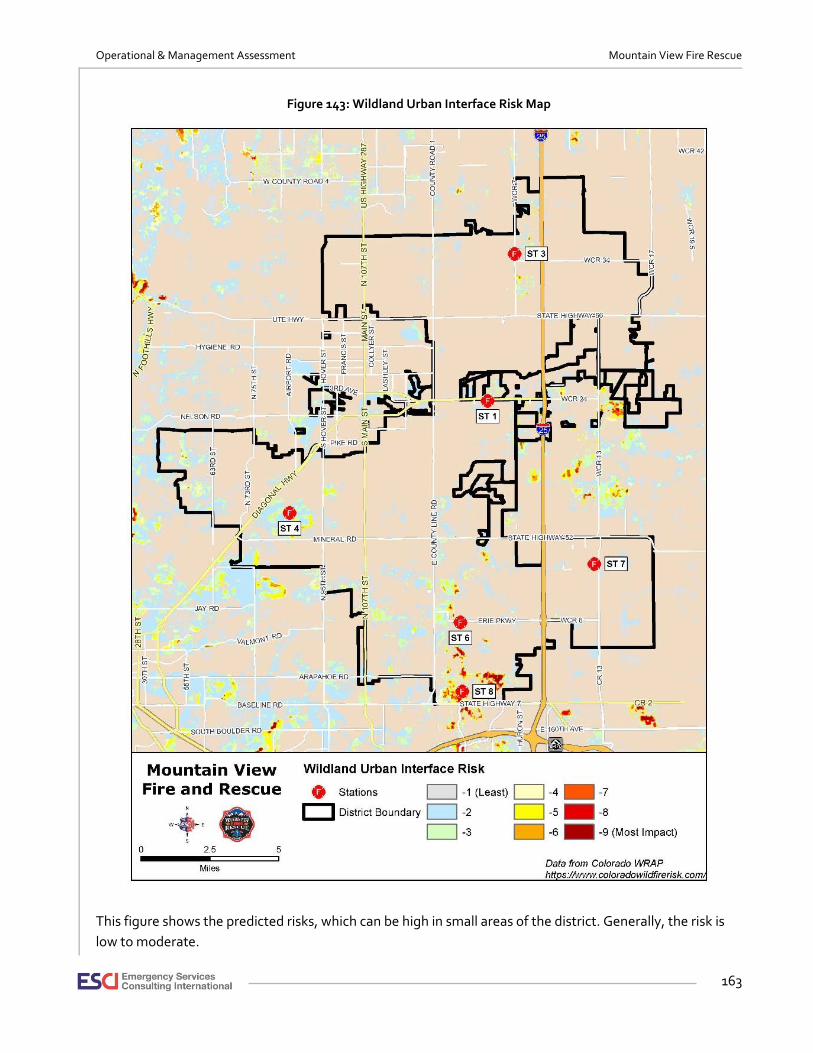
Operational & Management Assessment Mountain View Fire Rescue
163
Figure 143: Wildland Urban Interface Risk Map
This figure shows the predicted risks, which can be high in small areas of the district. Generally, the risk is
low to moderate.
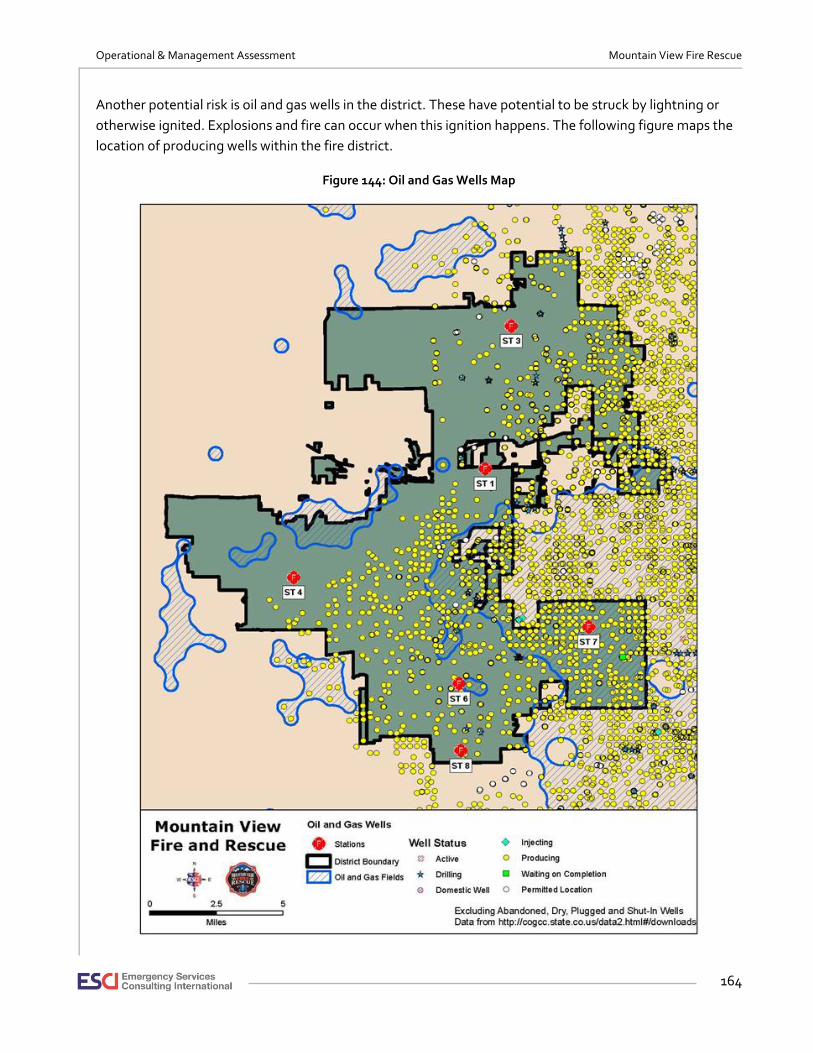
Operational & Management Assessment Mountain View Fire Rescue
164
Another potential risk is oil and gas wells in the district. These have potential to be struck by lightning or
otherwise ignited. Explosions and fire can occur when this ignition happens. The following figure maps the
location of producing wells within the fire district.
Figure 144: Oil and Gas Wells Map
Operational & Management Assessment Mountain View Fire Rescue
165
As recently demonstrated by a home explosion, the potential of fire spread to homes or natural gas
leaching into homes is real. The fire district must be prepared to deal with the results of this catastrophic
failure of safety measures.
ESCI has addressed some of the risks facing the district to provide guidance for district leadership to
consider for future planning. Each of these concerns may have increased apprehension as the district grows
in population and dwellings. MVFR has identified most of these and more in the 2013 Standards of Cover
(SOC) for their accreditation process. The Standards of Cover document is a very good resource for the
recognition of risk and preparing for the hazards at the time of publication. It is important that MVFR
continue to keep the SOC updated as the district grows.
Operational & Management Assessment Mountain View Fire Rescue
166
FUTURE DELIVERY SYSTEM MODELS
Recommended Long-Term Strategy
Future Station Planning
MVFR must be attentive to the future and growth of the district. Growth outside of the five-minute travel
areas served by current stations will cause response time performance to degrade. ESCI proposed the
addition of four stations in optimal locations. Based on historical location of incidents, the computer-
generated model attempts to maximize the coverage of responses by placing one of the four stations
within five-minutes’ travel (MVFR SOC Standard). The following map shows potential future stations
locations.
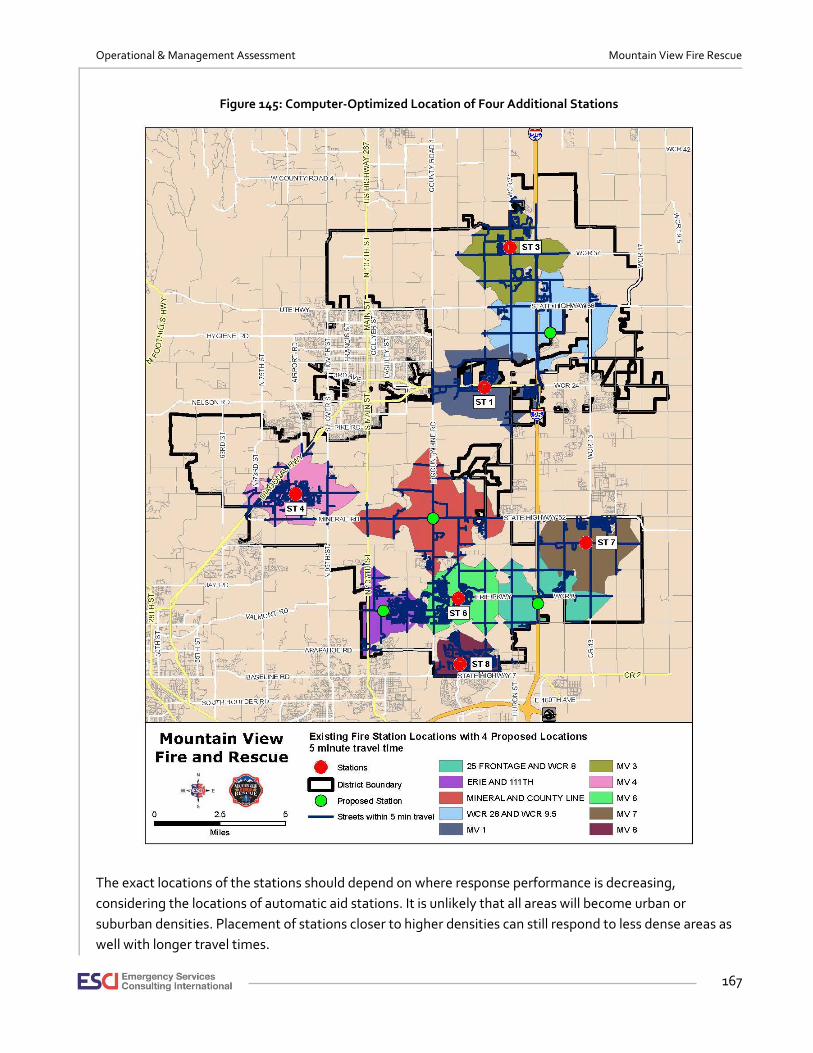
Operational & Management Assessment Mountain View Fire Rescue
167
Figure 145: Computer-Optimized Location of Four Additional Stations
The exact locations of the stations should depend on where response performance is decreasing,
considering the locations of automatic aid stations. It is unlikely that all areas will become urban or
suburban densities. Placement of stations closer to higher densities can still respond to less dense areas as
well with longer travel times.

Operational & Management Assessment Mountain View Fire Rescue
168
Short and Mid-Term Strategies The previous sections of this report detail a considerable volume of observations, comments, and
recommendations relating to MVFR management and operations. The process of understanding,
prioritizing, and implementing the recommended enhancements can be daunting simply due to the
amount of work that may be involved. To help the organization navigate through the process, ESCI has
created a listing of the recommendations. This section contains the recommendations from the report that
are short and medium-range.
Leadership
Paramount to starting through the list for Mountain View Fire Rescue is the need to change the leadership
trajectory that has generated negative impressions expressed by many of the members. The leadership
needs to model the values of the organization and have all membership involved to address the issues. As
indicated previously, an attitude of cooperation and inclusion of all members is necessary. This requires
strong leadership in the fire chief’s role. It will also require the board to allow the fire chief to make
decisions without influence by the board. The board must reject any end runs around the new fire chief by
members of the organization. Therefore, one of the very first recommendations is to hire a strong chief
who can demonstrate a caring attitude for all members of the team. This can have a major effect on the
concerns expressed in the survey. It will allow everyone to feel a part of making MVFR a great place to work.
Other recommendations have been compiled from the body of this report and are listed in this section as
most can be completed in the short to medium-term.
Administrative/Managerial
• Develop and maintain effective pre-incident plans and incorporate dispatch procedures.
• Implement regular reporting of performance compared to the response standards.
• Upon completion of this Master Plan, complete a strategic plan to process implementation of the recommendations herein.
• Actively engage in emergency planning efforts with the counties and the Local Emergency Planning Committee (LEPC).
• Strive to ensure that extremely hazardous substance facilities (EHS) have been properly identified within the district.
• Establish an internal planning group, dedicated planning position, and update planning efforts annually.
• Centralize and standardize dispatch practices for run cards and apparatus dispatch criteria.
• Establish a funded capital replacement plan.
• Develop long-range financial planning strategies.
Human Resources
• Use the transition of long time staff to newer personnel to identify processes and practices that should be included in the AOGs or other policy manual.
• Include a review of the employee handbook in the new hire orientation process.
• Revise the substance abuse policy to include important, missing information.
Operational & Management Assessment Mountain View Fire Rescue
169
• Organize the AOGs manual into sections dedicated to each division.
• Conduct a review of current job descriptions to assure that they are up to date and reflect current best practice.
• Use the service delivery findings of this report to inform a continued study of the effect of extended tours of duty on workers’ compensation injuries and other possible symptoms of fatigue.
• Engage with bargaining unit leaders to jointly address the issue of the appropriate relief staff and alternative staffing strategies for unpopular work assignments. Would part-time firefighters be attracted to the opportunity for seasonal work at the speedway?
• If there are assignment or job responsibility reasons for creating enhanced compensation packages for some segments of the district’s work force, identify and endorse such rationale at the board level.
• Assure that benefits and compensation policy are in written form and included in the AOGs.
• The board should determine whether, as a matter of policy, it will establish employment agreements for future fire chiefs and set a competitive comprehensive range of compensation before employing the next chief.
• Consider revising the discipline and grievance procedures found in district policy and the labor agreement to include a review of chief-level disciplinary decisions.
• Continue to implement a district CISD program.
• Schedule employee training to review district counseling and intervention services on a regular basis (every two years for example).
• Reorganize the administrative support team using span of control principles and existing personnel in the most effective way possible.
• Within each assistant chief’s area of responsibility, identify staffing needs and priorities.
• If needed, consider recruiting non-traditional volunteers to assist with administrative support functions.
• Encourage cross-training between supervisors and subordinates.
• Consider modifying mid-level supervisory position requirements in order to fill current vacancies with qualified and competent incumbent personnel.
• Reconsider the decision to exclude the captain position from the bargaining unit, basing any conclusion on rationale that promotes the mission of the organization.
• Withdraw any policy that prohibits employee participation in associations that do not bring negative attention to the organization.
Operational & Management Assessment Mountain View Fire Rescue
170
Training
• Add qualified instructors/training staff to the division.
• The part-time administrative support staff should be assigned full-time to the Training Division.
• Institute web-based, online training management software that includes, at a minimum, courses for Firefighter I and II, and Company Officer (e.g., TargetSolutions™).
• Develop collaborative training opportunities with other agencies, through shared instructors and costs, and joint training sessions.
• Consider consolidating fire, EMS, and other training into the Training Division (so long as sufficient staff is assigned to the division).
• Depending on the future of the district and availability of revenue, consider purchasing property in a strategic location, which could be utilized to build a future training center.
• Whether built in stages or all at once, MVFR should develop a comprehensive plan to identify priorities and future training needs that should be incorporated into a training facility.
Community Risk Reduction/Investigations
• MVFR should create a division, with a formal name, for those positions within the organization that perform the typical activities found in other fire departments with fire prevention divisions.
• The deputy fire marshal should be immediately promoted to the position of fire marshal, with a clearly defined job description and the responsibility of organizing and overseeing the FPD.
• The roles and responsibilities of each staff member, their position within the division, and titles should be clearly defined through written guidelines.
• The Fire Prevention Division may be understaffed in its ability to perform general inspection activities. MVFR should consider adding sufficient personnel to accomplish minimum inspection requirements and code enforcement.
• MVFR should consider training and appointing one fire investigator assigned to each shift.
• Consider beginning the process of developing a CRR Plan by conducting a comprehensive community risk assessment.
• Based on the results of the community risk assessment, the community outreach coordinator should conduct programs and activities that address risks that have been prioritized for mitigation.
• Depending on the results of a community risk assessment, MVFR should consider the potential of adding 1–2 FTEs.
• There may be some value in assigning the community outreach coordinator the duties of a PIO during major incidents.
EMS
• Consider establishing the position of EMS captain within the EMS Division, to assist with the assorted responsibilities of administration, including clinical and operational quality management.
• MVFR should immediately begin to recruit a replacement for the current battalion chief of EMS; hire someone at least three months prior to the BC’s retirement.
Operational & Management Assessment Mountain View Fire Rescue
171
• Establish a peer-review EMS quality improvement (QI) committee comprised of interested paramedics and EMTs; to review benchmark and other significant cases, and provide feedback to field providers.
• MVFR should establish reasonable internal operational performance response-time (and turnout-time) benchmarks for EMS incidents.
Technology
• Continue implementation of updated finance and HR software.
• The department should eventually adopt a single electronic RMS, in which all EMS, fire, and other incident data can be documented, including comprehensive patient records.
Cultural Change
Recommendations from Dr. Sikora’s report. The full report can be found in Appendix B.
• Accountability starts at the top. Leaders should decide who MVFR wants to be, identify core behaviors that need to be changed or built on to align with that identity, and persistently insist that all officers (especially at the top) and personnel demonstrate those behaviors on a day-to-day basis. Ask people, particularly officers, to leave the organization if they are unwilling to actively support the new culture.
• Don’t create more posters. Change behavior across levels. Without a walk that is consistent with the talk, substantial change in any other area is unlikely.
• Transparency builds trust and information is power. If there is a desire to create a culture that builds trust, shares power with more than a select few, and values and acts on accountability at all levels, the results of this survey should be shared with all personnel and all personnel should play an active role in helping the organization improve.
• Build relationships using the Mission as the rallying point. The vast majority of firefighters join the fire service because of desire to be part of a team and strong desire to help people. Return to this core identity and sense of purpose. Use “why we’re here” as the glue for MVFR.
• Look outside for a new chief who has a reputation for relationship building/people skills, as well as operational excellence. Include interviews or input from his/her subordinates to confirm their ability to build a cohesive, efficient/effective team.
• Work with job descriptions and create unambiguous behavioral expectations for captains to reduce inconsistency in management of station personnel. Hold every captain accountable for walking the talk of the desired culture.
• Bust the glass ceiling. Promote people who have consistently demonstrated desired behaviors as well as rock solid job performance. Ask line personnel for their opinions around potential officers: are they trusted, highly skilled, collaborative leaders or “good on paper.”
• Work to stabilize the staffing model in the stations. If people don’t need to be shuffled, don’t shuffle them. Let personnel form bonds to enhance camaraderie and boost efficiency on calls.
• Encourage bottom-up input and influence. Form committees to address specific issues in this or the larger Master Plan report. Ensure committees are more than symbolic gestures but sources of valued insight and drivers of street smart innovation. “Take the handcuffs off your personnel” and let them be part of the solution and success of MVFR—they want to be.

Operational & Management Assessment Mountain View Fire Rescue
172
• Bring in training in “Critical Conversations” and other communication skills so individuals and groups can wrestle with difficult issues without fueling the flames of antagonism and distrust.
• Automate information processing and put in systems to increase administrative efficiency as well as democratize access to information. Do not allow individuals to actively or passively resist change that is essential for both the effective functioning of the department and creating a culture of transparency and shared accountability.
Conclusion Mountain View Fire Rescue is a department that suffers from a lack of strategic alignment. There is not a
consistent understanding of the goals or how they will be attained. The department has been able to
accomplish much of the right things, the good management, but does not have the “hearts and minds” of
the entire membership. Without this, the leadership flounders trying to gain buy in and full commitment.
The future of this department is bright but not without challenges. The department will continue to see
growth as families move to the communities served by the fire district. ESCI has sensed the desire from the
board-down to start moving forward. Many of the personnel have expressed readiness to make changes
and to push together. The union has expressed their desire to move forward was well. Challenges will
include funding in light of the state tax limitations, dependence on oil and gas prices, and fast growth. It will
take an innovative team to meet the challenges and continue to provide good service to the communities.
Hopefully, to some degree this report has offered ideas and suggestions for change, and will be a catalyst
for new direction. Not all recommendations will fit the department or the members perfectly, but with
innovation they can be the spark for new and better ideas.

Operational & Management Assessment Mountain View Fire Rescue
173
APPENDIX A: TABLE OF FIGURES
Figure 1: Service Demand by Type, 2016 ....................................................................................................... v
Figure 2: Incident Density Map ..................................................................................................................... vi
Figure 3: Overall Response Time Frequency and Cumulative Percentage .................................................... vii
Figure 4: Call Location and Travel Time Predicted and Actual ..................................................................... viii
Figure 5: Projected Growth 2015–2035 ......................................................................................................... ix
Figure 6: Mountain View Fire Protection District Study Area ........................................................................ 3
Figure 7: Governance .................................................................................................................................... 4
Figure 8: Organizational Design .................................................................................................................... 6
Figure 9: MVFR Organizational Chart ............................................................................................................ 7
Figure 10: Service Area and Infrastructure .................................................................................................... 8
Figure 11: Capital Asset Comparison per 1,000 Population ............................................................................ 9
Figure 12: Fiscal Management Table ........................................................................................................... 10
Figure 13: Population Trends ........................................................................................................................ 13
Figure 14: Employment and Unemployment Rates in Boulder and Weld Counties ...................................... 14
Figure 15: Denver Area Inflation Trends—CPI-U ........................................................................................... 15
Figure 16: Boulder County, Total Assessed Value (TAV) .............................................................................. 16
Figure 17: Weld County, Total Assessed Value (TAV) .................................................................................. 16
Figure 18: Mountain View Fire District, Fiscal Years 2010–2017 ................................................................... 18
Figure 19: General Fund Property Tax Collection, Levied Amount and Collection Rate, 2011–2017 ............. 18
Figure 20: Property and Specific Ownership Taxes, 2010–2017 ................................................................... 19
Figure 21: EMS and Wildland Revenues, 2010–2017 .................................................................................... 20
Figure 22: Misc., Interest, and Grant Revenue, 2010–2017 .......................................................................... 20
Figure 23: Capital Reserve Fund Total Revenues By Type, 2011–2017 ......................................................... 21
Figure 24: Beginning Fund/Reserve Balances For All Funds, 2011–2017 ...................................................... 22
Figure 25: Mountain View Fire District All Fund Expenses ........................................................................... 22
Figure 26: General Fund Expenditures By Type ........................................................................................... 23
Figure 27: General Fund Expenditures, 2017 Projected ................................................................................ 24
Figure 28: General Fund Wages and Benefits Totals ................................................................................... 24
Figure 29: General Fund Charges, Materials/Supplies, and Transfers to Capital Reserve ............................. 25
Figure 30: Cost per Capita ........................................................................................................................... 26
Figure 31: Cost per Call ................................................................................................................................ 26
Operational & Management Assessment Mountain View Fire Rescue
174
Figure 32: Revenue, Expense, Net/Deficit, and End Reserve Balance—General Fund ...................................27
Figure 33: Revenue, Expense, Net/Deficit, and End Reserve Balance—Capital Reserve Fund ...................... 28
Figure 34: Revenue, Expense, Net/Deficit, and End Reserve Balance—Pension Fund .................................. 28
Figure 35: Combined OT Types as a % of Total Expenditures ...................................................................... 29
Figure 36: FLSA and GEN Overtime as a % of Total Expenditures ............................................................... 29
Figure 37: FLSA & GEN Overtime as a % of Total Overtime......................................................................... 30
Figure 38: Financial Revenue Assumptions................................................................................................... 31
Figure 39: Financial Expenditure Assumptions ............................................................................................ 32
Figure 40: Scenario—Forecast, All Funds ..................................................................................................... 33
Figure 41: Scenario—Forecast, General Fund Budget .................................................................................. 34
Figure 42: Scenario—Reserve Ending Balances for all Funds ....................................................................... 34
Figure 43: Scenario—General Fund Reserves as a % of General Fund Expenditures .....................................35
Figure 44: Best Practices in Financial Management .................................................................................... 36
Figure 45: Baseline Management Components ............................................................................................ 37
Figure 46: Regulatory Documents ............................................................................................................... 40
Figure 47: Organizational Communications ................................................................................................ 41
Figure 48: Recordkeeping and Document Control....................................................................................... 43
Figure 49: Critical Issues Defined ................................................................................................................ 44
Figure 50: Station 1 ..................................................................................................................................... 49
Figure 51: Station 2—Storage Facility ......................................................................................................... 50
Figure 52: Station 3 ...................................................................................................................................... 51
Figure 53: Station 4 ..................................................................................................................................... 52
Figure 54: Station 5 ......................................................................................................................................53
Figure 55: Station 6 ..................................................................................................................................... 54
Figure 56: Station 7 ..................................................................................................................................... 55
Figure 57: Station 8 ..................................................................................................................................... 56
Figure 58: Station 9—Maintenance Facility .................................................................................................. 57
Figure 59: Station 10—Training Facility ....................................................................................................... 58
Figure 60: Administrative Building .............................................................................................................. 59
Figure 61: Apparatus By Station .................................................................................................................. 60
Figure 62: Capital Assets, Capital Improvement, and Replacement Programs ............................................ 62
Figure 63: Apparatus Replacement Tables .................................................................................................. 63
Figure 64: MVFR Service Demand ............................................................................................................... 65
Operational & Management Assessment Mountain View Fire Rescue
175
Figure 65: Service Demand by Type for 2015 and 2016 ............................................................................... 67
Figure 66: Comparison of Number of Incidents per 1,000 Population .......................................................... 68
Figure 67: Two-Year Frequency of Incidents by Type .................................................................................. 68
Figure 68: Monthly Response Workload, 2016 ............................................................................................ 69
Figure 69: Daily Response Workload, 2016 ................................................................................................. 69
Figure 70: Service Demand by Hour of Day, 2016 .........................................................................................70
Figure 71: Responses by Station, 2016 .........................................................................................................70
Figure 72: Incident Density Map for All Incidents ..........................................................................................72
Figure 73: Fire Incident Density Map, 2015–2016 .......................................................................................... 73
Figure 74: MVFR Population Density Map ................................................................................................... 74
Figure 75: Travel Times and Locations of Calls ............................................................................................. 75
Figure 76: Engine Distribution per ISO Criteria ............................................................................................. 77
Figure 77: Truck Distribution per ISO Criteria ...............................................................................................78
Figure 78: Distance based on Travel Time ................................................................................................... 79
Figure 79: Four-Minute Travel Time Coverage ............................................................................................ 80
Figure 80: Response Time Segment—NFPA Standard and MVFR Standard Comparison ............................ 82
Figure 81: Call Processing Time Performance—90th Percentile, 2016 .......................................................... 82
Figure 82: Turnout Time Performance at the 90th Percentile ..................................................................... 83
Figure 83: Turnout by Hour of Day .............................................................................................................. 83
Figure 84: Travel Time Performance ........................................................................................................... 84
Figure 85: Actual Travel Time Performance Map, 2015 and 2016 ................................................................ 85
Figure 86: Travel Time by Hour of Day ........................................................................................................ 86
Figure 87: Actual Performance to MVFR Standards......................................................................................87
Figure 88: Total Response Time ...................................................................................................................87
Figure 89: Resource Concentration Analysis Based on a Ten-Minute Travel Time ....................................... 89
Figure 90: MVFR Concurrent Incidents 2016 ............................................................................................... 90
Figure 91: MVFR Unit Hour Utilization (UHU) .............................................................................................. 91
Figure 92: Response Unit Workload ............................................................................................................ 92
Figure 93: Planning for Fire and Emergency Medical Services ..................................................................... 94
Figure 94: Record Management ................................................................................................................ 100
Figure 95: Compensation Summary ........................................................................................................... 103
Figure 96: Salary Comparisons, 2015 ........................................................................................................ 106
Figure 97: Additional Comparative Salaries ................................................................................................ 107

Operational & Management Assessment Mountain View Fire Rescue
176
Figure 98: Fire Chief Salary Comparison ................................................................................................... 108
Figure 99: Administrative and Support Staff .............................................................................................. 114
Figure 100: Staffing .................................................................................................................................... 118
Figure 101: MVFR Training Division Administrative Components .............................................................. 122
Figure 102: MVFR Training Records & Recordkeeping ............................................................................... 123
Figure 103: MVFR General Training Competencies..................................................................................... 123
Figure 104: MVFR Training Methodologies ............................................................................................... 124
Figure 105: 2016 MVFR Training Activities ................................................................................................. 125
Figure 106: Training Facilities & Resources ................................................................................................ 125
Figure 107: Fire Prevention Program Components .................................................................................... 128
Figure 104: “Fire Prevention Division” Organizational Chart (2017) ........................................................... 129
Figure 109: General Inspection Program ................................................................................................... 129
Figure 110: Recommended Fire Inspection Frequencies ............................................................................. 130
Figure 111: Fire Prevention Code Enforcement Observations ..................................................................... 130
Figure 112: New Construction Inspections & Involvement Observations .................................................... 131
Figure 113: Fire-Cause Determination & Investigation Observations .......................................................... 132
Figure 114: Public Education & Prevention Activities ................................................................................. 133
Figure 115: Statistical Collection & Data Analysis ....................................................................................... 134
Figure 112: Steps for Developing CRR Plan ................................................................................................ 134
Figure 117: MVFR Rescue Unit Service-Demand (2015–2016) .................................................................... 140
Figure 118: Time Committed to Incidents by Rescue Units (2016) .............................................................. 141
Figure 119: Concurrent EMS Incidents (2015 & 2016) ................................................................................. 141
Figure 120: Typical UHU Thresholds by Service Types .............................................................................. 142
Figure 121: General Utilization Scale ......................................................................................................... 142
Figure 122: MVFR Rescue Unit UHU Rates (2015–2016) ............................................................................. 143
Figure 123: Engine EMS Response Times at the 90th Percentile by Population (2015–2016) ..................... 144
Figure 124: Rescue Turnout Times at the 90th Percentile (2015 & 2016) .................................................... 144
Figure 125: Rescue Response Times at the 90th Percentile by Population Density (2015–2016) .................. 145
Figure 126: Comparison of EMS Average Response Times by Unit (2015–2016) ......................................... 145
Figure 127: Transport Destinations by MVFR Rescues (2016) .................................................................... 146
Figure 128: Transport & Patient Offload Times at the 90th Percentile (2015–2016) ................................... 147
Figure 129: MVFR Rescue Transport & Unit-Hour Costs & Margins (2014–2016) ....................................... 148
Figure 130: Municipal Planning Areas within MVFR .................................................................................... 152
Operational & Management Assessment Mountain View Fire Rescue
177
Figure 131: Historical Growth from 1980 to 2015 ........................................................................................ 153
Figure 132: Assumed Rates of Growth by Historical Trend ......................................................................... 153
Figure 133: Municipalities and Fire District Population Projections ............................................................. 154
Figure 134: Projected Growth 2015–2035 ................................................................................................... 154
Figure 135: Comparison of Growth Assumptions ........................................................................................ 155
Figure 136: Projected Service Demand—2015 and 2016 compared to 2035 ................................................ 156
Figure 137: Population over 65 in 2015 and 2035......................................................................................... 157
Figure 138: 100-Year Flooding Potential Map ............................................................................................. 158
Figure 139: Hail Storms, 1950–2015............................................................................................................ 159
Figure 140: Tornadoes, 1950–2015 ............................................................................................................ 160
Figure 141: Vegetation Map ....................................................................................................................... 161
Figure 142: Wildland Urban Interface Home Density Map ......................................................................... 162
Figure 143: Wildland Urban Interface Risk Map .......................................................................................... 163
Figure 144: Oil and Gas Wells Map ............................................................................................................ 164
Figure 145: Computer-Optimized Location of Four Additional Stations ..................................................... 167

Operational & Management Assessment Mountain View Fire Rescue
178
Appendix B: Organizational Culture and Context At Mountain View Fire Rescue
A Report Supporting the MVFR Master Plan
Patricia B. Sikora, Ph.D., May 12, 2017
METHODS
Two phases of research were conducted to support RFP emphases on Leadership and
Communication at MVFR:
1. Qualitative Research (February 26–March 3, 2017) • 14 mini groups/in-depth interviews conducted across the organization touching all shifts, senior
leaders, union membership, board members, and station officers.
• Content analysis conducted to identify key themes and language for survey design.
2. Online Survey (March 20–April 5, 2017) • All personnel invited to participate (excluding board).
▪ 101 responses for 79% response rate.
• Survey content based on qualitative findings as well as employee engagement measurement best
practice.
• Each topic area in the survey included quantitative items (primarily 5-point agree/disagree scales)
and open-ended questions.
▪ Top and bottom two boxes (Strongly agree + agree; and Strongly disagree + disagree)
reported for most questions.
▪ Group differences: 19 individuals declined to identify their role in the organization and are
excluded from that analysis.
▪ Representative comments reflecting major themes are included.
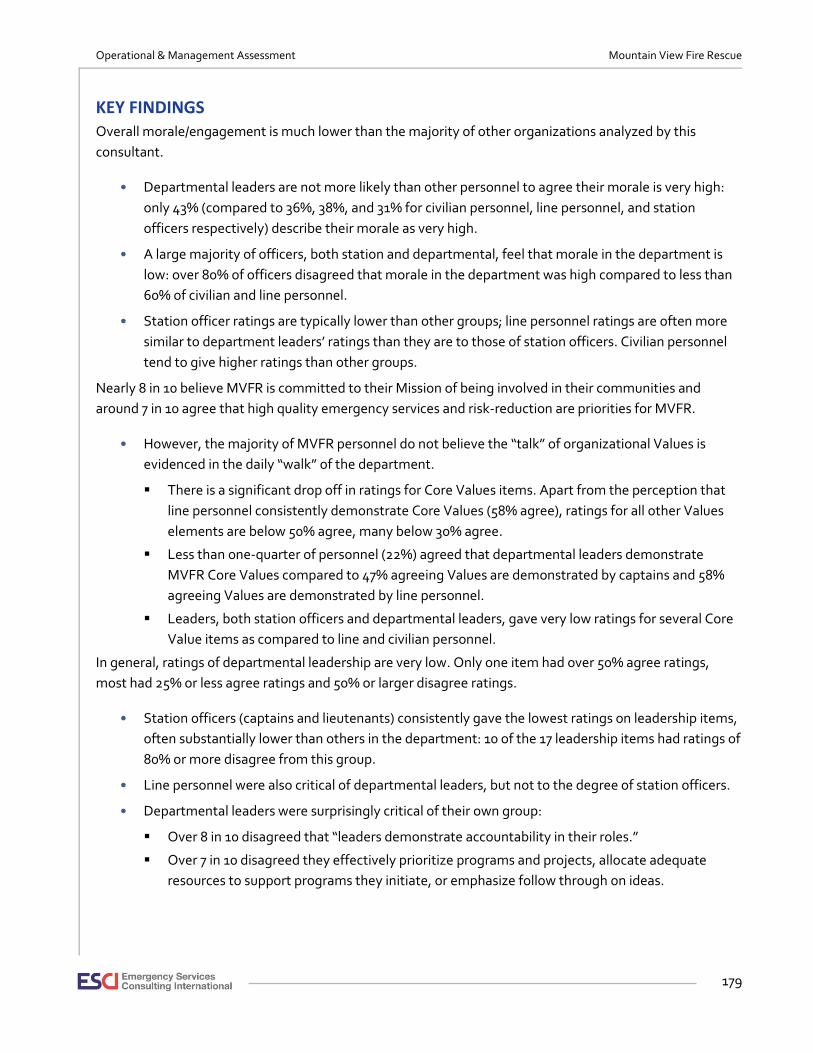
Operational & Management Assessment Mountain View Fire Rescue
179
KEY FINDINGS Overall morale/engagement is much lower than the majority of other organizations analyzed by this
consultant.
• Departmental leaders are not more likely than other personnel to agree their morale is very high:
only 43% (compared to 36%, 38%, and 31% for civilian personnel, line personnel, and station
officers respectively) describe their morale as very high.
• A large majority of officers, both station and departmental, feel that morale in the department is
low: over 80% of officers disagreed that morale in the department was high compared to less than
60% of civilian and line personnel.
• Station officer ratings are typically lower than other groups; line personnel ratings are often more
similar to department leaders’ ratings than they are to those of station officers. Civilian personnel
tend to give higher ratings than other groups.
Nearly 8 in 10 believe MVFR is committed to their Mission of being involved in their communities and
around 7 in 10 agree that high quality emergency services and risk-reduction are priorities for MVFR.
• However, the majority of MVFR personnel do not believe the “talk” of organizational Values is
evidenced in the daily “walk” of the department.
▪ There is a significant drop off in ratings for Core Values items. Apart from the perception that
line personnel consistently demonstrate Core Values (58% agree), ratings for all other Values
elements are below 50% agree, many below 30% agree.
▪ Less than one-quarter of personnel (22%) agreed that departmental leaders demonstrate
MVFR Core Values compared to 47% agreeing Values are demonstrated by captains and 58%
agreeing Values are demonstrated by line personnel.
▪ Leaders, both station officers and departmental leaders, gave very low ratings for several Core
Value items as compared to line and civilian personnel.
In general, ratings of departmental leadership are very low. Only one item had over 50% agree ratings,
most had 25% or less agree ratings and 50% or larger disagree ratings.
• Station officers (captains and lieutenants) consistently gave the lowest ratings on leadership items,
often substantially lower than others in the department: 10 of the 17 leadership items had ratings of
80% or more disagree from this group.
• Line personnel were also critical of departmental leaders, but not to the degree of station officers.
• Departmental leaders were surprisingly critical of their own group:
▪ Over 8 in 10 disagreed that “leaders demonstrate accountability in their roles.”
▪ Over 7 in 10 disagreed they effectively prioritize programs and projects, allocate adequate
resources to support programs they initiate, or emphasize follow through on ideas.
Operational & Management Assessment Mountain View Fire Rescue
180
Despite perceptions of “us versus them” expressed by several personnel in interviews, ratings of captains
tended to be higher than other survey items, notably higher than personnel ratings of departmental
leaders.
• However, there was a distinctively low rating for consistency across captains: over half disagreed
there was consistency in management of personnel in the stations.
• Several items had “split” ratings, i.e., same percent of disagree as agree: admitting mistakes,
coaching and mentoring, and recognizing over and above performance.
• Departmental leaders often gave lower, sometimes substantially lower, ratings to their captains
than did line personnel.
Polarized ratings in several key areas suggest disconnects within the leadership ranks and high potential for
mixed messages and inconsistent leadership both in the stations and in the department as a whole.
• Leaders were sometimes divided when evaluating their own peer group.
▪ Roughly half of departmental leaders agree their leader peers demonstrate Core Values
whereas another half disagree.
▪ Ratings were strongly divided on transparency is valued by leaders, I have confidence in
managerial skills of leaders, and financial decisions consistently support our mission to lead in
risk reduction efforts or maintain an effective/efficient safety net of emergency services.
▪ Leaders are split as to whether information about new policies/changes is communicated
effectively or if they are given information necessary to help them understand decisions made
by leadership
• There is also inconsistency in the captain ranks as noted above; interviews and open-ended
comments suggest two distinct “types” of captains: authoritarian/punitive/senior management-
focused and collaborative/supportive/line-focused.
• Mentoring, coaching, and leadership encouragement for professional development (Career Path
questions) is another area where personnel are polarized and appear to be interacting with two
different types of officers.
Ratings around Communication are generally weak with many items receiving twice as many negative as
positive ratings.
• Only two items had ratings over 50% agree: I feel comfortable sharing concerns/mistakes with my
supervisor and my officer/supervisor communicates clear expectations.
• Very low ratings indicate people are unwilling to share bad news, unable or unwilling to give/receive
constructive criticism, certain people may be more in the know than others as information is
unevenly distributed, and there appears to be an orientation toward blaming rather than problem
solving. These patterns set the stage for and reinforce distrust.
• Low ratings on the impact of committee work or “new ideas are welcome here” indicate lack of
openness to input from personnel and likely contribute to weak perceptions of organization
innovation and willingness to change.

Operational & Management Assessment Mountain View Fire Rescue
181
Just over half of employees (58%) agree their effort is connected to promotion opportunities, implying a
significant minority of personnel may not be sure that what they do on a day to day basis has bearing on
their progress in the organization.
• Just over one-third of personnel believe the right people usually get promoted into leadership
positions at MVFR. Even leaders are not sure the right people get promoted: only 43% agreed that
the right people get promoted into top leadership roles.
• Civilian personnel give relatively low marks for career paths items, especially compared to their
tendency to give higher marks elsewhere in the survey.
• Department leaders may be resistant to having line input into the hiring or promotion process: 57%
agree this would be helpful, compared to 75% of station officers and 82% of line personnel.
• No department leader and only one station officer agreed that education is the best way to
evaluate new people while roughly 2 in 10 line personnel agreed. Line personnel are much more
likely to agree that job experience is the best way to evaluate prospective hires or new officers with
nearly 8 in 10 agreeing with this statement compared to only 44% of station officers and 29% of
department leaders.
Schedules, physical environment, and tools/equipment do not appear to be primary concerns for personnel.
However, budgets and information technology are perceived to be areas of weakness in accomplishing
day-to-day work at MVFR.
• Budgets do not always overtly connect to the Mission of the organization and there are mixed
feelings about the ease of getting needed funds and the ability to effectively manage a budget once
it is place: for some it appears to be easy, for others it is not.
• Information technology items received large disagree ratings (60% range). Interviewees often
noted the organization was substantially behind in technology and many perceived a strong
resistance to automating functions that still relied too much on processing piles of paper.
• Civilian personnel gave substantially higher ratings to budget and information technology items as
compared to others in the organization.
▪ Half of civilian personnel agreed budgets were in line with a mission to provide quality service
whereas 71% of departmental leaders disagreed.
▪ 43% of civilian staff agreed that information technology supports efficient work in the
department, compared to 18% of line personnel and 0% of station officers and department
leaders.
• Less than one-quarter agreed the approach to staffing supported cohesion in the stations.
▪ Line personnel are the most likely to disagree: 71% disagree compared to 38% of station
officers, 43% of department leaders, and 21% of civilian personnel.
▪ Several people (across levels) indicated this seemed to be a deliberate way for previous
leadership to reduce cohesion in the rank-and-file and keep personnel off-kilter.

Operational & Management Assessment Mountain View Fire Rescue
182
In terms of areas of focus for the next year, personnel gave top priority ratings (combined extremely and
very important) to building internal relationships, leadership development, and the dispatch system.
• There was remarkable consistency across groups regarding top priorities. Building relationships and
fixing the dispatch system are viewed as top priorities by almost all groups (civilians were less likely
to give high priority to the dispatch system).
• Building new stations was the lowest priority among all employees and most saw
mergers/consolidations as a low priority in the coming year. The focus for most appears to be on
fixing what is inside the organization before expanding externally.
Two-thirds of personnel believe the department needs to look outside for top leadership positions.
• Over half disagreed and less than one-quarter agreed that current leaders are the right people to
lead MVFR into the future.
• Department leaders and line personnel were more likely than other groups to agree that “we need
to look at outside candidates for top leadership positions:” roughly 70% of each group agreed
compared to just over 50% of civilians and station officers.
• 81% of station officers disagreed that the current leaders are the right people to lead into the future
versus 56% of line, 43% of civilians, and 29% of department leaders (only 43% of department
leaders agreed with this statement).
▪ There are very mixed ratings for confidence that survey results will be used to help the
department improve: about one-third disagree, one-third agree, and another third are “on the
fence.”

Operational & Management Assessment Mountain View Fire Rescue
183
RECOMMENDATIONS • Accountability starts at the top. Leaders should decide who MVFR wants to be, identify core
behaviors that need to be changed or built on to align with that identity, and persistently insist that
all officers (especially at the top) and personnel demonstrate those behaviors on a day-to-day basis.
Ask people, particularly officers, to leave the organization if they are unwilling to actively support
the new culture.
• Don’t create more posters. Change behavior across levels. Without a walk that is consistent with
the talk, substantial change in any other area is unlikely.
• Transparency builds trust and information is power. If there is a desire to create a culture that builds
trust, shares power with more than a select few, and values and acts on accountability at all levels,
the results of this survey should be shared with all personnel and all personnel should play an active
role in helping the organization improve.
• Build relationships using the Mission as the rallying point. The vast majority of firefighters join the
fire service because of desire to be part of a team and strong desire to help people. Return to this
core identity and sense of purpose. Use “why we’re here” as the glue for MVFR.
• Look outside for a new chief who has a reputation for relationship building/people skills, as well as
operational excellence. Include interviews or input from his/her subordinates to confirm their ability
to build a cohesive, efficient/effective team.
• Work with job descriptions and create unambiguous behavioral expectations for captains to reduce
inconsistency in management of station personnel. Hold every captain accountable for walking the
talk of the desired culture.
• Bust the glass ceiling. Promote people who have consistently demonstrated desired behaviors as
well as rock solid job performance. Ask line personnel for their opinions around potential officers:
are they trusted, highly skilled, collaborative leaders or “good on paper.”
• Work to stabilize the staffing model in the stations. If people don’t need to be shuffled, don’t
shuffle them. Let personnel form bonds to enhance camaraderie and boost efficiency on calls.
• Encourage bottom up input and influence. Form committees to address specific issues in this or the
larger Master Plan report. Ensure committees are more than symbolic gestures but sources of
valued insight and drivers of street smart innovation. “Take the handcuffs off your personnel” and
let them be part of the solution and success of MVFR—they want to be.
• Bring in training in “Critical Conversations” and other communication skills so individuals and
groups can wrestle with difficult issues without fueling the flames of antagonism and distrust.
• Automate information processing and put in systems to increase administrative efficiency as well
as democratize access to information. Do not allow individuals to actively or passively resist change
that is essential for both the effective functioning of the department and creating a culture of
transparency and shared accountability.
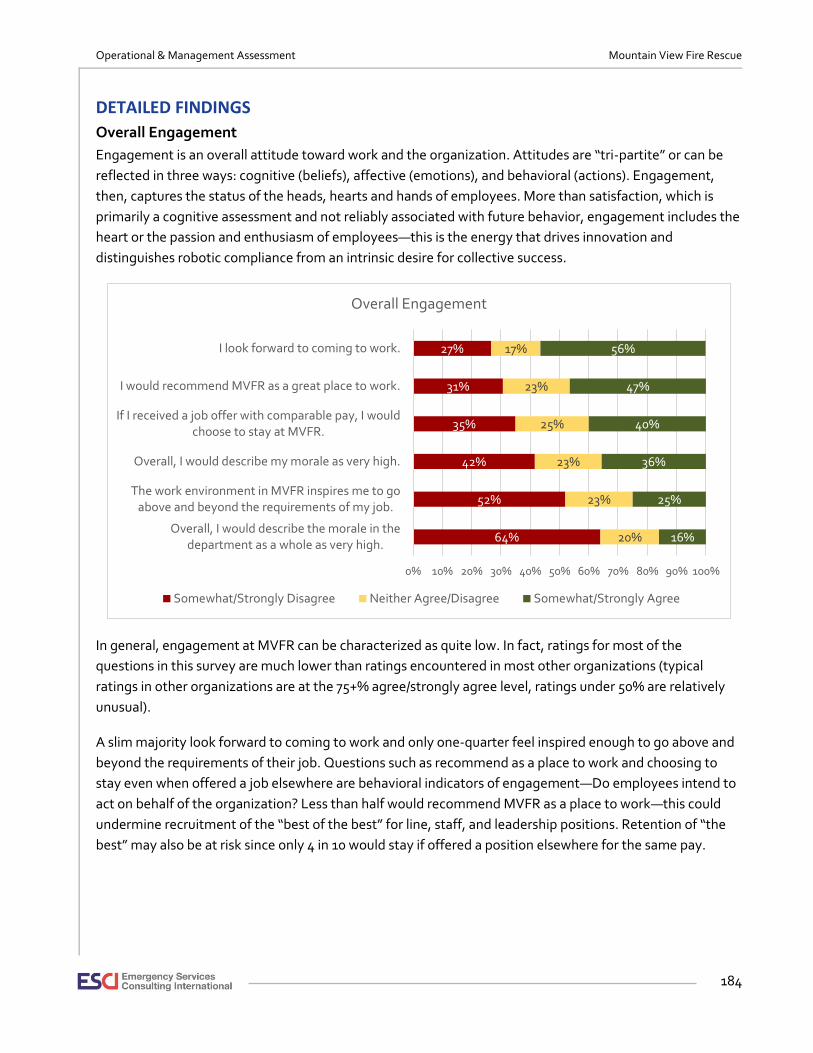
Operational & Management Assessment Mountain View Fire Rescue
184
DETAILED FINDINGS
Overall Engagement
Engagement is an overall attitude toward work and the organization. Attitudes are “tri-partite” or can be
reflected in three ways: cognitive (beliefs), affective (emotions), and behavioral (actions). Engagement,
then, captures the status of the heads, hearts and hands of employees. More than satisfaction, which is
primarily a cognitive assessment and not reliably associated with future behavior, engagement includes the
heart or the passion and enthusiasm of employees—this is the energy that drives innovation and
distinguishes robotic compliance from an intrinsic desire for collective success.
In general, engagement at MVFR can be characterized as quite low. In fact, ratings for most of the
questions in this survey are much lower than ratings encountered in most other organizations (typical
ratings in other organizations are at the 75+% agree/strongly agree level, ratings under 50% are relatively
unusual).
A slim majority look forward to coming to work and only one-quarter feel inspired enough to go above and
beyond the requirements of their job. Questions such as recommend as a place to work and choosing to
stay even when offered a job elsewhere are behavioral indicators of engagement—Do employees intend to
act on behalf of the organization? Less than half would recommend MVFR as a place to work—this could
undermine recruitment of the “best of the best” for line, staff, and leadership positions. Retention of “the
best” may also be at risk since only 4 in 10 would stay if offered a position elsewhere for the same pay.
64%
52%
42%
35%
31%
27%
20%
23%
23%
25%
23%
17%
16%
25%
36%
40%
47%
56%
0% 10% 20% 30% 40% 50% 60% 70% 80% 90% 100%
Overall, I would describe the morale in thedepartment as a whole as very high.
The work environment in MVFR inspires me to goabove and beyond the requirements of my job.
Overall, I would describe my morale as very high.
If I received a job offer with comparable pay, I wouldchoose to stay at MVFR.
I would recommend MVFR as a great place to work.
I look forward to coming to work.
Overall Engagement
Somewhat/Strongly Disagree Neither Agree/Disagree Somewhat/Strongly Agree

Operational & Management Assessment Mountain View Fire Rescue
185
Morale is a useful term to use in employee surveys: per Webster, it is 1) the mental and emotional condition
(such as enthusiasm or confidence) of an individual or group, 2) a sense of common purpose with respect to
a group and, 3) the level of individual psychological well-being based on such factors as a sense of purpose
and confidence in the future. Just over one-third agree their own morale is very high and a very low 16%
would agree morale in the department as a whole is very high. These results indicate very low energy,
passion, or sense of purpose across MVFR.
Group Differences
In general, station officer (captain and lieutenant) ratings are lower than other groups across all items in the
survey; e.g., 69% disagreed they were inspired to go above and beyond the requirements of their job
compared to 43% of civilians and departmental leaders and 56% of line personnel.
Departmental leaders are not more likely than other personnel to agree their morale is very high: only 43%
(compared to 36%, 38%, and 31% for civilian personnel, line personnel, and station officers respectively)
describe their morale as very high. A large majority of officers, both station and departmental, feel that
morale in the department is low: over 80% of officers disagreed that morale in the department was high
compared to less than 60% of civilian and line personnel. And roughly one-quarter of officers would
recommend MVFR as a great place to work compared to about half of civilian and line personnel.
Open-Ended Comments
Personnel are devoted to providing the best possible service to their community; i.e., they are highly
engaged in their jobs. However, the organizational environment saps energy and drains enthusiasm for
helping MVFR be the best it can be.
I think as a department we have made great strides, but it seems like we could soar as a
department with a much more positive work environment in place. MVFR, simply put, has
been run on fear tactics the last 5–7 years, and that spawns everything from low morale, to
poor attitudes, etc. I think we appear great on the outside, but on the inside we are a bit of a
mess. Again, we deliver great service etc. due to the efforts of the crews on the street. We
are all the types of people that know how to deal with adversity and how to overcome to
get a positive result. If the department was truly behind us, imagine how much better we
could be.
All of us really love what we do and want to be the best in the business. No doubt. But we
have not had a true voice for so long, the true spirit of the organization (the crews on the
street) is not being heard.
At all levels of our organization, we have people who are passionate and are willing and
wanting to make this department the best department it can be.
We have a great group of employees working within this organization, and very few are
allowed to perform their roles to the best of their ability. Instead of micromanaging and
oppressing, we should empower our people to drive this department forward.

Operational & Management Assessment Mountain View Fire Rescue
186
The strength of our department is our line personnel, Lieutenants and below. Many times
we are given some unfair, unrealistic, and ridiculous reasoning for why things are the way
they are, but we continue to show up, work hard, and give the District what we have left,
after Administration, BC's, and Captains do their best to 'beat us down' with their crap.
The general attitude is duck and cover.
Mission and Values
The language in many of these questions was derived from MVFR posters and website. These are the
Mission elements and Values that are articulated as important or core to the organization. The key question
is: Are these important cultural elements truly lived in the organization? Does the “walk” of day-to-day
experience match up with “talk?” Questions around trust, unity, and cooperation with other departments
were added as a result of being consistent themes mentioned in open-ended interviews.
Mission elements of being involved in the communities MVFR serves, providing high quality emergency
services to citizens, and emphasizing risk-reduction for the community receive some of the highest ratings
in the survey. Nearly 8 in 10 believe MVFR is committed to being involved in their communities and around
7 in 10 agree that high quality emergency services and risk-reduction are priorities for the organization.
55%
50%
36%
54%
42%
21%
16%
19%
5%
17%
19%
29%
9%
11%
20%
17%
10%
16%
28%
31%
35%
37%
47%
58%
68%
71%
79%
0% 10% 20% 30% 40% 50% 60% 70% 80% 90% 100%
We treat each other with respect regardless ofposition or role in the department.
We are united in our sense of purpose here.
We are focused on continuous improvement.
I do not worry about being punished if I follow myconscience and do the right thing for the right…
I feel like I am trusted to do the right thing.
Our Core Values are consistently demonstrated byline personnel.
We emphasize risk-reduction efforts for ourcommunity.
Providing high quality emergency services tocitizens is the #1 priority for the department.
We are committed to being involved in thecommunities we serve.
Mission and Values –Top Rated (% Agree)
Somewhat/Strongly Disagree Neither Agree/Disagree Strongly/Somewhat Agree
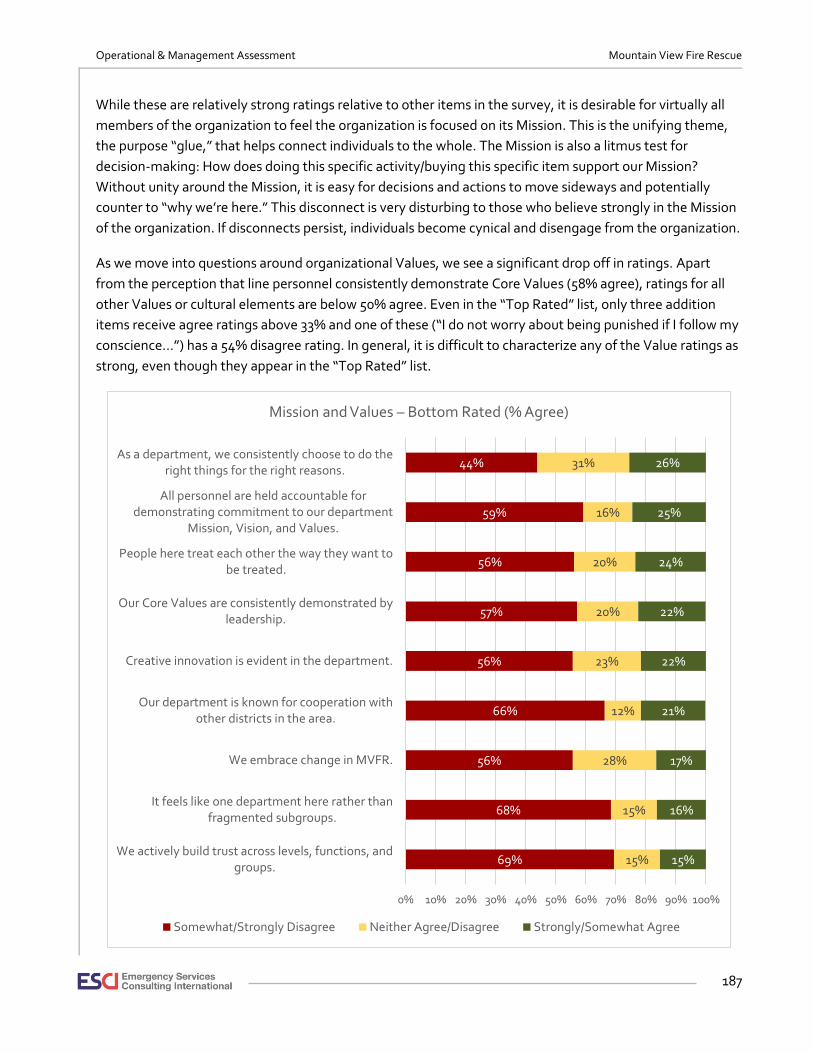
Operational & Management Assessment Mountain View Fire Rescue
187
While these are relatively strong ratings relative to other items in the survey, it is desirable for virtually all
members of the organization to feel the organization is focused on its Mission. This is the unifying theme,
the purpose “glue,” that helps connect individuals to the whole. The Mission is also a litmus test for
decision-making: How does doing this specific activity/buying this specific item support our Mission?
Without unity around the Mission, it is easy for decisions and actions to move sideways and potentially
counter to “why we’re here.” This disconnect is very disturbing to those who believe strongly in the Mission
of the organization. If disconnects persist, individuals become cynical and disengage from the organization.
As we move into questions around organizational Values, we see a significant drop off in ratings. Apart
from the perception that line personnel consistently demonstrate Core Values (58% agree), ratings for all
other Values or cultural elements are below 50% agree. Even in the “Top Rated” list, only three addition
items receive agree ratings above 33% and one of these (“I do not worry about being punished if I follow my
conscience…”) has a 54% disagree rating. In general, it is difficult to characterize any of the Value ratings as
strong, even though they appear in the “Top Rated” list.
69%
68%
56%
66%
56%
57%
56%
59%
44%
15%
15%
28%
12%
23%
20%
20%
16%
31%
15%
16%
17%
21%
22%
22%
24%
25%
26%
0% 10% 20% 30% 40% 50% 60% 70% 80% 90% 100%
We actively build trust across levels, functions, andgroups.
It feels like one department here rather thanfragmented subgroups.
We embrace change in MVFR.
Our department is known for cooperation withother districts in the area.
Creative innovation is evident in the department.
Our Core Values are consistently demonstrated byleadership.
People here treat each other the way they want tobe treated.
All personnel are held accountable fordemonstrating commitment to our department
Mission, Vision, and Values.
As a department, we consistently choose to do theright things for the right reasons.
Mission and Values – Bottom Rated (% Agree)
Somewhat/Strongly Disagree Neither Agree/Disagree Strongly/Somewhat Agree

Operational & Management Assessment Mountain View Fire Rescue
188
When reviewing the “Bottom Rated” items (above), there is a heavy skew toward disagree—that is, the
majority of MVFR personnel do not believe the “talk” of organizational Values is evidenced in the daily
“walk” of the department. Accountability, cooperation with others, innovation, embracing change, and
trust are crucial for sustained success. An organization might survive without these, but it cannot thrive
over the long haul. Even if the organization looks good on the outside or on paper, eventually a toxic
internal environment will reveal itself in performance and reputation. Like a shiny apple rotten at the core,
soft spots surface and eventually these small blemishes take over the exterior.
Lack of consistency by leadership in demonstrating Core Values likely contributes to inconsistency in the
Values “walk” for the department. Less than one-quarter of personnel (22%) agreed that departmental
leaders demonstrate MVFR Core Values compared to 47% agreeing that the Values were demonstrated by
captains and 58% agreeing that the Values were demonstrated by line personnel. The latter two scores,
while certainly higher, are not indicative of universal adherence to what are highlighted (on paper) as the
Core Values of the organization. If Values are not a priority for leadership—as demonstrated by behavior
more than words—they will not be a priority in the stations or hallways at headquarters.
Group Differences
Overall, station officer ratings are consistently lower than other groups; in fact, line personnel ratings are
often more similar to department leaders’ ratings than to those of station officers. Civilian personnel tend
to give higher ratings to these items than other groups.
While everyone tends to agree that MVFR is “committed to being involved in the communities they serve,”
line personnel and station officers are less likely to agree that providing high quality emergency services is
the #1 priority for the department (one of only two items where these two groups are in alignment, the
other being relatively lower ratings on “we consistently do the right things for the right reasons”) while
station officers and department leaders are less likely to agree that MVFR emphasizes risk reduction efforts
in the community.
57%
21%
21%
20%
32%
20%
22%
47%
58%
0% 10% 20% 30% 40% 50% 60% 70% 80% 90% 100%
Our Core Values are consistently demonstrated byleadership.
Our Core Values are consistently demonstrated byour captains.
Our Core Values are consistently demonstrated byline personnel.
Values
Somewhat/Strongly Disagree Neither Agree/Disagree Somewhat/Strongly Agree
Operational & Management Assessment Mountain View Fire Rescue
189
Departmental leaders are somewhat less likely to agree that line personnel consistently demonstrate Core
Values, whereas line personnel and station officers are much more likely to disagree that departmental
leaders demonstrate Core Values. Interestingly, we see a pattern of “bipolar” ratings from departmental
leaders: roughly half of departmental leaders agree their leader peers demonstrate Core Values whereas
another half disagree. Other Values items where this is evident is “I feel like I am trusted to do the right
thing” and “I do not worry about being punished….” These results, along with polarized leader ratings on
several Leadership items (see below), suggest there may be two distinct sets of attitudes at the very top of
the organization. This may lead to mixed messages to the organization in both words and actions.
Leaders, both station officers and departmental leaders, gave low ratings for other key items relative to line
and civilian personnel:
• Over 70% disagree that the organization embraces change versus roughly half of line and civilian
personnel.
• 8 in 10 station officers and 7 in 10 departmental leaders disagree that “we treat each other with
respect regardless of position or role in the department” compared to roughly 4 in 10 of line and
civilian personnel.
• Nearly 9 in 10 station officers (88%) and 7 in 10 departmental leaders disagree that “we actively
build trust across levels, functions and groups” compared to 57% of civilians and 62% of line
personnel.
• Three-quarters of station officers and departmental leaders disagreed that people treat each other
the way they want to be treated compared to roughly 50% of other personnel.
• 8 in 10 station officers and 7 in 10 departmental leaders disagree that “all personnel are held
accountable for demonstrating commitment to our department Mission, Vision, and Values” as
compared to 6 in 10 line personnel and one-third of civilians.
• Over 8 in 10 station officers and departmental leaders disagreed that “it feels like one department
here rather than fragmented subgroups” compared to 50% of civilian and 66% of line personnel.
These low ratings on crucial culture elements from leaders and officers suggest they are not able (or
willing?) to create an organizational culture that consistently supports basic “what we learned in
Kindergarten” behaviors much less organizational Values or unity in the department.
Open-Ended Comments
We are our worst enemy. In regards to weakness, we need to get through the first step of
denial.
Who are we here for? Roots of divisiveness may start with differences in opinions regarding who the
department is here to serve: “the taxpayer” or “citizens.”
Taxpayer focus means financial decisions are paramount. The line is in service of the financial priorities of
the organization.
Operational & Management Assessment Mountain View Fire Rescue
190
The us versus them attitude among line personnel is very distressing; no teamwork
between line and admin, no matter how hard admin tries to bridge the gap.
Only a portion of the people try to do what is right for the taxpayer of the district.
Need business/financial experience on the Board of Directors; not people with agendas who
don't understand and don't trust or believe staff. Need to support and represent the
taxpayers.
We have a lot of great employees doing the right things for the right reasons; they care
about the District and each other. The institutional knowledge and experience they provide
is priceless. At this point in time, we are debt-free and doing a great job financially.
The board of directors could stop micromanaging in every part of the department's
business. The Union could stop with their desire to run the department.
There is a fear that all the money will be spent and people will be laid off.
Directors and leaders need to consider all employees; not just CBA/line employees when
looking at all facets of the organization. Directors and leaders also need to do what is best
for the taxpayers/citizens/voters of the District they were elected to serve; not just the
CBA/line employees.
Labor believes we have an endless amount of money.
Look at the organization at a whole and not just boots on the ground and what the Union
wants.
A focus on citizens means EMS/Fire Services (and serving) is priority. Finances (and administration) are in
service of the those directly serving citizens.
There has been an obvious division created between the line personnel and upper
management which has bred an environment of distrust. Our line personnel are the heart
and soul of this organization, any emergency service for that matter, so there needs to be
support and trust for those personnel to be effective in their jobs.
The crews take care of our citizens regardless of what has occurred at the upper level of our
administration. That is why there was a 93% approval rating when the survey was
completed several years ago.
We have a lot of strong people in our organization that would bleed for this place, and for
those next to us, and for our citizens. Empower all of us more, and reward our efforts to
make this place great and sky will be the limit.
Operational & Management Assessment Mountain View Fire Rescue
191
Administration has lost sight of the reason they are here which is to support line personnel
in any way possible so that we can deliver quality service to the citizens we serve.
Our personnel are the most important piece of the puzzle. The front line work group is the
most important and largest piece. We need to be supported from the top down. To be a
successful organization, support services are just that.
It all goes back to servicing the citizens and supporting the people who actually do so.
“Posters on the wall” do not reflect reality. Creating more ill-will than goodwill due to large gap between
rhetoric and day-to-day experience.
These Mission, Vision, and Values are just a facade, and create an image that we are
something we are not.
I'm concerned that we are currently the antithesis of our mission, vision, and values. We do
not support one another; the administration does not trust its members, and anyone
looking to make a positive change or challenge the status quo (for the better) is penalized.
We do not treat others the way we want to be treated. We consistently have people being
excluded from input in our department and we have mistreated our employees by
screaming at them and writing them up for things we have not trained them on.
Core Values? This is a disaster in our organization. Our leadership at the top levels has
become very autocratic. The management style is extremely punitive and more times than
not without good cause. It also isn't equal across the board. Some people are attacked by a
superior for seemingly no real reason other than they can.
Past and current administration did not demonstrate any behaviors regarding our mission,
vision or values. If it benefited them, or made them look like they were doing their jobs, it
was done. We created an atmosphere where there is no trust, where officers are afraid to
make decisions due to the actions of higher ranking officers.
“Accountability” needs to be clearly defined—is it ownership or punitive management? Who is
accountable? Everyone or just some people? Where is the “inconsistency?”
One issue has been the inconsistency between command staff to hold people accountable.
Unfortunately, when an officer holds someone accountable when no other officer has, then
there is terrible resentment toward the officer who held them accountable.
They say one thing and do another—but the real kicker is they don't recognize that they are
so inconsistent.
Operational & Management Assessment Mountain View Fire Rescue
192
We have way too many guiding documents (AOG's/EOG's) that can be interpreted
differently and applied in a manner that is inconsistent. Which then causes an accountability
issue and allows individual leaders to pick and choose how they conduct business. Also,
there are conflicting guiding documents that further complicate things. So, if you have an
individual/s in leadership positions, which we do, that push their personal agendas there is
too much space for them to manipulate the rules and target people. Basically, there are
leaders that get away with major infractions and there is no recourse for the individuals
being targeted and they have no way to defend themselves when these insidious
individuals choose to manipulate the system for their own personal gain or simply because
they have a grudge.
The culture of this department is established from the top, and we have yet to have a leader
who cares more about this department, its members, and its citizens, than themselves. We
need autonomy, mastery, and purpose in order to change the culture here. But, it starts at
the top. If the culture is toxic, it's because leadership is allowing it to become/stay this way.
Often command staff comes across as being self-serving and above accountability for
themselves. In fact, they would be highly offended if someone tried to hold them
accountable. They really don't see themselves as others see them. Absolutely NO
emotional intelligence demonstrated by senior staff.
Also, certain Chief officers and Captains need to quit with the intimidation and ruling by
fear. They need to be held accountable for their actions.
Certain Officers within the District are clearly protected by the highest level of
Administration. Captains, in particular, have the ability to act as they choose without
having to answer to their actions.
Crew members are held to the "fire" to tightly follow chain of command but the actions
from management going down the chain of command does not follow the same standard.
Communicate better and be honest with personnel. Stop being bullies and ruling by
intimidation and fear. People don't respond well when constantly threatened with
punishment or job loss.
We are quick to hammer individuals when a mistake is made.
Operational & Management Assessment Mountain View Fire Rescue
193
If this organization trusted its employees to do their job and supported them in the
decisions they make and embraced the fact that mistakes are what we learn from then I
believe morale would increase. Nobody is perfect and if we set egos aside and help each
other instead of using other's mistakes as a "lesson" in how to lose your job vs. a platform to
improve performance, we would flourish.
Somehow the leaders that use fear and intimidation have risen to the top. It has become a
workplace where you point out the mistakes of others to avoid punishment by upper
management.
Leadership
Assessment of leadership was an emphasis in the RFP, therefore there are numerous questions regarding
departmental leaders (BC and above) as well as captains.
Evaluation of Departmental Leaders
Leaders set the stage for success. Their decisions around strategy and resource allocation determine the
“macro pathways” taken by the organization. More so, their words and day-to-day actions intentionally or
unintentionally create the norms and environment in which daily work and interactions take place. Leaders
are constantly being watched for indications of “what really matters here” and actions speak much louder
than words.
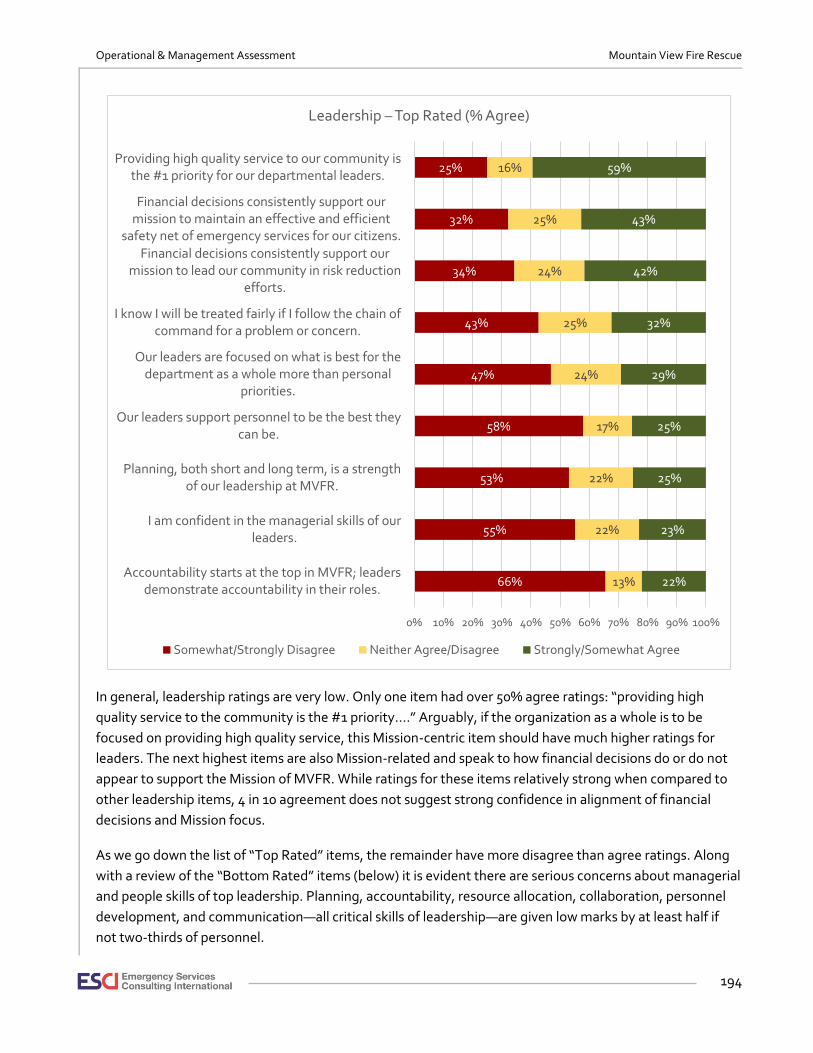
Operational & Management Assessment Mountain View Fire Rescue
194
In general, leadership ratings are very low. Only one item had over 50% agree ratings: “providing high
quality service to the community is the #1 priority….” Arguably, if the organization as a whole is to be
focused on providing high quality service, this Mission-centric item should have much higher ratings for
leaders. The next highest items are also Mission-related and speak to how financial decisions do or do not
appear to support the Mission of MVFR. While ratings for these items relatively strong when compared to
other leadership items, 4 in 10 agreement does not suggest strong confidence in alignment of financial
decisions and Mission focus.
As we go down the list of “Top Rated” items, the remainder have more disagree than agree ratings. Along
with a review of the “Bottom Rated” items (below) it is evident there are serious concerns about managerial
and people skills of top leadership. Planning, accountability, resource allocation, collaboration, personnel
development, and communication—all critical skills of leadership—are given low marks by at least half if
not two-thirds of personnel.
66%
55%
53%
58%
47%
43%
34%
32%
25%
13%
22%
22%
17%
24%
25%
24%
25%
16%
22%
23%
25%
25%
29%
32%
42%
43%
59%
0% 10% 20% 30% 40% 50% 60% 70% 80% 90% 100%
Accountability starts at the top in MVFR; leadersdemonstrate accountability in their roles.
I am confident in the managerial skills of ourleaders.
Planning, both short and long term, is a strengthof our leadership at MVFR.
Our leaders support personnel to be the best theycan be.
Our leaders are focused on what is best for thedepartment as a whole more than personal
priorities.
I know I will be treated fairly if I follow the chain ofcommand for a problem or concern.
Financial decisions consistently support ourmission to lead our community in risk reduction
efforts.
Financial decisions consistently support ourmission to maintain an effective and efficient
safety net of emergency services for our citizens.
Providing high quality service to our community isthe #1 priority for our departmental leaders.
Leadership – Top Rated (% Agree)
Somewhat/Strongly Disagree Neither Agree/Disagree Strongly/Somewhat Agree

Operational & Management Assessment Mountain View Fire Rescue
195
Group Differences
Station officers (captains and lieutenants) consistently gave the lowest ratings on Leadership items, often
substantially lower than others in the department. In fact, 10 of the 17 leadership items had ratings of 80%
or more disagree from the middle management tier in the organization (3 more had ratings of 60% or more
disagree).
Line personnel were also critical of leadership, but not to the degree of station officers. The lowest rating
was given for transparency (78% disagree). Two-thirds or more disagreed that leaders demonstrate
accountability in their roles, are quick to acknowledge/recognize over and above performance, and are
willing to admit when they are wrong/take ownership for mistakes. Other ratings tended to hover between
50% and 65% disagree.
59%
70%
63%
59%
57%
53%
63%
50%
59%
27%
17%
24%
25%
26%
30%
21%
30%
21%
14%
14%
14%
16%
17%
17%
17%
20%
20%
0% 10% 20% 30% 40% 50% 60% 70% 80% 90% 100%
Follow-through on ideas is emphasized by leadershere.
Transparency is valued by departmental leaders.
Our leaders are willing to admit when they are wrongand take ownership for their mistakes.
Coaching and mentoring are our leaders' preferredways to work with problem situations.
Our leaders effectively prioritize programs andprojects for the department.
Our leaders allocate adequate resources to supportprograms they initiate.
Our leaders are quick to acknowledge and recognizeover and above performance.
Management of people and projects supportsefficiency in the department.
Our leaders work well with other departments in thearea.
Leadership – Bottom Rated (% Agree)
Somewhat/Strongly Disagree Neither Agree/Disagree Strongly/Somewhat Agree

Operational & Management Assessment Mountain View Fire Rescue
196
Departmental leaders themselves were surprisingly critical of their own group:
• Over 8 in 10 disagreed that “leaders demonstrate accountability in their roles.”
• Over 7 in 10 disagreed they effectively prioritize programs and projects, allocate adequate
resources to support programs they initiate, or emphasize follow through on ideas.
• Over 7 in 10 took a “midway/sort of” position (neither agreed/nor disagree) that “our leaders
support personnel be the best they can be.”
As noted in the Mission and Values section, there were several items that suggest polarized opinion in the
leadership ranks; i.e., there were roughly the same numbers agreeing as disagreeing with statements with
no one in the middle: transparency is valued by leaders, I have confidence in managerial skills of leaders,
and financial decisions consistently support our mission to lead in risk reduction efforts or maintain an
effective/efficient safety net of emergency services. Apart from these “polar” items, the only items
receiving relatively positive ratings from leaders were: “Providing quality service is the #1 priority of
leaders” (86% agree) and “I will be treated fairly if I follow the chain of command for a problem or concern”
(43% agree, 43% neither agree nor disagree).
Civilian employees often gave the highest ratings for these items and were most aligned with departmental
leader ratings (e.g., 79% of civilians and 86% of departmental leaders agreed providing high quality service
was a #1 priority of leaders as compared to 58% of line personnel and 31% of station officers). However,
they gave relatively low marks to transparency and willingness of leaders to admit mistakes (57% disagree
for each).
Open-Ended Comments
Assist your people in their pursuit to promote. Make the budget clear. Give us the tools
needed to do our job safely and effectively. Communicate from the top. Stop the blaming
and favoritism.
Live by example. Be fair and honest. Be transparent.
Vision combined with planning is Leadership. Lack of vision coupled with lack of follow through and
prioritization = chaos, crisis management, constantly changing expectations and conflicting messages.
Follow through with projects and complete them within a time frame. Almost every single
project has been overdue not by days but by months or even years. Project management is
not a word the leaders know.
We constantly are in crisis management. we do not plan ahead or have good program
management. I think the cycle of crisis needs to be broken before we can effectively
support programs.
Operational & Management Assessment Mountain View Fire Rescue
197
I feel if the leadership were to sit down and develop a sound plan for the future. Then
communicate that plan to the entire district and define steps or strategies to get this
accomplished. Instead programs, long and short term plans, policies and procedures are
constantly being changed. This does nothing for the district, it's members or the
community.
Our department has been very poor with planning for the future. As a result, there are
constantly changing policies, procedures, and programs, sometimes the very same issue
will be changed or modified numerous times in the same year. These causes leadership to
be disconnected with personnel and line members do not have a clear idea of expectations.
Being a leader is not the same as micro-managing. Delegation and empowerment within the context of a
clear plan are marks of effective leaders.
Leadership insists on handling everything because they do not wish to delegate or
relinquish power; however, then they end up taking on too much and they cannot respond
within a timely manner.
We have a great group of individuals here. Even the officers referred to, I like them and
enjoy being around them until we run a call or something has stressed them. I believe they
are good people at heart, but need to refocus on what it means to lead, and not manage.
Each one of them has a wealth of knowledge and skill set that play an integral role in our
district. We are here because we want to do the right thing. I think we, need leaders that
empower, and our public deserves it.
Our people are capable of and positioned to provide exceptional service to both internal
and external customers. This could best be utilized by empowering program managers with
expectations, funding and parameters and then get out of the way!
Allow us to do our jobs without fear and micro management would be a good start.
I am constantly micro managed in how to do my job. One way to support me would be to
let me do my job.
The department needs to support its members more by allowing them the latitude to
perform their roles at their full capacity. There is too much micromanaging and control
from the top tier.
Stop the micro managing It is incredibly abundant at the officer level at Mtn. View. As an
organization, we need to trust the people in their respective decisions more than we do
now.
Captains would be able to better support personnel if the "handcuffs" were taken off and
they were entrusted to do what they were hired to do.
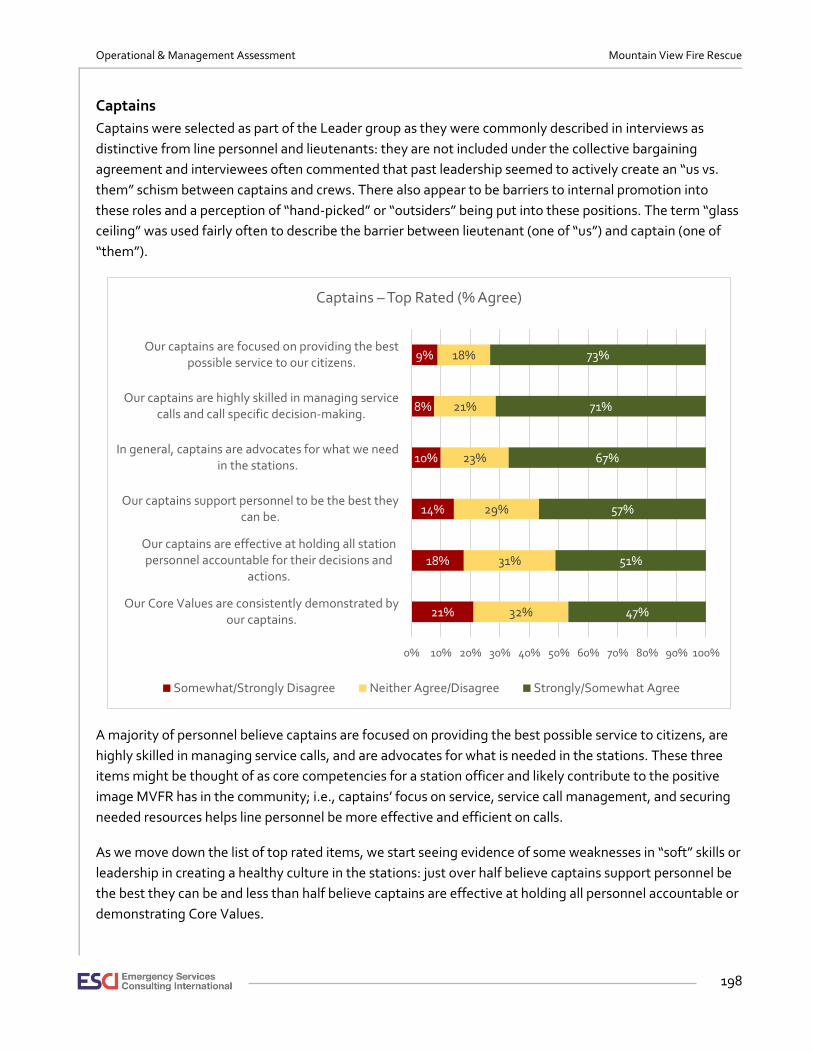
Operational & Management Assessment Mountain View Fire Rescue
198
Captains
Captains were selected as part of the Leader group as they were commonly described in interviews as
distinctive from line personnel and lieutenants: they are not included under the collective bargaining
agreement and interviewees often commented that past leadership seemed to actively create an “us vs.
them” schism between captains and crews. There also appear to be barriers to internal promotion into
these roles and a perception of “hand-picked” or “outsiders” being put into these positions. The term “glass
ceiling” was used fairly often to describe the barrier between lieutenant (one of “us”) and captain (one of
“them”).
A majority of personnel believe captains are focused on providing the best possible service to citizens, are
highly skilled in managing service calls, and are advocates for what is needed in the stations. These three
items might be thought of as core competencies for a station officer and likely contribute to the positive
image MVFR has in the community; i.e., captains’ focus on service, service call management, and securing
needed resources helps line personnel be more effective and efficient on calls.
As we move down the list of top rated items, we start seeing evidence of some weaknesses in “soft” skills or
leadership in creating a healthy culture in the stations: just over half believe captains support personnel be
the best they can be and less than half believe captains are effective at holding all personnel accountable or
demonstrating Core Values.
21%
18%
14%
10%
8%
9%
32%
31%
29%
23%
21%
18%
47%
51%
57%
67%
71%
73%
0% 10% 20% 30% 40% 50% 60% 70% 80% 90% 100%
Our Core Values are consistently demonstrated byour captains.
Our captains are effective at holding all stationpersonnel accountable for their decisions and
actions.
Our captains support personnel to be the best theycan be.
In general, captains are advocates for what we needin the stations.
Our captains are highly skilled in managing servicecalls and call specific decision-making.
Our captains are focused on providing the bestpossible service to our citizens.
Captains – Top Rated (% Agree)
Somewhat/Strongly Disagree Neither Agree/Disagree Strongly/Somewhat Agree
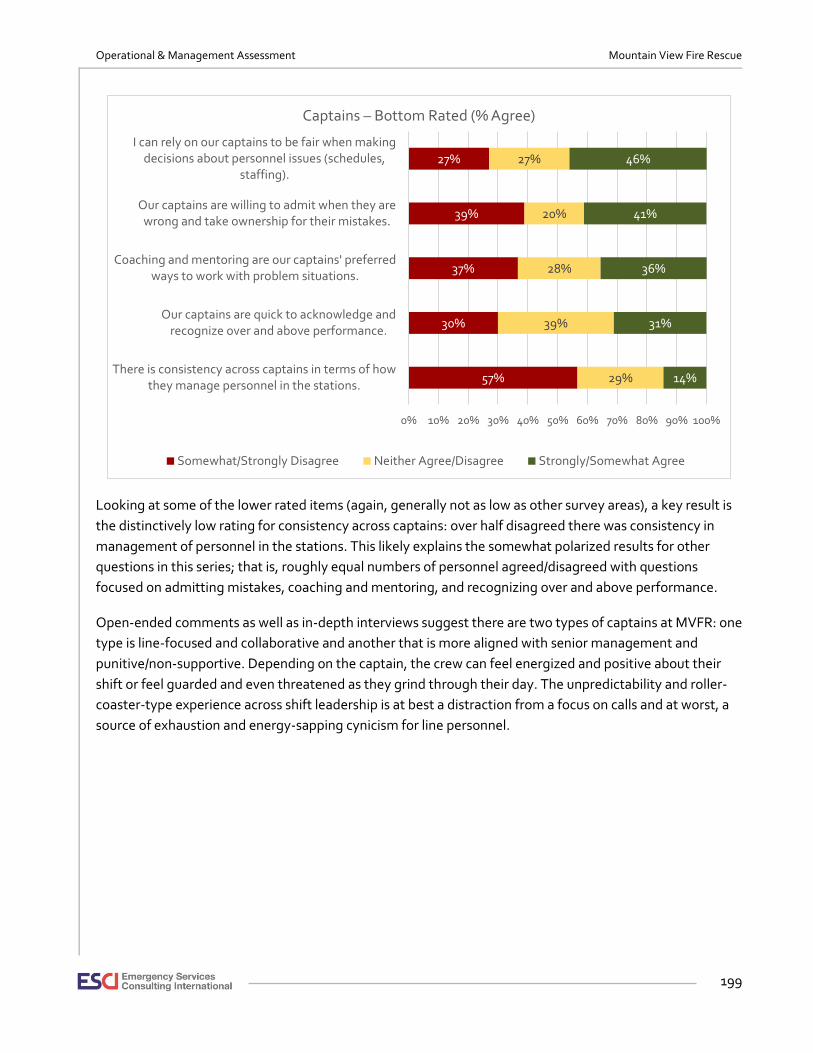
Operational & Management Assessment Mountain View Fire Rescue
199
Looking at some of the lower rated items (again, generally not as low as other survey areas), a key result is
the distinctively low rating for consistency across captains: over half disagreed there was consistency in
management of personnel in the stations. This likely explains the somewhat polarized results for other
questions in this series; that is, roughly equal numbers of personnel agreed/disagreed with questions
focused on admitting mistakes, coaching and mentoring, and recognizing over and above performance.
Open-ended comments as well as in-depth interviews suggest there are two types of captains at MVFR: one
type is line-focused and collaborative and another that is more aligned with senior management and
punitive/non-supportive. Depending on the captain, the crew can feel energized and positive about their
shift or feel guarded and even threatened as they grind through their day. The unpredictability and roller-
coaster-type experience across shift leadership is at best a distraction from a focus on calls and at worst, a
source of exhaustion and energy-sapping cynicism for line personnel.
57%
30%
37%
39%
27%
29%
39%
28%
20%
27%
14%
31%
36%
41%
46%
0% 10% 20% 30% 40% 50% 60% 70% 80% 90% 100%
There is consistency across captains in terms of howthey manage personnel in the stations.
Our captains are quick to acknowledge andrecognize over and above performance.
Coaching and mentoring are our captains' preferredways to work with problem situations.
Our captains are willing to admit when they arewrong and take ownership for their mistakes.
I can rely on our captains to be fair when makingdecisions about personnel issues (schedules,
staffing).
Captains – Bottom Rated (% Agree)
Somewhat/Strongly Disagree Neither Agree/Disagree Strongly/Somewhat Agree
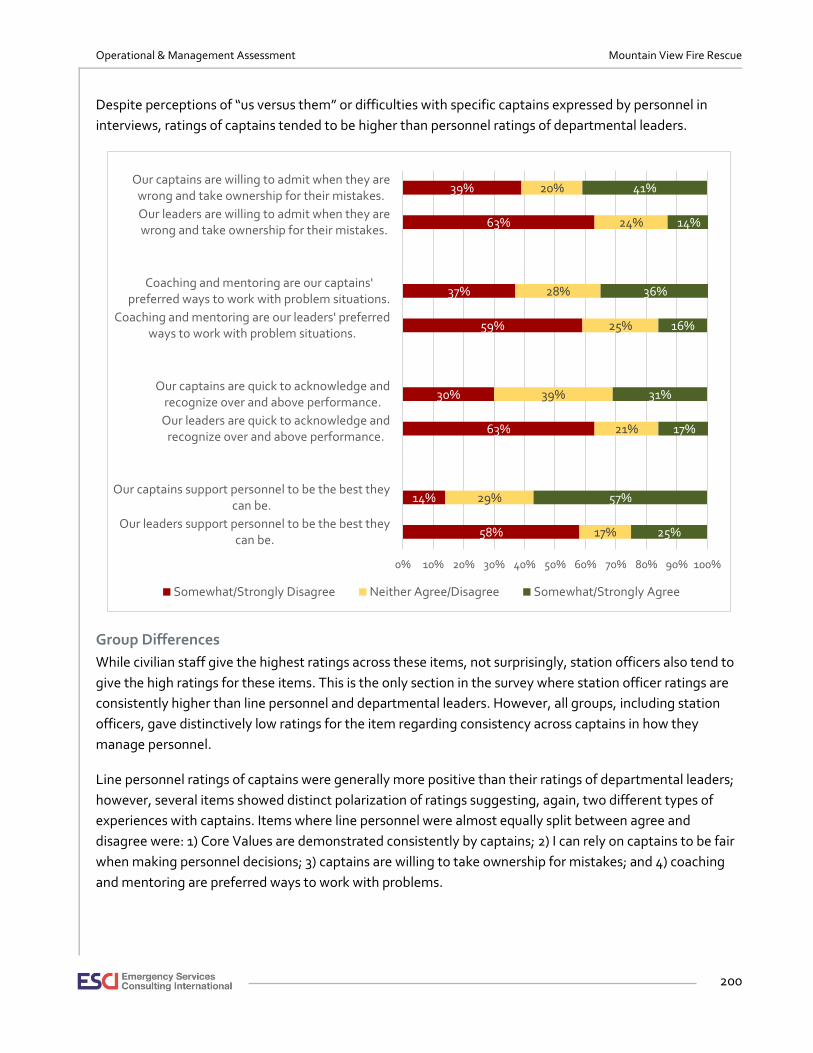
Operational & Management Assessment Mountain View Fire Rescue
200
Despite perceptions of “us versus them” or difficulties with specific captains expressed by personnel in
interviews, ratings of captains tended to be higher than personnel ratings of departmental leaders.
Group Differences
While civilian staff give the highest ratings across these items, not surprisingly, station officers also tend to
give the high ratings for these items. This is the only section in the survey where station officer ratings are
consistently higher than line personnel and departmental leaders. However, all groups, including station
officers, gave distinctively low ratings for the item regarding consistency across captains in how they
manage personnel.
Line personnel ratings of captains were generally more positive than their ratings of departmental leaders;
however, several items showed distinct polarization of ratings suggesting, again, two different types of
experiences with captains. Items where line personnel were almost equally split between agree and
disagree were: 1) Core Values are demonstrated consistently by captains; 2) I can rely on captains to be fair
when making personnel decisions; 3) captains are willing to take ownership for mistakes; and 4) coaching
and mentoring are preferred ways to work with problems.
58%
14%
63%
30%
59%
37%
63%
39%
17%
29%
21%
39%
25%
28%
24%
20%
25%
57%
17%
31%
16%
36%
14%
41%
0% 10% 20% 30% 40% 50% 60% 70% 80% 90% 100%
Our leaders support personnel to be the best theycan be.
Our captains support personnel to be the best theycan be.
Our leaders are quick to acknowledge andrecognize over and above performance.
Our captains are quick to acknowledge andrecognize over and above performance.
Coaching and mentoring are our leaders' preferredways to work with problem situations.
Coaching and mentoring are our captains'preferred ways to work with problem situations.
Our leaders are willing to admit when they arewrong and take ownership for their mistakes.
Our captains are willing to admit when they arewrong and take ownership for their mistakes.
Somewhat/Strongly Disagree Neither Agree/Disagree Somewhat/Strongly Agree
Operational & Management Assessment Mountain View Fire Rescue
201
Departmental leaders often gave lower, sometimes substantially lower, ratings to their captains than did
line personnel:
• No departmental leader agreed that captains are effective at holding all station personnel
accountable for decisions and actions (versus 58% of line personnel); 71% neither agreed nor
disagreed and 29% disagreed.
• Similarly, no departmental leader agreed that Core Values are consistently demonstrated by
captains (versus 47% of line personnel). The vast majority of leaders (86%) neither agreed nor
disagreed with this statement.
• Only one departmental leader agreed that captains are willing to own their mistakes versus 44% of
line personnel. Over half of departmental leaders (57%) disagreed.
• Again, only one departmental leader agreed that captains can be relied on to make fair decisions
around personnel issues or that coaching/mentoring are preferred ways to work with problems
(versus 46% and 40% of line personnel). Over half of department leaders (57%) neither agreed nor
disagreed with these statements.
• Less than half (43%) of department leaders agreed that captains are highly skilled at managing calls
compared to 71% of line personnel.
• Just over half of departmental leaders agreed that captains were focused on providing the best
possible service to citizens compared to 71% of line personnel and 92% of civilians.
Department leaders’ relatively low opinions about their “middle management” group may be another
reflection of the inconsistency issue (i.e., I can’t agree because there is too much variability in the group).
Or, it might be an indication of leaders’ inability or unwillingness to manage their subordinates. Or it is
simply a red flag pointing to an attitudinal schism between these two groups (station officer opinions of
departmental leaders were lower than all other groups). In any case, this substantial lack of alignment
between the two officer levels can only add to the confusion and frustration around captain inconsistency
for line personnel. And, this suggests a lot of internal energy may be directed to politics and inter-officer
antagonism versus building a unified, successful department.
Open-Ended Comments
Inconsistency in leadership leads to inconsistent expectations, inconsistent communication, and
confused/frustrated personnel.
We have many types and levels of leaders here. Some of these questions are hard to group
all the leaders together. The leaders I work with on a daily basis have the best intentions for
citizens and firefighters. I feel that other leaders that I don't interact with forget about the
citizens and firefighters.
Captain position within MVFR is where many of largest egos exist. This is where many
skilled people exist but their personalities don't inspire. Many of them control through fear
and have major control issues. This area represents the largest disconnect in my opinion.

Operational & Management Assessment Mountain View Fire Rescue
202
This group (Captains) in the organization is a mixed bag. About half are open honest and
have the best interest of the organization and its employees at heart while the other half
seek to create hate and deception around the organization.
Captains really need to simplify their position. Some of them take on too many roles while
others do poorly with the assigned tasks they have. Maybe a simplified job description with
clear expectations of their performance would help. They need to clearly communicate with
crews their expectations for the stations. A lot of their expectations are not communicated
until there is a problem.
Under the previous leadership, I saw the officers as a position that was not truly trusted by
the leadership above them…I believe we have some excellent officers but I also see that
most positive outcomes they achieve seem to be in spite of the organization, and due
entirely to their efforts and strong individual qualities.
Some of our Captains are exceptional leaders and do everything they can to empower their
crews. I believe that Mountain View has some of the best officers in the fire service and, for
the most part, I trust them explicitly. We have a few who micromanage their crews to the
point that the crew members are afraid to make decisions or commit to action on a call. It is
common with these officers to dress an employee down for not understanding their
intentions or being able to read their mind. They will come unglued at the first hint of
having their authority challenged (sometimes in front of the public) but have no problem
managing a scene and criticizing another officer over the radio before even getting on
scene. The day is determined by the mood of the officer. It feels when assigned to them,
depending on the mood, you are not treated as a professional adult, but a disobedient
teenager. I would like to emphasize what I stated first. Most of our officers are true leaders
and we are privileged to have them.
Communication
Assessment of departmental communication was another emphasis in the MVFR RFP. This section is
focused on within department communication, not service call or dispatch communication.
Communication is bidirectional; that is, it is a two-way interaction between individuals or groups.
Information is shared from leadership and input is provided to leaders from staff, line, and station officers.
Weaknesses in either side of this two-way connection can undermine effective communication reducing
efficiency in service provision, exaggerating divisions between internal groups, hampering innovation due
to lack of adaptive or “against the grain” insights, and/or creating a toxic culture of secrecy where “bad
news” or key facts are withheld as a form of self-protection or turf-building. Poor communication impacts
the quality of decision-making for both individuals and the organization and ultimately impacts quality of
service to the community.

Operational & Management Assessment Mountain View Fire Rescue
203
Ratings around communications are generally weak with many items receiving twice as many negative as
positive ratings. Only two items had ratings over 50% agree: I feel comfortable sharing concerns/mistakes
with my supervisor and my officer/supervisor communicates clear expectations. It appears, then, that direct
interaction between employee and supervisor is relatively strong. Roughly half of employees also report it
is easy to find information needed to do their job and to obtain specialty information from others in the
department. Again, these are not strong ratings, but taken together with ratings regarding supervisors, it
could be said that communication pertaining to the individual’s immediate situation or job requirements is
a strength relative to other communication patterns.
However, as information needs broaden to policies or questions beyond job specific issues addressed by
their supervisor, it appears to be difficult for personnel to obtain answers or information, even if it impacts
them directly: roughly one-third agree they get answers to their questions in a reasonable amount of time
or that information about new policies or changes that impacts them is shared effectively. This means that
the majority of personnel are, perhaps, left dangling or in the dark about next steps or decisions they need
to make related to their job or work situation.
51%
59%
50%
39%
27%
26%
23%
26%
23%
15%
17%
25%
24%
24%
16%
12%
26%
26%
33%
36%
49%
49%
61%
62%
0% 10% 20% 30% 40% 50% 60% 70% 80% 90% 100%
Line personnel have a voice in issues or decisionsthat directly impact their day-to-day work.
I am given the information necessary for me tounderstand decisions made by leadership.
Information about new policies or changes in policythat impact me is communicated effectively.
If I have a question, I get an answer in a reasonableamount of time.
People freely share their knowledge or specialtyinformation with others in the department.
It is easy to find the information I need to do my jobwell.
My officer or supervisor communicates clearexpectations to my shift or work group.
I feel comfortable sharing my concerns or mistakeswith my immediate superior.
Communication - Top Rated (% Agree)
Somewhat/Strongly Disagree Neither Agree/Disagree Strongly/Somewhat Agree
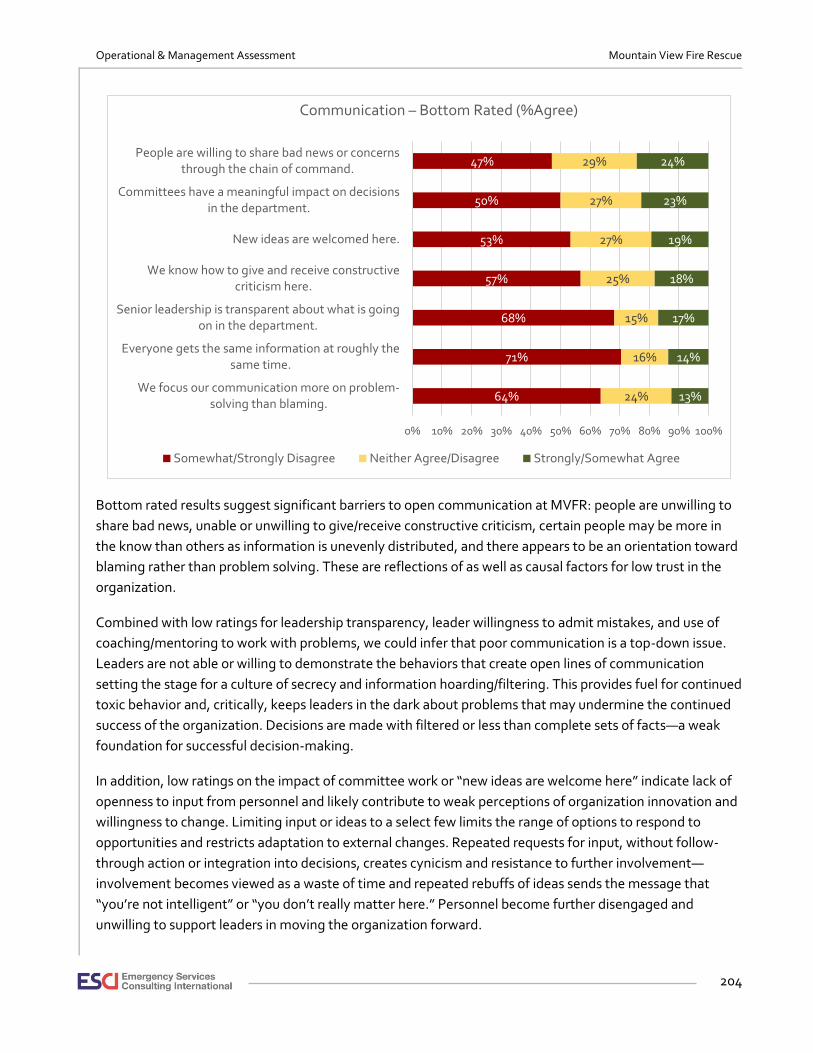
Operational & Management Assessment Mountain View Fire Rescue
204
Bottom rated results suggest significant barriers to open communication at MVFR: people are unwilling to
share bad news, unable or unwilling to give/receive constructive criticism, certain people may be more in
the know than others as information is unevenly distributed, and there appears to be an orientation toward
blaming rather than problem solving. These are reflections of as well as causal factors for low trust in the
organization.
Combined with low ratings for leadership transparency, leader willingness to admit mistakes, and use of
coaching/mentoring to work with problems, we could infer that poor communication is a top-down issue.
Leaders are not able or willing to demonstrate the behaviors that create open lines of communication
setting the stage for a culture of secrecy and information hoarding/filtering. This provides fuel for continued
toxic behavior and, critically, keeps leaders in the dark about problems that may undermine the continued
success of the organization. Decisions are made with filtered or less than complete sets of facts—a weak
foundation for successful decision-making.
In addition, low ratings on the impact of committee work or “new ideas are welcome here” indicate lack of
openness to input from personnel and likely contribute to weak perceptions of organization innovation and
willingness to change. Limiting input or ideas to a select few limits the range of options to respond to
opportunities and restricts adaptation to external changes. Repeated requests for input, without follow-
through action or integration into decisions, creates cynicism and resistance to further involvement—
involvement becomes viewed as a waste of time and repeated rebuffs of ideas sends the message that
“you’re not intelligent” or “you don’t really matter here.” Personnel become further disengaged and
unwilling to support leaders in moving the organization forward.
64%
71%
68%
57%
53%
50%
47%
24%
16%
15%
25%
27%
27%
29%
13%
14%
17%
18%
19%
23%
24%
0% 10% 20% 30% 40% 50% 60% 70% 80% 90% 100%
We focus our communication more on problem-solving than blaming.
Everyone gets the same information at roughly thesame time.
Senior leadership is transparent about what is goingon in the department.
We know how to give and receive constructivecriticism here.
New ideas are welcomed here.
Committees have a meaningful impact on decisionsin the department.
People are willing to share bad news or concernsthrough the chain of command.
Communication – Bottom Rated (%Agree)
Somewhat/Strongly Disagree Neither Agree/Disagree Strongly/Somewhat Agree
Operational & Management Assessment Mountain View Fire Rescue
205
Group Differences
As is the case across most of the survey, station officer ratings lag other groups’ ratings with particularly
low ratings (80% or more disagree) given to: new ideas are welcome here, everyone gets information at
roughly the same time, getting information necessary to understand decisions made by leadership, and we
focus more on problem-solving than blaming. Station officers also give relatively low ratings (compared to
other groups) for easily finding information they need to do their job well (53% disagree) and information
about new policies/change that impact them being communicated effectively. Since middle management’s
role is often to serve as the communication channel between senior management and front-line, station
officers at MVFR may experience significant barriers to effectively performing this “go between” role.
Line personnel are split in terms of feeling comfortable sharing concerns/mistakes with their immediate
supervisor with roughly half agreeing and the other half disagreeing with this statement. This parallels
findings noted in previous sections regarding inconsistency in captain’s interaction with personnel. Line
personnel also give lower ratings to getting answers in a reasonable time, having a voice in issues/decisions
directly impacting their work, and feeling that committees have a meaningful impact on decisions in the
department (station officers also give low ratings to these items as compared to civilians and departmental
leaders). The communication channel up to leaders appears to be clogged or broken.
Departmental leaders are the only group agreeing it is easy to find information they need to do their job
well (71% agree) and they are more likely than other groups to agree that line personnel have a voice in
decisions that impact their work (57%). However, they are surprisingly critical of information sharing that
would seem to originate within their ranks. They are split as to whether information about new
policies/changes is communicated effectively or if they are given information necessary to help them
understand decisions made by leadership with roughly half agreeing and half disagreeing with these
statements. Over half (57%) disagree that leadership is transparent and a large majority (over 70%) disagree
that everyone gets the same information at the same time, that people know how to give and receive
constructive criticism, and people are willing to share bad news/concerns through the chain of command.
As is the case across most of the survey, civilian personnel tend to be a bit more positive in these items;
however, their ratings tend to track with the overall ratings of the department; i.e., there are few distinctive
high or low ratings from this group.
Open-Ended Comments
Top-down communication was often described as filtered, inconsistent, and/or non-existent resulting in
perceptions of low transparency.
Our system of communication is completely broken it is ineffective, unclear,
inappropriately over reactive, inconsistent and non-transparent. I'm not sure of a solution
the only thing I am sure of is that you can't do it much worse than we are.
We claim to be transparent but we're clearly not.

Operational & Management Assessment Mountain View Fire Rescue
206
While some indicated there is plenty of information shared….
A huge part of this is people are not taking ownership and reading emails and asking
questions. If the department would send out meaningful updates and people read them
there should not be as many issues. The leadership can try to communicate but if people
don’t read the emails there is nothing they can do.
The department provides an abundance of information, it is the membership that does not
take the time or effort to read and understand (ask questions) reference the information.
We have SEVERAL meetings with minutes generated by most of those meetings.
Many feel that sheer volume of information can actually be a barrier to effective communication or that
important elements of information are not always included or shared where they should be.
Probably one of the biggest issues with our department is communication. People get
emailed to death, there is no way for outlying houses to "sit" in on meetings and we can't
always depend on the BCs to accurately convey information.
The department uses email as the only means of communicating with employees. We
receive so many "garbage" emails from people that you eventually quit reading them. This
leads to communication breakdowns. For instance, several leaders send emails to the entire
department that are irrelevant. If feels like they do this so they can show productivity. By
reducing this it should lead to slightly better communications if you are strictly using email.
We publish a lot of information that is available for people to gather information from.
However, we are so busy that I believe most people just hit delete when that board packet
or 3-page email some out. I would like to see us continue that practice however and we
support that with a Reader’s Digest version as well?
I read the officer meeting notes and board meeting notes for every meeting, but it is
obvious that there is information that is not fully disclosed on those minutes.
When decisions need to be made or meetings held, some of the stakeholders are not
informed because someone forgot them or didn't think it necessary they be included.
Input from the lower ranks upward is limited. Committees are often viewed as symbolic efforts: lots of time
and energy but little true influence.
Meetings are not intended to solicit input or create open discussion. Meetings are only
intended to give direction here at the department. This is a huge opportunity for
improvement if leadership decides to change the intent of meetings.
Operational & Management Assessment Mountain View Fire Rescue
207
We are never afraid to put together a committee to research innovation, change, or
whatever else. However, those committees are always allowed to flounder, or even
discouraged to produce anything of value. For example, at the first meeting of said
committee it will be explained by a member of the executive staff that the committee can
discuss or investigate whatever they would like. However, at the end of the day, we are
going to keep doing things the same way we are doing them right now.
Nearly all our Stations have been recently upgraded, however, here again there was no
input sought therefore many of the Stations fall short of meeting the needs of the
community and employees here today and will only fall further behind as the District
grows. No stations should ever be built without input from the line.
A committee is just something that is created to appease the grumbles. The powers that be
have already made a decision about whatever the committee was formed to investigate. If
the investigation of the committee comes up with a view that contradicts the previously
made decision, the committee is dissolved and we stick with the previously made decision.
They are willing to listen to new ideas, not so much about allowing them to occur.
Fear of retribution is a barrier to bottom-up communication.
People are discouraged from sharing ideas as the administration sees this as antagonistic and
challenging in nature, when, in fact, the members are simply trying to make the department better.
Individual ideas and input are not welcomed; instead, we get chastised for sharing ideas.
Communication within the department is and has always been an issue. The previous chief
would come out quarterly, give us a 10-minute speech and ask if there were any questions
to which no one would ask for fear of retribution.
I don't feel I can go to the officer if I have an issue because of fear of retaliation.
An example of our leadership is that we were told that during any staff meeting we are not
to speak unless we have had prior authorization from the Battalion Chief regarding any
comment or idea we have.
I want to work for an agency that I feel has my back regardless of my opinions, suggestions
and ideas.
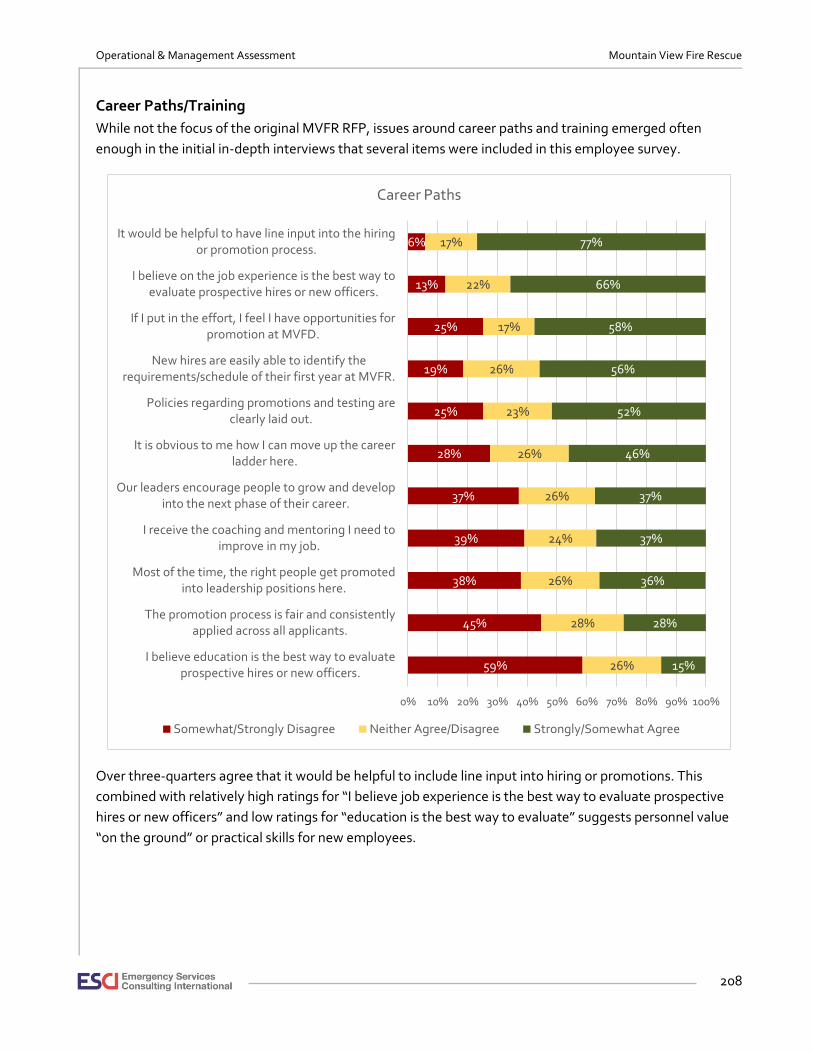
Operational & Management Assessment Mountain View Fire Rescue
208
Career Paths/Training
While not the focus of the original MVFR RFP, issues around career paths and training emerged often
enough in the initial in-depth interviews that several items were included in this employee survey.
Over three-quarters agree that it would be helpful to include line input into hiring or promotions. This
combined with relatively high ratings for “I believe job experience is the best way to evaluate prospective
hires or new officers” and low ratings for “education is the best way to evaluate” suggests personnel value
“on the ground” or practical skills for new employees.
59%
45%
38%
39%
37%
28%
25%
19%
25%
13%
6%
26%
28%
26%
24%
26%
26%
23%
26%
17%
22%
17%
15%
28%
36%
37%
37%
46%
52%
56%
58%
66%
77%
0% 10% 20% 30% 40% 50% 60% 70% 80% 90% 100%
I believe education is the best way to evaluateprospective hires or new officers.
The promotion process is fair and consistentlyapplied across all applicants.
Most of the time, the right people get promotedinto leadership positions here.
I receive the coaching and mentoring I need toimprove in my job.
Our leaders encourage people to grow and developinto the next phase of their career.
It is obvious to me how I can move up the careerladder here.
Policies regarding promotions and testing areclearly laid out.
New hires are easily able to identify therequirements/schedule of their first year at MVFR.
If I put in the effort, I feel I have opportunities forpromotion at MVFD.
I believe on the job experience is the best way toevaluate prospective hires or new officers.
It would be helpful to have line input into the hiringor promotion process.
Career Paths
Somewhat/Strongly Disagree Neither Agree/Disagree Strongly/Somewhat Agree
Operational & Management Assessment Mountain View Fire Rescue
209
Just over half of employees (58%) agree that effort is connected to promotion opportunities, implying that
a significant minority of personnel may not be sure that what they do on a day to day basis has bearing on
their progress in the organization. This may lead to passivity; i.e., “If I work hard and it doesn’t matter to my
career path, maybe I’ll just do what I need to do to get by and nothing more.” This may be especially true if
the “right people” don’t seem to be getting promoted (38% disagree, 36% agree) or the promotion process
is perceived to be unfair or inconsistently applied across applicants.
It appears that mentoring, coaching, and leadership encouragement for professional development is
another area where personnel are polarized: roughly equal number agree/disagree with these statements
and a quarter of personnel are “on fence” neither agreeing nor disagreeing. It may be that some individuals
or groups are receiving more consistent support in these areas than others.
Group Differences
This is one area where civilian personnel give relatively low marks, especially compared to their tendency to
give higher marks elsewhere in the survey. In particular, it is less obvious to them how to move up the
career ladder, they tend to feel they don’t receive coaching and mentoring they need to improve in their
job, and they are less likely to agree that putting in effort will result in promotion opportunities at MVFR.
These results are not too surprising as the career ladder in most fire departments is set up to support line
personnel. Civilians often are placed in very specialized roles with limited upward or even lateral mobility
options. Perhaps opportunities could be identified for growth within roles with special projects or
innovation initiatives.
There are also several places where line personnel appear to be more positive than officers or civilian
personnel; however, in some cases, this is a result of polar responses. For example, a relatively large group
of line personnel (45% or so) agrees they receive coaching/mentoring (as compared to 30% or less of other
groups), however, another relatively large group (36%) disagrees with this statement. A clear majority of
line personnel feel positively, especially as compared to other groups, that “if I put in the effort I feel I have
opportunities for promotion” (69% agree versus 50% or less for other groups). This group is also much more
likely to agree that job experience is the best way to evaluate prospective hires or new officers with nearly
8 in 10 agreeing with this statement compared to only 44% of station officers and 29% of department
leaders.
It is important to note that no department leader and only 1 station officer agreed that education is the best
way to evaluate new people while roughly 2 in 10 line personnel agreed. This is important because a strong
impression from the in-depth interviews was “the only way to get promoted beyond captain around here is
to have a college degree.” The sense of “glass ceiling” is largely tied to this perception. Since relatively few
agree that education is the best way to evaluate people, it seems odd that education is perceived to be a
driving force in promotions.
Line and station officers are much more likely to disagree that leaders encourage people to grow and
develop into the next phase of their career (roughly 50% as compared to 0% of departmental leaders).
Station officers are more likely to disagree that the promotion process is fair and are polarized on the
question about effort being connected to promotion opportunities: 50% agree and 44% disagree.
Operational & Management Assessment Mountain View Fire Rescue
210
Surprisingly, even leaders are not sure that the right people get promoted: only 43% agreed that the right
people get promoted into leadership positions at MVFR. However, they are more likely to feel promotion
and testing policies are clearly laid out (71% agree versus 50% or less of other groups) and may be resistant
to having line input into the hiring or promotion process (57% agree this would be helpful, compared to 75%
of station officers and 82% of line personnel).
Open-Ended Comments
Promotion process is haphazard and career paths appear dead-end at lieutenant unless you are an outsider
or part of the favored few.
We have a terrible habit of promoting and "supporting" people along their career path
based solely on necessity. Through lack of planning and foresight the district hastily pushes
people into acting roles and essentially fast tracks them and does whatever it takes to just
get someone in the seat. That's a poor business practice and sets people up for failure.
Our promotion process here is a joke. Under our last Chief there was no competitive
component to the testing process and he wrote the minimum requirements to exclude
internal candidates. The Chief clearly picked who he wanted, not who was most qualified.
This caused candidates to question why they put any effort in to the testing process or
preparing themselves for the next rank.
The process for progression is either very unclear or vacant at every step. The district
actually hinders you in your progress with lack of support for training and attainment of
certifications. Favoritism and discrimination is rampant by most of the personnel who are
empowered to make any decision about career progression.
MV also is not consistent in the process to Act in a position or get experience. Some people
are allowed to act without certifications but others are not.
There is an incredible glass ceiling here at Mountain View. For some reason, the rank of
Captain has been a stopping point for several individuals. We have Lieutenants that would
run circles around Captains. Yet, we as of just three years ago, hired outside Captains that
are not amazing employees.
This organization has a long track record of hiring from the outside for nearly all positions
at the rank of Captain and above. This practice has stifled the ability to promote here at
MVFR.
The past chief made it clear it was all about education, you could not use you experience
and some education. Now you have Officer[s] that have no fire experience but has a four-
year degree in anything from an online course.
We care more about a degree than a skill, experience or past work history. Often times we
promote officers with little or zero experience. Scary for the line, and makes ineffective
leaders.
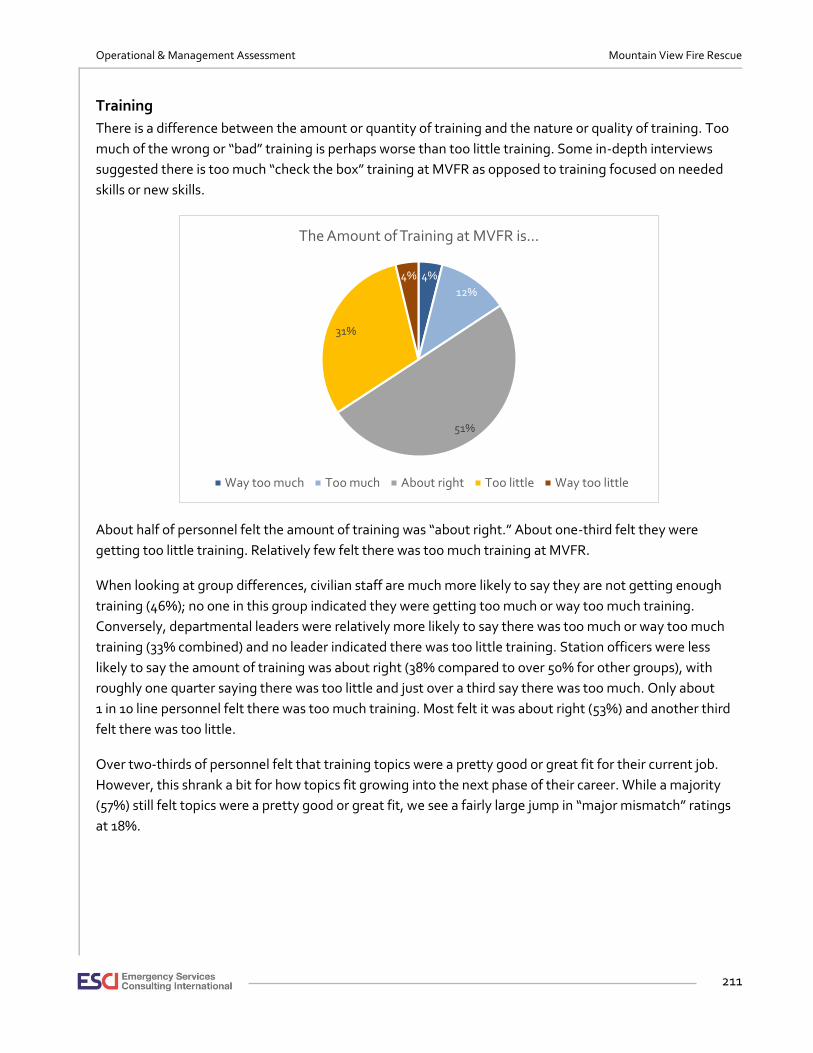
Operational & Management Assessment Mountain View Fire Rescue
211
Training
There is a difference between the amount or quantity of training and the nature or quality of training. Too
much of the wrong or “bad” training is perhaps worse than too little training. Some in-depth interviews
suggested there is too much “check the box” training at MVFR as opposed to training focused on needed
skills or new skills.
About half of personnel felt the amount of training was “about right.” About one-third felt they were
getting too little training. Relatively few felt there was too much training at MVFR.
When looking at group differences, civilian staff are much more likely to say they are not getting enough
training (46%); no one in this group indicated they were getting too much or way too much training.
Conversely, departmental leaders were relatively more likely to say there was too much or way too much
training (33% combined) and no leader indicated there was too little training. Station officers were less
likely to say the amount of training was about right (38% compared to over 50% for other groups), with
roughly one quarter saying there was too little and just over a third say there was too much. Only about
1 in 10 line personnel felt there was too much training. Most felt it was about right (53%) and another third
felt there was too little.
Over two-thirds of personnel felt that training topics were a pretty good or great fit for their current job.
However, this shrank a bit for how topics fit growing into the next phase of their career. While a majority
(57%) still felt topics were a pretty good or great fit, we see a fairly large jump in “major mismatch” ratings
at 18%.
4%
12%
51%
31%
4%
The Amount of Training at MVFR is...
Way too much Too much About right Too little Way too little
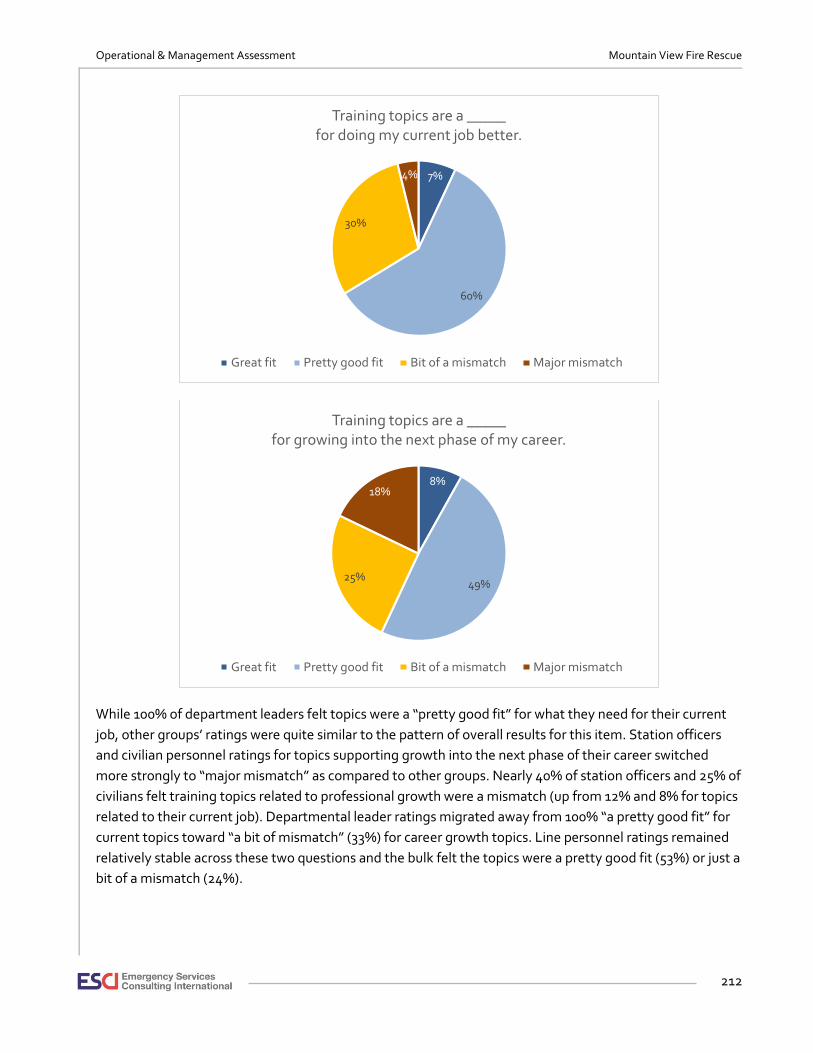
Operational & Management Assessment Mountain View Fire Rescue
212
While 100% of department leaders felt topics were a “pretty good fit” for what they need for their current
job, other groups’ ratings were quite similar to the pattern of overall results for this item. Station officers
and civilian personnel ratings for topics supporting growth into the next phase of their career switched
more strongly to “major mismatch” as compared to other groups. Nearly 40% of station officers and 25% of
civilians felt training topics related to professional growth were a mismatch (up from 12% and 8% for topics
related to their current job). Departmental leader ratings migrated away from 100% “a pretty good fit” for
current topics toward “a bit of mismatch” (33%) for career growth topics. Line personnel ratings remained
relatively stable across these two questions and the bulk felt the topics were a pretty good fit (53%) or just a
bit of a mismatch (24%).
7%
60%
30%
4%
Training topics are a _____ for doing my current job better.
Great fit Pretty good fit Bit of a mismatch Major mismatch
8%
49%25%
18%
Training topics are a _____for growing into the next phase of my career.
Great fit Pretty good fit Bit of a mismatch Major mismatch
Operational & Management Assessment Mountain View Fire Rescue
213
Open-Ended Comments
ISO accreditation requires training for the department but many feel this training is simply a “paper
pushing/check-box” exercise, is not useful, and gets in the way of more practical, job-specific training
opportunities.
Many people still need work on basics; lots of people need classes, training and mentoring
for promotional aspirations, but are constantly dealt roadblocks to do so, unless you are
liked by leadership. Monthly training packets are just cut/paste meaningless training.
The training packets are silly.
They send out a training packet once a month to make sure we get the 16-hour minimum
required by ISO.
It seems that we do the same type of training all the time.
Training packet is an awful waste of time. Allow outside training. We currently pack our
schedules so tight that there is little to no time for company officers to meet the immediate
trainings needs of their guys.
A specialty team like Tech rescue needs to be allotted the time in the schedule to train on
the multiple disciplines they have to be responsible for. If we are not going to change that
approach we should get rid of the tech rescue team.
There are many requirements that are set at the federal level that are not open for
negotiation. The focus of ISO insurance requirements slants the training away from the
areas our department could and should be focusing on. Areas like hazmat or medical
training are not valued by ISO and therefore don't receive the attention they require.
Support seems to be limited to “encouragement” rather than tangible support for training.
More support for career advancement to help support the district's mission would help. The
concept of you’re on your own to obtain the next level of certs or training is a hindrance on
the mission of the District.
It would be nice to be supported in ongoing training to perfect skills or learn new skill sets.
You are more likely to be turned down for training requests. There are never any
explanations for the denial.
Support people who want to learn. I am tired of training opportunities that are not
supported. People have to find coverage and pay for the class.
There has been no support. I have had to achieve everything on my own. The department
might fund a test or a class, but it was always up to me to cover my own shifts, or achieve
declined trainings on my own.

Operational & Management Assessment Mountain View Fire Rescue
214
MVFR wants us to promote but does not support us in getting the classes we need or
covering our shifts so we can take the classes. It mostly on our time and money.
A lot of guys to put a lot of their own time and effort into getting specialty certifications and
having zero support from the district. All the specialty teams were created based on the
district needs and what the district needed to be accredited and to bring our ISO rating up.
So the district built the programs but now don't support them.
Getting Things Done
Day-to-day life in the stations or office can play as large a role in engagement or morale as the more
abstract cultural or leadership issues. Small irritants, if repeatedly daily or frequently, can gradually chip
away at morale. Conversely, if there are few impediments to performing their job well, employees feel
more successful and more in control of their lives and work. This is particularly true for firefighters whose
professional identity is often centered on being helpful and being efficient and effective at solving
problems. Too many barriers between them and getting the job done can be especially frustrating because,
ultimately, success in their job revolves around serving the community and saving lives. Hoops and hassles,
especially if they appear arbitrary or self-serving for someone in the department, are not just irritants but
can also send a signal that the department as a whole is not focused on the central mission of serving the
community.
25%
26%
16%
18%
7%
12%
6%
29%
20%
16%
14%
18%
10%
8%
46%
54%
68%
68%
75%
78%
86%
0% 10% 20% 30% 40% 50% 60% 70% 80% 90% 100%
Assignments for overtime are made fairly.
Most of the time we have the right number ofpeople on shift to support the needs of our
community.
I have the equipment and tools I need to do my jobeffectively.
The physical environment I work in is conducive toefficient work.
The physical environment I work in is safe andsecure.
Most of the time we have the right type of peopleon shift to support the needs of our community.
My work schedule allows me to effectively balancepersonal and professional responsibilities.
Getting Things Done – Top Rated (% Agree)
Somewhat/Strongly Disagree Neither Agree/Disagree Strongly/Somewhat Agree
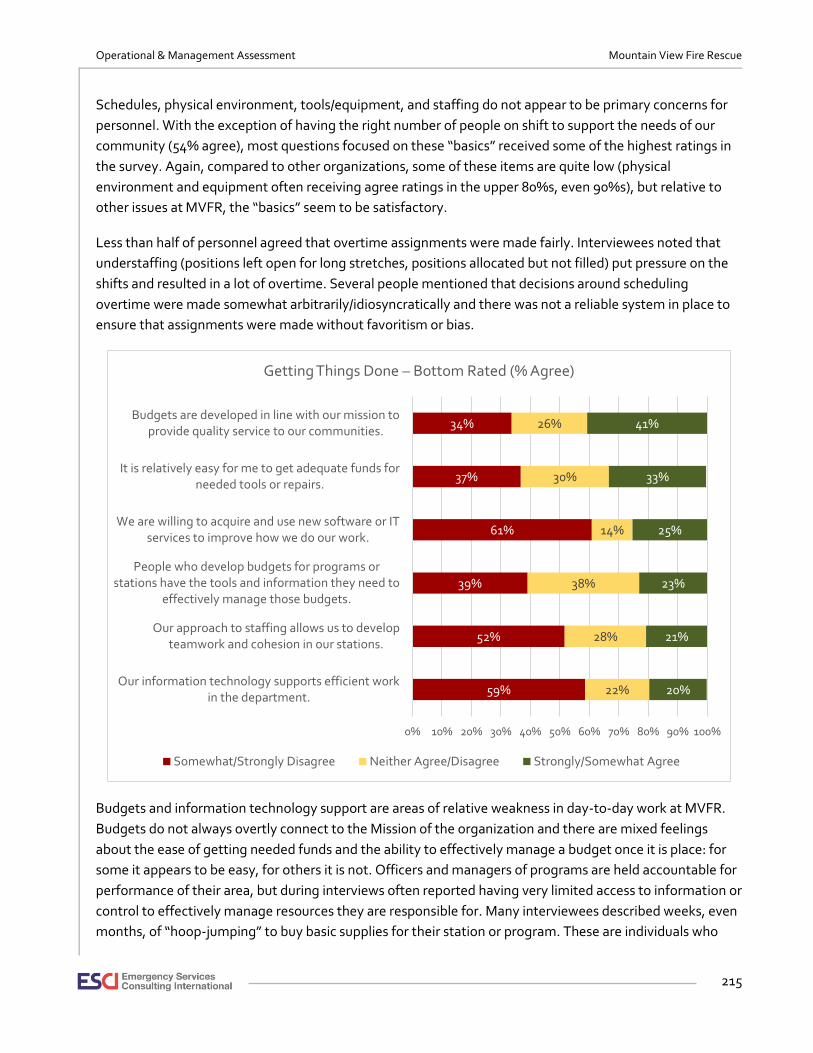
Operational & Management Assessment Mountain View Fire Rescue
215
Schedules, physical environment, tools/equipment, and staffing do not appear to be primary concerns for
personnel. With the exception of having the right number of people on shift to support the needs of our
community (54% agree), most questions focused on these “basics” received some of the highest ratings in
the survey. Again, compared to other organizations, some of these items are quite low (physical
environment and equipment often receiving agree ratings in the upper 80%s, even 90%s), but relative to
other issues at MVFR, the “basics” seem to be satisfactory.
Less than half of personnel agreed that overtime assignments were made fairly. Interviewees noted that
understaffing (positions left open for long stretches, positions allocated but not filled) put pressure on the
shifts and resulted in a lot of overtime. Several people mentioned that decisions around scheduling
overtime were made somewhat arbitrarily/idiosyncratically and there was not a reliable system in place to
ensure that assignments were made without favoritism or bias.
Budgets and information technology support are areas of relative weakness in day-to-day work at MVFR.
Budgets do not always overtly connect to the Mission of the organization and there are mixed feelings
about the ease of getting needed funds and the ability to effectively manage a budget once it is place: for
some it appears to be easy, for others it is not. Officers and managers of programs are held accountable for
performance of their area, but during interviews often reported having very limited access to information or
control to effectively manage resources they are responsible for. Many interviewees described weeks, even
months, of “hoop-jumping” to buy basic supplies for their station or program. These are individuals who
59%
52%
39%
61%
37%
34%
22%
28%
38%
14%
30%
26%
20%
21%
23%
25%
33%
41%
0% 10% 20% 30% 40% 50% 60% 70% 80% 90% 100%
Our information technology supports efficient workin the department.
Our approach to staffing allows us to developteamwork and cohesion in our stations.
People who develop budgets for programs orstations have the tools and information they need to
effectively manage those budgets.
We are willing to acquire and use new software or ITservices to improve how we do our work.
It is relatively easy for me to get adequate funds forneeded tools or repairs.
Budgets are developed in line with our mission toprovide quality service to our communities.
Getting Things Done – Bottom Rated (% Agree)
Somewhat/Strongly Disagree Neither Agree/Disagree Strongly/Somewhat Agree
Operational & Management Assessment Mountain View Fire Rescue
216
are, on paper, in charge of a budget, but are unable to make independent decisions about even small
expenditures. This is not only frustrating in terms of getting things done, it sends a strong message that
officers and others in the organization are not truly in roles of authority or cannot be trusted. A “black box”
approach to this most basic information amplifies distrust—who is really doing what and why with my
budget, much less our overall financial resources?
Information technology receives the largest disagree ratings across these items. Interviewees often noted
the organization was substantially behind in technology and many perceived a strong resistance to
automating functions that still relied too much on processing piles of paper. Concerns around schedule
management, budgets, promotion/training records, and personnel management often were traced to lack
of reliable data, lack of access to data, or a piece of paper “being lost on someone’s desk.”
Technology in the stations was described as unreliable or incredibly cumbersome to use and administrative
functions appeared to be “stuck in the ‘80s.” For most people, this is not a case of wanting the latest gadget
or trendy technology. Many expressed concerns about day-to-day efficiency or the ability to get simple
things done so more important work could be the focus of the organization. Others believed resistance to
technology was a way to keep information in the hands of select few and, of course, information is power.
While sheer numbers or types of personnel does not appear to be an issue (see previous chart), relatively
few people agreed that the approach to staffing supported cohesion in the stations. Interviewees often
noted that personnel were routinely moved from station to station, shift to shift. In fact, several people
(across levels) indicated this seemed to be a deliberate mechanism used by previous leadership to reduce
cohesion in the rank-and-file and keep personnel off-kilter.
Along with helping others, being part of a team or “brotherhood/sisterhood” is a core part of the firefighter
identity. In interviews across departments, across geographies, across types of environments, camaraderie
is noted consistently as a driver for joining the fire service and an important reason line personnel love their
work. More so, as teams “gel,” efficiency on calls increases: there is less need for communication, people
know instinctively what their teammate is going to do, where they’re going to be, and how they will
respond in a stressful situation. Like a well-tuned sports team, a shift at a station becomes a unified system
rather than scattered group of individuals. “Shuffling” as a deliberate staffing approach is likely both a
barrier to engagement and efficiency/effectiveness on calls.
Group Differences
In general, civilian staff ratings of these items are higher, often much higher, than other groups’ ratings. For
example, 43% of civilian staff agreed that information technology supports efficient work in the
department compared to 18% of line personnel and 0% of station officers and department leaders. Nearly 7
in 10 station personnel (line and officer) disagreed with this statement compared to 36% of civilian staff.
Over half of civilian staff (57%) agreed “we are willing to acquire and use new software/IT services;” while
43% of department leaders agreed with his statement, only 11% and 18% of line personnel and station
officers agreed—over three-quarters of these latter two groups disagreed.
Operational & Management Assessment Mountain View Fire Rescue
217
In the budget/financial arena, half of civilian personnel agreed budgets were in line with a mission to
provide quality service whereas 71% of departmental leaders disagreed. Four in ten (43%) civilian staff
agreed that people who develop budgets have information they need to effectively manage those budgets
compared to 12% of department leaders and 14% of station officers. Nearly two-thirds (64%) of civilian
staff agreed it was relatively easy to get adequate funds for needed tools and repairs, compared to 18% of
line personnel and about 40% of officers and department leaders (57% of department leaders disagreed
with this statement compared to 7% of civilian staff). The vast majority (86%) of civilian staff reported
having the tools and equipment they need to do their job effectively compared to roughly 40% of station
officers and department leaders. Nearly three-quarters of line personnel agree they have the equipment
and tools they need to do their job so it appears that funds are being directed into the important work of
running calls.
Interestingly, civilian staff gave low marks to “assignments for overtime are made fairly” with only 14%
agreeing compared to 57% of line personnel and 43% of station officers and department leaders. It is worth
digging into this number to determine if they are referring to their own overtime or perceptions of overtime
in the stations.
Station officers are less likely to agree that the physical environment they work in is safe and secure (62%
versus 93% of civilians, 86% of departmental leaders, and 73% of line personnel) or the physical
environment is conducive to efficient work (38% agree versus 78% of line personnel, 71% of civilian staff,
and 57% of department leaders).
Line personnel are the most likely to disagree that the approach to staffing develops teamwork or cohesion
in the stations: 71% disagree compared to 38% of station officers, 43% of department leaders, and 21% of
civilian personnel.
Open-Ended Comments
Antiquated IT systems, hardware and software combined with limited bandwidth/slow internet are
perceived to be significant barriers to efficiency and effectiveness.
Our IT is a significant problem! Outdated computers, exceedingly slow internet
connections, excessive security that stalls every possible form of data input or transfer.
Often times I spend as much or more time waiting for our system to work as I do putting in
the data (This is both on MV systems as well as Spillman). It is common to wait 30–60
minutes to bring up a profile when you go to another Station before anything can be done.
We are way too busy these days to waste so much time on non-functional IT systems!
Station 8 has been open for 4 months and there is yet to be internet. How can we be
expected to do our job when we don't have the tools to do it?
Our IT is outdated. Often, I am fighting the systems to do my job rather than just doing it,
reducing efficiency.
Operational & Management Assessment Mountain View Fire Rescue
218
Our internet and intranet speed is ridiculous. It is 2017. AOL dialup is faster than what we
are forced to use to perform our job. The computers we use to navigate and function for
emergencies are constantly breaking and are dangerously outdated. The drag on
department efficiency is crazy.
I can't believe that we use a magnet board to do staffing. 15 years ago, other departments
had online automated scheduling. We still rely on 2SMS and magnets to do staffing. Why is
it that we can't figure that out?
IT is in need of a major improvement. We are currently upgrading but again it is months
passed the original timeline. We fail to realize what tools we need to do our job and invest
in the resources we need.
I can't rely on internet connection at the station. Many of the required online certifications
are slow and difficult to complete. The EMS software is below par from other agencies. We
do not use TeleStaff for staffing.
Our IT system is an absolute joke. Again, the trust issue. Why is it that we have to have
content filters on our network? Where is the personal accountability of our members and
where is the trust in the officers to monitor their people?
Budgets are viewed as too tightly controlled/too centralized. Individual program managers and officers
wonder why they bother creating a budget if they can’t control it or gain access to information regarding
expenditures. The underlying message from administration is “we don’t trust you” and deepens the rift
between line and administration.
Budgets, huh. I am not sure why I ever submit a budget. I never hear anything back on
whether I got my budget or not, and even if I did get my budget, I can't spend $1 of it
without getting approval from someone that is barely involved.
Allow people to actually have budgets and operate within those budgets.
Current financial practices modify program budgets without input from program managers.
There is no initial budget balances for program areas and managers must play the "beg for
cash game" to fulfill program goals and objectives.
Financially speaking, the budget process has been irresponsibly handled in the past. The
budget process is supposed to include the department heads, and they're meant to
convene a couple of times after submitting the initial budget requests to make any
necessary adjustments or provide any clarifications so that the administration can may
informed decisions. This is not happening as it is outlined in the Budget Process. Instead,
the department heads submit their budgets, they're cut out of the entire process, and given
an incredibly low budget with no explanations as to why certain line items were approved
and others weren't. In the budget packet for the Board, there aren't even detailed line items
Operational & Management Assessment Mountain View Fire Rescue
219
for the Board to understand what the money is going to. Most programs are underfunded
and are unable to reallocate the budget approved, because the money can only be spent on
the line items that have been approved by the administration. There is no transparency or
collaboration.
It is impossible to make sense of the budget. As a program manager, it is a nightmare to
order and purchase any supplies. You need a stamp of approval from 2-4 people, depending
who you are, to purchase items. Some people can ask for items and they get them
immediately.
We are all adults in this organization. Allow people to run programs... In my specific case, I
submit a budget request based on needs for the year. I am approved for a certain dollar
amount. Allow me to operate within that budget. I have no problem reporting to an officer
with my ancillary duty, but I consider myself to be a responsible adult. Allow me the
opportunity to prove that I am responsible.
There seems to be little trust in people to perform. A firefighter will run a program that has
a fairly hefty budget associated with it. But they are not given the trust to run the program.
Instead we put in place several middlemen that have to give approval for before they make
any decision. In fact, they are not allowed to make a decision.
Comments about equipment are fairly limited and generally positive but can have a “yeah, but…” flavor to
them.
The department has provided me with some of the best equipment needed to perform the
majority of the expected responsibilities of a firefighter.
Running calls, we have the equipment we need. Staffing and coverage to allow us to train
uninterrupted on said equipment is not on par for getting the job done.
The equipment on the fire trucks are adequate to get out job done. The trucks we use are
good for our job too. Getting new or fixing broken equipment is a slow and difficult process.
For calls I think the district is awesome in acquiring resources to get our job done, but if you
break or lose something OMG it's an act of god to get it replaced, or repaired and then
there's the penalties for the act itself of fear of repercussions.
Finally, while sheer numbers of personnel are not an overt concern, there is a sense that there is too
much overtime and that OT is assigned arbitrarily/unfairly. Also, comments echo concerns
expressed in interviews that constant moving of staff reduced cohesion and efficiency.
Our staffing has never allowed for teamwork and cohesion. For some reason administration
feels that they need to put all the names in a hat and shake them up from time to time. I
can understand moving individuals to meet needs, but there have been too many moves
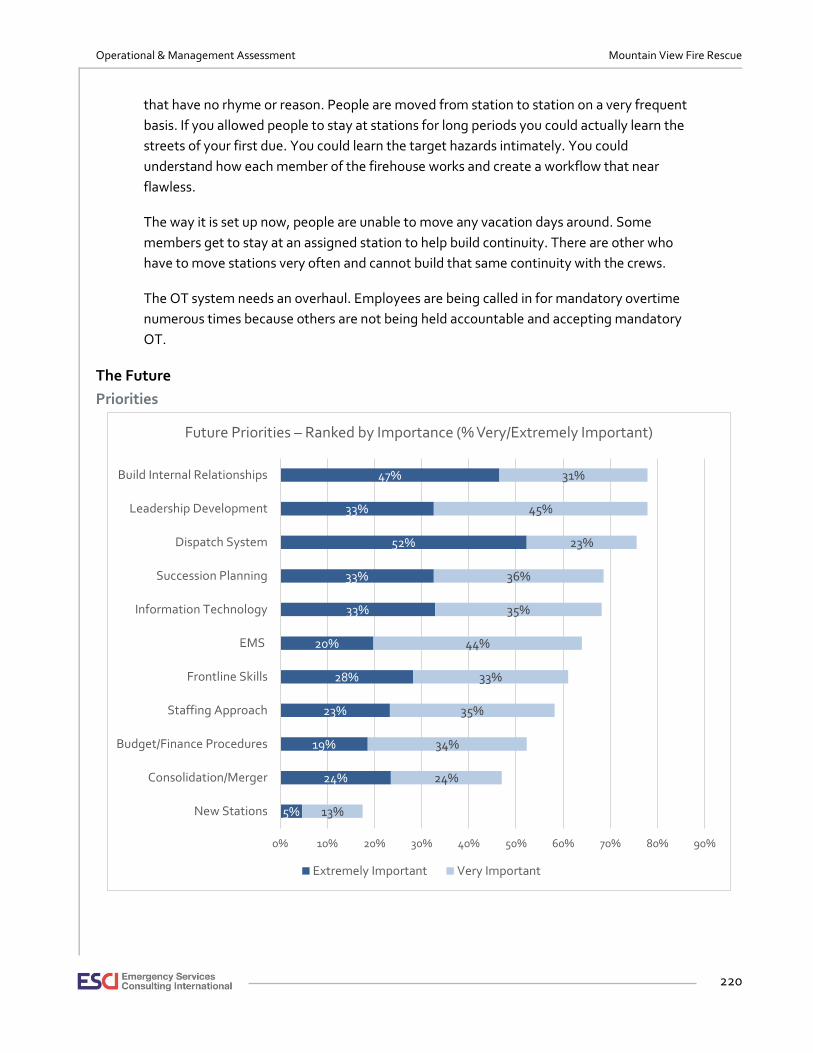
Operational & Management Assessment Mountain View Fire Rescue
220
that have no rhyme or reason. People are moved from station to station on a very frequent
basis. If you allowed people to stay at stations for long periods you could actually learn the
streets of your first due. You could learn the target hazards intimately. You could
understand how each member of the firehouse works and create a workflow that near
flawless.
The way it is set up now, people are unable to move any vacation days around. Some
members get to stay at an assigned station to help build continuity. There are other who
have to move stations very often and cannot build that same continuity with the crews.
The OT system needs an overhaul. Employees are being called in for mandatory overtime
numerous times because others are not being held accountable and accepting mandatory
OT.
The Future
Priorities
5%
24%
19%
23%
28%
20%
33%
33%
52%
33%
47%
13%
24%
34%
35%
33%
44%
35%
36%
23%
45%
31%
0% 10% 20% 30% 40% 50% 60% 70% 80% 90%
New Stations
Consolidation/Merger
Budget/Finance Procedures
Staffing Approach
Frontline Skills
EMS
Information Technology
Succession Planning
Dispatch System
Leadership Development
Build Internal Relationships
Future Priorities – Ranked by Importance (% Very/Extremely Important)
Extremely Important Very Important
Operational & Management Assessment Mountain View Fire Rescue
221
Personnel were asked to evaluate 11 items in terms of how important each was as an area of focus for the
coming year to more effectively and efficiently support MVFR’s mission. The items on this list emerged
most frequently/consistently from the in-depth interviews with both line personnel and departmental
leaders (including the Board). A six-point scale (no midpoint) was used to help discern the top priorities.
Top priorities (combined extremely and very important scores) are building internal relationships,
leadership development, and the dispatch system. In terms of “extremely important” over half of personnel
rated the dispatch system as extremely important (six on the scale) and nearly half rated building internal
relationships as extremely important. These priorities are very consistent with what we heard in in-depth
interviews. Personnel at all levels (and even external stakeholders) made numerous comments about how
the current dispatch system was inefficient and likely to result in “tragedy” for firefighters or civilians or
both. The more specific issues with this system are dealt with elsewhere in the Master Plan report.
There is a very strong sense that the department is highly fragmented with large schisms between line and
management being the key gap. Several interviewees believed this fragmentation and “us versus them”
culture was deliberately cultivated by previous leadership. Others felt it had its origins in the volunteer
versus professional staffing tensions from the early years of the department. Regardless of origins, the vast
majority of personnel believe these tensions work against organizational success and future growth of the
department: so much time is spent on internal tensions and “politics” that inadequate attention and energy
is available for moving the organization forward. Also, as different groups work at cross-purposes with each
other, the organization spins its wheels as it essentially interferes with itself.
Leadership development is viewed as a partial solution to this fragmentation. As noted often in this report,
department leadership in particular is seen as weak in managerial and communication skills and there is
apparently a wide variation in competency among captains (inconsistency). Training in these areas, as well
as in strategic vision and planning techniques, would likely help officers move the organization forward. It is
not clear, however, if the barrier to improvement is willingness or ability. There is a sense among many that
some individuals simply do not want to be collaborative or steward leaders but are locked into an “old
school” authoritarian, hyper-controlling, punitive model established by previous leadership. In these cases,
training may not be the answer and decisions may need to be made regarding their fit in an organization
that wants to change its culture (of course, assuming that changing the culture is desired) and move
forward as a unified whole.
Succession planning as many see retirements looming and information technology are the next most
important priorities from a personnel standpoint. Lower ratings for consolidations/mergers and new
stations suggest a “first things first” orientation from most employees: let’s fix what’s inside first, get
ourselves on the same page, before actively pursuing physical expansion.
Operational & Management Assessment Mountain View Fire Rescue
222
Group Differences
There were remarkably few distinctions by group in this area. Building relationships and the dispatch
system had the highest mean scores (averaging across ratings) for all groups, with the exception of the
dispatch system being of slightly lower priority for civilians. Succession planning was slightly more
important for civilians and departmental leaders. Station officers rated frontline skills as slightly more
important than other groups and department leaders gave higher importance marks to information
technology than did other groups. New stations was a clear lowest priority for all groups. Civilians and line
personnel were more inclined to give lower ratings to consolidation/merger whereas station officers gave
the number 10 spot to EMS and department leaders (in contrast to station officers) gave lower importance
marks to frontline skills.
Bottom line, building relationships and helping leaders build the skills to do so would be time and energy
well spent and uniformly supported throughout the organization. And, of course, tackling the dispatch
system would give a huge operational as well as morale boost to the organization. While expansion cannot
be sidetracked for long given the dynamics of the MVFR external environment, it would be worth solidifying
internal dynamics before aggressively trying to physically grow the department.
Open-Ended Comments
Many open-ended comments were hopeful that the department could weave itself together and move
forward successfully. Most of these comments emphasized the importance of allowing all members of the
organization to have a voice in and be part of the future.
We have many outstanding employees here who want to work and will work to create a
great organization. Admin has to allow and use input the employees actually doing the job
provide, as long as it falls in line with our Mission, Vision, and Values.
We can do the right thing by our employees and they will be loyal for the rest of their
career. Continue to have faith and trust in these people and assist them to become the
future leadership of this organization.
The strength of this job lies in its people. Most everybody here is passionate about our job.
We should focus on strengthening the organization through developing our personnel.
We have some phenomenal members here (not necessarily leadership), and we should
empower them to grow and develop as the future leaders of this organization.
We have a strong group of talent here. It is unfortunate that the leadership has failed for
some many years. We as a group can and will come together and MVFR will be a strong
department in the future.
Pay is not a huge issue. Supporting the guys, giving us ownership and letting us help pave a
future for this department would go a long way.
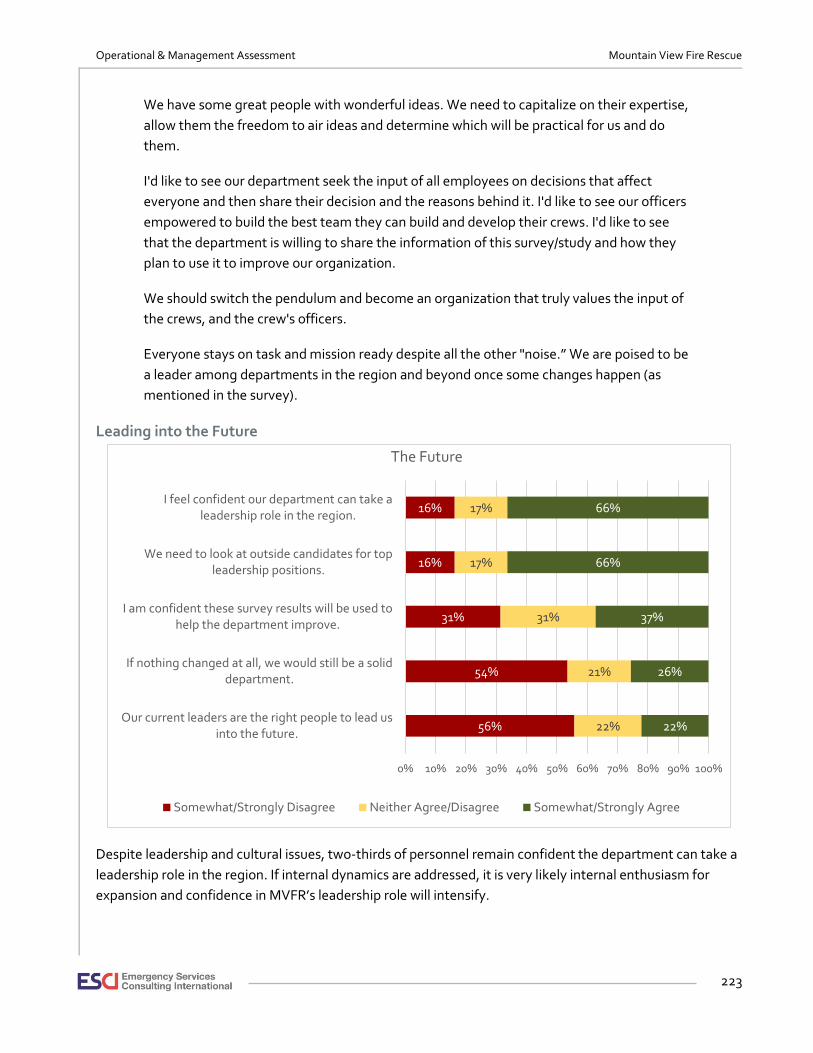
Operational & Management Assessment Mountain View Fire Rescue
223
We have some great people with wonderful ideas. We need to capitalize on their expertise,
allow them the freedom to air ideas and determine which will be practical for us and do
them.
I'd like to see our department seek the input of all employees on decisions that affect
everyone and then share their decision and the reasons behind it. I'd like to see our officers
empowered to build the best team they can build and develop their crews. I'd like to see
that the department is willing to share the information of this survey/study and how they
plan to use it to improve our organization.
We should switch the pendulum and become an organization that truly values the input of
the crews, and the crew's officers.
Everyone stays on task and mission ready despite all the other "noise.” We are poised to be
a leader among departments in the region and beyond once some changes happen (as
mentioned in the survey).
Leading into the Future
Despite leadership and cultural issues, two-thirds of personnel remain confident the department can take a
leadership role in the region. If internal dynamics are addressed, it is very likely internal enthusiasm for
expansion and confidence in MVFR’s leadership role will intensify.
56%
54%
31%
16%
16%
22%
21%
31%
17%
17%
22%
26%
37%
66%
66%
0% 10% 20% 30% 40% 50% 60% 70% 80% 90% 100%
Our current leaders are the right people to lead usinto the future.
If nothing changed at all, we would still be a soliddepartment.
I am confident these survey results will be used tohelp the department improve.
We need to look at outside candidates for topleadership positions.
I feel confident our department can take aleadership role in the region.
The Future
Somewhat/Strongly Disagree Neither Agree/Disagree Somewhat/Strongly Agree
Operational & Management Assessment Mountain View Fire Rescue
224
Two-thirds of personnel believe the department needs to look outside for top leadership positions. This is
echoed in ratings of current leaders being the right people to lead MVFR into the future—over half
disagreed and less than one-quarter agreed with this statement—as well as low levels of agreement that “If
nothing changed we’d still be a solid department.”
During interviews, the need for new leadership was often described as needing “fresh blood” or a brand-
new mindset to counter an entrenched culture/management style. There was a concern that even if current
leaders truly want to change (and there is a sense there is desire on the part of the acting chief and a few
other leaders), they are too steeped in the “old ways” to create the shift that is needed in the organization.
The right external leader would actively question old patterns and not feel encumbered by “how we’ve
always done things here.” Those who have been in the department for decades and came into leadership
positions under the “training” of former leadership would have a more difficult time seeing old patterns
much less feel comfortable/be able to shift quickly to a different management approach.
Finally, it is important to note the very mixed ratings for confidence in these survey results being used to
help the department improve: about one third disagree, one third agree, and another third are “on the
fence.” Interviewees mentioned other assessments or reports in the past that had been “buried” or “tossed
in the trash” because findings did not support what leadership wanted. Also, continuous improvement and
change are not strengths of the department as a whole.
Group Differences
Station officers gave lower ratings through most of this survey and this section is no exception: 81%
disagreed that the current leaders are the right people to lead into the future versus 56% of line, 43% of
civilians, and 29% of department leaders (note that only 43% of department leaders agreed with this
statement). Similarly, 81% disagreed that if nothing changed MVFR would still be a solid department versus
57% of department leaders (only one department leader agreed with this statement), 51% of line personnel,
and 36% of civilians.
Department leaders and line personnel were more like than other groups to agree that “we need to look at
outside candidates for top leadership positions”—roughly 70% of each group agreed compared to just over
50% of civilians and station officers. Department leaders were nearly unanimous in feeling the department
could take a leadership role in the region (86% agree, no disagrees) as compared to 71% of line personnel
and just over 50% of civilians and station officers.
Civilians and department officers were only slightly more likely to agree they were confident the survey
results would be used to improve the department (43% agree each versus 38% of line personnel and station
officers). However, the balance of civilian and department leader ratings were primarily in neither
agree/disagree whereas line personnel and station officers were more evenly split across all ratings.
Open-Ended Comments
New leadership was often noted as important, if not essential, for shifting the culture of the organization
and creating the environment for future success both within the department and externally.
Operational & Management Assessment Mountain View Fire Rescue
225
At the end of the day we are in amazing department with an amazing future if they're
willing to just concede that they are not doing well on the leadership level.
For this department to be as successful as possible, the executive staff (everyone occupying
the administration building) needs to be reevaluated, and in most cases, replaced. We can't
continue to do things the way they have "always been done" and become a more successful
organization. The mindset of "the last Chief said" will never move us forward. We need
fresh ideas, and a new team, to lead us into the future.
I feel we need to look at all options for captains and BC's. I feel with the leaders we have we
are stuck in the old way that the current leaders helped create and they do not want to
change because they had a part in the current ways.
We need change and we need new ideas from the outside. If we want to change the Board
must hire a new chief from the outside. Chief Beebe is a good Chief but there simply has
been to many things done that he was also around for that we need a fresh start and new
ideas.
We continue to think we are better than our neighboring departments thus resulting in
them not wanting to have anything to do with us. Our management is terrible with both
internal and external relationships. I cannot understand why we cannot work with other
departments to consolidate and quit wasting money and resources.
I was disheartened to hear that the Chief search was tabled for 6 months. I was hoping that
they would move forward with a national search. I hope that they find one that is at least 3
states away and knows nothing of MVFPD. I would like to see some new ideas brought in
and executed. Most of the leadership has been here more than 10 years, and they seem to
be tainted with the past. Neighboring departments don't want to deal with us because of
our leadership. We need someone new that can start to rebuild these relationships and has
a new outlook on the situation.
Integrity, transparency, fairness, process, procedures, etc., there are so many things that
MVFR has failed to do right by its employees and community. We have a huge image
problem and I hope a new chief will recognize the damage control that needs to be done!
Our department its well-recognized for not having good leadership which interferes with
our relationships and securing our future.
We truly need to consider a servant-leader style of executive leadership to maximize the
potential of all employees in the district. While a larger district compared to others we
adjoin, a more humble approach would establish a better working relationship with other
service providers.


