

Overview of case studies: Singapore Case study: NTUC FairPrice Mrs. Susan Chong Director Special Projects SPRING SG

Summary • Example of application of the ISO methodology
– NTUC FairPrice: Supermarket retailer • Credits
– SPRING Singapore Project team: Ms. Susan Chong, Director, Special Projects, Mr. Phua Kim-Chua, Head, Standards Division
– Information Technology Standards Committee, Singapore: Ms. Ho Buaey Qui, Executive Secretary
– Nanyang Technological University, Ms. Pauline Ping Ting Ting (MBA student), Mr. Preetesh Deora (MBA Student)
– Mr. Reinhard Weissinger, ISO, Manager, Research, Education, and Strategy

The Company – 1
NTUC FairPrice Co-operative Ltd was founded by the labour movement in Singapore in 1973
Now: Singapore’s largest supermarket retailer with more than 240 sales outlets and a share of over 50% of the market
Sale in 2010: Over SGD 2 billion, net profits: over SGD 120 mill.
Over 7’000 employees Motto: «Service from the Heart» with a corporate vision: «To be Singapore’s Leading World-Class Retailer with a Heart»

The Company – 2
Key business functions of NTUC FairPrice are: Procurement, Warehousing/Distribution, Retail.
Other functions include Finance, Information Systems, Human Resources
NTUC Fairprice’s primary distribution/warehousing system are:
a wholly owned Fresh Food Distribution Centre and
a centralized warehousing and distribution company, Grocery Logistics of Singapore Pte Ltd

Attitude towards standardization ‘As a trusted supermarket retailer in Singapore serving our customers for more than 30 years, maintaining high quality standards and adopting best international practices are integral to FairPrice's promise to deliver quality products at best value and service to our customers. To be able to measure and quantify how our adoption of standards has helped our organisation and our customers is invaluable as it helps us to clearly identify areas that we have done well, areas that we can further improve upon and to also identify gaps that we need to bridge. Similar to how we conduct surveys and gather feedback to further improve our service offerings to customers, the ISO Pilot project gives us the tools to measure how our implementation of standards have impacted our organisation as a whole.“ Mr Gerry Lee, MD (Business Groups) NTUC FairPrice

Attitude towards standardization
NTUC FairPrice is a strong believer in standards and has been involved in the development and the implementation of standards in Singapore for more than 10 years It is certified against HACCP (Hazard Analysis and Critical Control Points) and ISO 9001: 2008 It has won several awards in recent years in the fields of food safety, customer satisfaction, most trusted brands, green business practices

Value Chain
Core BusinessSupporting activitiesIn scope of the study
Source: http://www.slideshare.net/smehro/wal-mart-value-chain-analysis-by-sandro
Supermarket life cycle Market planning Procurement Warehouse( DC ) Retail Return recyclingKey PlayersManufacturerSuppliersLogistics serviceTechnology serviceHuman resourceFinancial service

8
8
Business functions: Key Value Chain Components
1. Procurement
• Central Procurement Division 2. Distribution –Inbound & Outbound Logistics
• Grocery Logistics of Singapore (GLS) • Fresh Food Distribution Centre (FFDC)
3. Food Retail Outlets • Fairprice Supermarkets • Fairprice Finest • Fairprice Xtra (Hypermarket)
Scope of the assessment

Process Flow
Procurement Warehousing/ Distribution
Retail
Supplier Customer
Inbound Logistics Outbound Logistics
Relationship Info Feedback
Legend
Supplier Food delivery
Process Flow

10
10
Key standards applied by NTUC
1. Cold Chain Management - Chilled Pork (TR 20 : 2005 followed by SS 552:2009) 2. Cold Chain Management - Milk and Dairy
Products (TR 2 : 2000 followed by SS CP 95:2002)
3. Pallet Standard : ISO 6780:2003 and SS 334: 2010
4. Carton Barcode standards Primary barcodes
1) EAN 13 2) ISO/IEC 16390: 2007 (or ITF i2of5) 3) ITF-14

11
11
Procurement
Warehousing/Distribution
Retail (Includes direct delivery from
suppliers)
Suppliers of milk, dairy & chilled pork to comply to following standards :
•Cold chain management for milk and dairy •Cold chain management for chilled pork
Standards required for suppliers to :
•Fresh Food Distribution Centre •Cold chain management for milk and dairy (butter & cheese only) •Standard Pallet (local suppliers) •Carton Barcode standards
•Central Warehouse/Distribution Centre •Standard Pallet (local suppliers) •Carton Barcode standards
Standards required for direct delivery : •Cold chain management for milk and dairy •Cold chain management for chilled pork
Business Functions and related standards

Receive supplies from suppliers
•95% of supplies come on pallets in trucks
•About 1800 pallets (about 60000 cartons) per day are received at GLS
•Receiving is done on dedicated area called “receiving bays”
•In case of non-conformance of suppliers to the cold chain management standard, the case is resolved and reported to Procurement
Checking and arranging pallets in
warehouse
•Dedicated staff at DC check the quantity of pallets/ cartons
•Arrange pallets in the warehouse- dedicated space / location for each product category and brand
Inventory management and Storing of stocks
•At FFDC, several quality measures are put in place such as temperature control and humidity control to ensure quality, safety and freshness of food products
•At GLS, the DC is kept are normal room temperature as it deals with non-perishable goods
Prepare and ship orders to retail
stores
•Orders are received through IT system
•Orders are prepared and shipped on every day basis
•Use of trucks and roll cages to delivery orders to individual retail stores
Warehousing and Distribution

Estimated Savings from Standards Summary of impact of Standards across different Business Functions at NTUC FairPrice
In SGD
Standard Procurement Distribution Centre
Retail Total Grocery Logistics of
Singapore (GLS)
Fresh Food Distribution
Centre (FFDC )
Cold Chain Std. Milk & Dairy 7,613 - 31,613 102,451 141,677
Cold Chain Std. Chilled Pork 18,935 - - 622,704 641,639
Standard Pallet - 713,600 - - 713,600
Carton Barcode - 3,064,551 - - 3,064,551
TOTAL 26,548 3,778,151 31,613 815,156 4,516,467

Key Outcomes from Standards for Warehousing/Distribution Process
Warehouse/Distribution Manpower maintained despite 50% increase in number of retail outlets served
Optimised number of Goods Delivery Bays and Warehouse/Distribution space in land scarce Singapore
Quality of butter and cheese maintained throughout supply chain contributing to growth of fresh specialty foods and development of new target markets

Key Impact on Warehouse/Distribution Function
Impact of Standard Pallet & Carton Barcode Standards on Processes • Increase in Productivity • Manual handling of goods by Fairprice replaced by forklifts • No more purchase, sorting , storage & maintenance of pallets • With automated sortation for 60% of throughput, QC activities increased
• Lower operational costs • Lower no of stock takes needed with improved accuracy • Lower no of assets to be purchased for moving pallets • Less processing of damaged goods with reduction in damage cases
Impact of CC Milk & Dairy on butter & cheese handled by FFDC • Better handling along supply chain to retail leading to • Less returns handled from FFDC and Retail Outlets • Less handling of customer return cases • Less processing of product write offs

16
16
1. Annual Benefits - Carton Barcode
Operational efficiency
Accuracy increased from 85% to 97%
Order fulfilment lead time improved by 38%(9 hrs) from 24 hrs for 65 stores to 15 hrs for 98 stores in 2009
Staff productivity improved 50% with the introduction of carton barcode and later, by another 50% with the automated sortation system
Manpower Manpower savings of 50 men to handle same volume of cartons as automated sortation system
83% reduction in manpower(4400) required for stocktaking which has been reduced from 3 to 4 a year to 1 per year with increased accuracies
Benefits from Standards by Function
Distribution Centre (SGD 3.8m)
17
17
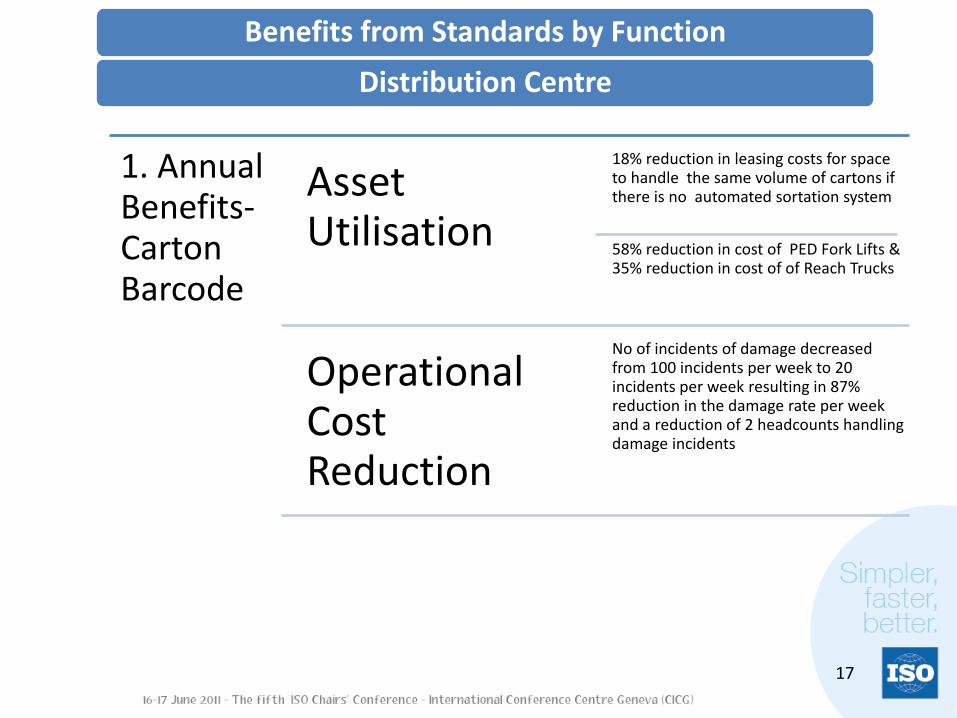
1. Annual Benefits-Carton Barcode
Asset Utilisation
18% reduction in leasing costs for space to handle the same volume of cartons if there is no automated sortation system
58% reduction in cost of PED Fork Lifts & 35% reduction in cost of of Reach Trucks
Operational Cost Reduction
No of incidents of damage decreased from 100 incidents per week to 20 incidents per week resulting in 87% reduction in the damage rate per week and a reduction of 2 headcounts handling damage incidents
Benefits from Standards by Function
Distribution Centre

18
18
2. Annual Benefits - standard pallet
Operational efficiency from standard pallet
77% reduction in manhours (42,240 ) on checking, receiving and arranging supplies on pallets 50% reduction in manhours(4,224) used for sorting pallets 50% reduction in manhours (422) due to better information transfer
Improved asset utilisation
77% reduction in no. of receiving bays
31% reduction in cost of pallets owned
5 figure reduction in cost of warehouse space used to store pallets
3. Annual Benefits - CC Milk & Dairy (Butter & Cheese) at FFDC
Improvement in Operational efficiency:
88% reduction in non conformance cases
92% reduction in customer return cases
Cost reduction 5 figure reduction in write off cost of products
Benefits from Standards by Function
Distribution Centre

Annual Benefits by Function (Assuming all standards implemented at same time)
GLS = Grocery Logistics Singapore

Overall Annual Benefits from Standards
1. SGD 4.5m benefits derived from the implementation of the 4 standards
2. Annual benefits ranged from SGD142 k to SGD 3.1m
• carton bar code standards at SGD 3.1 m • standard pallet at SGD 714 k •milk and dairy at SGD 142 k • chilled pork at SGD 642 k
3. Annual benefits from
•Chilled pork - revenue grew by 22% from 2005 to 2009
•Milk and dairy – revenue doubled from 2003 to 2009.
4. Cold Chain Management Standards assisted growth in revenue from
5. Benefits from cold chain management standards were mainly health and safety benefits & contributed to the more than double revenue growth of fresh foods from 2003 till 2009

Thank you in particular to the ISO staff facilitating the pilot
Mr Reinhard Weissinger Dr Daniele Gerundino
ISO Manager ISO Strategic Adviser Research, Education, and Strategy to the Secretary-General
Thank you for your attention!
http://www.iso.org

REFERENCE SLIDES

24
24
Key value drivers for NTUC
1) Quality of Product and Process 2) Quality and Safety Compliance 3) Partnership with suppliers 4) Efficiency of Process 5) Efficiency of Asset Utilisation 6) Sales effectiveness

25
25
Finding suppliers and concluding contracts
/ agreements
• Suppliers need to meet several product-specific quality requirements
• Limited number of suppliers for each product category depending on various market factors
Receiving stock requirement from
Retail stores
• IT enabled • Stock
requirement received from DC also on basis of their inventory management systems- when stocks reach re-order level
Placing Purchase Orders with suppliers
• IT enabled • Use of SAP to
track purchases and invoices and corresponding payments
Ensuring delivery at DC / Retail
• Perishable products such as chilled pork and milk and yoghurt delivered directly at stores
• Other products such as butter and cheese and non-perishables are delivered at DC
Processing non-conformance and customer
returns
• Non conformance by suppliers
• Customer Returns at Retail stores
• Use of Goods Returned Note
• Only some of the incidences require Procurement’s intervention
Procurement Milk and Dairy & Chilled Pork

26
26
Benefits from Standards by Function- Procurement
1. Annual Savings as a percentage of the annual buyer’s cost:
a) 53% through both CC Milk and Dairy and CC Pork with 38% through CC Pork
2. Total Procurement savings over 5 year period for both standards is more than twice procurement manpower costs
3. Annual Efficiency improvements ranged from 50% to 92% : 1) Supplier communications improved by 50% (422 man hours for
chilled pork & milk and dairy) 2) Contracting for chilled pork improved by 92% (576 man hours) 3) Quality improved with reduction of customer returns(90 man
hours for chilled pork and milk & dairy) and non conformance cases (67 hours for chilled pork and milk & dairy) received from supplier by 75 % to 85%

27
27
Retail Milk and Dairy & Chilled Pork
Receiving supplies &
checking quality
Processing non- conformance of
deliveries
• Non conformance by suppliers
• Use of Goods Returned Note
• Only some of incidences require Procurement intervention
In store quality Check of goods
• Temperature check at chillers
• Quality check • Expiry date check
Processing customer returns
• Perishable products such as chilled pork and milk and yoghurt delivered directly at stores
• Other products such as butter and cheese and non-perishables are delivered at DC
• Infra red readers used for temperature check
Return to supplier/disposal
• Use of Goods Returned Note
• Only some of the incidences require Procurement’s intervention
•Return of milk and dairy to suppliers near expiry date •Mark down of chilled pork on second day of sale •Disposal of chilled pork after 2 days of sale

28
28
1. Company brand image improved with Increased sales, improved customer
satisfaction plus product & service quality 2. Increased variety of milk and dairy products especially specialty foods 3. Increased no of sources of overseas chilled pork suppliers 4. Standardized refrigerating equipment optimized retail space for milk and
dairy products 5. Increased efficiency
a) Reduced man hours for quality checking(33%) b) Reduced time spent on receiving supplies(50%) c) Reduced time spent on disposing pork(50%)
6. Reduced operational cost
a) Reduced cost of goods returned for milk & dairy(50%) b) Reduced cost of pork disposed (33%)
7. Increased shelf life of products with assured safety a) 7 more days for milk & dairy(50% more) b) 1 more day for chilled pork(100% more)
8. Higher quality a) Reduced no. of non conformance cases(78% -99%) b) Reduced no. of customer return cases(67%)
Benefits from Standards by Function- Retail

Year of implementation
in FairPrice
Savings from standards over time (annual averages calculated over a 5-year period)
TOTAL (per year)
Procurement Distribution Centre Retail
1999 713,600 713,600
2000 7,613 713,600+31,613 102,451 855,277
2001 7,613 713,600+31,613 102,451 855,277
2002 7,613 713,600+31,613 102,451 855,277
2003 7,613 713,600+31,613 102,451 855,277
2004 7,613 31,613 102,451 141,677
2005 18,935 622,704 641,639
2006 18,935 622,704 641,639
2007 18,935 622,704 641,639
2008 18,935 3,064,551 622,704 3,706,190
2009 18,935 3,064,551 622,704 3,706,190
Total 132,740 9,855167 3,625,775 13,613,682
Cumulative Benefits by Business Function (1999-2009)
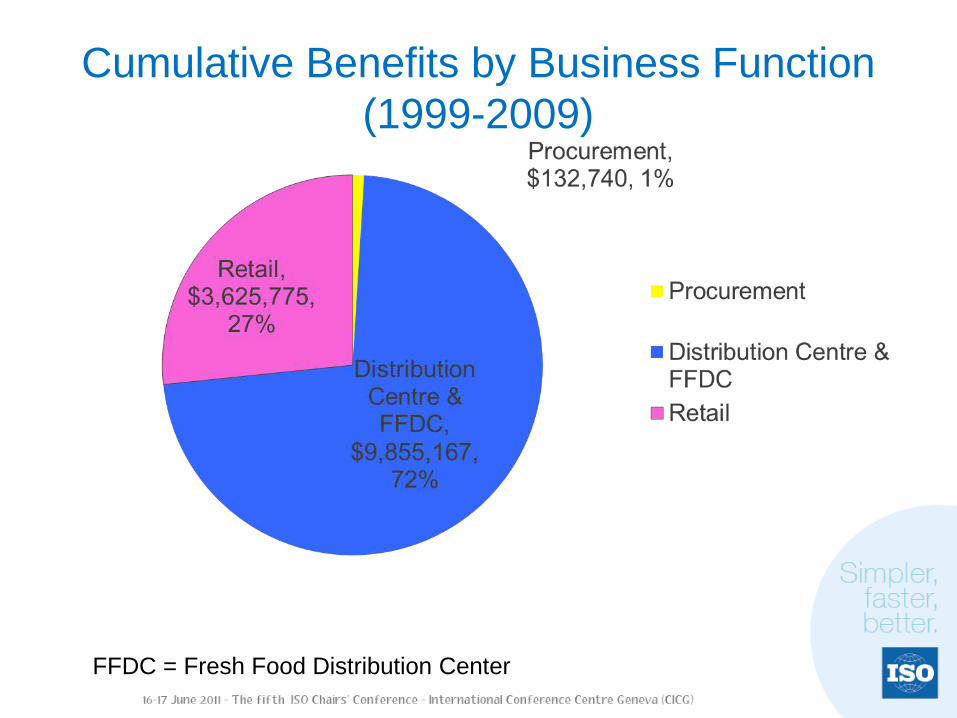
Cumulative Benefits by Business Function (1999-2009)
FFDC = Fresh Food Distribution Center

Annual Benefits by Standard
CC = Cold Chain


