
IEEE TRANSACTIONS ON VEHICULAR TECHNOLOGY, VOL. 40, NO. 2, MAY 1991 29 I
Overview of Cellular CDMA William C. Y. Lee, Fellow, IEEE
Abstract-This paper is a general description of code division multiple access (CDMA). The analysis of power control schemes in CDMA is an original work. The wide-band wave propagation in the cellular environment presents an interesting result (the short-term fading reduction over the wide band-signal in cellu- lar). Also less fading in urban areas than in suburban areas. The advantages of using CDMA listed in this paper have excited the cellular industry. Radio capacity is the key issue in selecting CDMA and is carefully described in this paper.
I. INTRODUCTION
HE development of the code division multiple access T (CDMA) scheme is mainly for capacity reasons. Ever since the analog cellular system started to face its capacity limitation in 1987, the promotion of developing digital cellu- lar systems for increasing capacity has been carried out. In digital systems, there are three basic multiple access schemes, frequency division multiple access (FDMA), time division multiple access (TDMA), and code division multiple access (CDMA). In theory, it does not matter whether the spectrum is divided into frequencies, time slots, or codes, the capacity provided from these three multiple access schemes is the same. However, in the cellular system, we might find that one may be better than the another. Especially in the North American Cellular System, no additional spectrum will be allocated for digital cellular. Therefore, the analog and digi- tal systems will co-exist in the same spectrum. Also, the problem of transition from analog to digital is another consideration. Although the CDMA has been used in satellite communications, the same CDMA system cannot be directly applied to the mobile cellular system. In order to design a cellular CDMA system, we first need to understand the mobile radio environment; then study whether the character- istics of CDMA are suitable for the mobile radio environment or not; and finally describe the natural beauty of applying CDMA in cellular systems.
11. MOBILE RADIO ENVIRONMENT The propagation of a narrow-band carrier signal is a
conventional means of communication. However, in a CDMA system, the propagation of a wide-band carrier signal is used. Therefore, we first describe the propagation of the narrow- band wave, then of the wide-band wave.
A. Narrow-Band (NB) Wave Propagation A signal transmitted from the cell-site and received by
either a mobile unit or a portable unit would propagate over a
Manuscript received August 1, 1990; revised October 1, 1990. This paper was presented at the 1990 IEEE GLOBECOM Conference, San Diego, CA.
The author is with PacTel Cellular, Imine, CA 92714. IEEE Log Number 9 14447 1.
MOBILE PATH
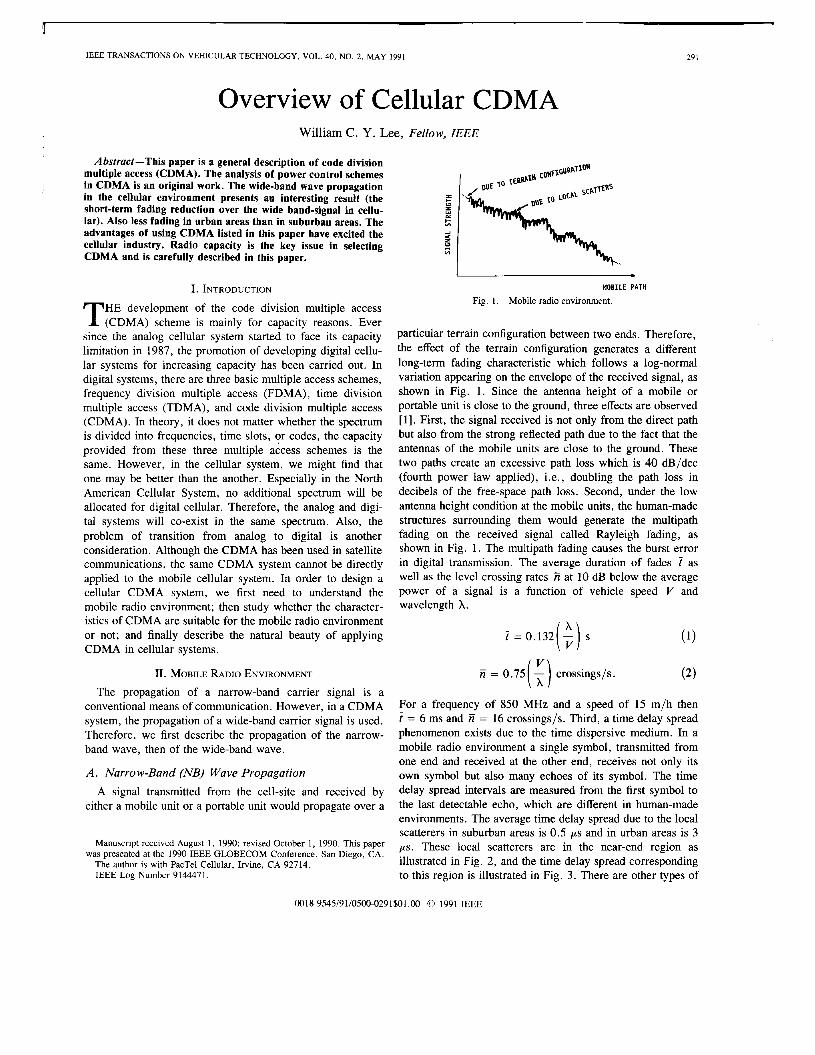
Fig. 1 . Mobile radio environment.
particular terrain configuration between two ends. Therefore, the effect of the terrain configuration generates a different long-term fading characteristic which follows a log-normal variation appearing on the envelope of the received signal, as shown in Fig. 1. Since the antenna height of a mobile or portable unit is close to the ground, three effects are observed [ 11. First, the signal received is not only from the direct path but also from the strong reflected path due to the fact that the antennas of the mobile units are close to the ground. These two paths create an excessive path loss which is 40 dB/dec (fourth power law applied), i.e., doubling the path loss in decibels of the free-space path loss. Second, under the low antenna height condition at the mobile units, the human-made structures surrounding them would generate the multipath fading on the received signal called Rayleigh fading, as shown in Fig. 1. The multipath fading causes the burst error in digital transmission. The average duration of fades ? as well as the level crossing rates 7i at 10 dB below the average power of a signal is a function of vehicle speed V and wavelength A.
? = 0.132( ;) s
(2)
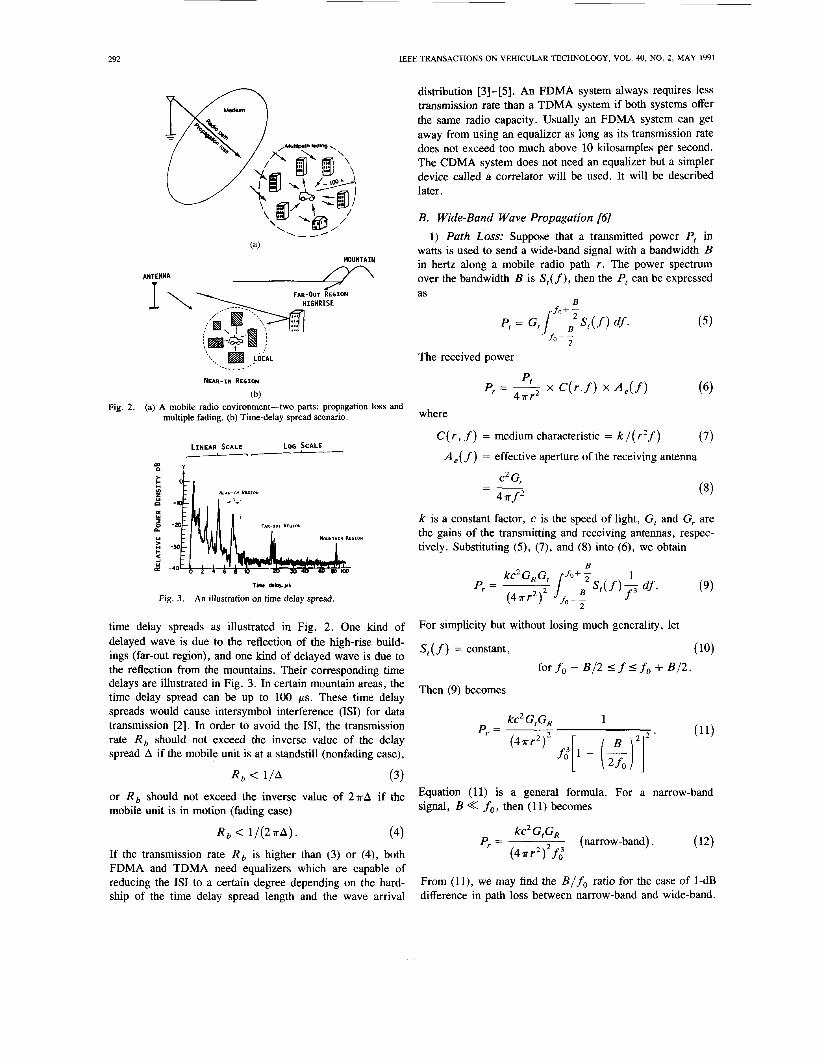
For a frequency of 850 MHz and a speed of 15 m/h then i = 6 ms and ii = 16 crossings/s. Third, a time delay spread phenomenon exists due to the time dispersive medium. In a mobile radio environment a single symbol, transmitted from one end and received at the other end, receives not only its own symbol but also many echoes of its symbol. The time delay spread intervals are measured from the first symbol to the last detectable echo, which are different in human-made environments. The average time delay spread due to the local scatterers in suburban areas is 0.5 ps and in urban areas is 3 ps. These local scatterers are in the near-end region as illustrated in Fig. 2, and the time delay spread corresponding to this region is illustrated in Fig. 3. There are other types of
0018-9545/91/0500-0291$01.00 0 1991 IEEE
292 IEEE TRANSACTIONS ON VEHICULAR TECHNOLOGY, VOL. 40, NO. 2, MAY 1991
\- el/-- - ANTENNA I\
(a) MOUNTAIN
''''\\\ & JOCAL %. .______ -,
NEAR-IN REGION
(b) Fig. 2. (a) A mobile radio environment-two parts: propagation loss and
multiple fading. (b) Time-delay spread scenario.
LINEAR SCALE LOG SCALE
T k . &4.*1
Fig. 3. An illustration on time-delay spread.
distribution [3] - [ 5 ] . An FDMA system always requires less transmission rate than a TDMA system if both systems offer the same radio capacity. Usually an FDMA system can get away from using an equalizer as long as its transmission rate does not exceed too much above 10 kilosamples per second. The CDMA system does not need an equalizer but a simpler device called a correlator will be used. It will be described later.
B. Wide-Band Wave Propagation [6J 1 ) Path Loss: Suppose that a transmitted power P, in
watts is used to send a wide-band signal with a bandwidth B in hertz along a mobile radio path r . The power spectrum over the bandwidth B is S,( f), then the P, can be expressed as
B
The received power D
where
C( r , f) = medium characteristic = k / ( r 2 f ) (7) A e ( f ) = effective aperture of the receiving antenna
k is a constant factor, c is the speed of light, G, and G, are the gains of the transmitting and receiving antennas, respec- tively. Substituting (3, (7), and (8) into (6), we obtain
time delay spreads as illustrated in Fig. 2 . One kind of delayed wave is due to the reflection of the high-rise build- ings (far-out region), and one kind of delayed wave is due to the reflection from the mountains. Their corresponding time delays are illustrated in Fig. 3. In certain mountain areas, the time delay spread can be up to 100 ps. These time delay spreads would cause intersymbol interference (ISI) for data transmission [2] . In order to avoid the ISI, the transmission
For simplicity but without losing much generality, let
s,( f) = constant, ( 10) for f , - B / 2 s f I f , + B / 2 .
Then (9) becomes
1 kc2 G, GR ( 1 1 ) P, = ~
rate R, should not exceed the inverse value of the delay spread A if the mobile unit is at a standstill (nonfading case),
R, C l / A ( 3 )
( 4 r r 2 ) 2 [ ( 2 ; o ) 2 ] z f ; 1 - -
or R, should not exceed the inverse value of 2 a ~ if the mobile unit is in motion (fading case)
Equation ( 1 1 ) is a general formula. For a narrow-band signal, B << fo, then ( 1 1 ) becomes
k C 2 GtGR P, = (narrow-band) . (12)
R, < 1/(27rA). (4) If the transmission rate R, is higher than (3) or (4) , both FDMA and TDMA need equalizers which are capable of reducing the IS1 to a certain degree depending on the hard- ship of the time delay spread length and the wave arrival
(4 ?r r2 ) 2 f :
From ( 1 1 1 , we may find the B/f, ratio for the case of I-dB difference in path loss between narrow-band and wide-band.
P
LEE: OVERVIEW OF CELLULAR CDMA 293
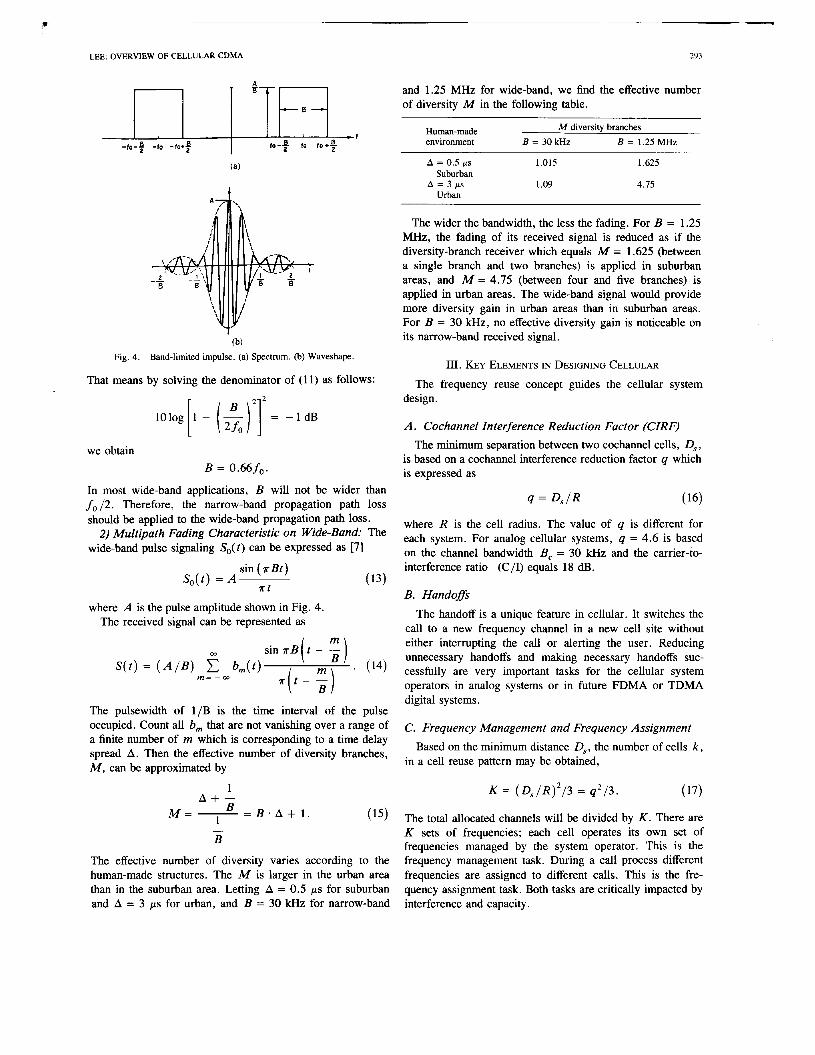
(b) Fig. 4. Band-limited impulse. (a) Spectrum. (b) Waveshape.
That means by solving the denominator of (1 1) as follows:
l0log[1 - -1dB
we obtain B = 0.66 fo.
In most wide-band applications, B will not be wider than fo 12. Therefore, the narrow-band propagation path loss should be applied to the wide-band propagation path loss.
2) Multipath Fading Characteristic on Wide-Band: The wide-band pulse signaling S,(t) can be expressed as [7]
sin (?rBt) ?rt
S o ( t ) = A
where A is the pulse amplitude shown in Fig. 4. The received signal can be represented as
sin ?rB t - -
?r t - - * (14)
i ( ‘If) ~ ( t ) = ( A / B ) 5 bm(t)
m = - m
The pulsewidth of 1/B is the time interval of the pulse occupied. Count all b,,, that are not vanishing over a range of a finite number of m which is corresponding to a time delay spread A. Then the effective number of diversity branches, M, can be approximated by
1 A + -
1
B
(15) M = - - - B . A + l . -
The effective number of diversity varies according to the human-made structures. The M is larger in the urban area than in the suburban area. Letting A = 0.5 ps for suburban and A = 3 ps for urban, and B = 30 kHz for narrow-band
and 1.25 MHz for wide-band, we find the effective number of diversity M in the following table.
M diversity branches Human-made environment B = 3 0 k H z B = 1.25 MHz
A = 0.5 ps 1.015 Suburban
Urban A = 3 p s 1.09
1.625
4.75
The wider the bandwidth, the less the fading. For B = 1.25 MHz, the fading of its received signal is reduced as if the diversity-branch receiver which equals M = 1.625 (between a single branch and two branches) is applied in suburban areas, and M = 4.75 (between four and five branches) is applied in urban areas. The wide-band signal would provide more diversity gain in urban areas than in suburban areas. For B = 30 kHz, no effective diversity gain is noticeable on its narrow-band received signal.
111. KEY ELEMENTS IN DESIGNING CELLULAR
The frequency reuse concept guides the cellular system design.
A . Cochannel Interference Reduction Factor (CIRF) The minimum separation between two cochannel cells, Os,
is based on a cochannel interference reduction factor q which is expressed as
9 = D s / R (16)
where R is the cell radius. The value of q is different for each system. For analog cellular systems, q = 4.6 is based on the channel bandwidth B, = 30 kHz and the carrier-to- interference ratio (C/I) equals 18 dB.
B. Handofls The handoff is a unique feature in cellular. It switches the
call to a new frequency channel in a new cell site without either interrupting the call or alerting the user. Reducing unnecessary handoffs and making necessary handoffs suc- cessfully are very important tasks for the cellular system operators in analog systems or in future FDMA or TDMA digital systems.
C. Frequency Management and Frequency Assignment
in a cell reuse pattern may be obtained, Based on the minimum distance Ds, the number of cells k,
K = ( D S / R ) ’ / 3 = q 2 / 3 . (17)
The total allocated channels will be divided by K. There are K sets of frequencies; each cell operates its own set of frequencies managed by the system operator. This is the frequency management task. During a call process different frequencies are assigned to different calls. This is the fre- quency assignment task. Both tasks are critically impacted by interference and capacity.
~
294 IEEE TRANSACTIONS ON VEHICULAR TECHNOLOGY, VOL. 40, NO. 2, MAY 1991
D. Reverse-Link Power Control The reverse-link power control is for reducing near-end to
far-end interference. The interference occurs when a mobile unit close to the cell site can mask the received signal at the cell site so that the signal from a far-end mobile unit is unable to be received by the cell site at the same time. It is a unique type of interference occurring in the mobile radio environ- ment.
E. Forward-Link Power Control
necessary interference outside its own cell boundary.
F. Capacity Enhancement
handling q in two conditions.
The forward-link power control is used to reduce the
The capacity of cellular systems can be increased by
Within standard cellular equipment-the value of q shown in (16) remains a constant. Reduce the cell radius I?, thus D, reduces. For a smaller 0, the same frequency can be used more often in the same geo- graphical area: that is why we are trying to use small cells (sometimes called microcells or picocells) to in- crease capacity. Chosen from different cellular systems- many different types of radio equipment can be chosen. Search for those cellular systems which can provide smaller values of q. When q shown in (16) is smaller, D, can be less, even if the cell radius remains unchanged. We believe that q is smaller in properly designed digital cellular systems than q in analog systems. Choosing a smaller new q of a new system, we can increase the same amount of capacity without reducing the size of the cell based on the old q of an old system. That is why we are choosing a new digital system to replace the old analog system.
Reducing the size of cells in a system requires more cells. It is always costly. Therefore, the development of digital cellu- lar systems properly is the right choice.
IV. SPREADING TECHNIQUES IN MODULATION Spreading techniques in modulation are generally used in
military systems for antijamming purposes. In general, there are two techniques: 1) spectrum spreading (spread spectrum) and 2) time spreading (time hopping) stated as follows:
A . Spread Spectrum (SS) Techniques
There are two general spread spectrum techniques, direct sequence (DS) and frequency hopping (FH).
I ) Direct Sequence: In direct sequence, each information bit is symbolized by a large number of coded bits called chips. For example, if an information bit rate R = 10 kb/s is used and it needs an information bandwidth B = 10 kHz, and if each bit of 10 kb/s is coded by 100 chips, then the chip rate is 1 Mb/s which needs a DS bandwidth, B,, = 1 MHz. The bandwidth is thus spreading from 10 kHz to 1 MHz. The spectrum spreading in DS is measured by the
processing gain (PG) in decibels
(184 PG = lolog- 4 s (indB).
B Then the PG of the above example is 20 dB. Or we say that this S S system has 20 dB processing gain. The first DS experiment was carried out in 1949 by DeRosa and Rogoff who established a link between New Jersey and California.
2) Frequency Hopping: An FH receiver would equip N frequency channels for an active call to hop over those N frequencies with a determined hopping pattern. If the infor- mation channel width is 10 kHz and there are 100 channels to hop, N = 100, the FH bandwidth B,, = 1 MHz. The spec- trum is spreading from 10 kHz (no hopping) to 1 MHz (frequency hopping). The spectrum spreading in FH is mea- sured by the PG as
PG = lolog N (in dB) . (18b)
Then the PG of the above example is 20 dB. The total hopping frequency channels are called chips. There are two basic hopping patterns; one called fast hopping which makes two or more hops for each symbol. The other called slow hopping which makes two or more symbols for each hop. In general, the transmission data rate is the symbol rate. The symbol rate is equal to the bit rate at a binary transmission. Due to the limitation of today’s technology, the FH is using a slow hopping pattern.
B. Time Hopping A message transmitted with a data rate of R requiring a
transmit time interval T is now allocated at a longer trans- mission time interval T,. In time T, the data are sent in bursts dictated by a hopping pattern. The time interval be- tween bursts t , , also can be varied. The time spreading data rate R, is always less than the information bit rate R . Assume that N bursts occurred in time T , then
N
V. DESCRIPTION OF DS MODULATION
The spread spectra (DS and FH) are used for reducing intentional interference (enemy jamming), and now we are using it for increasing capacity instead of reducing the inten- tional interference. Immediately we realize that the FH with a slow hopping does not serve the purpose of increasing capac- ity. The slow hopping is to let good channels downgrade and bad channels upgrade. In order to have a system design for capacity, all the channels have to be deployed only marginally well. If bad channels do occur in this high capacity S S system, the system does not provide normal channels with excessive signal levels which can average with the poor signal levels of those bad channels to within an acceptable quality level. It just pulls down all the channels to an unacceptable level. The proper way should be either drop the
LEE: OVERVIEW OF CELLULAR CDMA 295
TECHNIQUE
R. = C H I P RATE
Km OUTPUl
0 0 0 1 0 0 1 1 0 1 0 1 1 1 1 p = 2 N - 1
N - NO; OF SHIFT REGISTERS P - LENGTH OF SEQUENCE
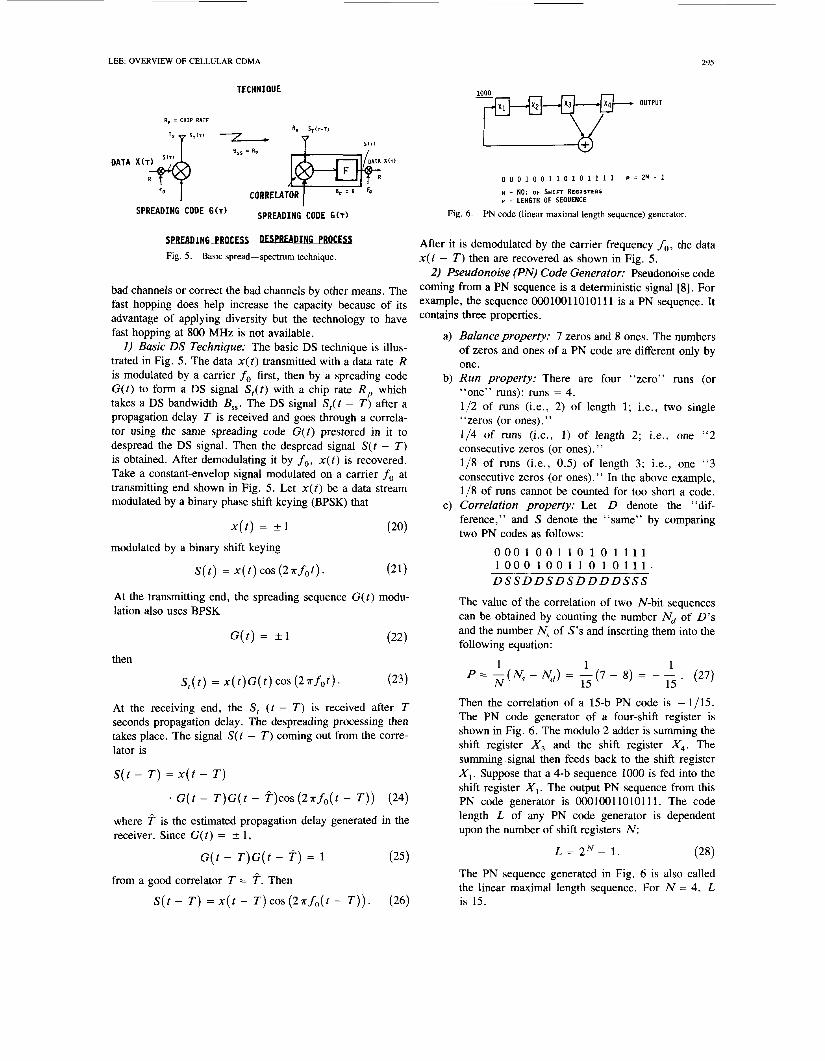
Fig. 6. PN code (linear maximal length sequence) generator.
s l % € A P I I G e B ~ - Fig. 5. Basic spread-spectrum technique.
After it is demodulated by the carrier frequency f,, the data x( t - T ) then are recovered as shown in Fig. 5.
2) Pseudonoise (PN) Code Generator: Pseudonoise code bad channels or correct the bad channels by other means. The fast hopping does help increase the capacity because of its
from a PN sequence is a [81. For the sequence oOoloollololll is a PN sequence* It
advantage of applying diversity but the technology to have fast hopping at 800 MHz is not available.
1) Basic DS Technique: The basic DS technique is illus- trated in Fig. 5. The data x ( t ) transmitted with a data rate R is modulated by a carrier fo first, then by a spreading code G ( t ) to form a DS signal S,(t) with a chip rate R , which takes a DS bandwidth Bss. The DS signal S,(t - T ) after a propagation delay T is received and goes through a correla- tor using the same spreading code G ( t ) prestored in it to despread the DS signal. Then the despread signal S(t - T ) is obtained. After demodulating it by f,, x ( t ) is recovered. Take a constant-envelop signal modulated on a carrier fo at transmitting end shown in Fig. 5. Let x ( t ) be a data stream modulated by a binary phase shift keying (BPSK) that
contains three proprties.
a) Balanceproperty: 7 zeros and 8 ones. The numbers of zeros and ones of a PN code are different only by one.
b) Run property: There are four “zero” runs (or “one” runs): runs = 4. 1/2 of runs (i.e., 2 ) of length 1; i.e., two single ‘‘zeros (or ones). ” 1/4 of runs (i.e., 1) of length 2; i.e., one “ 2 consecutive zeros (or ones), ’ ’ 1/8 of runs (i.e., 0.5) of length 3 ; i.e., one “ 3 consecutive zeros (or ones).” In the above example, 1/8 of runs cannot be counted for too short a code.
c) Correlation property: Let D denote the “dif- ference,” and S denote the “same” by comparing two PN codes as follows: (20) x ( t ) = + 1
s( t ) = x ( t ) cos (2 T f O t ) .
0 0 0 1 0 0 1 1 0 1 0 1 1 1 1 1 0 0 0 1 0 0 1 1 0 1 0 1 1 1 . D S S D D S D S D D D D S S S
modulated by a binary shift keying
(21)
The value of the correlation of two N-bit sequences can be obtained by counting the number Nd of D’s and the number N, of S’s and inserting them into the
1 1 1
S , ( t ) = x ( t ) G ( t ) COS ( 2 ~ f o t ) . (23 ) N 15 15
At the transmitting end, the spreading sequence G( t ) modu- lation also uses BPSK
( 2 2 ) following equation: G ( t ) = +.I
then P = -(x - Nd) = -(7 - 8) = - - . (27)
Then the correlation of a 15-b PN code is - 1/15. The PN code generator of a four-shift register is shown in Fig. 6 . The modulo 2 adder is summing the shift register X , and the shift register X,. The summing signal then feeds back to the shift register XI. Suppose that a 4-b sequence lo00 is fed into the shift register XI. The output PN sequence from this PN code generator is 00010011010111. The code length L of any PN code generator is dependent upon the number of shift registers N :
At the receiving end, the S , ( t - T ) is received after T seconds propagation delay. The despreading processing then takes place. The signal S( t - T ) coming out from the corre- lator is
S( t - T ) = ~ ( t - T )
G ( t - T ) G ( t - COS ( 2 ~ f , ( t - T ) ) ( 2 4 )
where T is the estimated propagation delay generated in the receiver. Since G ( t ) = f 1,
G ( t - T ) G ( t - f) = 1 (25 ) L = 2 N - 1 1 . (28)
from a good correlator T = T. Then The PN sequence generated in Fig. 6 is also called the linear maximal length sequence. For N = 4, L -
S ( t - T ) = ~ ( t - T ) c o s ( ~ T ~ ~ ( ~ - T ) ) . (26) is 15.
IEEE TRANSACTIONS ON VEHICULAR TECHNOLOGY, VOL. 40, NO. 2, MAY 1991 296
interference n
ENVIRONMENT + sT(l-Tl
4 despreading SiOnal
(AT RECEIVER END) interference
S(7-T) &No + -' Fig. 7. Spread spectrum
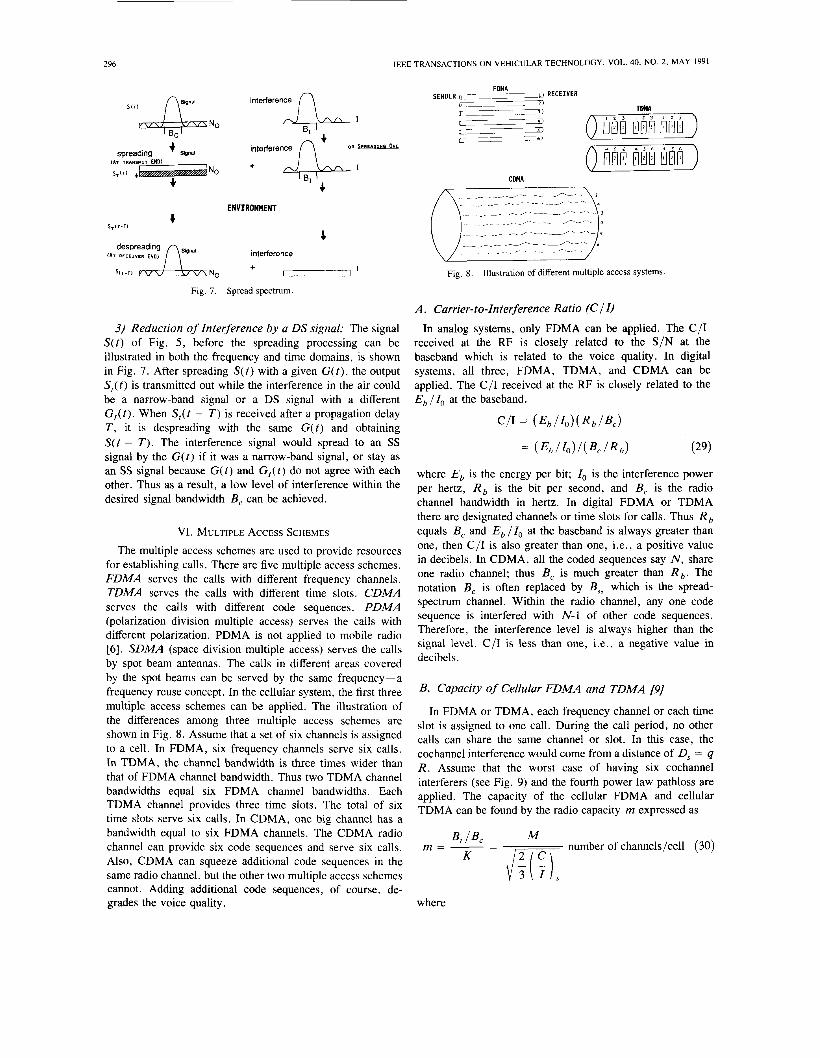
3) Reduction of Interference by a DS signal: The signal S ( t ) of Fig. 5, before the spreading processing can be illustrated in both the frequency and time domains, is shown in Fig. 7. After spreading S ( t ) with a given G ( t ) , the output S,(t) is transmitted out while the interference in the air could be a narrow-band signal or a DS signal with a different G,(t). When S,(t - T ) is received after a propagation delay T , it is despreading with the same G ( t ) and obtaining S ( t - T ) . The interference signal would spread to an SS signal by the G ( t ) if it was a narrow-band signal, or stay as an SS signal because G(t) and G,(t) do not agree with each other. Thus as a result, a low level of interference within the desired signal bandwidth B, can be achieved.
VI. MULTIPLE ACCESS SCHEMES The multiple access schemes are used to provide resources
for establishing calls. There are five multiple access schemes. FDMA serves the calls with different frequency channels. TDMA serves the calls with different time slots. CDMA serves the calls with different code sequences. PDMA (polarization division multiple access) serves the calls with different polarization. PDMA is not applied to mobile radio [6]. SDMA (space division multiple access) serves the calls by spot beam antennas. The calls in different areas covered by the spot beams can be served by the same frequency-a frequency reuse concept. In the cellular system, the first three multiple access schemes can be applied. The illustration of the differences among three multiple access schemes are shown in Fig. 8 . Assume that a set of six channels is assigned to a cell. In FDMA, six frequency channels serve six calls. In TDMA, the channel bandwidth is three times wider than that of FDMA channel bandwidth. Thus two TDMA channel bandwidths equal six FDMA channel bandwidths. Each TDMA channel provides three time slots. The total of six time slots serve six calls. In CDMA, one big channel has a bandwidth equal to six FDMA channels. The CDMA radio channel can provide six code sequences and serve six calls. Also, CDMA can squeeze additional code sequences in the same radio channel, but the other two multiple access schemes cannot. Adding additional code sequences, of course, de- grades the voice quality.
SENDER RECEIVER
V
,
Fig. 8. Illustration of different multiple access systems.
A . Carrier-to-Interference Ratio (C/ I)
In analog systems, only FDMA can be applied. The C/I received at the RF is closely related to the S/N at the baseband which is related to the voice quality. In digital systems, all three, FDMA, TDMA, and CDMA can be applied. The C/I received at the RF is closely related to the Eb / I o at the baseband.
where Eb is the energy per bit; I, is the interference power per hertz, R b is the bit per second, and B, is the radio channel bandwidth in hertz. In digital FDMA or TDMA there are designated channels or time slots for calls. Thus R b equals B, and E, / I o at the baseband is always greater than one, then C/I is also greater than one, i.e., a positive value in decibels. In CDMA, all the coded sequences say N , share one radio channel; thus B, is much greater than R,. The notation B, is often replaced by B,, which is the spread- spectrum channel. Within the radio channel, any one code sequence is interfered with N-1 of other code sequences. Therefore, the interference level is always higher than the signal level. C/I is less than one, i.e., a negative value in decibels.
B. Capacity of Cellular FDMA and TDMA [9J
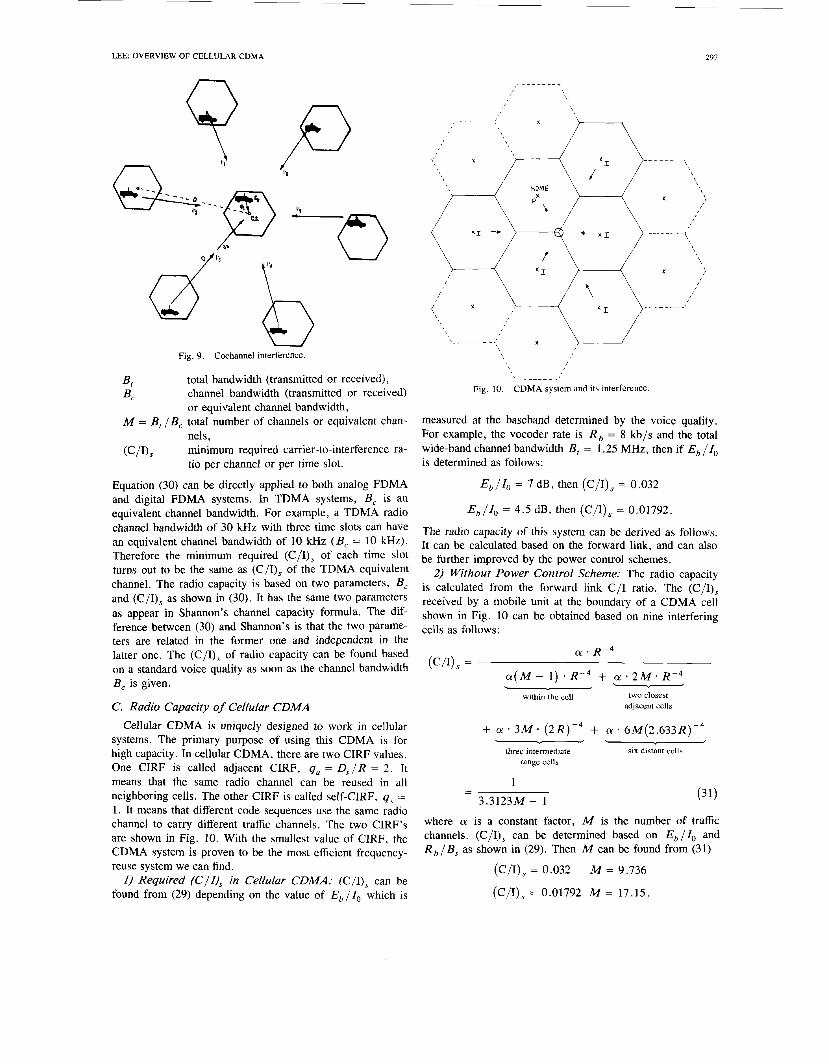
In FDMA or TDMA, each frequency channel or each time slot is assigned to one call. During the call period, no other calls can share the same channel or slot. In this case, the cochannel interference would come from a distance of D, = q R . Assume that the worst case of having six cochannel interferers (see Fig. 9) and the fourth power law pathloss are applied. The capacity of the cellular FDMA and cellular TDMA can be found by the radio capacity m expressed as
where
LEE: OVERVIEW OF CELLULAR CDMA
Q
Fig. 9. Cochannel interference.
B, total bandwidth (transmitted or received), BC channel bandwidth (transmitted or received)
or equivalent channel bandwidth, M = B, / B , total number of channels or equivalent chan-
nels, (C/QS minimum required carrier-to-interference ra-
tio per channel or per time slot.
Equation (30) can be directly applied to both analog FDMA and digital FDMA systems. In TDMA systems, B, is an equivalent channel bandwidth. For example, a TDMA radio channel bandwidth of 30 lcHz with three time slots can have an equivalent channel bandwidth of 10 kHz ( B , = 10 H z ) . Therefore the minimum required (C/I)s of each time slot turns out to be the same as (C/I)s of the TDMA equivalent channel. The radio capacity is based on two parameters, B, and (C/I)s as shown in (30). It has the same two parameters as appear in Shannon's channel capacity formula. The dif- ference between (30) and Shannon's is that the two parame- ters are related in the former one and independent in the latter one. The (C/I), of radio capacity can be found based on a standard voice quality as soon as the channel bandwidth B, is given.
C. Radio Capacity of Cellular CDMA Cellular CDMA is uniquely designed to work in cellular
systems. The primary purpose of using this CDMA is for high capacity. In cellular CDMA, there are two CIRF values. One CIRF is called adjacent CIRF, qa = D,/R = 2. It means that the same radio channel can be reused in all neighboring cells. The other CIRF is called self-CIRF, q, = 1. It means that different code sequences use the same radio channel to carry different traffic channels. The two CIRF's are shown in Fig. 10. With the smallest value of CIRF, the CDMA system is proven to be the most efficient frequency- reuse system we can find.
1) Required (C/I)s in Cellular CDMA: (C/I), can be found from (29) depending on the value of E, / I o which is
- - - - - - - - Fig. 10. CDMA system and its interference
measured at the baseband determined by the voice quality. For example, the vocoder rate is R , = 8 kb/s and the total wide-band channel bandwidth B, = 1.25 MHz, then if E, / I , is determined as follows:
E,/Zo = 7 dB, then (C/I)s = 0.032
E,/Zo = 4.5 dB, then (C/I), = 0.01792.
The radio capacity of this system can be derived as follows. It can be calculated based on the forward link, and can also be further improved by the power control schemes.
2) Without Power Control Scheme: The radio capacity is calculated from the forward link C/I ratio. The (C/QS received by a mobile unit at the boundary of a CDMA cell shown in Fig. 10 can be obtained based on nine interfering cells as follows:
+w- 1 ) . ~ - 4 + a - 2 ~ . ~ - 4 ,v
within the cell two closest adjacent cells
+ a 3 M . ( 2 R ) - 4 + a * 6~W(2 .633R) -~
three intermediate- six distant cells range cells
1
3.3123M - 1 - -
where a is a constant factor, M is the number of traffic channels. (C/I)s can be determined based on Eb/Zo and R / B, as shown in (29). Then M can be found from (3 1 )
(C/I), = 0.032 M = 9.736
(C/I), = 0.01792 M = 17.15.
298 IEEE TRANSACTIONS ON VEHICULAR TECHNOLOGY, VOL. 40, NO. 2, MAY 1991
The radio capacity defined in (30)
M K
where M = ?$‘=,M,. There are L groups of mobile units. Each one of L is equally circled around the cell site. Where Me is the number of mobile units in the Ith group depending on its location. k is a constant. Equa- tion (36) indicates that fewer mobile units are closely circling around the cell site, more mobile units are at the outside ring of the cell site. Assume that the dis- tance ro is from the cell site to a desired mobile unit,
m = - number of traffic channels/cell. (32)
In this case K = 42/3 = 4/3 = 1.33. Therefore,
m = M/1.33 = 7.32 traffic channels/cell for E b / z o = 7 dB = 12.9 traffic channels/cell for Eb / I o = 4.5 dB.
3) With Power Control Scheme: We can increase the radio capacity by using a proper power control scheme. The power control scheme used at the forward link of each cell can reduce the interference to the other adjacent cells. The less the interference generated in a cell, the more the value of M increases. In (31), we notice that if we can neglect all the interference, then, as shown in Fig. 10
for
(C/I)s = 0.032 M = 30.25
(C/I)s = 0.01792 M = 54.8.
Comparing (31) with (33), the total number of traffic chan- nels M is drastically reduced due to the existence of interfer- ence. However, since interference is always existing in the adjacent cells, we can only reduce it by using a power control scheme. By using a power control scheme the total power after combining all traffic channels should be considered in two cases. a) The necessary power delivery to the close-in mobile unit and b) The total power reduced at the boundary.
a) The necessary power delivery to a close-in mobile unit. The transmitted power at the cell site for the jth mobile unit is Pi, which is proportional to rj”.
Pj 0: rj” (34)
where rj is the distance between the cell site and the jth mobile unit. n is a number. In examining the number n , we find that the power control scheme of using n = 2 in (34) can provide the optimum capacity and also meet the requirement that the forward link signal can still reach the near-end mobile unit at dis- tance rj from the cell site with a reduced power
Pj = PR( ;)z (35)
where PR is the power required to reach those mobile units at the cell boundary R . The M mobile units served by M traffic channels are assumed uniformly distributed in a cell. Then
p(M,) = kr, , 0 I r, I R (36)
also assume that ro is a near-in distance between the mobile unit and the cell site. With the help of (34) and (35) the power transmitted from the cell site, P,, is equal to
MI M2 M3 ML P* = P I + P2 + P3 + * . ‘ + PL
= P R [ k r l ( ~ ) 2 + k r 2 ( ~ ) 2 + + k r L ( ? i 2 ] .
(37) Since rL is the distance from the cell site to the ceil boundary, rL = R then (37) becomes
R2 4
dr = P R k - . (38)
The total number of mobile units M can be obtained as L
M = MI = k ( r , + r2 + + R ) I = 1
R 2
2 = k l R r d r = k - . (39)
Substituting (39) into (38):
M
If the full power PR is applied to every channel, then
P, = MP,. (41)
Comparing (40) and (41), the total transmitted power reduces to one-half by using the power control scheme of (35). The (C/I)s of a mobile unit at a distance of ro which is close to the cell site is
. (42) P R ( r O / R ) 2 * r04 ( r O / R ) 2 -- -
(c’l)sl = P R ( M / 2 ) r,74 (M/2)
The interference from the adjacent cells can be ne- glected in (42) in this case.
b) The total power is reduced at the cell boundary. The (C/I)s of a mobile unit at a distance R which is at the cell boundary can be obtained similarly to (31).
LEE: OVERVIEW OF CELLULAR CDMA 299
The values of M and m can be found from (43) for the case of applying the power control scheme. M = 18.87, m = 14.19, (CJI) = 0.032 ( - 15 dB) M = 23.7, m = 28.33, (C/I) = 0.01792 ( - 17 dB).
At this time, (C/I)s received by the mobile unit at the distance ro from (42) should be checked with (43) to see whether it is valid or not.
(44)
In (U), the power reduction ratio ( r / R)* has to be not less than 0.302 for those mobile units located less than the distance ro which is 0.55R. If we set the lowest power to be 0.302PR then the total power has to be changed.
1 r; r: [221 R R P t = P R k - r +,+,+.**
= PRk[ (4)’J,’”.dr + 1;; dr]
= P R k g [ l 4 + (:I4]. For r o / R = 0.55, then ( r 0 / R ) 4 = 0.0913. The transmitted power Pt in (46) has to be adjusted as
Pt = PRk(R2/4) x 1.0913 = PR(M/2) X 1.0913.
(47) Equation (47) indicates that by setting the condition of the lowest power per traffic channel to be 0.302PR at the cell site to serve the mobile units within and equal to the distance ro, ro = 0.55 R , the total power at the cell site is slightly increased by 1.0913 times as com- pared with (38). Under the adjusted transmitted power Pt as shown in (47), the actual values of M and m are reduced.
M = 18.87/1.0913 = 17.3, m = 13 for (C/I)s =0.032
m = 25.96 for (C/I)s = 0.1792. M = 33.7/1.0913 = 30.9,
(48)
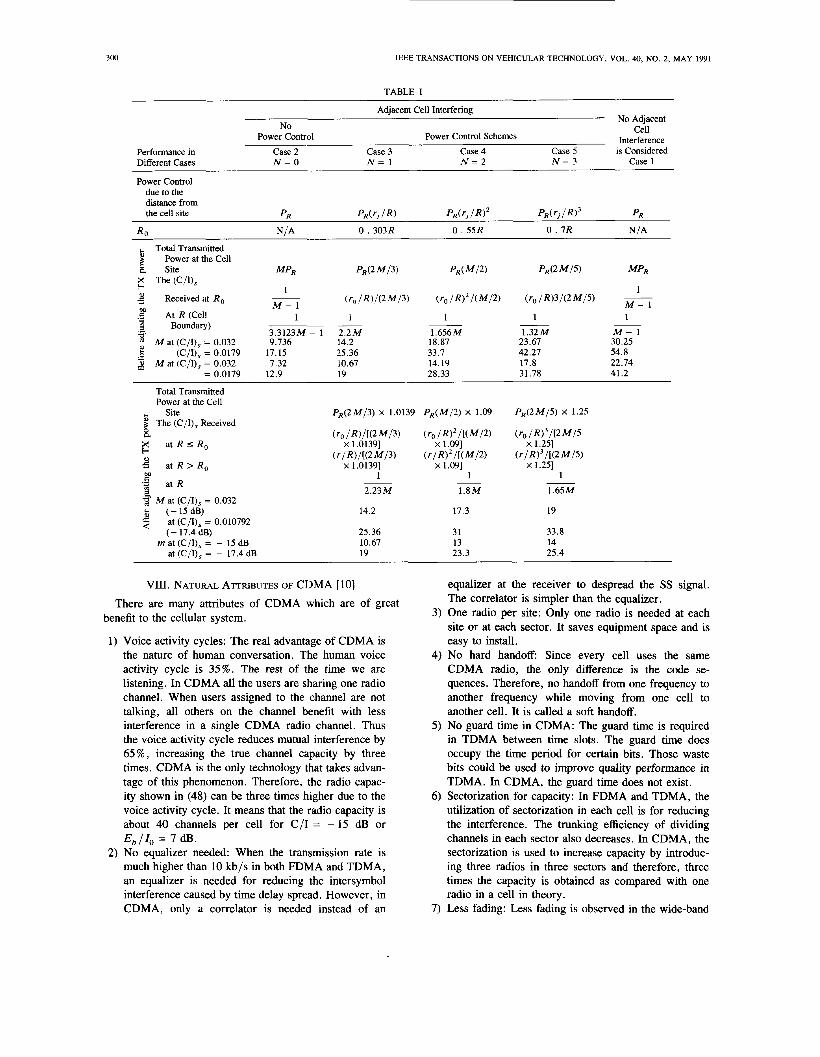
Case 4 : Power control with n = 2, adjacent cell interfer-
Case 5: Power control with n = 3, adjacent cell interfer-
In Table 1, Case 1 is not a real case. In Case 2, without power control, the performance is poor. The power control schemes are used in Cases 3-5. In these cases, in order to provide the minimum transmitted power at the cell site for serving those mobile units within or equal to the distance of ro, the total transmitted power at the cell site increases as indicated under the heading “after adjusting the transmitted power.” Comparing the number of channels per cell m among Cases 3-5, we found that Case 4 has two channels more than Case 3 but one channel less than Case 5 . How- ever, Case 5 is harder to implement than Case 4. One channel gained in Case 5 over Case 4 can be washed out in the practical situation. When the power control schemes of n > 3 are used, no further improvement in radio capacity is found. Therefore, we conclude that n = 2 in Case 4 is a better choice.
VII. REDUCTION OF NEAR-FAR RATIO INTERFERENCE IN
CDMA
In CDMA, all traffic channels are sharing one radio chan- nel. Therefore a strong signal received from a near-in mobile unit will mask the weak signal from a far-end mobile unit at the cell site. To reduce this near-far ratio interference, a power control scheme should be applied on the reverse link. As a result, the signals received at the cell site from all the mobile units within a cell remain at the same level. The scheme is described as follows. The power transmitted from each mobile unit has to be adjusted based on its distance from the cell site, as
ence is considered.
ence is considered.
(49)
where PR, r , and R are mentioned previously, and a fourth power rule is applied in (49). Neglecting the interfering signals from adjacent cell, the C/I received from a mobile unit J , at the cell site can be obtained as
Comparing (48) with (U), we find no significant change of M and m when the adjusted transmitted power is applied.
The C/I of (48) has to be greater than or equal to the required (C/I)s,
C/I 1 (c& (51) D. Comparison of Diflerent Cases in CDMA
Applying (51) in (50), we obtain
M = 30.25, m = 22.74, for (C/I)s = 0.032 ( - 15 dB) M = 54.5, m = 41.2, for (CJI). = 0.01792 ( - 17 dB).
The number of channels M obtained from the reverse link is much higher than that from the forward channel as shown in Table I. It indicates that the effort is to increase the number of channels on the forward link for more radio capacity.
Table I lists the performance of five different cases:
Case I: No adjacent cell interference is considered (this is
Case 2: No power control, adjacent cell interference is
case 3: Power control with n = 1, adjacent cell interfer-
not a real case).
considered.
ence is considered.
300 IEEE TRANSACTIONS ON VEHICULAR TECHNOLOGY, VOL. 40, NO. 2, MAY 1991
TABLE I
Adjacent Cell Interfering No Adjacent
Cell Power Control Power Control Schemes Interference
Performance in Case 2 Case 3 Case 4 Case 5 is Considered Different Cases N = O N = 1 N = 2 N = 3 Case 1
No
Power Control due to the distance from the cell site
R, NIA 0 . 303R 0 . 5 5 R 0 . 7R N/A
Total Transmitted 3 Power at the Cell g Site X The(C/I), b 4 Received at Ro
.$ At R (Cell 5 Boundary)
M a t (C/I)s = 0.032 2 (C/I)s = 0.0179 & M a t (C/I), = 0.032
= 0.0179
$
1
M - 1 1 1 1 1
3 .3123M- 1 2 .2M 1.656M 1.32M 9.736 14.2 18.87 23.67
17.15 25.36 33.7 42.27 7.32 10.67 14.19 17.8
12.9 19 28.33 31.78
1 M - 1 1
M - 1 30.25 54.8 22.74 41.2
Total Transmitted Power at the Cell
5 The (C/I)s Received
5 at R I R ,
5 at R > R,
.3 at R
5 Mat (C/Os = 0.032
$ at (C/US = 0.010792
m at (C/I)s = - 15 dB
Site
8
al
M
(-15dB)
( - 17.4 dB)
at (C/I)- = - 17.4 dB
2.23M
14.2
25.36 10.67 19
1 .8M
17.3
31 13 23.3
1.65M
19
33.8 14 25.4
VIII. NATURAL ATTRIBUTES OF CDMA [lo] There are many attributes of CDMA which are of great
benefit to the cellular system.
Voice activity cycles: The real advantage of CDMA is the nature of human conversation. The human voice activity cycle is 35%. The rest of the time we are listening. In CDMA all the users are sharing one radio channel. When users assigned to the channel are not talking, all others on the channel benefit with less interference in a single CDMA radio channel. Thus the voice activity cycle reduces mutual interference by 65%, increasing the true channel capacity by three times. CDMA is the only technology that takes advan- tage of this phenomenon. Therefore, the radio capac- ity shown in (48) can be three times higher due to the voice activity cycle. It means that the radio capacity is about 40 channels per cell for C/I = - 15 dB or Eb/Zo = 7 dB. No equalizer needed: When the transmission rate is much higher than 10 kb/s in both FDMA and TDMA, an equalizer is needed for reducing the intersymbol interference caused by time delay spread. However, in CDMA, only a correlator is needed instead of an
equalizer at the receiver to despread the S S signal. The correlator is simpler than the equalizer. One radio per site: Only one radio is needed at each site or at each sector. It saves equipment space and is easy to install. No hard handoff Since every cell uses the same CDMA radio, the only difference is the code se- quences. Therefore, no handoff from one frequency to another frequency while moving from one cell to another cell. It is called a soft handoff. No guard time in CDMA: The guard time is required in TDMA between time slots. The guard time does occupy the time period for certain bits. Those waste bits could be used to improve quality performance in TDMA. In CDMA, the guard time does not exist. Sectorization for capacity: In FDMA and TDMA, the utilization of sectorization in each cell is for reducing the interference. The trunking efficiency of dividing channels in each sector also decreases. In CDMA, the sectorization is used to increase capacity by introduc- ing three radios in three sectors and therefore, three times the capacity is obtained as compared with one radio in a cell in theory. Less fading: Less fading is observed in the wide-band
LEE: OVERVIEW OF CELLULAR CDMA 30 1
signal while propagating in a mobile radio environ- ment. More advantage of using a wide-band signal in urban areas than in suburban areas for fading reduc- tion as described in Section II-B.
8) Easy transition: In a situation where two systems, analog and CDMA, have to share the same allocated spectrum, 10% of the bandwidth (1.25 MHz) will increase two times ( = 0.1 x 20) of the full bandwidth of FM radio capacity as shown below. Since only 5% (heavy users) of the total users take more than 30% of the total traffic, the system providers can let the heavy users exchange their analog units for the dual mode (analog/CDMA) units and convert 30% of capacity to CDMA on the first day of CDMA operations.
B, = 1.25 MHz, the total bandwidth
B,, = 1.25 MHz the CDMA radio channel
B, = 30 kHz for FM
B, = 30 kHz and three time slots for TDMA .
9) Capacity advantage: Given that
Capacity of FM 1.25/30 = 41.6 1.25 x lo6
total numbers of channels =
the cell reuse pattern K = 7
30 x 103 = 41.67 channels
41.67
7 the radio capacity mFM = - - 6 -
channels /cell. Capacity of TDMA
1.25 x lo6 total number of channels = 125 io x 103
channels the cell reuse pattern K = 4 (assumed)
the radio capacity mTDMA = - = 31.25 125 4
channels/cell. Capacity of CDMA
total number of channels / cell, m = 13 the cell reuse pattern K = 1.33 the radio capacity, take (48) at E, / I = 7 dB
add voice activity cycle and sectorization, mCDMA = 13 x 3 x 3 = 120 channels/cell.
Therefore,
10) No frequency management or assignment needed: In FDMA and TDMA, the frequency management is always a critical task to carry out. Since there is only one common radio channel in CDMA, no frequency management is needed. Also, the dynamic frequency would implement in TDMA and FDMA to reduce real-time interference, but needs a linear broad-band power amplifier which is hard to develop. CDMA does not need the dynamic frequency assignment.
11) Soft capacity: In CDMA, all the traffic channels share one CDMA radio channel. Therefore, we can add one
additional user so the voice quality is just slightly degraded as compared to that of the normal 40-chan-
41 ne1 cell. The difference in decibels is only 10 log -
40 which is 0.24 dB down in C/I ratio.
12) Coexistence: Both systems, analog and CDMA can operate in two different spectras, and CDMA only needs 10 % of bandwidth to general 200 % of capac- ity. No interference would be considered between two systems.
13) For microcell and in-building systems: CDMA is a natural waveform suitable for microcell and in-build- ing because of being susceptible to the noise and the interference.
IX. CONCLUSION
The overview of CDMA highlights the potential of increas- ing capacity in future cellular communications. This paper describes the mobile radio environment and its impact on narrow-band and wide-band propagation. The advantage of having CDMA in cellular systems is depicted. The concept of radio capacity in cellular is also introduced. The power control schemes in CDMA have been carefully analyzed. The natural attributes of CDMA provide the reader with the reasons that cellular is considering using it. This paper leads the reader to understand two CDMA papers [ 1 11, [ 121, which are analyzed in more depth in this issue, and to build interest in CDMA by reading other references [13]-[19].
REFERENCES W. C. Y. Lee, Mobile Cellular Telecommunication System. New York: McGraw-Hill, 1989, ch. 4. - , Mobile Communications Engineering. New York: Mc- Graw-Hill, 1982, pp. 340-399. J. G. Proakis, “Adaptive equalization for a TDMA digital mobile radio,” ZEEE Trans. Veh. Technol., pp. 333-341, this issue. S. N. Crozier, D. D. Falconer, and S. Mahmond, “Short-block equalization techniques employing channel estimation for fading time-dispersive channels,” in Proc. ZEEE Veh. Technol. Cony., San Francisco, CA, 1989, pp. 142-146. P. Monsen, “Theoretical and measured performance of a DEF mo- dem on a fading multipath channel,” ZEEE Trans. Commun., vol.
W. C. Y. Lee, Mobile Communications Design Fundamentals, New York: Howard W. Sams, 1986, p. 274. M. Schwartz, W. R. Bennett, and S. Stein, Communications Sys- tems and Techniques, B. Sklar, Digital Communications, Fundamentals and Applica- tions. Englewood Cliffs, NJ: Prentice-Hall, 1988, p. 546. W. C. Y. Lee, “Spectrum efficiency in cellular,” ZEEE Trans. Veh. Technol., vol. 38, pp. 69-75, May 1989. PacTel Cellular and Qualcomm, “CDMA cellular-The next genera- tion,” a pamphlet distributed at CDMA demonstration, Qualcomm, San Diego, CA, Oct. 20-Nov. 7, 1989. K. S. Gilhousen, I. M. Jacobs, R. Padovani, A. J. Viterbi, L. A. Weaver, and C. E. Wheatley, “On the capacity of a cellular CDMA system,” ZEEE Trans. Veh. Technol., pp. 303-312, this issue. R. L. Pickholtz, L. B. Milstein, and D. L. Schilling, “Spread spectrum for mobile communications,” ZEEE Trans. Veh. Technol., pp. 313-322, this issue. A. J . Viterbi, “When not to spread spectrum-A sequel,” ZEEE Communications Mag., vol. 23, pp. 12-17, Apr. 1985. L. B. Milstein, R. L. Pickholtz, and D. L. Schilling, “Optimization of the processing gain of an FSK-FH system,” ZEEE Trans. Com- mun., vol. COM-28, pp. 1062-1079, July 1980. G. K. Huth, “Optimization of coded spread spectrum system perfor- mance,” ZEEE Trans. Commun., vol. COM-25, pp. 763-770, Aug. 1977.
COM-25, pp. 1144-1153, Oct. 1977.
New York: McGraw-Hill, 1966, p. 561.
302 IEEE TRANSACTIONS ON VEHICULAR TECHNOLOGY, VOL. 40, NO. 2, MAY 1991
[16] M. K. Simon, J. K. Omura, R. A. Scholtz, and B. K. Levitt, Spread Spectrum Communications, vol. 2. Rockville, MD: Computer Sci- ence Press, 1985.
[17] R. L. Pickholtz, D. L. Schilling, and L. B. Milstein, “Theory of spread-spectrum communications-A tutorial,” IEEE Trans. Com- mun., vol. COM-30, pp. 855-884, May 1982. R. A. Scholtz, “The origins of spread spectrum communications,” IEEE Trans. Commun., vol. COM-30, pp. 882-854, May 1982. A. J. Viterbi, “Spread spectrum communications-Myths and reali- ties,” IEEE Communications Mag., pp. 11-18, May 1979.
[18]
1191
William C. Y. Lee (M’64-SM’80-F’82) received the BSc. degree from the Chinese Naval Academy, Taiwan, and the M.S. and Ph.D. degrees from The Ohio State University, Columbus, in 1954, 1960, and 1963, respectively.
From 1959 to 1963 he was a Research Assistant at the Electroscience Laboratory, The Ohio State University. He was with AT&T Bell Laboratories from 1964 to 1979 where he was concerned with the study of wave propagation and systems, mil- limeter and optical waves propagation, switching
systems, and satellite communications. He developed a UHF propagation model for use in planning the Bell System’s new Advanced Mobile Phone
Service and was a pioneer in mobile radio communication studies. He applied the field component diversity scheme over mobile radio communica- tion links. While working in satellite communications, he discovered a method of calculating the rain rate statistics which would affect the signal attenuation at 10 GHz and above. He successfully designed a 4 x 4 element printed circuit antenna for tryout use. He studied and set a 3-mm wave link between the Empire State Building and Pan American Building in New York City, experimentally using the newly developed IMPATT diode. He also studied the scanning spot beam concept for satellite communication using the adaptive array scheme. From April 1979 until April 1985 he worked for ITT Defense Communications Division and was involved with advanced pro- grams for wiring military communications system. He developed several simulation programs for the multipath fading medium and applied them to ground mobile communication systems. In 1982 he was Manager of the Advanced Development Department, responsible for the pursuit of new technologies for future communication systems. He developed an artificial intelligence application in the networking area at ITT and a patent based on his work was issued in March 1991. He joined PacTel Mobile Companies in 1985, where he is engaged in the improvement of system performance and capacity. He is currently the Vice President of Research and Technology at PacTel Cellular, Irvine, CA. He has written more than 100 technical papers and three textbooks, all in the mobile radio communications area. He was the founder and the first co-chairman of the Cellular Telecommunications Industry Association Subcommittee for Advanced Radio Techniques involv- ing digital cellular standards. He has received the “Distinguished Alumni Award” from The Ohio State University, and the “Avant Garde” award from the IEEE Vehicular Technology Society in 1990.


