

MASTER'S THESIS
Oxide layer thickness modification of adual phase steel by steam treatment
Chu Zhang
Master of Science (120 credits)Materials Engineering
Luleå University of TechnologyDepartment of Engineering Science and Mathematics

Oxide layer thickness modification of a dual phase steel by steam
treatment
Chu Zhang
Luleå University of Technology
MSc Programme in Materials Science and Engineering (AMASE)
Department of Engineering Sciences and Mathematics
Division of Materials Science

2
Table of contents
1 Abstract ........................................................................................................................ 4
2 Introduction ................................................................................................................. 5
Aim .................................................................................................................................. 7
General description of this thesis .................................................................................... 7
3 Material and manufacturing process at Duroc Special Steel AB ................................ 8
Material ........................................................................................................................... 8
Manufacturing process .................................................................................................... 9
3.1.1 Procedure .................................................................................................... 11
4 Theory ........................................................................................................................ 12
Oxidation mechanisms .................................................................................................. 12
Ellingham Richardson diagram. .................................................................................... 14
Diffusion mechanisms ................................................................................................... 16
5 Experimental .............................................................................................................. 19
Instruments and procedures used in the experiments. ................................................... 20
Sample preparation ........................................................................................................ 21
Characterization techniques .......................................................................................... 22
5.1.1 SEM ............................................................................................................ 22
5.1.2 EDS/EDX .................................................................................................... 22
5.1.3 OM .............................................................................................................. 23
5.1.4 Hardness ...................................................................................................... 23
5.1.5 Topography profilometry ............................................................................ 23
Differences between industry and lab conditions ......................................................... 23
6 Results ....................................................................................................................... 24
7 Discussion .................................................................................................................. 31
8 Conclusions ............................................................................................................... 33
9 Future work................................................................................................................ 35
10 Acknowledgements ................................................................................................ 35

3
11 References .............................................................................................................. 36
12 Appendix ................................................................................................................ 38
12.1 Schematic of the principal phenomena taking place during the reaction metals
with oxygen. .................................................................................................................. 38
12.2 Ellingham-Richardson diagram............................................................................. 39
12.3 Phase diagram iron-oxygen. .................................................................................. 40
12.4 Relationship between Td and Pw .......................................................................... 41
12.5 Relation between dew point of water vapour and water vapour content (volume in
parts per million, ppm) .................................................................................................. 42
12.6 Characterization result for all tests. ....................................................................... 44

4
1 Abstract
Low carbon steels have good mechanical properties that are utilised in various
applications around the world. Dual phase steel structures consisting of ferrite and
martensite provide a good combination of strength, formability and weldability. Under
certain conditions, a desirable oxide layer can be formed on the base material, which
improves the wear and corrosion properties. Black oxidation treatment is a metal
finishing process, used to create an oxide layer on steels. The high temperature oxidation
treatment also influences the mechanical properties of the steel by simultaneous
annealing of the steel. In this work laboratory experiments simulating a black oxidizing
treatment in industry have been performed. The dew points of water vapour, operation
temperature, time of oxidation, partial pressure of oxygen and gas flow rate have been
varied in the experiments.
The analysis methods for determining the microstructure that have been used are optical
microscopy (OM) and scanning electron microscopy (SEM). The composition of the
oxide and base material was analysed using x-ray energy dispersive spectroscopy (EDS).
The surface roughness of the oxide surface was determined by topographical
profilometry. Hardness testing of cross sections of the final samples was also performed.
The results showed that a higher dew point gives a thicker oxide layer. This is a result of
higher water vapour content and water vapour pressure, which produces a higher partial
pressure of oxygen in the system, enabling more oxygen to interact with the base
material. With certain temperatures and oxidation treatment times the oxide layer
thickness is influenced, as is the hardness of the material, which will become softer.

5
2 Introduction
Wear and corrosion resistance of high strength steels can be improved by creating an
oxide layer on the surface. Black oxidation treatment is one finishing process for metals.
An iron oxide layer is formed on the steel when treated with water vapour. Under certain
conditions, the oxide layer formed can be controlled and utilised for specific purposes;
one example is the production of a magnetite oxide layer which can protect the low
carbon steel surface. Magnetite is tough, dark and has low reflectivity, it is excellent as a
pre-layer for paint, and it has high corrosion resistance. Steels covered in an oxide layer
can be used in various applications, such as vehicle parts used at high temperature,
coatings for furniture, and aesthetically attractive surfaces such as baking plates, because
of the unique combination of properties, notably high corrosive resistance.
The materials used at Duroc Special Steel are cold rolled steels produced by SSAB. The
special steel used in this work is a dual phase steel. Dual phase steels are subjected to a
special heat treatment in a continuous annealing line, which produces a two-phase
structure in which the ferrite that imparts unique forming properties is one of the phases,
and martensite that accounts for the strength is the other. The strength increases with an
increasing proportion of the hard martensite phase. [1]
a) b)
Figure 1: (a) Time-Temperature-Transformation diagram; (b) dual phase ferrite and martensite
Dual phase low carbon steel has high strength properties, and black oxidized sheets from
this steel are used for example in the food industry. Therefore high corrosion and wear
resistance properties are desired for such an application, which operates under high
temperature conditions.

6
Many different reactions can occur during oxidation of the alloy used. The process
depends on the alloy composition, environmental conditions (T, Po2), and other
influencing parameters, for example, the free energy of formation of oxides and their
differences, the maximum solubility of oxygen in the base metal [2], and the reaction
time.
Water steam treatment is a method used for oxidation. The water vapour as a gas phase
comprises water molecules containing atoms that can react with iron cations and form
magnetite (Fe3O4) under certain conditions of temperature, oxygen partial pressure, etc.
The dew point of the water vapour and the reaction time are the key factors. The
temperature at which the water vapour in a gas with a given H2O content starts to
condense when the gas cools is called the dew point temperature [3][4]. In comparison
with dry atmospheres the oxidation rates will be increased by the presence of water
vapour, which promotes the formation of a more porous scale, because of an increase in
cation diffusion, thereby developing a porous structure. Rapid diffusion of water vapour
in oxides is possible because of the proton in the oxide and because an increase in cation
vacancies may lead to the formation of voids. Voids contain both hydrogen (a product of
the reaction with the oxide) and water vapour molecules [5]. A lower dew point results in
dryer air, which means less water content in the air.
By adding water vapour in the oven, oxygen will react with iron according to following
equation:
Fe3+
+ 8 H2O ----> Fe3O4 + 4 H2O + 4 H2
Cold rolled steels are rolled into the required dimension in a Sendzimir mill and the
sheets are bent into open coils. In the steam treatment process twisted wires are coiled
between the sheet layers in order to create a gap between the layers and to facilitate
oxidation gas flow [6][7].
The application for this material is a food transport belt in the food industry. The present
oxidised material from Duroc Special Steel provides an oxide layer thickness of less than
0.8 μm and gives a hardness of 270 HV (the original hardness of the base material was
350 HV). The customer would like to have a thicker oxide layer and a harder material. A
two-fold increase in the thickness of the oxide layer improves wear and corrosion
resistance, and retention of the hardness of the base material gives good mechanical
properties.
In order to improve the performance of the high strength steel sheets the goal is to
optimise the steam-treatment with regard to oxide thickness and strength of the steel. In
this project a laboratory furnace at LTU has been used. Process parameters have been
varied to simulate various production conditions, and results have been characterised with
the help of SEM and OM, hardness testing, surface roughness measurement and EDS.

7
Aim
To find optimum conditions to improve the thickness of the oxide layer in steam
treatment of a dual-phase steel and at the same time to stabilise the high strength of the
steel.
The conditions varied in this work were those controlling magnetite formation, such as
operation temperature, processing time, dew point, gas flow rate etc.
General description of this thesis
This thesis comprises 20 weeks’ research, including a literature study, obtaining
background information, industrial visits, analysing previous reports, and experimental
work in the laboratory of LTU (sample preparation, processing and characterization).

8
3 Material and manufacturing process at Duroc Special Steel AB
In this section, information about the base material – a dual phase steel (low carbon steel)
and the manufacturing process, equipment and procedures at Duroc Special Steel are
presented.
Material
The material was provided by SSAB. The steels were subjected to special heat treatment
in the continuous annealing line, which produces a two-phase structure material: Docol
1000 DP.
Docol 1000 DP is a dual phase steel with a good combination of strength, formability and
weldability. Typical for a Docol dual phase steel is the microstructure, which consists of
a ferritic matrix containing a hard martensitic second phase. Ferrite, which is soft,
contributes to the good formability and martensite to the high strength of the material [8].
The dimensions of the original coil were 1250 x 1.2 mm (width x thickness), from which
test specimens 50 x 10 mm were machined.
Table 1: Docol 1000DP chemical composition [1]
Table 2: Docol 1000DP mechanical properties.(Bake hardening after 2% plastic deformation and heating to
170oC.) [1]
The bendability of dual-phase steel is good even at higher strength levels. With extensive
bending it is important if possible to bend transverse to the rolling direction (the
bendability in transverse direction is better than in the longitudinal direction).

9
Manufacturing process
In this section a brief introduction of the equipment and procedures used by Duroc
Special Steel AB is given.
Figure 2: a) bell furnace, b) open-coil steel, c) base part of bell furnace
Cold rolling is used to obtain thin steel sheets. Cold rolling produces a more accurate
thickness and a smoother surface than hot rolling. However, cold rolling causes the sheet
to become brittle and hard in the initial stage. This is because the grains in the structure of
the steel become elongated and deformed, and the dislocation density in the grains
increases to high levels. Cold rolled sheet must therefore be annealed to relieve stresses.
Heating to a certain temperature recrystallises the structure and causes new grains to
grow at the expense of the deformed grains, which restores the formability of the sheet
[9]. During the rolling procedure an oil emulsion (4% oil + water) lubricant is applied to
the sheet. However, in this case, the dimensions of the steel sheet are designed according
to customer demands, since the industry purchases such open coil steel from SSAB such
that these base materials can be directly transported into the bell furnace to start the
oxidation procedure. The coiled steel contains protective oil on the surface, which
protects the low carbon steel from air moisture so that no undesired oxide layer is formed.

10
Parameters in Bell furnace:
Pressure: 600 Pa
Standard flow: 25-30 m3/hour
HNX gas: 8% H2 + 92% N2
Diameter: 3130 mm
Height: 2553 mm
Figure 3: Schematic of bell furnace and gas circulation system [10].
In order to obtain a tight and controlled gas environment, the open coiled steel roll is
placed onto the base of the bell furnace, and then covered with a protection cap (see
Figure 2 and 3). The protection cap also contributes to create a uniform temperature in
the circulating gases. Open coil roll temperatures vary slightly between the top (400oC)
and bottom (385oC), because of the large volume of the bell furnace and height of the coil
(1250 mm). The fan works by sucking the reaction gas through the open coil roll along
the gaps. When the furnace starts to cool down to 125oC, the HNX gas will continue
flowing until the end of the annealing procedure. The general purpose of an annealing
treatment is to reduce the hardness of steel or to produce a structure that facilitates the
progress of subsequent manufacturing [11]. An increase in the annealing time enhances
the surface coverage by oxides [12]. The fan in the base starts to cool the furnace when
temperature has reached to 125oC and it is cooled to room temperature. HNX gas is used
as a protective gas for several reasons: first, nitrogen gas is a protective gas which will
protect the internal wall of the bell furnace from chemical damage, as no chemical
reaction with water steam takes place. Second, hydrogen gas acts as a buffering and
reducing gas, to react with haematite to form iron, so that it will provide a greater chance
to form a magnetite surface layer. The water steam came from SSAB.

11
3.1.1 Procedure
A detailed description of the different steps used in the industrial process is given in this
section.
The existing process cycle contains the following steps:
1. Coiling of 1.2 mm thick steel sheet as open coil.
2. Placing of the coils into the bell furnace and sealing it.
3. Heating up the furnace to 350OC from room temperature within 3.5 h.
4. Holding the temperature at 350oC for 3 h, to evapourate the lubricant and
protective oil (Energol WM2). Increasing the temperature from 3500C to 400
oC
(the temperature differences in industry resulting from the height and dimension
of the coil top section (400oC) and bottom section (385
oC)).
5. Keeping the temperature at 400oC for 6 h. At the same time water vapour is
introduced.
6. The dew point is held at 35oC during these 6 h (water vapour is added and the
dew point is controlled. When the correct value is achieved the inflow is closed,
and NHX gas is circulated with moisture inside the bell furnace).
7. Cooling of the coils down to 125oC within 10 h (During the first 30 minutes of
cooling the NHX gas is kept running to clean away all moisture, and after that the
NHX gas circulates all around the bell furnace until the end of cooling).
8. Stopping of any gas phase flow, activating the fan to start the cooling procedure.
By summarizing the whole procedures, the desired dimensional open coil steels (with
gaps between layers) are placed on the base of bell furnace and sealed. Then the furnace
is heated to evapourate the protective oil during the first 3 h, reaching the temperature
that is designed for the oxidation reaction to occur, when water vapour is introduced.
NHX gas operates through the whole process, included the annealing time. The mixture
gases protect the inside wall of the bell furnace, provide an inert gas atmosphere
environment, and act as reducing gas to prevent undesired oxide layer formation. Thus
NHX gas is circulated during the whole procedure until the end.

12
4 Theory
In this section a background description of the fundamentals is given to explain the
different mechanisms occurring during the process: oxidation reaction mechanisms,
different oxide layers, favourable oxidation reaction of elements within DP1000 steel,
and indication of the most stable types of oxide with the help of the Ellingham
Richardson diagram. A brief introduction to the physical and chemical mechanisms of
oxygen and iron ion reaction, e g. diffusion mechanisms is given. A rule regarding oxide
layer growth rate and quality of oxide layers formation is described.
Oxidation mechanisms
An iron steel base material is placed in an oxygen-containing gas atmosphere. Oxidation
reactions occur via cation and anion exchange, referring to oxidation mechanisms. An
intermediate term oxide scale is formed during this process.
In an aqueous environment, the following
electrochemical reaction takes place to form an
oxide layer:
M + O2 ---> MO
This reaction consists of oxidation and reduction
reactions:
M ---> M2+
+ 2e- and O2 + 2e
- ---> O
2-
Figure 4: schematic representation of processes of oxide layer formation
The principle of oxide layer formation is that electrons are conducted to the scale where
the reduction reaction takes place. This also means that M2+
ions have to leave the bulk
metal and diffuse into the oxide layer. Meanwhile, O2-
ions have to go into the interface
of the oxide layer. The oxide layer acts as a barrier to prevent rapid ionic diffusion and/or
electrical conduction [13]. Therefore, the inner layer of oxide is formed by inward

13
diffusion of oxygen anions, and the outer layer by the outward diffusion of Fe ions [14].
See figure 4.
In this work, three types of iron oxides can be formed: FeO, Fe2O3, and Fe3O4 (see table
3). Therefore the schematic of oxide layer for iron oxides is more complex.
Table 3: information about types of iron-oxide layer and the order of different types of oxide layer formed
on the surface of base material.
The chemical composition of the outer layer of the scale is mainly composed of iron and
oxygen, which correspond to iron oxides. The porosity in the magnetite can also be
associated with restriction of the transport of the Fe atoms in the inner layer [15],
Haematite is only observed at the top of the scale, which is a consequence of re-oxidation
of the magnetite with the steam.
The phase diagram for the iron–oxygen system is shown in figure 5. This indicates that
below 570oC, FeO is not stable and it can decompose into metallic iron and magnetite. It
is thermodynamically stable for Fe2O3 to form on Fe3O4 [16][17]. (See appendix 3.) The
magnetite and haematite can be analysed for each experiment according to oxygen
content.
Figure 5: Equilibrium phase diagram for the iron–oxygen system [17]
Structure of oxides Crystal structure Mineral
Iron (II), oxide FeO Cubic ….
Iron (II, III), oxide Fe3O4 Cubic Magnetite
Iron (III), oxide Fe2O3 Hexagonal-rhombohedral Haematite
Iron (III), oxide Fe2O3 Cubic Magheamite

14
According to the iron-oxygen phase diagram (figure 5 and appendix 3) if the
experimental operation temperature is less than 570oC, no FeO is formed. Thus, no FeO
formation was expected in those experiments because the maximum temperature is
450oC.
By reading both the upper and lower x-axis, the types of oxide formed in a specific
temperature range can be obtained (see appendix 3). For example, in the temperature
range 200-570OC, below 27.8 wt% oxygen the oxide type is ferrite + magnetite, between
27.8 and 30 wt% oxygen the oxide type is magnetite + haematite, and higher than 30 wt%
oxygen the oxide type is haematite. Thus the oxide layer type can be approximately
detected though the oxygen content using EDS.
Ellingham Richardson diagram.
The predominant chemical reaction taking place is iron (metal) with oxygen (oxidant) in
this case, because of the complex base material composition and the two types of oxide at
the actual temperatures tested. Because of the type of iron ion involved as the reactant,
the oxidation reaction can be described as follows:
x M (s) + O2 (g) MxO2 (s)
and
α = thermodynamic quantity (activity), Po2 = oxygen partial pressure, K = equilibrium
constant.
The metal and oxide are solids, therefore their activity is unity, so that the partial pressure
of oxygen is the only factor that determines the reaction favourability [4].
It is defined as [17]:
G = H – TS
G = the Gibbs free energy, H = the enthalpy of the system, S = the entropy or disorder of
the system, T = the temperature of the system.
At equilibrium,
∆Go = -RT In (K) = RT In (po2)

15
∆Go = the standard free energy change, R = ideal gas constant, T = temperature, K = the
equilibrium constant for the reaction at constant pressure. po2 = partial pressure of
oxygen.
The Ellingham Richardson diagram is a tool to analyse the temperature dependence of
the stability of compounds. It can be read to find thermodynamic data such as ∆G, k, Po2
for reactions across a range of temperatures, and relative stabilities of elements with
respect to oxidation. The most stable oxides have the largest negative value of ∆G, which
are shown at the bottom of the chart, The partial pressure of oxygen is read off by
drawing a line from the origin O and crosses with metal oxidation plot at certain
temperature, then extended until it reaches the outer scale of the value of the oxygen
partial pressure (see appendix 2).
On account of the presence of oxygen containing atmospheres it often happens that
certain alloying elements in the steel are oxidised [18]. According to the Ellingham-
Richardson diagram, we can see that some interesting elements (chemical composition of
DP1000 material) as Si, Mn, Al and Fe are shown in the diagram with negative standard
free energy value which means they are easy to form oxide. Fe (the predominant
composition in the DP1000 base material) has different types of oxide layer. By
considering those oxide layers’ negative standard free energy value we can find the most
easily formed and stable oxide. Thus, Si, Mn and Al will appear close to the material
surface in EDS analysis because of their diffusion towards to the surface to react with
oxygen ions to form oxides.
We can read from the Ellingham-Richardson diagram at 400oC (673 K) the partial
pressure of oxygen for:
3 Fe + 2 O2 = Fe3O4 ∆Go = -447.00 kJ/mol, Po2 = 10
-34.7 atm
4 Fe + 3 O2 = 2 Fe2O3 ∆Go = -430.25 kJ/mol, Po2 = 10
-33.4 atm
4 Fe3O4 + O2 = 6 Fe2O3 ∆Go = -235.25 kJ/mol, Po2 = 10
-14 atm
“Po2” is used to determine what partial pressure of oxygen will be in equilibrium with the
metal and metal oxide at a given temperature. The significance of this is that, if the
oxygen partial pressure is higher than the equilibrium value, the metal will be oxidised,
and if it is lower than the equilibrium value then the oxide will be reduced [19][20][21].
Using these three equations, Fe3O4 requires less partial pressure of oxygen to make the
oxidation reaction occur. Because of the lower free energy (downwards in the diagram),
more stable iron oxide, therefore in this case, Fe3O4 is more stable than other types of
oxide, and the reduction of different oxide types is also shown in the figure 7.

16
Diffusion mechanisms
Generally, the activation energy of solid state diffusion lies between those of chemical
reaction and gaseous diffusion, which means that if a substance is placed at a certain
temperature and oxygen pressure, defects will start to diffuse in the crystal to establish
the concentration of defects corresponding to thermodynamic equilibrium with the
surroundings [22]. In the experiments performed, oxygen diffuses and reacts with iron
and forms two types of oxide. The oxygen diffuses into the steel, mainly along the grain
boundaries and reacts with the easily oxidizing elements [18]. This diffusion has
progressed to a greater extent for the longer annealing time [23]. A long annealing time
provides high elemental diffusion capability at high temperature, which means those
elements can diffusion longer distance. The diffusion rate of Fe in the iron oxides is a
function of the ambient partial pressure of oxygen [24].
According to the iron-oxygen phase diagram shown, the oxides type will change
chemically by oxygen content and temperature. Magnetite becomes deficient in iron ions
resulting in the occurrence of iron ion vacancies when it becomes haematite. For
example, while oxygen atoms occupy fixed positions in the magnetite lattice, some
positions in the iron sub-lattice remain unoccupied by iron ions. Such holes or defects
facilitate diffusion of iron ions (or any foreign cations of comparable size) and permit
migration through them [25][26].
The rate of corrosion and the tendency for oxide layer formation are related to the relative
volume of oxide and metal. This ratio of these volumes is called the Pilling-Bedworth
ratio:
a M + O2 ----> MaOb
RPB = the Pilling-Bedworth ratio, M = the atomic or molecular mass, n = number of
atoms of metal per one molecule of the oxide, ρ = density, V = the molar volume.
In general the P-B ratio for Fe that forms a protective coating is 1.77 [13].
If the P-B ratio is < 1, oxide scales has no protective function, because they contain pores
or cracks. If the ratio is > 1, the oxide scale gives functional protection, and then the only
diffusion to occur after the oxide is formed is slow even at high temperatures. If the ratio
is > 2, the surface will be unprotected, which means that the oxide coating may crack and
flake off, and then expose fresh base material and unprotected metal surface [13].

17
The corrosion rate is influenced by more than just the type of material and alloying
elements. In steam corrosion several factors play an important role in the oxidation rate,
such as the environmental partial pressure of oxygen, the flow rate of the water vapour,
the roughness of the material, the temperature of exposure, and the oxidation time.
The kinetics of oxidation representing the rate of reaction may be determined by
measuring the weight gain per unit area as a function of time. According to the literature
review, the relationship of reaction rate for weight gain per unit area with time is
parabolic [13].
Figure 6: oxidation film growth curves for rate laws.
With a reducing gas (H2), haematite can be transformed into magnetite, the structural
metamorphosis from hexagonal to cubic give rise to volume expansion, increased
porosity, cracks and fissures. So the resulting of reduction of haematite produces a porous
product and the larger surface area thus generate a higher reduction rate of haematite
compared to magnetite [25].
Figure 7: reduction of single crystals of haematite ,magnetite as well as of magnetite oxidised to
haematite to different degrees [26].
Parabolic relationship between the weight
gain per unit area W and the time t.
W2 = K1 t + K2
(K1, K2 are time-independent constants at a
given temperature)
The oxidation of iron follows this rate
expression.

18
Protons (H+) from water vapour may to some extent dissolve in the oxides, affecting the
diffusional properties of the grain boundaries. Some micro-channels and micro-cracks
allow ambient gas molecules to penetrate to the metal/oxide interface [27].
Diffusion of any species, e.g. oxygen, can be characterised by Fick’s laws. In our case,
oxygen will react with Fe, and Fe2O3 and Fe3O4 can be formed. Diffusion and chemical
reactions will take place at the same time and they will also depend on the porosity of the
substrate, the driving force for each reaction, ionic penetration capability, operating
temperature and time, partial pressure, concentration of oxygen, etc. Thus, we propose
that thickness of oxide layer will related by the following parameters:
D = D0 exp (-Q/RT)
D0 = pre-exponential factor (m2/s), Q = the activation energy (kJ/mol), R = the gas
constant.
Ј = - D and C = P/RT
(In the case of gas, the concentration term maybe replaced by volume fraction or partial
pressure)
J = diffusion flux, represent moles (or mass) diffusing in unit surface area and time.
(mol/cm2s or kg/m
2s), C = equilibrium concentration at given temperature, P =
equilibrium partial pressure at given temperature.
Thus, the thickness of diffusion, y, can be described as:
J D (C0-C)/y = D(P
0-P)/(RT)/y
This equation is for a reduction reaction. A reduction reaction has the same reaction rate
as an oxidation reaction, and so it is possible to describe the relationship between the
oxide layer thickness with help of diffusion coefficient, concentration gradient, partial
pressure gradient and temperature.

19
5 Experimental
The experimental work has been performed exclusively at Luleå Technical University,
Division of Material Science.
The goal of this experiment is to find a best condition to have a final product with at least
1 μm thickness of oxide layer and at least 300 HV in hardness value. Different types of
characterization are carried out to detect the thickness of the oxide layer, hardness and
surface roughness. The type of oxide layer can be defined by EDS analysis via magnetite
oxygen content in wt% (see appendix 3). The parameters are selected with regard to the
conditions that can influence the thickness of the oxide layers and mechanical properties,
for example, dew point of water vapour, oxidation temperature, oxidation duration and
annealing time. One parameter is fixed and then the other parameters are changed to
investigate their interactions.
16 different experiments have been performed. The parameters used in the experiments
are presented in table 4 (only 10 results are shown in this report because of calibration
difficulties and some tests were repeated.) For example, the dew point of water vapour is
40oC: at 350
oC, 400
oC and 450
oC for oxidation reaction temperature, and with different
reaction times. We are also interested in higher and lower dew points of water vapour,
such as 25 oC and 60
oC in comparison with the main 40
oC.
Table 4: Conditions regarding black oxidation temperature and time for a dew point of water vapour of
40oC.
Sample No.
(dew point=
40oC)
Black oxidation temperature (oC) and time (h)
350 400 450
6 h 4 h 5 h 6 h 5 h 6 h
1 x
2 x
3 x
4 x
5* x
6 x
7 x
*. Indicates short annealing time.
20
Sample No.
(dew point=
60oC)
Black oxidation
temperature (oC)
and time (h)
400
6 h
10 x
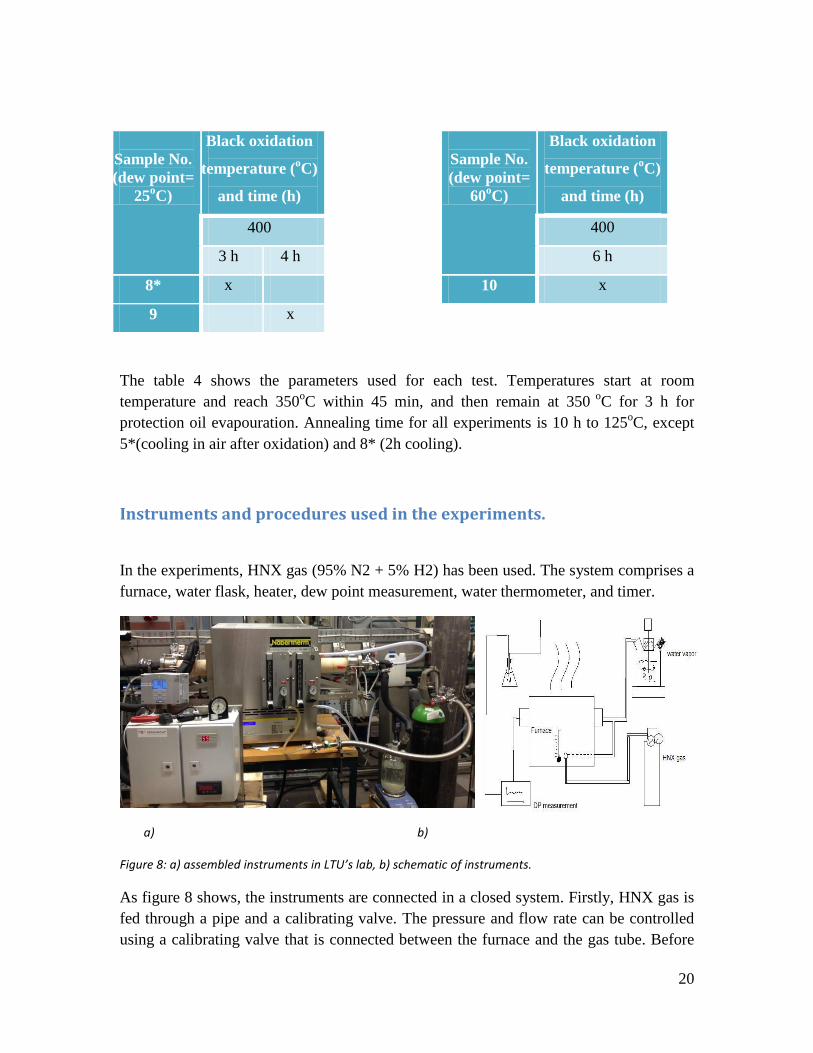
The table 4 shows the parameters used for each test. Temperatures start at room
temperature and reach 350oC within 45 min, and then remain at 350
oC for 3 h for
protection oil evapouration. Annealing time for all experiments is 10 h to 125oC, except
5*(cooling in air after oxidation) and 8* (2h cooling).
Instruments and procedures used in the experiments.
In the experiments, HNX gas (95% N2 + 5% H2) has been used. The system comprises a
furnace, water flask, heater, dew point measurement, water thermometer, and timer.
a) b)
Figure 8: a) assembled instruments in LTU’s lab, b) schematic of instruments.
As figure 8 shows, the instruments are connected in a closed system. Firstly, HNX gas is
fed through a pipe and a calibrating valve. The pressure and flow rate can be controlled
using a calibrating valve that is connected between the furnace and the gas tube. Before
Sample No.
(dew point=
25oC)
Black oxidation
temperature (oC)
and time (h)
400
3 h 4 h
8* x
9 x

21
the HNX gas goes into the furnace tube, it is mixed with water vapour provided through a
pipe connection from a water flask subjected to boiling by a heater. In this way, water
vapour can be introduced into the furnace along with gas mixtures. The temperature and
time are set by a computer program, therefore we can visualise the current temperature
and duration time on a display which is located at bottom of the furnace. The gases are
sucked into a dew point measuring device by a small fan. The dew point measurement
can analyse various data and information, for instance, dew point temperature, water
vapour pressure, humidity, etc. Finally, all gas will go through a water trap cone-shaped
flask that provides a controllable flow and prevents air being sucked in through the back
door in the event of under pressure in the container during annealing. Finally, the gas is
released into the exhaust fan and flows to the outside atmosphere.
Sample preparation
According to the diameter of tube of the furnace in LTU’s lab, samples were cut into the
required dimensions. #3024 cutting blades were used to cut samples into dimensions 50 x
10 mm. In order to minimise contamination, dirt was washed away immediately by flash
water, and samples dried with a hair dryer. Then the specimens were placed in a plastic
box to avoid undesired corrosion.
The materials were sorted into two groups: with protective oil or without protective oil.
Therefore, two types of specimen were used for each experiment; a thin layer of
protective oil was brushed onto one of the specimens, labelled and recorded. Later, those
two types specimens were used to make a comparison, characterise different properties
and the results are presented at the end of this report.
This protective oil is the same as SSAB produced and delivered with DP1000 material.
The oil evaporates during the first 3 h at 350oC.
It is necessary to use gloves every time specimens are handled. Specimens were cut into
shorter and smaller pieces, for instance, 10 x 10 mm. The cut sample was placed into a
mould holder, and then moulded.
Samples were ground using sandpaper in the order 220, 800, 1200, 4000 grit orientated in
one direction (at c. 250 rpm). Grinding using each sandpaper took approximately 30 s -1
min.
Polishing plays an important role during sample preparation. The quality of the grinding
and polishing influences some characterizations, e.g. SEM. Specimens were polished

22
using 6, 3, 1 and 0.25 µm diamond paste. The polishing time was 1-2mins for each grade
of paste.
Samples were etched using 3% nital solution for 5 s, followed by water rinsing and
drying using a hair dryer. (3% nital = 3% [56% HNO3] + alcohol). Etching revealed the
microstructure of the material, allowing the work hardened layer on the surface to be
removed by grinding. The etching time was critical: if shorter than 5 s the microstructure
is not clear enough for analysis using optical microscopy; if longer than 5 s, the chemical
etching agent will ruin the surface or cross section.
Characterization techniques
In this section, five characterisations are represent for specific characterization purpose:
Optical Microscopy and Scanning Electron Microscopy are measuring the thickness of
the oxide layer. Energy Dispersive Spectroscopy of X-rays is doing chemical
composition testing, which will provide chemical composition analysis and can
distinguish different type of the oxide layers by oxygen content in weight percent.
Hardness testing will introduce the hardness of the material by Vickers method, so that it
will refer to tensile strength by simply multiply 3.2. Finally, topography profilometry
testing gives surface roughness by Ra value, it can be demonstrated by both 2D and 3D
images.
5.1.1 SEM
SEM - Scanning Electron Microscopy
The SEM used is a field Emission Gun Scanning Electron Microscopy equipped with
Oxford system. Magnification we used most in arranges 1000 x – 10000 x to analyse
oxide layer thickness. Secondary electrons (SE) are used to observe the morphology
microstructure and backscattering electrons (BSE) to differentiate and identify phases
with various chemical compositions [28].
5.1.2 EDS/EDX
EDS/EDX – Energy Dispersive Spectroscopy of X-rays
EDS is a tool used to analyse a composition of the material and elements distribution at
certain position. The image captured from SEM technology, and then it can analyse a
point or line. We use EDX to determine the oxide layer composition and close surface
chemical composition.

23
5.1.3 OM
OM – Optical Microscopy
Optical Microscopy we used to analyse thickness of oxide layer and cross section of the
dual phases microscope images. In most case, we use 50x or 100x magnification. Optical
Microscopy is not accuracy to analyse types of oxide layers due to difficult to distinguish
them under small magnification.
5.1.4 Hardness
The Vickers hardness test method consists of indenting the test material with a diamond
indenter. For this characterization the load is unique for all the testing, 300g, and
objective is 40x. The higher the number of HV, the harder the material.
5.1.5 Topography profilometry
This is a roughness analysis, used with Wyko® Optical profiler instrument in tribology
lab. It provides surface smoothness studies and can observe 3D and 2D. The higher the
Ra value the rougher the sample.
Differences between industry and lab conditions
In this section gives some differences between industry and lab conditions.
Dimension and volume of furnace.
Flow rate of HNX gas and water vapour.
Gas system different: in industry - circulation, in LTU lab – one way out.
H2 content in shielding gas difference: in industry – 8% Hydrogen, in LTU lab –
5% Hydrogen.
Position loaded specimen: in industry – open coil, in LTU lab – flat small sheet.
Annealing procedure condition: in industry – keeps circulating HNX gas along
10h annealing, in LTU lab – first 30mins after stop introduce water vapour.
Some others.
These conditions influence the quality and quantity of the oxides formation on the surface
of DP1000. The most affective condition is the duration of HNX gas circulation during
the annealing procedure.

24
6 Results
In this section, the results (thickness of the oxide layer, hardness of the material and
topography of the treated surface) are presented in tables. The tables are sorted by the
dew point temperature of water vapour. The sample numbers refer to conditions as
described in the experimental section.
Table 5: result of the treated material at DP = 40oC, conditions for each sample are the oxidation reaction
temperature and holding time.*means short annealing time
Sample no. 1 2 3 4 5*
6 7
conditions 350oC
(6 h)
400oC
(4 h)
400oC
(5 h)
400oC
(6 h)
400oC
(6 h)
450oC
(5 h)
400oC
(6 h)
Thickness of
oxide layer
(µm)
0.8
1.7
2
1.9
0.8
1.8
2.1
Hardness of
material (HV)
323
314
315
300
323
266
277
Topography
of the treated
surface
(µm)
1.29
1.38
1.31
1.27
1.12
1.30
1.19
Notes
Difficult
to find
oxides
layer
Heavy
haematite
Table 6: Characteristics of treated material at DP = 25oC, conditions for each samples are oxidation
reaction temperature and holding time.*means short annealing time
Sample no. 8*
9
Conditions 400oC
(3 h)
400oC
(4 h)
Thickness of oxide layer (µm) 1.2 0.5
Hardness of material (HV) 342 306
Topography of treated surface (µm) 1.31 1.03
Notes
Uneven thickness of oxide layer
Difficult to find oxide layers

25
Table 7: result of the treated material at DP = 60oC, conditions for each sample are their oxidation reaction
temperature and holding time.
For a analyse dew point of 40oC, with the results may be compared with sample no 1, 4
and 7, which were oxidation treated for 6 h at 350, 400 and 450oC. OM and SEM showed
that sample 1 (350oC for 6 h) had an oxide layer thickness 0.8 µm, hardness 323 HV, and
surface roughness 1.29 µm; sample 4 (400oC for 6 h) oxide layer thickness 1.9 µm,
hardness 300 HV, surface roughness 1.27 µm; sample 7 (450oC for 6 h) oxide layer
thickness 2.1 µm, hardness 277 HV, surface roughness 1.19 µm. Thus the oxidation
temperature influences the oxide layer thickness and hardness, but has little effect on
surface roughness. The higher the treatment temperature, the thicker the oxide layer, and
the lower the hardness.
Samples 3 and 6 may also be compared. Sample 3 (400oC for 5 h) oxide layer thickness
2 µm; sample 6 (450oC for 5 h) oxide layer thickness 1.8 µm. Small differences are
observed when comparing with 400oC for 5 h, which shows that the temperature effect on
oxide layer thickness is greater than the effect of time. However, the hardness of the
material is strongly affected by the treatment of time. By comparing samples 4 and 5, in
sample 4 (400oC for 6 h) the oxide layer thickness 1.9 µm, hardness 300 HV, surface
roughness 1.27 µm, and for sample 5 (short annealing time): oxide layer thickness 0.8
µm, hardness 323 HV and surface roughness 1.12 µm. Thus, a longer annealing time
gives a higher thickness of oxide layer, but lower hardness.
When the dew point was 25oC, samples 8 and 9 may be compared. These materials were
treated at a single temperature for different times, notably sample 8 was treated for a
short time. Sample 8 (400oC for 3 h, short annealing time) oxide layer thicknesses about
1 µm, hardness 342 HV and surface roughness 1.31 µm. Sample 9 (400oC for 4 h) oxide
layer thickness 0.5 µm, hardness 306 HV and surface roughness 1.03 µm. Both samples
showed an uneven oxide layer thickness and oxide layers were difficult to observe.
Sample 8 has a higher hardness value because of the short annealing time, and the thicker
oxide layer might contain haematite according to EDS analysis of the surface.
For a analyse dew point of 65oC, sample 10 (400
oC for 6 h) gave the following results:
oxide layer thickness about 3 µm, hardness 306 HV, and surface roughness 1 µm.
Sample no. 10
Conditions 400oC (6 h)
Thickness of oxide layer (µm) 3
Hardness of material (HV) 306
Topography of treated surface ( µm) 1
Notes Heavy haematite

26
Following EDS analysis heavy haematite was found on the surface, as a result of the high
dew point of water vapour which contains more oxygen.
In order to confirm that the dew point of water vapour affects the oxide layer thickness
of the material, comparisons of the results can be made At the same temperature,
oxidation time and annealing time, samples 4 (DP = 40oC) and 10 (DP = 65
oC), and
samples 2 (DP = 40oC) and 9 (DP = 25
oC) may be compared. Sample 4 (400
oC for 6 h)
showed the following characteristics: oxide layer thickness 1.9 µm, hardness 300 HV,
surface roughness 1.27 µm; and sample 10 (400oC for 6 h): oxide layer thickness about 3
µm, hardness 306 HV, and surface roughness 1 µm. The higher the dew points of water
vapour the thicker the oxide layer. Another comparison, samples 2 (DP = 40oC) and 9
(DP = 25oC) shows: sample 2 (400
oC for 4 h) oxide layer thickness 1.7 µm, hardness 314
HV and surface roughness 1.38 µm ;and sample 9 (400oC for 4 h) oxide layer thickness
0.5 µm, hardness 306 HV and surface roughness 1.03 µm. Thus the higher the dew points
of water vapour the thicker the oxide layer.
Figure 9: relationship between water vapour pressure and dew point temperature of water vapour (see
appendix 4).

27
Figure 10: relationship between dew point temperature of water vapour and water vapour content (by
volume in parts per million, ppm, see appendix 5.)
The results of a single experiment can be characterised and analysed. A DP1000 steel
sheet is treated with a dew point of water vapour of 40oC, and is heated from room
temperature to 350oC for 45 min, held for 3 h to evaporate the protective oil, then heated
to an oxidation reaction temperature of 400oC, held for 5 h, and finally annealed for 10 h
and cooled in the furnace to 125oC.
Optical microscopy:
a) b)
Figure 11: a) DP1000_oil_cross middle_sample 3_100x and b) DP1000_oil_cross edge_ sample 3_100x
Figure 11 shows cross sectional images obtained using an optical microscope. In figure
11, b) the thickness of the oxide layer is shown. The darkest region at bottom of the
image is the polymer mould used to mount the specimen. The red scales are notes for the
thickness of the oxide layer (the thickness is approximately 2μm).

28
Topography
Figure 12: surface roughness of the oxide layer for sample 3.
Figure 12 shows the surface roughness of DP1000 base material at for sample 3. The Ra
value represents the surface roughness level: the higher the Ra value, the rougher the
surface.
Surface roughness of the oxide layer was analysed using a confocal microscope.
Topographical images were obtained revealing the oxide layer integrity and height on the
surface. A short annealing time with little diffusion might not be rapid enough to increase
the height of the grain boundaries enabling oxygen to diffuse and react with base material
or oxides layer. As the annealing time increased the height of the grain boundaries
increased. It is known that roughness depends strongly on the amount and size of grain
boundaries on the oxide surface [28]. Therefore, it the grain boundaries and the nodules
are higher for the longer annealing time, the surfaces roughness should also be higher.
Hardness
For this characterisation, the load is for all testing was maintained at 300 g, and the
objective is 40x.
Table 8: hardness testing for 1000DP_oil_ sample 3_300g:
No. of indentation 1 2 3 4 5 6 7 8 9 10
HV 313 313 316 310 319 319 318 313 314 317

29
Max 319
Min 310
Average 315
Ten indentations give better qualitative and quantitative results. The average hardness
value shows a relatively high hardness compare with an oxidised material from industry
(HV = 270), which means it does not lose much hardness compared with the untreated
base material (HV = 350).
SEM and EDX
Figure 13: SEM image of the oxide layer of DP1000 material for sample 3 treatment.
Element Weight% Atomic%
C K 22.04 42.13
O K 24.86 35.68
Si K 0.89 0.73
Mn K 0.94 0.39
Fe K 51.27 21.08
Totals 100.00

30
Figure 14: EDX image of the oxide layer of sample 3 (including the chemical composition on ‘Spectrum 1’
position and diagram of elements detected).
In SEM and EDS analysis, the SEM image of the oxide edge shows the scale of the
thickness of the oxide layer, which can confirm the obtained value of the thickness of the
oxide layer from OM images (the thickness of the oxide layer is about 2 μm). EDS
analyse represent the certain position chemical composition, where the type oxides of the
surface layer are indicated and determined, by comparing with the oxygen content in
weight percent with iron-oxygen phase diagram (see appendix 3). 24.86 wt% oxygen
indicates that the oxide type is magnetite. By reading the Ellingham Richardson diagram,
we notice that Mn, Si and Al will preferably react with oxygen, because they have more
negative free energy than Fe, and they require less partial pressure of oxygen to form an
oxide. Therefore, since the partial pressure of oxygen decreases with an increasing
volume percent of hydrogen in the mixture gas, easily oxidised elements will terminate
oxidation rather to diffuse to the surface [12]. Thus, Mn, Si and Al can be detected
within the oxide layer via EDS analysis.
Characterisation details are shown in the appendix.

31
7 Discussion
Dual phase low carbon steel (ferrite-martensite) has good mechanical properties. The
literature review shows that steel specimens with a martensite content between 52% and
64% exhibit an excellent combination of mechanical properties for both hardness and
toughness [29].
The experimental conditions are similar to those used in industry. HNX gas
(95%N2+5%H2 in LTU lab) was introduced into the system during heating from room
temperature. Thus an inert gas environment is present initially to prevent oxidation. The
lower oxygen content or water vapour pressures are required to reduce oxides caused by
oxidation [4]. Thus, HNX gas is still running even though water vapour introduction into
the furnace ceases in order to reduce the likelihood of the formation of an undesirable
oxide layer during annealing. It is expected that the higher hydrogen content in the
annealing atmosphere will reduce the partial pressure of oxygen, therefore less oxidation
should occur on the surface (Oxidation: H2O, reduction: H2, neutral: N2). However, in our
experimental setup, HNX gas contains only 5% H2,which limited the function of
reduction of haematite in the whole process more than in industry. 8% hydrogen utilised
HNX gas might have more effect on reduction in industry. Hydrogen can react with
oxides improving the quality of the surface [30]. And an article shows that gas content
will influence oxidation and reduction. By comparing 7% H2 and 100% H2, research
showed that an experiment with a lower hydrogen content condition has a greater oxygen
content, which means a higher partial pressure of oxygen [23]. Further, Fe3O4 is a more
stable oxide layer, and less positive react with reduction gas than Fe2O3. The reduction
rates for different type of iron oxides are also shown in figure 7. Haematite can be found
at surface of industrially oxidised material, and the thickness of the haematite layer is
lower than the obtained haematite thickness in LTU’s lab. One reason could be the
hydrogen content in the bell furnace atmosphere, another reason might be some effect
based on speed and duration of inert gas flow in the system. Hydrogen can also make
lubricant vapourization easier by combining with thee lubricant’s hydrocarbon
component to lower its boiling point [7].
As the thickness of the oxide scale increases, the rate of oxidation decreases due to the
increasing diffusion distance for ions, this shows as parabolic relationship as figure 6.
Oxygen diffuses and causes simultaneous oxidation reactions in two types of oxide layer.
There are other elements that can easily react with oxygen, even though they are present
in small quantities. These have complex diffusion and oxidation mechanisms in the base

32
material and oxide layers, especially when a shielding protection gas is involved because
the reducing gas hydrogen also reacts with oxides.
All test samples examined using SEM showed that the magnetite oxide surface
delaminates easily by thermal expansion, thus the degree of adherence between the film
and the metal is weak because of porosity and can become detached during sample
preparation. EDS analysis showed high concentrations of silicon and carbon, which
might come from grinding and polishing. During cutting of the sample, it is necessary to
minimise contamination by washing away dirt immediately, and drying with a hair dryer.
The specimens were then placed in a plastic box to avoid undesired corrosion on their
surface. After oxidation, samples were carefully taken out from the furnace, and then
grind and polished carefully. Etching should be performed for 5 s precisely, otherwise the
surface becomes degraded.
Theoretical explanations support the oxidation phenomena observed, which are that a
higher dew point provides higher water content and water vapour pressure, and therefore
a higher partial pressure of oxygen in the system, which will give a thicker oxide layer.
The oxide layer thickness is also influenced by the temperature and time; the hardness of
the material becomes lower when the treatment temperature is higher. A haematite oxide
layer was detected at the surface of the specimens caused by the lack of HNX gas during
the whole annealing procedure. If the HNX gas supply is continued after termination of
the water vapour flow, haematite will be reduced as discussed theoretically.
The experimental conditions that gave the best combination of oxide layer thickness and
hardness were a water vapour dew point temperature of 40oC, an oxidation temperature
of 400oC and a holding time of 5 h.

33
8 Conclusions
The corrosion rate is influenced by more than just the type of material or alloying
additions. In steam corrosion several factors play an important role in the oxidation rate,
such as the environmental partial pressure of oxygen, the flow rate of the water vapour,
dew point of water vapour, the roughness of the material, the temperature of exposure,
and the oxidation time. There is strong time-dependent formation of oxides on the
material surface, during which oxygen atoms diffuse into the material and thereby the
oxide layer formed.
The oxidation temperature influences the oxide layer thickness and hardness, but
has little effect on surface roughness. The higher the treatment temperature, the
thicker the oxide layer, and the lower the hardness.
The influence of temperature on the oxide layer thickness of is greater than the
influence of time, although the substrate hardness is strongly influenced by the
treatment time.
The annealing time is a very important factor for coating formation. This time-
temperature cycle affects the formation of the oxide by increasing the thickness in
the beginning but also by reducing the uppermost oxide-layer after the water
vapour is switched off but the HNX gas is still circulating in the furnace.
A higher dew point of water vapour can be used to generate a thicker oxide layer.
With a lower dew point temperature, less water vapour is contained in the
environment, i.e. the air is dryer. In another words, the higher the water vapour
pressure, the higher is the partial pressure of oxygen and the oxide formation rate.
Finally, the method demonstrated shows promise for manufacturing industry. The series
of experimental trials and characterisation methods show that the following.
In order to create a large oxide layer thickness and acceptable hardness, trials should be
carried out using the following procedure.
HNX gas is introduced at the start the procedure. The open coil steel is heated from room
temperature to 350oC in 45 min, and then held for 3 h to evaporate the protective oil. The
temperature is then raised to 400oC and the oxidation reaction proceeds for 5 h, with
water vapour introduced simultaneously. The dew point of water vapour should be 40oC.
The water vapour flow is then halted and the HNX gas is maintained during the
annealing processes, after which the temperature is lowered to 125oC within 10 h.
Finally, the sample is removed from the furnace and cooled in air.

34
A higher dew point gives a higher water content and water vapour pressure, and therefore
a higher partial pressure of oxygen is present in the system, giving a thicker oxide layer.
With certain combinations of treatment temperature and time, the oxide layer thickness is
also influenced, and the hardness of material becomes lower with a higher temperature
treatment. Differences between laboratory conditions and the industrial setting need to
be taken into account in designing an industrial procedure.

35
9 Future work
The most suitable conditions (high hardness and thick oxide layer) found in these trials
were: a water vapour dew point temperature of 40oC, a reaction time no longer than 6 h
and a temperature no higher than 400oC. These parameters provide relatively good results
compared with other experimental conditions. However, there are some conditions that
could be modified, for example, the introduction of HNX gas during the whole procedure
is required to minimise the formation of a haematite outer layer. Tensile testing of scaled
specimens should be performed to confirm the high tensile strength goal; unfortunately
this was not possible during these trials because of equipment failure (fracture of the
ceramic tube in the furnace).
A device that measures the constituent gas partial pressures should also be used in future
work. Additional characterisation techniques could be used to analyse the type of oxide
formed, e.g. x-ray diffraction measurements to identify magnetite and haematite, and
GDOES (Glow Discharge Optical Emission Spectroscopy) to investigate the chemical
composition at each position, to analyse elemental diffusion from the surface of the
material. Additional chemical agents to speed up oxide layer formation could also be
explored. Computer simulation of the oxide layer growth under various conditions could
provide a better understanding of oxidation phenomena.
10 Acknowledgements
This project has been carried out within a degree project study at Luleå University of
Technology (LTU), in collaboration with Duroc Special Steel AB. Thanks are expressed
to Duroc for providing me with this opportunity to work in this area, and for providing
technical support. I am also grateful to SSAB for supply of the base material. I would
also like to thank my supervisor at LTU Esa Vuorinen, and Erling Sundström who acted
as the contact person at Duroc. AGA Gas AB lent their dew point measuring equipment .I
also thank Johnny Grahn (LTU) for help with laboratory matters, and John Ion (LTU) for
providing support in theoretical matters and assistance with the English language.

36
11 References
1. SSAB Docol, Docol DP/DL, cold reduced dual phase steels. GB8201Docol, 09-
05-20
2. Ivan Anzel.High temperature oxidation of metals and alloys. Association of
metallurgical engineers of Serbia.University of Maribor (FME), Slovenia. (2000)
3. F.V.Lenel, Powder metallurgy principles and applications, Metal powder
industries federation, Princeton, New Jersey.
4. Randall M.German. Powder metallurgy of iron and steel. John willey&sons, INC.
1998. Page 237-240.
5. S.R.J.Saunders, M.Moteiro, F.Rizzo. Progress in Material Science 53 (2008) 775-
837.
6. Lars Lidberg. Ytavkolning av staslinjematerial. Tekniska högskolan I luleå.
1988:161E. Page 2-3.
7. Solmaz Ciftci. Sfäroidisering av kolstål. Optimering av glödgningscykeln hos
LuCoil Steel AB. 2006:318 CIV. Page 3-6.
8. Domex, high strength steel, page 19, SSAB,www.SSAB.com.
9. Tommy Löfgren, The steel book, SSAB Public Relations Department, page
24,Printed by: Henningsons Tryckeri AB, Borlänge 2009
10. Markus Persson, Magnus Fors. Orsaker till kvalitetsproblem I
klockugnsanläggning. Institutionen för Maskinteknik. 2011:207 CIV.
11. K.E.Thelning, Steel and its heat treatment. Second edition, 1984. Page 207
12. . I.Cvijovic, I.Parezanovie, M.Speigel. Corrosion science 48 (2006) 980-993.
13. William, D, Callister. Material science and engineering. Eight edition.(2011),
page 703-704
14. P.L.Surman and J.E.Castle. Corrosion science. 1969.Vol 9. Page 771-777.
15. L.Sanchez, M.P.Hierro, F.J.Perez. Oxid Met (2009) 71:173-186
16. Bhargava, G., Gouzman, I., Chun, C. M., Ramanarayanan, T. A. and Bernasek,
S. L. Characterization of the “native” surface thin film on pure polycrystalline
iron: A high resolution XPS and TEM study 2007
17. George Y.Lai. High-temperaure corrosion and material applications. (2007) page
5-66.
18. K.E.Thelning, Steel and its heat treatment, second edition, 1984. Page 475
19. Elligham diagram web tool tutorial, College of Engineering, San Jose State
University. http://www.engr.sjsu.edu/ellingham/tutorial.html.
20. Ellingham Diagrams, University of Cambridge,
http://www.doitpoms.ac.uk/tlplib/ellingham_diagrams/index.php, Last updated:
April 2008

37
21. D.R.Gaskell, “Introduction to the thermodynamics of materials” (Taylor and
Francis, 1995) T..hird ed. Page 247-395
22. Staniskaw Mrowec. Defects and diffusion in solids an introduction, Elsevier
scientific. 1980.
23. Mattias Björck, Johan Tholerus. Glödgningsförhållanden Diffusion av
legeringselement. Projektrapport. Institutionen för Material och
Produktionsteknik.
24. R.Freer. Self-diffusion and impurity diffusion in oxides. Journal of materials
science, 15 (1980) 803-824.
25. A.K.Biswas. Principles of blast furnace ironmaking, theory and practice.
Meredith Street, Calcutta. 1st edition, 1984, page 67
26. E.T.Turkdogan. Fundamentals of steelsmaking, the institute of material at the
university press, Cambridge, 1996.page 63
27. Jianian Shen, Longjiang Zhou, Tiefan Li. High-temperature oxidation of Fe–Cr
alloys in wet oxygen. Oxidation of Metals, vol 48, 1997.
28. Nuria Fuertes Casals. Annealing oxides on duplex stainless steels. Lulea
university of tehnology. 2010:105 CIV.
29. K.A.Bello, S.B.Hassan, M.Abdulwahab, U.Shehu, L.E.Umoru, A.Oyetuji,
I.Y.Suleiman. Australian journal of basic and applied science, 1 (4):407-414,
2007.
30. Christoph Laumen, PMM. SSAB Tunnplåt AB. July, 1997
31. F.D.Richardson. Physical chemistry of melts in metallurgy. Volume 2. Academic
press, London. 1974. Page 333.

38
12 Appendix
12.1 Schematic of the principal phenomena taking place during the
reaction metals with oxygen.
Figure 15: schematic of the principal phenomena taking place during the reaction metals
with oxygen.

39
12.2 Ellingham-Richardson diagram
Figure 16: Ellingham-Richardson diagram [31].

40
12.3 Phase diagram iron-oxygen.

41
12.4 Relationship between Td and Pw Data from Dew point measurement instrument. (Record it by hand)
Td
(oC)
Pw
(hPa)
Td
(oC)
Pw
(hPa)
Td
(oC)
Pw
(hPa)
Td
(oC)
Pw
(hPa)
Td
(oC)
Pw
(hPa)
22 26 43.5 89 51.7 134 52 136 53 142
26.3 34 43.2 88 51.8 135 51.6 133 51.4 132
28.5 39 49 116 51.6 134 51.2 132 50 118
26.8 35 48.5 114 48.6 115 51 130 48.6 115
27.8 37 48 111 48.5 115 50.8 128 48.3 114
29.8 42 46.2 101 48.4 114 50.6 128 48.2 113
35.1 57 45.2 97 48.3 114 50.4 126 48 110
36 59 45 96 48.2 113 50.2 124 47.6 108
36.9 62 44.5 93 48.1 111 49.8 121 47.1 107
37.4 64 44.2 92 47.7 110 49 116 46.8 105
38.9 70 43.8 90 47.6 110 48 108 44.5 92
39.7 73 43.7 90 47.5 108 60.5 205 44 91
39.9 74 43.6 89 47 106 60.5 204 43.9 91
34.5 54 43 87 46.8 105 60.3 203 43.8 90
44 91 42.2 82 48.9 117 60 203 43.5 88
54 150 40.7 76 48.8 116 59.2 192 41.3 79
39.5 72 40.5 76 42.1 83 58.8 189 41.2 78
43.2 88 44.7 95 46.4 103 58.6 187 36.5 61
53.8 149 55.4 161 46 101 57.7 179 36.7 62
53.2 145 55.2 159 59 193 57.6 178 44 91
53.1 143 40.6 79 60 200 57.2 174 43.8 90
53 142 45.3 100 60.4 204 56.5 169 43 86
52 136 45 96 60.6 206 56.3 168 41.9 82
51 130 44.2 92 60.8 207 56.1 166 41.6 80
50 123 44 90 61 210 54.5 154 41.5 80
49.6 121 43.5 88 61.2 211 52.5 140 40.6 76
49.3 119 43.1 87 61.4 213 52.2 138 40 73
48.8 116 43 86 57.6 177 52 137 39 70
48.3 111 42.8 85 57.2 174 51 130 40.1 74
47.2 106 42.7 84 57 174 48.4 110 40 74
46.6 104 42 82 56.8 171 43.1 87 39.5 72
46.2 102 41.7 81 56.2 167 42.2 83 38.8 69
46 101 41 77 56 165 40 73 38.5 68
45.8 100 41.6 81 55.8 162 40 78 44.5 94
45.5 98 41.8 81 54.4 152 43.9 90 45 97
45.3 97 42.5 85 54 149 44.4 94 45 96
45 96 48 116 53.6 147 44.7 95 43.6 90
44.5 93 50.8 130 53.2 144 44.9 96 43.6 90
44 91 51.3 133 53 143 45 96 43 87

42
12.5 Relation between dew point of water vapour and water vapour
content (volume in parts per million, ppm) Data from Dew point measurement instrument. (Record it by hand)
Td(oC) PPMw* Td(
oC) PPMw* Td(
oC) PPMw* Td(
oC) PPMw* Td(
oC) PPMw*
50.7 106000 39.3 75570 40.8 82000 21.5 25800 18.2 21000
21.9 26500 40.1 79000 37.2 67100 22.4 27300 21.7 26000
36.1 62600 39.9 77700 73 540000 21.8 26000 39 74300
41.2 84000 40 78500 58 235000 21.5 25800 37.8 70000
42 84000 40.9 82000 73 520000 38.2 70000 37.8 70000
41.1 84700 35 58800 73 530000 37.1 66000 35 57800
40.9 82700 40.8 83000 16 18000 45 97000 30.5 45000
39.8 78000 40.6 81600 11 13000 43 94000 37.1 66600
40.3 80300 40.7 81800 0 5800 41.6 86000 37.7 69000
38.6 72500 48.7 130000 1 6500 40 78500 37.2 67800
38.3 71200 43.4 97800 21 25400 32 50000 50 139000
37.4 67500 42.4 90000 21 25700 28.6 40000 42.3 89670
41 82600 42 88000 21 25840 22 26800 41.1 83900
56 195000 39.8 77500 66 350000 23.8 30000 38.8 73700
45.3 106400 36.5 64000 70 446000 24.3 30870 36 62500
41.5 85800 39.2 75200 71 466000 36.9 65881 34.4 56800
41 83000 39.6 77000 71 485000 25 32000 30 43000
39.8 78000 40.9 83000 65 330000 42.8 92000 29.2 41800
51.6 152400 54.5 179500 62 306000 48 117000 33.2 52900
41.1 84000 53.7 171450 65 338000 55 188000 33.5 53700
45.8 109500 51.5 150000 55 176000 42.3 89800 34.4 56700
39.7 77450 42.4 90380 64 318000 41.8 87500 26.3 35000
40.9 83000 41.4 85400 73 535000 40.8 82000 20 23400
21 25000 40.7 81700 39.7 76700 59.6 240000 38.9 73342
21.2 25500 41.6 85900 39.3 76800 58 219700 49.7 136700

43
21.1 25300 40.6 81500 51.4 150000 40 78200 48.7 130000
37.3 67000 42.2 88600 47 120000 38.8 73400 47.2 118000
38 69900 39.8 77800 39.8 77700 39.6 76700 20.6 24460
36 63000 39.6 77000 40.6 82000 38.7 73400 21.6 26100
35 58900 19.6 22880 41.3 85266 39.1 74500 23.2 28800
49 132000 21.4 25600 42.5 90500 40.1 79550 24.1 30481
39.3 75800 21.5 26000 44.6 102230 41.7 86300 23.15 29307
42 88000 35 58900 50.3 136000 40 77800 32.6 51100
40.8 82200 19 23000 46.7 114200 39.6 76300 40.7 81000
39.3 75500 29.8 42700 45 105000 56.7 202500 36.5 64000
35.4 60000 32.3 50000 46 111500 57 208500 38.9 73342
38.6 72000 47 116800 44 104400 45.6 106500 49.7 136700
36.2 63200 50.6 144000 41.6 86300 46 110163 48.7 130000
41.5 85950 55.4 190000 41.2 84150 43.6 96000 47.2 118000
40.5 81200 58.9 230000 41.6 87900 40.7 81600 20.6 24460
39.1 74000 62.1 279700 56.2 192000 38 70600 21.6 26100
39 74500 66.2 353000 53 165380 39.4 77000 23.2 28800
40 79500 39.4 76400 48.3 115000 39.2 75000 24.1 30481
39.7 77000 39.7 77350 41.4 85820 39.4 76000 23.15 29307
42.2 88600 47 115300 40 78630 38.3 71000 32.6 51100
41.6 86500 41 84000 30 39800 44.3 99300 40.7 81000
*. Water vapour content, by volume in parts per million (ppm)

44
12.6 Characterization result for all tests
Sample 1
Optical microscope:
Figure: 1000DP_oil_cross middle_100x and 1000DP _oil_cross edge_100x
Topography
Hardness
For this characterization, the load is unique for all the testing, 300g, and objective is 40x
1000DP _oil_300g:

45
No. 1 2 3 4 5 6 7 8 9 10
HV 327 322 321 330 322 324 324 318 324 321
Max 330
Min 318
Average 323
SEM
Element Weight% Atomic%
C K 29.51 51.17
O K 23.98 31.22
Si K 0.72 0.53
Mn K 0.54 0.21
Fe K 45.25 16.87
Totals 100.00

46
Sample 2
Optical microscopy
Figure: 1000DP _oil_cross middle_100x and 1000DP_ oil_cross edge_100x
Topography
Hardness
For this characterization, the load is unique for all the testing, 300g, and objective is 40x
1000DP _ oil_300g:

47
No. 1 2 3 4 5 6 7 8 9 10
HV 307 319 322 321 311 325 308 298 316 308
Max 325
Min 298
Average 314
SEM
Element Weight% Atomic%
C K 18.17 35.64
O K 26.60 39.17
Si K 0.87 0.73
S K 4.89 3.59
Fe K 49.48 20.87
Totals 100.00

48
Sample 3
Optical microscope
Figure: 1000DP _oil_cross middle_100x and Figure: 1000DP_ oil_cross edge_100x
Topography
Hardness
For this characterization, the load is unique for all the testing, 300g, and objective is 40x
1000DP _oil_300g:

49
No. 1 2 3 4 5 6 7 8 9 10
HV 313 313 316 310 319 319 318 313 314 317
Max 319
Min 310
Average 315
SEM
Element Weight% Atomic%
C K 22.04 42.13
O K 24.86 35.68
Si K 0.89 0.73
Mn K 0.94 0.39
Fe K 51.27 21.08
Totals 100.00

50
Sample 4
Optical microscope
Figure: 1000DP _oil_cross middle _100x and 1000DP _oil_cross edge_100x
Topography
Hardness
For this characterization, the load is unique for all the testing, 300g, and objective is 40x
1000DP _oil_300g:

51
No. 1 2 3 4 5 6 7 8 9 10
HV 296 300 304 303 300 - - - - -
Max 304
Min 296
Average 300
SEM
Element Weight% Atomic%
C K 34.37 53.59
O K 28.60 33.48
Al K 0.30 0.21
Si K 0.76 0.51
S K 0.57 0.34
Mn K 0.44 0.15
Fe K 34.96 11.73
Totals 100.00

52
Sample 5
Optical microscope
Figure: 1000DP _oil_cross middle _100x and 1000DP _oil_cross edge_100x
Topography
Hardness
For this characterization, the load is unique for all the testing, 300g, and objective is 40x
1000DP _oil_300g:

53
No. 1 2 3 4 5 6 7 8 9 10
HV 318 322 324 324 327 327 313 325 327 324
Max 327
Min 313
Average 323
SEM
Element Weight% Atomic%
C K 43.46 62.07
O K 26.65 28.58
Si K 0.53 0.32
Mn K 0.33 0.10
Fe K 29.03 8.92
Totals 100.00

54
Sample 6
Optical microscope
Figure: 1000DP _oil_cross middle _100x and 1000DP _oil_cross edge_100x
Topography
Hardness
For this characterization, the load is unique for all the testing, 300g, and objective is 40x
1000DP _oil_300g:

55
No. 1 2 3 4 5 6 7 8 9 10
HV 269 265 267 258 264 267 259 271 269 275
Max 275
Min 258
Average 266
SEM
Element Weight% Atomic%
C K 15.72 33.37
O K 24.78 39.48
Fe K 59.50 27.15
Totals 100.00

56
Sample 7
Optical microscope
Figure: 1000DP _oil_cross middle _100x and 1000DP _oil_cross edge_100x
Topography
Hardness
For this characterization, the load is unique for all the testing, 300g, and objective is 40x
1000DP _oil_300g:

57
No. 1 2 3 4 5 6 7 8 9 10
HV 273 278 284 273 278 275 278 282 270 293
Max 293
Min 270
Average 278
SEM
Element Weight% Atomic%
C K 49.05 63.02
O K 32.95 31.78
Si K 0.68 0.37
Cl K 0.27 0.12
Mn K 0.23 0.06
Fe K 16.83 4.65
Totals 100.00

58
Sample 8
Optical microscopy
Figure: 1000DP _oil_cross middle _100x and 1000DP _oil_cross edge_100x
Topography
Hardness
For this characterization, the load is unique for all the testing, 300g, and objective is 40x
1000DP _ oil_300g:

59
No. 1 2 3 4 5 6 7 8 9 10
HV 335 349 340 340 344 347 340 332 344 347
Max 349
Min 332
Average 342
SEM
Element Weight% Atomic%
C K 24.10 43.06
O K 28.71 38.52
Si K 0.75 0.57
Mn K 0.77 0.30
Fe K 45.67 17.55
Totals 100.00

60
Sample 9
Optical microscope
Figure: 1000DP _oil_cross middle _100x and 1000DP _oil_cross edge_100x
Topography
Hardness
For this characterization, the load is unique for all the testing, 300g, and objective is 40x
1000DP __oil_300g:

61
No. 1 2 3 4 5 6 7 8 9 10
HV 297 317 310 310 308 298 310 301 310 297
Max 317
Min 297
Average 306
SEM
Element Weight% Atomic%
C K 29.30 49.30
O K 27.62 34.88
Si K 0.47 0.34
Cl K 0.26 0.15
Mn K 0.67 0.25
Fe K 41.68 15.08
Totals 100.00

62
Sample 10
Optical microscope
Figure: 1000DP _oil_cross middle _100x
Topography
Hardness
For this characterization, the load is unique for all the testing, 300g, and objective is 40x
1000DP _ oil_300g:

63
No. 1 2 3 4 5 6 7 8 9 10
HV 285 307 310 325 314 307 313 298 303 298
Max 325
Min 285
Average 306
SEM
Element Weight% Atomic%
C K 35.14 52.10
O K 34.01 37.85
Si K 0.51 0.32
S K 0.13 0.07
Cl K 0.13 0.07
Mn K 0.33 0.11
Fe K 29.73 9.48
Totals 100.00


