

PACIFIC HERRING, CLUPEA HARENGUS PALLA-SI , STUDIES IN SAN FRANCISCO BAY,
APRIL 1986 TO MARCH 1987
Paul N. Reilly and
Thomas 0. Moore
ABSTRACT
Herring schools were surveyed hydroacoustically and sampled in San Francisco Bay from late October 1986 to March 1987. Eight large schools (greater than 1000 tons each) spawned from December to February and seven smaller schools were detected throughout the spawning season. Total acoustic biomass estimate using a "visual integration" technique was 40,930 tons, and it was determined from spawn escapement and commercial landings that an additional 2240 tons were not detected. This is a slight increase from last season's total of approximately 42.200 tons. For the first time, biomasa was also eetimated using echo integration equipment. A total biomass was obtained of 33,050 tons, including herring not detected acoustically. This estimate rust be considered preliminary and subject to revision after target strength of San Francisco Bay herring is determined.
Eighty-seven samples, containing a total of 13,125 herring. were collected with variable-mesh gill net and midwater trawl or obtained from the roundhaul and gill net fisheries. Mean body length (BL) of sampled herring decreased by about 20 mm from the beginning to the end of the spawning season. A combination of variable-mesh gill net and midwater trawl samples for a particular echo01 closely approximates mean BL and age composition data from unbiased roundhaul samples.
Age-weight and age-length relationships were average to above average compared with those of the previous two eeasons. The 1982 year class exhibited unusually good growth, with a mean BL of 202.8 mm for herring aged from stratified random samples.
The 1982 through 1985 year claeses (5- through 2-yr old81 contributed 97% by number and 95% by weight to the total 1986-87 spawning biomass in San Francisco Bay. Good recruitment has occurred during the past four seasons. The weak 1981 year class contributed little to the total biomass as 6-yr olds.
Average catch per tow of young-of-the-year (YOY) herring is a potential index of abundance for recruitment 18 months later as 2-yr olds. Estimated recruitment has only varied by 15% during

t h e paet t h r e e seasons and does n o t reflect the m a g n i t u d e or trend i n YOY c a t c h e s i n t h e bay.

ACKNOWLEDGMENTS
We would like to extend epecial thanks to seasonal aide
Kimberly Kearne and Wendy Cole for their aseistance during the
herring eeason.
Philip Law assisted on statistical analyses. Juana Lofgren
helped in the word proceesing of appendicee. The manuscript was
reviewed by Ton Jow, Jerone Spratt, and Art Haeeltine. Jerry
also read some of the difficult ototliths.
Norm Lerberg, Washington Department of Fisheries, Seattle,
contributed his tine and equipment to facilitate the echo
integration of acourtic data.
Chuck Armor of DFGCs Bay-Delta Project provided us with
rarples of YOY, juvenile, and adult herring caught before the
spawning season end allowed access to the exteneive YOY data base
from spring and summer trawling.
Thanks are extended to eurvey volunteers Debbie Dresser,
Allen Grover, Vladimir Hvoechineky, Dorothy Isaacson, Julene
Jones, Karin Harsh, Nick Paszty, Phil Swartzell, Bob Taato, Dave
and Geoff Thomae, Yvette Tipton, Eb Ueber, and Jody Zaitlin.
Finally, we continue to appreciate the cooperation of the
conrercial fishermen in San Francisco Bay who provided ue with
samples and information.
- i i i -

TABLE OF CONTENTS
e3 !z?
ABSTRACT... . . . . m . . . . . . . . . . . . . . . . . . . . . . . . . . . . . . . . . . . . . . . . . . . . . . . m m g i
ACKNOWLEDGMENTS ...............................................iii
TABLE OF CONTENTS ...............................................iv
LIST OF FIGURES ................................................Vii
LIST OF TABLES..... . . . . . . . . . . . . . . . . . . . . . . . . . . . . . . . . . . . . . . . . . . v i i i
LIST OF APPENDICES..............................................x
INTRODUCTION .........................................................l
METHODS. ........................................................l
Non-spawning Season Field Sampling ......................... 1 Spawning Seaeon Field Work..................................3
Research Vesee1. . . . . . . . . . . . . . . . . . . . . . . . . . . . . . . . . . . . . . . . .3
Acoustic Monitoring.....................................3
................................... Sampling Gear Typee 5
Gill Neta...........................................5
Hidwater trawl....................................^
Commercial Fishery .......................... .....5 .... Field Processing of Samples....................... 5
Laboratory Processing of Samples........... ................ 6 Length and Weight...... ............................... 6
Ot0lith6..............................................6
............ Assigned Age by Length.................... 7
Assigned School Numbers................................7
Total Age Conpoeition for Spawning Season.............7
Computer Proceesing of Samples....... ........................ 8
Supplementary Data,..........................................8

Table of Contents (cont'd) erne
RESULTS ......................................................... 9 .... Non-epawning Seaeon Sampling. Bay-Delta Project Samples 9
Acouetic Monitoring ........................................ 9 Sunnary of Herring Schools ............................ 9
..... Acoustic Biomass Estimates for San Francisco Bay 16
.................... Herring Samples from San Francisco Bay 17
................................... Length Composition 19
Variable-mesh Gill Net Samples .................. 19 .......................... Midwater Trawl Samples 26
Purse Seine and Lampara Net Samplea ............. 26 Comparison of Length Composition by Gear Type ... 30 Commercial Gill Net Sample6 ..................... 33
Sex Ratios ........................................... 33
Weight and Length .................................... 36 Length at Age ........................................ 38 Weight at Age ........................................ 38 Age Compoeition ...................................... 41
Variable-meeh Gill Net Samplea .................. 41 Midwater Trawl Samples .......................... 45 Puree Seine and Lampara Net Samples ............. 45 Commercial Gill Net Samples ..................... 46 Compariaon of Age Compoeition by Gear Type ...... 46 Total Age Composition for Spawning Season ....... 48
Catch of YOY Herring and Recruitment ................. 48 Tides, Barometric Preeeurc. Rainfall. and Spawning ........ 48
..................................................... DISCUSSION 52
............................................... LITERATURE CITED 57


LIST OF FIGURES
FIGURE 1. Pacific herring acoustic survey and sampling areas in San Francisco Bay, 1986-87..,.................2
FIGURE 2. Number of Pacific herring (2-mm intervals) from Bay-Delta Project midwater trawl samples, San ..................... Francisco Bay, April to June 1986 10
FIGURE 3. Percent length frequencies (2-mm intervals) from 1.5-in. mesh gill net samples, San Francisco Bay, October 1986 to February 1987..... .................... 22
FIGURE 4 . Percent length frequencies (2-mm intervals) from 1.75-in. mesh gill net samples, San Francisco Bay, October 1986 to February 1987.........................22
FIGURE 5 . Percent length frequencies (2-mm intervals) from 2.0-in. mesh gill net samples, San Francisco Bay, October 1986 to February 1987.........................23
FIGURE 6. Percent length frequencies (2-mm intervals) from 2.25-in. mesh gill net samples, San Francisco Bay,
'. ? October 1986 to February 1987.........................is
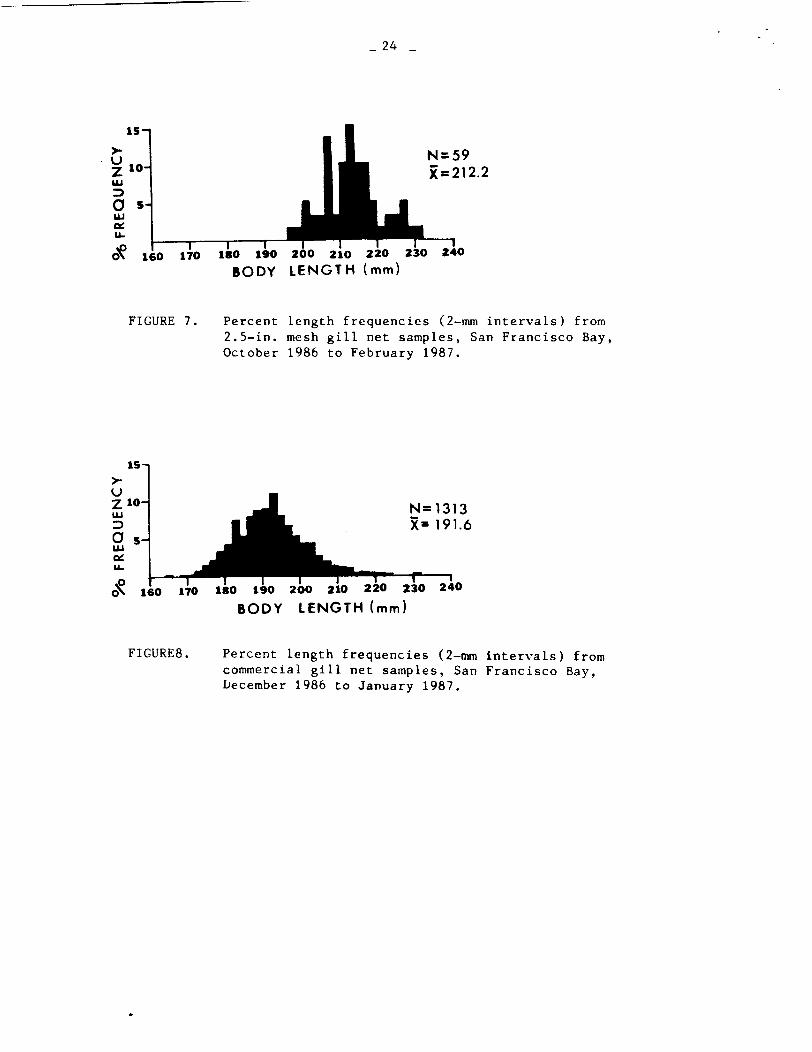
FIGURE 7. Percent length frequencies (2-mm intervals) from 2.5-in. mesh gill net samples, San Francisco Bay, October 1986 to February 1987.........................24
FIGURE 8. Percent length frequencies (2-mm intervals) from commercial gill net samples, San Francisco Bay, December 1986 to January 1987.........................24
FIGURE 9. Length-weight relationship for ripe adult herring from San Francisco Bay, October 1986 to March 1987....39
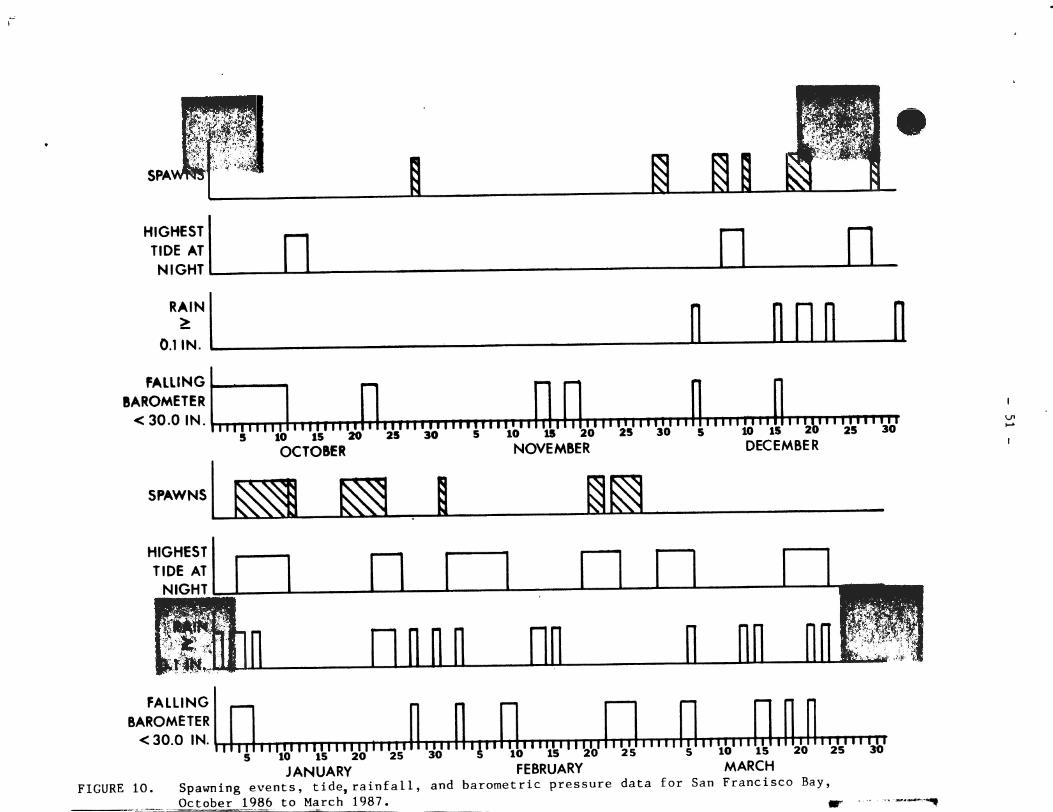
FIGURE 10. Spawning events, tide, rainfall, and barometric pressure data for San Francisco Bay. October 1986 to March 1987.........................................51
- vii -

LIST OF TABLES
Pam TABLE 1. Length and Age Composition of Pacific Herring
Sampled from Bay-Delta Project by Midwater Trawl in San Francisco Bay, April to June 1986 ...,.............. 11
TABLE 2. Summary of Herring Schools in San Francieco Bay, October 1986 to March 1987..............................13
TABLE 3. summ'ary of Acoustic and Spawn Eecapement-plus-Catch Biomase Estimates for San Francisco Bay, 1982-83 to 1986-87................................................18
TABLE 4. Number of Pacific Herring by Body Length (2-mm Intervals), Combined by Assigned School Number, from Variable-Meeh Gill Net Samplee, San Francieco Bay, October 1986 to February 1987...........20
TABLE 5. Summary of Mean Body Length (ma) by Mesh Size from Variable-Mesh Gill Net Samples from San Francisco Bay, 1982-1987........................................25
TABLE 6. Number of Pacific Herring by Body Length (2-nm Intervals), Combined by Aeeigned School Number, from Midwater Trawl Samples, San Francisco Bay, December 1986 to March 1987............................27
TABLE 7. Nunber of Pacific Herring by Body Length (2-nm Intervals), Combined by Assigned School Number, from Purse Seine and Lampara Net Samples, San Francieco Bay, January to March 1987.............................29
TABLE 8. Number of Pacific Herring by Body Length (2-mm Intervals) from Roundhaul Samplee, 1981-82 to 1986-87 Sea~ons..................~.....................31
TABLE 9. Comparison of Gill Net, Midwater Trawl, and Roundhaul Samples, San Francieco Bay, 1981-82 to 1986-87.........32
TABLE 10. Number of Pacific Herring by Body Length (2-am Intervals), Combined by Aeeigned School Number, from Commercial Gill Net Samplee, San Francisco Bay, December 1986 to January 1987.....................34
TABLE 11. Percentage by Number Sex Composition of Pacific Herring Samples from San Francieco Bay, by School, Geare Combined, ~ c t o b e r 1986 to March 1987............35
TABLE 12. Percentage by Nunber of Female Herring by Gill Net Mesh Size from San Francisco Bay.................. ..... 37
TABLE 13. Mean Length and Weight of San Francisco Bay Herring by Season, 1983-84 to 1986-87............................40
- viii -

Liet of Tablee (cont'd) p__a_q.e
TABLE 14. Number of Pacific Herring at Age by Body Length (2-nm Intervals) from All San Francisco Bay Samples (Excluding Commercial Gill Net), October 1986 to March 1987.....................................42
TABLE 15. Number of Pacific Herring at Age by Body Length (2-nm Intervale) from Commercial Gill Net Samples, San Francieco Bay, December 1986 to January 1987.......43
TABLE 16. Percentage (by Number) Age Compoaition of Pacific Herring Samples, Combined by Assigned School Number, Based on Otolith Aging and Subsequent Age Aesignments by Length, from San Francieco Bay, October 1986 to March 1987.............................................44
TABLE 17. Comparieon of Percentage Age Compoeition Data from Roundhaul Samplee and Combination of Variable-mesh Gill Net and Midwater Trawl Samplee, San Francieco Bay, January to February 1987..........................47
TABLE 18. Total Percentage Age Composition for 1983-84 through 1986-87 Spawning Seaeone in San Francisco Bay... ....... 49
TABLE 19. Monthly Average Catch per Tow of Young-of-the-Year Pacific Herring in San Francisco Bay, April to June, 1983 to 1986 and Recruitment Estimates 1985 to 1987. ...............................................SO

LIST OF APPENDICES
APPENDIX A.
APPENDIX B.
APPENDIX C.
APPENDIX D.
APPENDIX E.
APPENDIX F.
APPENDIX G.
Oage Summary of Adult Herring Samples from San Francieco Bay, October 1986 to March 1987.........59
Number of Pacific Herring by Body Length (2-mm Intervals) from Variable-mesh Gill Net Samples in San Francisco Bay, October 27, 1986 to February 25, 1987.................................62
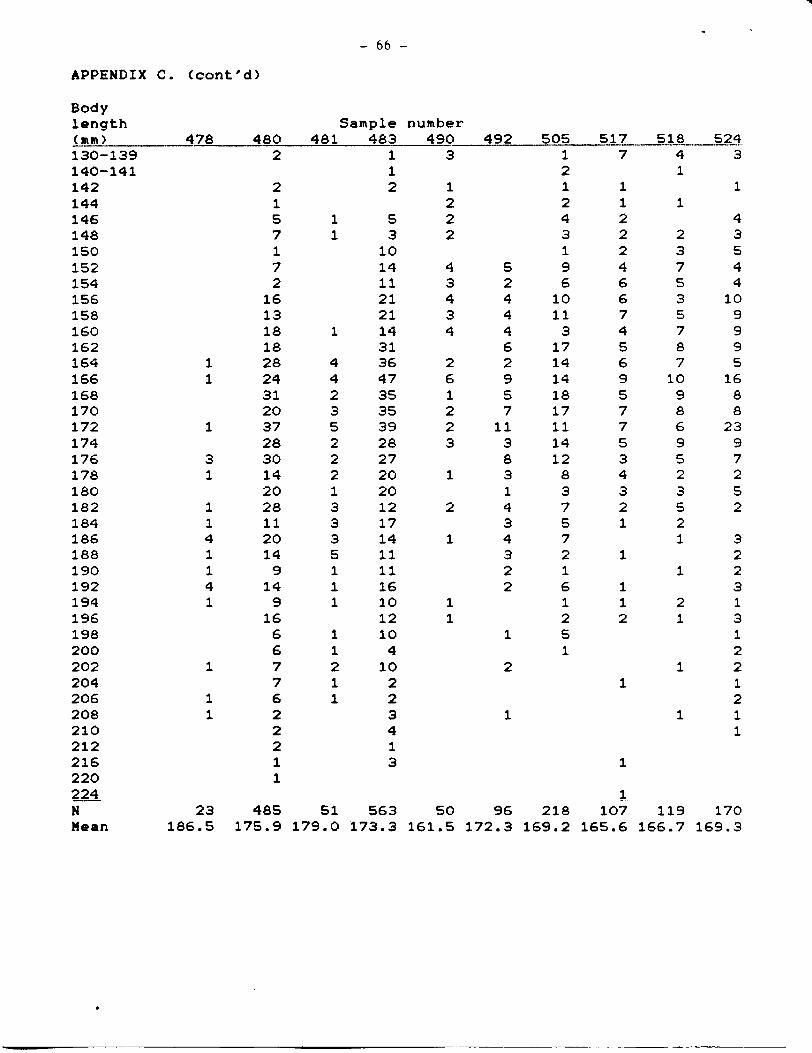
Number of Pacific Herring by Body Length (2-mm Intervals) from Midwater Trawl Samples in San Francisco Bay, December 1, 1986 to March 16, 1987..............................................65
Number of Pacific Herring by Body Length (2-mm Intervals) from Purse Seine and Lampara Net Samplee in San Francisco Bay, January 5 to March 12, 1987....................................68
Number of Pacific Herring by Body Length (2-mm Intervale) from Commercial Gill Net Samples in San Francisco Bay, December 1, 1986 to January 20, 1987..........................................71
Estimated Weight at Length for Pacific Herring from San Francieco Bay, 1986-1987.................73
Number of Pacific Herring at Age by Body Length (2-mm Intervals) for Selected Fish from San Francisco Bay, December 1986 to March 1987........74

- 1 - INTRODUCTION
This was the aixth year of field work by the California
Department of Fish and Game (CDFG) Pacific Herring Research
Project and the fifth in which acoustic surveye were conducted
and aamples were obtained throughout the October to March
spawning reason. Data have been presented for each season in
adminirtrative reports (Reilly and Moore 1982, 1983, 1984, 1985,
1986)and rerve to complement biomass estimates from spawn
deposition eurveys (Spratt 1987a) and biological data of that
portion of the herring population exploited by the commercial
fishery (Spratt 1987b). The Pacific Herring Research Project has
one major objective, to provide data necessary for long-term
management of the herring roe fishery in California. Research,
oriented to this objective during the 1986-87 herring season,
included: 1) hydroacoustic estimation of spawning biomass of
each school of adult herring in San Francisco Bay (Figure 1); 2)
determination of length and age compoeition of herring in each
achool; 3) ueight/age/length relationships: 4) examination of
catch data of juvenile and young-of-the-year (YOY) herring from
CDFG'a Bay-Delta Project: and 5 ) sampling herring during the
non-spawning aeason from San Francisco Bay.
METHODS
Non-spawning Seaeon Field Sampling
The Bay-Delta Project, Stockton, collected sanplee of YOY,
juvenile, and adult herring in San Francisco Bay from April to
June 1986. All ramplee were frozen and delivered to the Wenlo
Park laboratory where they were thawed, meaeured, sexed if

Son Francisco
Son Francisco
5 mi
1 ' 1 J ' 1 I 1 0 km
FIGURE 1. Pacific herring acoustic survey and sampling areas in San Bay
Francisco

- 3 - poeaible, weighed, and subeampled for otolith aging.
Spawning Season Field Work
Resea-rch-!e..ssd
The 23-ft R/V PANDALUS was used on all field days in San
Francisco Bay from October to March.
Acoustic M-0-nitorinq,,
Hydroacoustic surveys were conducted 3 or 4 d each week.
Areas surveyed included central San Francisco Bay and the Golden
Gate bounded by the Richmond-San Rafael Bridge, Oakland-Bay
Bridge, and Pt. Bonita (Figure 1) . hereafter referred to as north
bay, and southern bay waters between the Oakland-Bay Bridge and
Oyster Point (Figure 11, hereafter referred to as south bay.
Acoustic monitoring was done at a epeed of approximately 8 kn.
Approximately 3 d each week a Raytheon model DE-719B
recording fathometer depth sounder was used to locate herring
schools. Schools subsequently were plotted on charts of San
Francisco Bay using a combination of calculated horizontal school
dimensions and bottom depths from acoustic echograms, and compass
bearings from known landmarks. A Housten Instrument HI-PAD
digitizer was used to calculate surface area of schools or
portions of schools with approximately uniform density and height
in the water column, baeed on visual examination of acoustic
echograms.
2 Density estimates (tons/lo6 ft were then assigned to
different parts of each school baeed on calibration factors
developed during charter of a purse seine vessel in 1983 (Reilly
and Moore 1983) and modified from intercalibration factors
obtained in 1985 from a Washington Department of Fisheries (WDF)
Bioeonice model 101 echo aounder and model 120 echo integrator
(Reilly and Woore 1985). Finally, echo01 biomass was calculated
for each school eurveyed. Thia sethod, hereafter referred to as
"viaual integration", has been uaed since 1982.
This 8eaeon, a ecientific grade echo sounder, the Bioeonics
node1 105, was acquired, enabling us for the first time to
estimate biomass using the acoustic technique of echo
integration. The data collection eyetem includes the
echosounder, narrow beam <6O) 200 kHz traneducer, an
oscilloscope, a chart recorder, a video cassette recorder, and a
digitizer. Reflected echoes from herring are converted to
voltages, digitized after being attenuated by a factor of ten,
and stored on tape. The echosounder incorporatee a time-varied
gain which ineuree that a particular fish will reflect the eame
amount of voltage regardlees of its depth.
Tapee were proceeeed in Seattle using WDF's echo integrator
and interface (to increaee attenuated voltages). The integrator
3 printe out densities of herring (kg/m 1 for each depth stratum
for each transect. Depth strata were arbitrarily chosen to be 5-
10, 10-15, 15-20, 20-25, 25-30, and 30-40 m. An average deneity
per r2 wee then calculated and multiplied by t h e aurface area
bisected by each traneect to obtain a biomeas estimate.
The eetimate is ecaled by a factor known as the "A
conetant". This incorporatea system parameters of transmitter
source level, receiver sensitivity, beam pattern factor of the
traneducer, and pulse width, and other factore including speed of
eound in water, pi, and a target strength value for herring. The

- 5 -
latter ie related to the amount of reflected voltage and the size
of the fish.
Biomass estimates for most schools were obtained this season
ueing both the echo integration method and the visual
integration method.
S a m 1 i ~ g . . G e U ~ s a
G - l , & l e t . . s . . . During the epawning season, nylon multifilament,
variable mesh gill nete were ueed to sample herring in depths
from 6 to 65 ft. The mesh array consisted of five 10-ft long by
6-ft high panels with mesh size 1.5, 1.75, 2.0, 2.25, and 2.5 in.
Nets were anchored and marked by floats. Soak times varied from
10 min to 15 h. All samples were separated by mesh size.
M1. is te . r TrawJ-. A 12-f t square (mouth-opening) , 65-f t long,
double warp midwater trawl with an 0.5-in. stretched-mesh cod end
was used throughout the season. Tow speed was approximately 3 kn
and tow duration ranged from 5 to 30 min.
Commercial Fishery. From January 5 to March 12, 1987,
samples were obtained from purse seine and lampara boats. Fish
were either collected with a brail as they were brought to the
side of the boat with the eeine or lampara net or obtained from a
bin at an offloading dock.
From December 1, 1986 to January 20, 1987, additional
samples were taken from gill net boats.
EielddP..ro_c_$_g_sin_~ff Sa.lnples.
Body length (BL), the Department's standard measurement for
herring (Spratt 19811, was determined for all fish to the nearest
nm from the tip of the snout to the end of the pigment underneath
the last column of ecales on the caudal peduncle. All fish were

sexed and aeeignad a maturity code of either u n r i p e , mature, or
spent. One or more subsaaples of approximately 17 fish per 10-mm
size class were retained from each school for weighing and aging.
Thie etratified random sampling for age composition allows us to
age more older fish, which occur infrequently in random samples
and have higher variability in growth. To improve age
aseignments for larger fish, additional herring ) 210 m m BL were
selected and aged to augment the age-length data base.
Laboratory Processing of Samples
Leng-Lh-L Wei9ht..
All herring subsamples were returned to the Menlo Park
laboratory, frozen, and thawed before processing. Thawed lengths
were matched with fresh lengths from the field, or a correction
factor of 1.021 (Reilly and Moore 1983) was applied to account
for shrinkage. Fresh or corrected lengths were used in all data
analyses. Weight was determined to the nearest 0.1 g; we have
found no significant difference between fresh weight and thawed
weight. Fish that were completely or partially spent were not
weighed.
Otolith.s,
Otoliths were removed from herring, rubbed clean on wet
paper towels, placed in ethanol, then stored dry in gelatin
capsules. Otoliths were read in ethanol under a dissecting
microscope by two readers independently. When disagreement
occurred in aging, the first reader would re-examine the
otolithe. If otoliths were of poor quality or agreement could
not be reached, they were either sent to Jerome Spratt (CDFG-

- 7 - Monterey) for another reading or the age determination was not
used.
Assianed Ase by Lenath
Using our age-length key for 1986-87 herring, ages were
aseigned to lengths of fish (2-am intervals) not aged, based on
the relative percentage composition of ages (from otoliths) for a
particular eize interval. All fish not aged were combined by
aesigned echool numbers before ages were given to lengths.
*.ssiAsn.edSch OQ 1 Ru~b_e_r~
A school number was used to define each herring school that
spawned in San Francisco Bay. Each sample of herring was
assigned to a school based on a combination of factors: 1) date
of sample; 2) date of spawning as determined by egg deposition
surveys; 3) hydroacoustic observations of schooling patterns and
spawning events; 4 ) percentage of unripe females in the sample;
5 ) examination of daily landings of the commercial fleet and a
knowledge of their fishing locations; and 6 ) niscellaneoua
information from conversations with fishermen.
T-~LaL&~a~e.~-&_tll~nnf oo~-.3.pa.wcc&uSeas-~~.
Total percentage age composition was calculated for the
entire spawning season based on two separate biomass estimates by
school: 1) the sum of spawn escapement estimate (Spratt 1987a)
plus commercial catch: 2) our hydroacoustic biomass estimates
(Spratt's eetimates were uaed for schools not detected
hydroacoustically). To calculate total percentage age
composition by number, mean BL by school was converted to mean
weight, using values from Appendix F. Each biomass estimate for
each school was divided by the appropriate mean weight, and

percentage age compoeition waa ueed to calculate total number of
fieh by age for each school. Numbers for each age were then
summed and divided by total number of fieh. For echoola not
aampled. data from the neareet school, temporally, were ueed. To
calculate total percentage age composition by weight, 1986-87
mean weight at age valuee were ueed along with percentage age
composition by school.
Computer Proceesing of Sample8
Length, weight, sex, and age data from all herring samples
were entered in an IBM XT microcomputer ueing dBaae I11 programa.
Mean, etandard deviation, standard error, and eize frequencies of
BL, by eex, were generated for each sample and each 6chool by
gear type using CDFG microcomputer programs. Other statistical
analyses were performed using programs from ABSTAT and SPSS/PC.
Supplementary Data
Local precipitation and barometric pressure data were
obtained from the National Climatic Data Center, Aeheville,
North Carolina, for Sen Francisco International Airport. These
were used to determine if a relationehip exiete with epawning
evente.
Data from the Bay-Delta Project were examined to determine
catch-per-unit-effort (CPUE) of YOY herring and length
frequencies of YOY and luvenile herring. From 1983 until 1986,
during spring and early eummer, the project conducted extensive
eurface-to-30-ft nidwater trawling near the Golden Gate Bridge
(Figure 1) for out-migrant, marked salmon smolte. Incidental
catchee of YOY herring are uaed as an indicator of the strength

- 9 -
of the year claas of new recruits which will appear in t'he
fishery approximately 18 mo later as 2-yr olds.
Bay-Delta pro~ect pereonnel used fork length (FL) to measure
herring. A regression developed previously (Reilly and Moore
1986) was ueed to convert FL to BL before length frequency
histograms for YOY and juvenile herring were examined.
RESULTS
Non-spawning Season Sampling, Bay-Delta Project Samples
Length frequencies for 7320 YOY and 1883 juvenile (age 1+
yr) herring from San Francisco Bay during April to June 1986
showed a eeparation ranging from 70 to 90 m m BL in April to 90 to
110 m m BL in June (Figure 2). The vertical dashed line
partitions the year classes based on otolith aging. The decrease
in modal BL for YOY herring from April to May is most likely the
result of a later- spawning cohort moving into the sampling area.
Growth of YOY herring was greater than that of the previous
season while juveniles averaged 10 to 35 am smaller than those in
1985 (Reilly and Moore 1986).
Age composition of stratified random samples of herring from
April to June 1986 indicate a wide range of BL for YOYs and
juveniles. Some overlap occurred between 1+- and 2+-yr-old fish.
Few herring older than 2+ yr were captured (Table 1).
Acoustic Monitoring
Suhnary .of&x.rin.g -..- S_c~t!s~o~1-~.
During the previous three seasons, spawning has started
within 2 d of October 30 on the north side of Raccoon Strait
(Figure 1). This season was no exception; a small school
(number 1) spawned on the night of October 28 in Kiel Cove (Table

> 200- M A Y 86 - 40 U - 30 z 100- - 20 3 u - 10 - L U 1 I 1 I I I I I I I I I
8 400- I JUN 86 I
- 200 300-
I I N= 1173 N = 3818 - 150 I
2 00- I I - 100 I
100- I I - 50
. I
1 I I I 1 I 1 I 20 30 40 50 60 /O 80 90 100 110 1k0 140 140 1k0
1 160
BODY LENGTH (mm)
FIGURE 2. Number of Pacific herring (2-mm intervals) from Bay-Delta Project midwater trawl samples, San Francisco Bay, April to June 1986.

- 11 - TABLE 1 . L e n g t h and Age Conpoeition of Pacific Herring Sampled
from Bay-Delta Project by Midwater Trawl in Sen Francieco Bay, April to June 1986.

- 12 -
21. The size of the echuol, ita short residency in the bay prior
to spawning, and the presence of large schools of anchovies in
north bay waters make these herring difficult to detect
acoustically.
Anchovies were abundant in north bay waters during the first
3 wk in November, and repeated attempts to locate herring mixed
in with these schools, using variable-mesh gill nets and
midwater trawl, yielded no adults until November 17. From then
until November 20 small quantities of primarily unripe herring
(school 2) were caught near Sausalito. Herring abruptly
disappeared from this area with no evidence of spawning, and no
further activity was detected for the remainder of the month in
north bay waters.
By the November 30 opening of the commercial season activity
had shifted to the south bay as in the past two seasone.
Although only localized traces of herring activity were detected
on an acoustic survey November 29, significant quantities of
herring (school 3) were present 1 d later in the same area, and
gill net veesels landed 476 tons from this school during the next
3 d. A hydroacoustic estimate of the entire school was not
obtained prior to spawning. Sex composition and mean BL were
different than the mid-November herring.
On December 1, as landings peaked from school 3, a new
school ( 4 ) was found in central eouth bay waters. A trawl sample
yielded 75% unripe fish on December 1 and 58% unripe fish on
December 3. Spawning occurred December 7 and 8 along the San
Francisco shoreline and gill netters landed 481 tons from this
school.

TABLE 2. Sunnary of Herring Schoole in Sen Francieco Bay, October 1986 to March 1987.
Hydroacoustic Spawn biomaea
Aesigned escapement Commercial estimate (tons) echo01 Spawning Spawning eetimate catch "vieual" echo n-ber dates locetion1° (tone) 2) (tong) inteq. inteq.
1 Oct 28 2 s0 - 3 Nov 29-30 4 Dee 7-8 5 Dec 11 6 Dec 17-19 7 Dec 28 8 Jan 4-10
9 Jan 11 10 Jan 18-23 11 Jan 31 12 Feb 20 13 Feb 23-26
14 Feb 23-25 1s 3 -
I t - Legend: AI-Angel
KC 3 - 0 SF 400 SF 2700 SAUS 230 SF 4600 SF 13,100 BELV, 8015 TIB. AI. SAUS COY 20 SF 14.700 SF 130 SAUS 50 BELV. 3570
Island; BELV-Belvedere: COY-Coyote Point; KC- Kiel Cove: SAUS-Sauealito: SF-San Francieco from Pier 29 to Candleetick Point; TIB-Tiburon.
?'from Spratt 1987..
a'not eurveyed with vieual integration equipment prior to rpawning .
*'not eurveytd with echo integration equipment prior to spawning.
sfherring preeent near Sauealito Nov 17-20; eubeequent eurveye yielded no rpawn depoeition.
&'entire rchool not detected hydroacouetically prior to epawning.
Z1herring preeent near Sauealito March 2-16; rubeequent surveys yielded no spawn deposition.
Similar to the previous reason, a emall achool ( 5 ) wae
present in early Decenber in Raccoon Strait and near Angel
Ieland. Fiehing effort ehifted to Sausalito and 305 tone were
caught during a rpawn which peaked on December 11.
Aa school 4 spawned along the shore on December 8, a new
- - - - echool-<6) w a s acou-eticrlby-monitored in the centralaouth bay, - - - -
A variable-mesh gill net ~ample 2 d later yielded 60% unripe
fish. On December 16, a large midwater trawl sample (1002 fish)
yielded 48% unripe fieh, but on the next day a large spawn began
along the San Francieco ehoreline. Thia echool provided the "XH"
gill net veesels with the remainder of their quota.
During Decenber it was difficult to correlate acoustically
detected herring echoole with discrete epawne. A "trickle epawn"
behavior pattern seemed prevalent in which the leading edge of a -
- - - - - - - - - - - - - - - - - - -
school, containing riper fieh, would break-off and 2sp%wn,- - - - - - -
followed by an occasional increase in the volume of the main body
of the echool as more unripe fieh entered the bay.
On December 19, five discrete concentrations of herring were
detected from Raccoon Strait to near Hunters Point. By December
28, the majority of these fieh had merged into one large echool
( 7 ) which epawned along the San Francisco shoreline.
A ridwater trawl ranple December 30 near the Oakland-Bay
- - - - - - Bridge contained a mixture of spent and pre-rpauning herring. - - - - - - - - - - - - - - -
- - - - - - - - - - - - - - - - -
Seventy-five percent of the pre-epawners were unripe and
signified the preeence of the next echool (8). Theae fiah
remained routh of Alcatraz during the next week. During this
tine, in a behavioral pattern eimilar to last eeason, a large

achool trlao cannidered to be achool 8) noved rapidly into north
bay waters from reaward of the Golden Gate Bridge on January 4
and began to spawn along Tiburon, Belvedere and Sauralito. Aleo
on January 4, a trawl mample near Alcatraz still contained 70%
unripe fish. These herring apparently roved to Angel Island and
rpawned from January 7 to 10. Spawning in north bay waters was
continuous from January 4 to 10. School 8 was responsible for
the entire quota for the "even" gill net vessels.
A rnall rchool (9) rpawned on January 10 at Coyote Point but
could not be separated acouetically from the main body before
that date.
On January 12 the first signs of 6chool 10 were detected and
sampled south of Yerba Buena Island; almoet 70% of the herring
were unripe. On the next day a small echool appeared in Raccoon
Strait and near Sauealito and contained 25 to 30% unripe fish.
Bionass increased in south bay waters and gill nettere began to
catch the riper part of the echool from January 13 to 16.
Activity near Sausalito diminished as herring south of Alcatraz
consolidated into two large masses on either side of the Oakland-
Bay Bridge. Those routh of the bridge (echo01 10) spawned from
January 18 to 23 and provided the "odd" gill net veeeela with
their entire quota and lampara veseels with approximately 525
tons. On January 23 the second large echool (11) was located
between the Golden Gate Bridge and China Baein. These fish
rpawned January 31 to February 2 along the San Francieco
shoreline and were difficult to fish by roundhaul vereels,
yielding only about 50 tone.

- 16 -
The firat appearance of new fish (schools 12, 13, and 1 4 )
occurred January 26 near Sausalito. A roundhaul sample contained
30% unripe herring. By January 30 biomass had increased and the
main body had moved east of Angel Island during high tide, For
the next 3 wk large concentrations of herring were scattered
throughout north and south bay waters with no spawning evident.
Most fish were ripe by February 16. A small spawn (school 12)
occurred February 20 near Sausalito. The main body had
consolidated into a north bay school (13) and south bay school
(14), the latter being available to purse seiners at low tide
near Alcatraz. On February 23, spawning began simultaneously
near Belvedere and Tiburon and along the San Francisco shoreline.
The roundhaul fleet pursued these two schools throughout their
residency in the bay and landed 1780 tons .
Very little activity occurred in March. A small school (15)
mlxed with anchovies was detected and sampled in Raccoon Stralt
and near Sausalito from March 2 to March 16 but no spawn could be
located. Only a few purse seiners remained in the fishery and
landed approximately 10 tons.
A k z ~ w t c- _B_i~szs~~s_t& me tUe_6-C0rSan-F_r _anc_&_s_c_p_ -3 a_y
Our total hydroacoustic biomass estimate, using visual
integration, was 40,930 tons (Table 2); this does not include
echools 1, 3, and 9, which were not detected. Spawn escapement
estimate and catch for these schools was about 900 tons. In
addation, 1340 tons were landed from achools 13 and 14 before the
visual integration survey. Thus, an adjusted visual integration
biomass estimate would be 43,170 tons. This compares with 56,800
tons from spawn escapement and catch. During the past five

.pawning aeaeona vi~ual integration eatimatsa have differed from
catch-plus-escapement eetimatee by a range of 10 to 38% and have
ehown the same trend of a aubatrntial decline in 1983-84 followed
by a gradual increaee the next three seasons (Table 3 ) .
The echo integration estimate also must be adjueted to
account for echools not detected and for herring landed from a
achool prior to a survey. Based on spawn eecapement surveys,
approximately 1485 tons were not detected with the echo
integration equipment and 1340 tone were landed from echools 13
and 14 before biomass data collection. Adding this to the 30,225
ton total biomaee eetimate yields 33,050 tons, only 58% of the
total eetimate from catch plue eecapement. However, this echo
integration estimate must be considered preliminary and eubject
to revision after "A" constant parameters, particularly target
etrength, are estimated more accurately. If target strength
values for San Francisco Bay herring are lees than the -33
decibels per kg using in the scaling factor equation, biomass
estimates will increaee. The above value ie currently ueed by
WDF and was derived from comparisons of net haul and acoustic
deneity (Lemberg 1978).
Herring Samples from San Francisco Bay
Eighty-seven samples of adult herring were collected in San
Francieco Bay from October 27, 1986 to March 16, 1987 (Appendix
A); these contained a total of 13,125 fieh. Herring were
eampled from all schools except numbers 9 and 12.
Commercial gill net sample6 are biased due to meeh
selectivity and were not included in size and age composition

TABLE 3. Summary of Acouatic and Spawn Eecapement-plum-Catch Bioraee Emtirater for San Francisco Bay, 1982-83 to 1986-87.
Biomass estimate (tone) Searon Visual inteqration18 ~eca~ene-nt -v lue-catch-2~
l'includea biomass known to be mireed by acoustic rurveye or caught previous to acoustic rurveye.
gdata from Spratt (1987a).

- 19 - data combined by achool. However, aged fieh from theee eaaples
were used as part of an age-length key and a gill net length
frequency histogram was generated.
Lenqth Co-mpoei tion.
Variable-eme_s_h-_$;&J1l.I.IN-et Samples-. A total of 3769 herring was
obtained from 25 samples (Appendix B) from all schools except 9,
12 and 15. Samples grouped by assigned school number showed the
usual trend of decreasing mean BL from the beginning to the end
of the season (Table 4): however, mean BL for schools sampled
from late November (school 3) to early January (school 8) was
fairly uniform and only varied by 4 mm.
A series of gill net length frequency histograms was
generated for 1.5-, 1.75-, 2.0-, 2.25-, and 2.5-in. mesh plus
commercial mesh (Figures 3-81. Al l conaercial samples were
combined due to the similarity of length composition in December
and January. All samples from 2.5-in. mesh were combined due to
low numbers. Monthly mean BL varied by as much as 17.7 mm for a
particular mesh size, primarily due to the preponderance of large
herring in school 1 sampled in October. Mean BL data from the
past six seasons for mesh sizes 1.25 to 2.25 in. are summarized in
Table 5. All means for 1986-87 are within the range of previous
neans for a particular month and mesh size except for November-
December for the three largest meshes. Unweighted means were
calculated by averaging each monthly mean in order to compare
with weighted means without the effect of sample size.
The shift in length composition to smaller fish ae the
season progressed is apparent from observing which neeh size
catches the highest proportion of fish. Without exception, in

TABLE 4. Number of Paci f ic Herring by Body Length (2-mm Intervals), Combined by Aasigned School Wunber, from Variable-Mesh Gill Net Samples, Sen Francisco Bay, October 1986 to February 1987.
Body Assigned School Number Zenath (mm) 1 2 3 4 5 6 7 8 lo

TABLE 4. (cont'd.) Aeeigned Assigned
Body rchool number Body rchool number lcnath (mm) 11 13 14 lcnqth (ma) 11 13 i_e
190 192 194 196 198 200 202 204 206 208 210 212 214 216 218 220 222.
N Mean

rio ISO rio 170 180 190
B O D Y L E N G T H (mm)
FIGURE 3. Percent length frequencies (2-mm intervals) from 1.5-in. mesh gill net samples, San Francisco Bay, October 1986 to February 1987.
BODY L E N G T H (mm)
FIGURE 4. Percent length frequencies (2-nun intervals) from 1.75-in. mesh gill net samples, San Francisco Bay, October 1986 to February 1987.

1s-
$0-
S-
3 10: a lu s- Q?. Y
BODY LENGTH (mm)
NOV-DEC N= 191 ZP 187.4
-
JAN
I I
--
lo-
5 -
FIGURE 5. Percent length frequencies (2-mm intervals) from 2.0-in. mesh gill net samples, San Francisco Bay, October 1986 to February 1987.
1 I 1 I I
FEB
1
BODY LENGTH (mm) FIGURE 6. Percent length frequencies (2-mrn intervals) from
2.25-in. mesh gill net samples, San Francisco Bay, October 1986 to February 1987.
140 150 1:O 1:
B O D Y LENGTH ( m m )
FIGURE 7. Percent length frequencies (2-mrn intervals) from 2.5-in. mesh gill net samples, San Francisco Bay, October 1986 to February 1987.
B O D Y LENGTH (mm)
FIGURE8. Percent length frequencies (2-mrn intervals) from commercial gill net samples, San Francisco Bay, becember 1986 to January 1987.
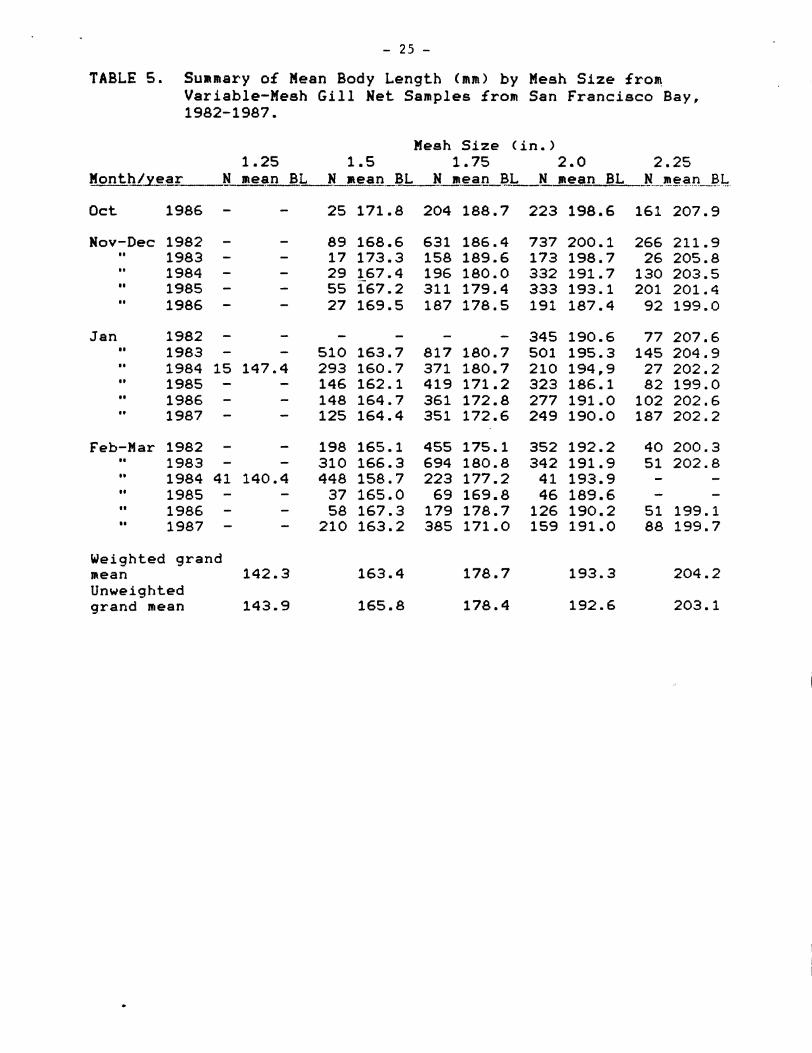
TABLE 5. Summary of Wean Body Length (mm) by Weeh Size from Variable-Mesh Gill Net Samples from San Francisco Bay, 1982-1987.
Mesh Si z e (in. > 1.25 1.5 1.75 2.0 2.25
N mean BL N mean BL N mean BL N mean BL _N_-mg-a,n--BL B o n t h / v e a r -- ---.--- ----.
Oct 1986 - - 25 171.8 204 188.7 223 198.6 161 207.9
Nov-Dec 1982 - - I 8
89 168.6 631 186.4 737 200.1 266 211.9 1983 - -
e l 17 173.3 158 189.6 173 198.7 26 205.8
1984 - - ee
29 167.4 196 180.0 332 191.7 130 203.5 1985 - -
me 55 i67.2 311 179.4 333 193.1 201 201.4
1986 - - 27 169.5 187 178.5 191 187.4 92 199.0
Jan e e
Feb-Mar am
Weighted grand mean 142.3 163.4 178.7 193.3 204.2 Unweighted grand mean 143.9 165.8 178.4 192.6 203.1

each seaaon the 2.0-in. mesh caught the moat fish in October,
November and December, while in January more herring were caught
with the 1.75-in. mesh. The February-March period is similar to
January except for 1984 (the El Nina period) when growth rates
were low, small fish predominated, and the 1.5-in. mesh caught
the most fish.
Midwater Trawl Samples. .. The trawl yielded 3673 herring in
20 samples (Appendix C) from all schools except 1, 2, 9 and 12.
Sample 490 was excluded from the total length and age composition
data due to a suspected bias towards small fish. Combined school
mean BL (Table 6) averaged 6 mm less than that from gill net
samples. Mean BL from the two gear types was more similar in
November and December when fewer small fish occurred in the
schools.
P~rs.~-.-_S.~1in~e~~~~a~n._d--L~m_~a~xa~N.e_t.~.S~?!~~.1_~e~s. . We measured 4 370
herring from 29 samples (Appendix D) taken from January 5 to
March 12 from schools 8, 10, 11, 13, 14 and 15. Samples 529
(school 14) and 536 (school 15) were excluded from the total
length and age composition data due to a bias caused by
individual handling of fish by crew members. In addition, sample
529 resulted from a missed set. The roundhaul fishery occurs
when younger fish comprise the bulk of the biomass and mean BL
does not vary much between schools; this season the range was
170.1 to 177.9 mm (Table 7 ) . Mean BL averaged 3.6 m m greater
than that of trawl aamplee and 5.3 am Ices than that of gill net
samples for the same achools sampled.
During the past six seasons, mean BL of all fish sampled
from the roundhaul fleet has ranged from 162 to 181 mm a able 8).

- 27 - TABLE 6. Number of Pacific Herring by Body Length (2-mm Intervals),
Combined by Aeeigned School Number, from Midwater Trawl Sanplee, San Francisco Bay, December 1986 to March 1987.
Body Aeeigned School number lenqth (nn) 3 4 5 6 7 8-- 10 11

TABLE 6. (cont'd.) Aeeigned
Body achool number I e n ~ t h (mm) 13 14 15
Asaf gned Body echo01 number lenuth -Lmrn) 13 14 1s
188-189 190 192 194 196 198 200 202 204 206 208 210 212 214 216 218 220 222 224 N Wean
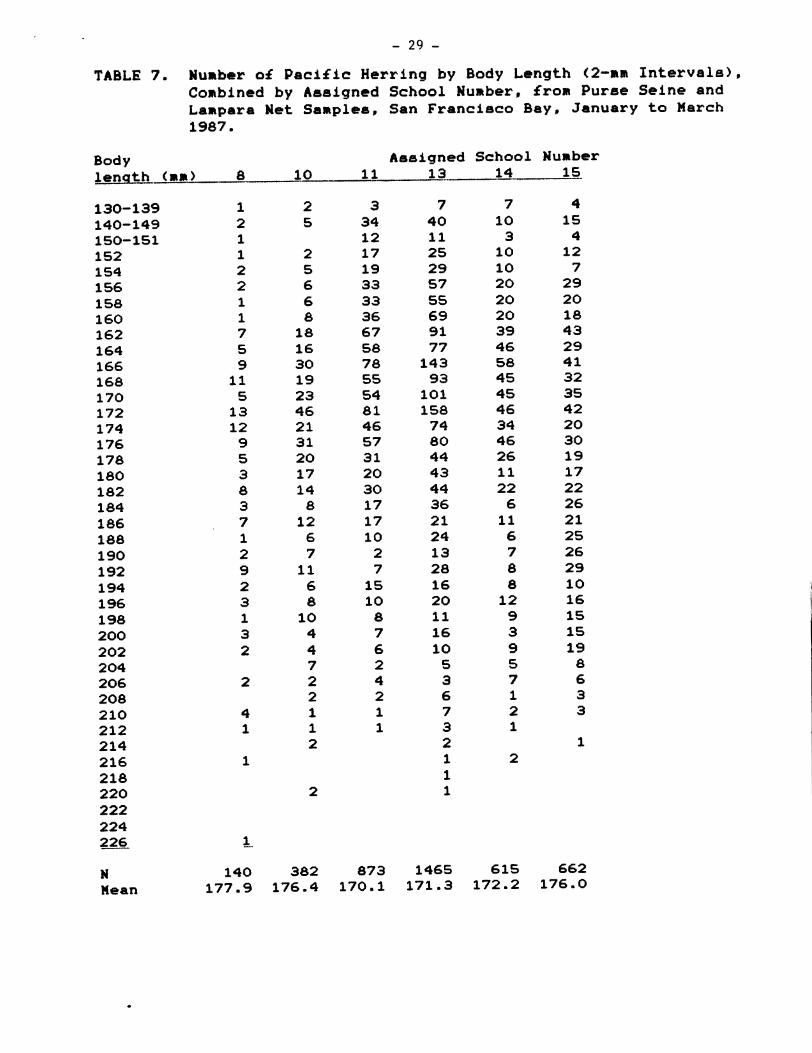
TABLE 7. Number of Pacific Herring by Body Length 12-RIR Intervals), Combined by Aseigned School Number, from P u r ~ e Seine and Larpara Net Sanplee, San Francieco Bay, January to March 1987.
Body Aeeigned School Number lenqth (nr) 8 10 11 13 14 1 s
N Mean
Theee fluctuations are determined by the relative strength of
year classes as well as periods of unusual growth, as in the El
~ i g o event of 1983-84. For example, 19.2% of all fish sampled in
1982-83 were less than 170 mm BL, compared with 76.2% in 1983-84.
The 1981 year class, first recruited to the fishery in 1982-83,
is relatively weak, whereas the combination of poor growth and a
strong 1982 year class cauaed a dramatic shift in size
composition the following year. In comparison, herring sampled
in 1986-87 showed an average size distribution (Table 8).
~ ~ ~ ~ p . a r ~ o ~ ~ ~ ~ L e _ n ~ % L C _ o _ m p ~ - s L_fionbvGe9r-Tkpee.. I n pr ev i ou s
reports (Reilly and Moore 1982, 1983, 1984,, 1985, 1986) we have
discussed biases inherent in the v~riable-mesh gill net and
midwater trawl samples. The mesh array of the gill net, while
sampling the entire size range of a herring school, selects for a
higher proportion of larger fish than is found randomly in a
school. Size and speed limitations of the trawl may allow for
net avoidance by some of the largest and strongest fish. The
possibility also exists of size stratification by depth (Hay et
al. 1986). If larger herring tend to remain deeper and nearer
the bottom than smaller fish, trawl samples will always have a
smaller mean BL then gill net samples.
In the absence of unbiased roundhaul samples, a combination
of gill net and trawl samples for each school may be the most
accurate representation of the size composition of those herring
~chools spawning before or after the roundhaul fishery. During
the past six seasons, there have been 17 schools adequately
sampled by each of the three gear types (Table 9). Differences
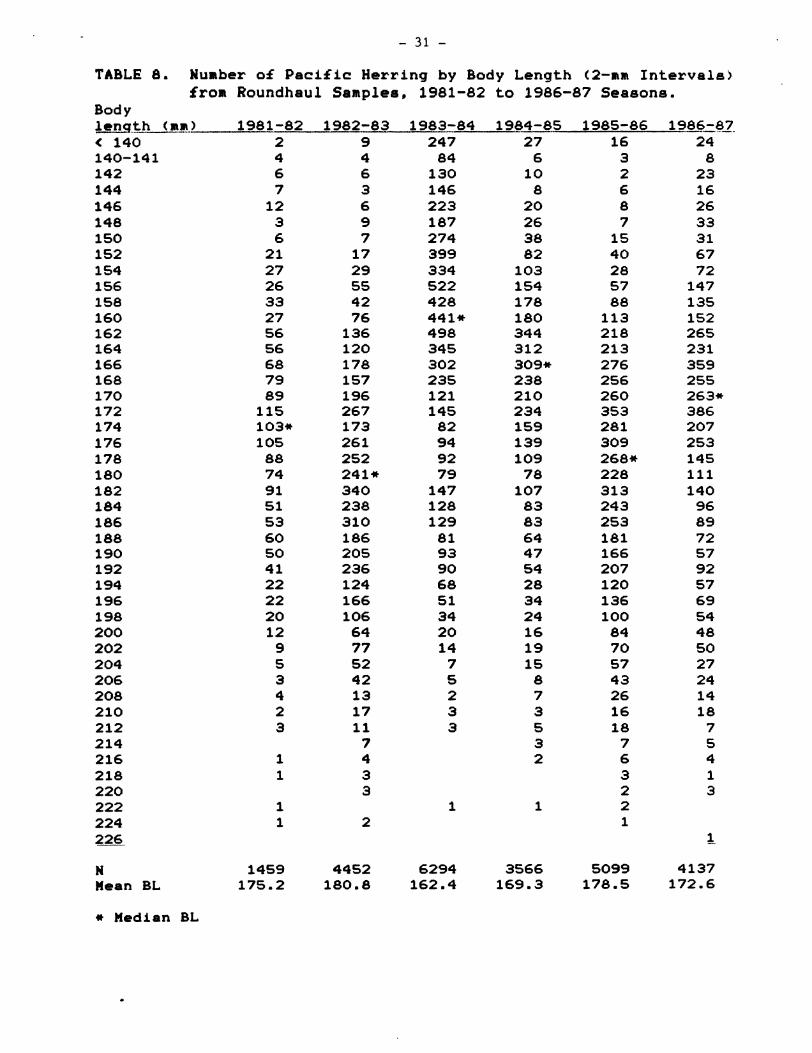
TABLE 8. Number of Pacific Herring by Body Length (2-ma Intervale) from Roundhaul Samples, 1981-82 to 1986-87 Seaeone.
Body lenqth (mn-1 1981-82 1982-83 1983-84 1984-8-5 1985-86 19&6=82
247
* Median BL

TABLE 9. Comparison of Gill Wet, Hidwater Trawl, and Roundhaul Samplee, San Francisco Bay, 1981-82 to 1986-87.
School Mean BL Ave. mean BL Mean BL Diff. in Year number qill net trawl ail1 net-trawl roundhaul me3-~.--B.I.=
1986-87 8 183.6 174.5 179.0 177.9 1.1 10 180.2 172.3 176.2 176.4 0.2 11 175.3 168.3 171.8 170.1 1.7 13 177.4 169.3 173.3 171.3 2.0 14 177.9 165.6 171.7 172.2 0.5
mean = 1.3

between the combined mean BL from gill net and trawl samples and
that of roundhaul samples ranged from 0.1 to 4.4 am and averaged
only 1.3 mm.
Commercial Gill Net Sam~les.. By regulation, minimum mesh
size remained at 2.125 in. throughout the fiehing season for the
third year in a row. We obtained 12 samples containing 1313 fish
from schools 3, 4, 6, 8 and 10 (Appendix El: mean BL by school
fell within a narrow range of only 2 mm (Table lo), reflecting a
uniform size composition throughout the commercial season.
During this same period, mean BL by school from our gill net
samples only varied by 7.1 mm.
It appears that the effective meeh size of the monofilament
commercial gear may be smaller than an equivalent multifilament
mesh. For example, during January 1986 (Reilly and Moore 1986)
and January 1987, weighted mean BL from all commercial samples
was 192.6 mm, while the weighted mean BL from our 2.0- and 2.25-
in. meshes was 190.5 and 202.3 mm, respectively. The proximity of
the means for 2.0-in. mesh and commercial meeh (which should be
2.125-in.) supports the contention by some fishermen that, while
the 2.125-in. mesh may be legally measurable as such (due to
elasticity), it effectively functions as a smaller mesh.
SczRatios-
The usual trend of an increasing percentage of females in
herring schools as the season progressed was again apparent this
season (Table ll), with eeveral exceptions. Schools 2 and 15,
both small in biomass, were in contrast to this trend and
interestingly were the only schools for which spawning could not
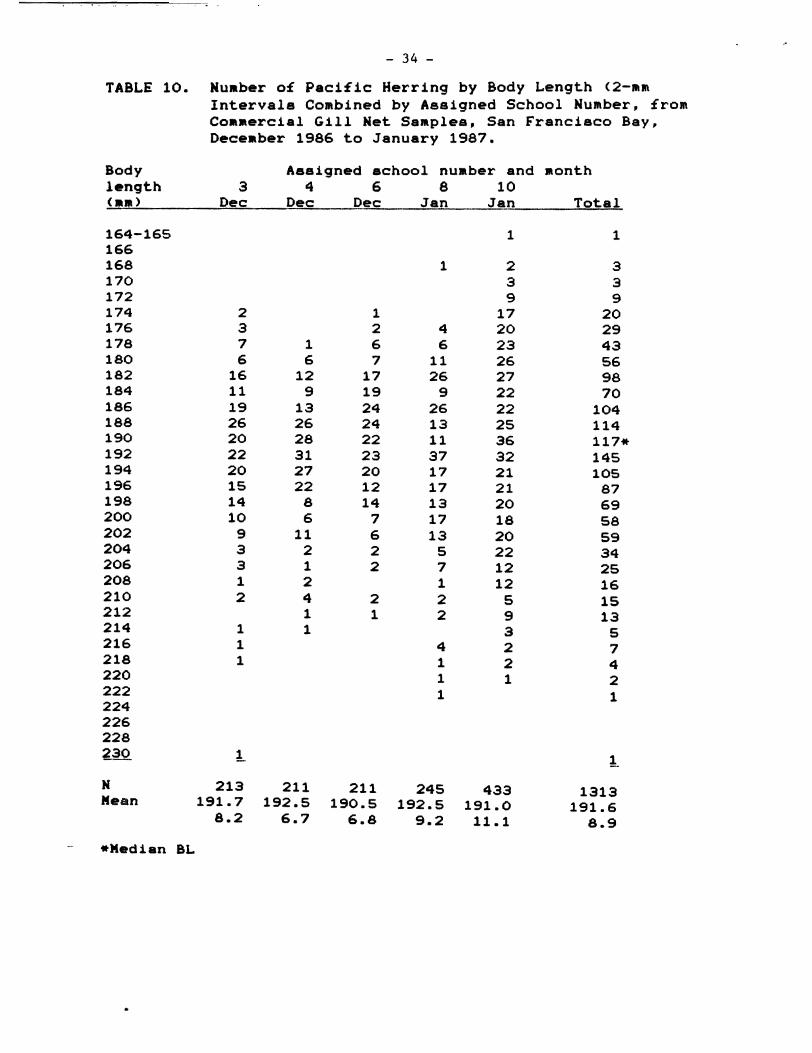
TABLE 10. Number of Pacific Herring by Body Length (2-mm Intervale Combined by Assigned School Number, from Cornercial Gill Net Samples, Sen Francieco Bay, December 1986 to January 1987.
Body Aeeigned achool number and month length 3 4 6 8 10 (nm) Dec Dec Dee Jan J a-n Total
N 213 211 211 245 433 1313 Nean 191.7 192.5 190.5 192.5 191.0 191.6
8.2 6.7 6.8 9.2 11.1 8.9

TABLE 11. Percentage by Number Sox Compoeition of Pacific Herring Samples from San Francieco Bay, by School, ~ e a r e l0 Combined, October 1986 to March 1987.
Percentage school Month N Wale Female
O c t Nov Nov Dec Dec Dec Dee Jan Jan Feb Feb Feb ear.
kgear types are variable-mesh gill net, midwater trawl. purse reine, and lampara net.
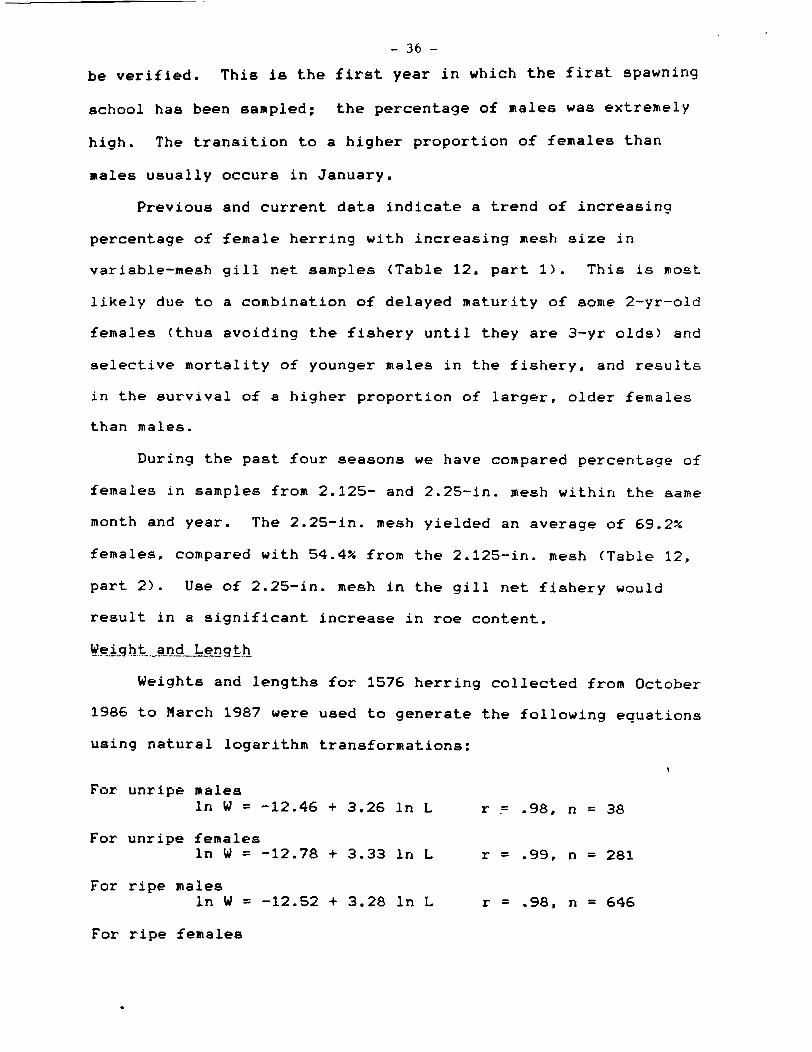
be verified. This is the first year in which the first spawning
school has been sampled; the percentage of males was extremely
high. The transition to a higher proportion of females than
males usually occurs in January.
Previous and current data indicate a trend of increasing
percentage of female herring with increasing mesh size in
variable-mesh gill net samples (Table 12, part 1). This is most
likely due to a combination of delayed maturity of some 2-yr-old
females ( t h u ~ avoiding the fishery until they are 3-yr olds) and
selective mortality of younger males in the fishery, and results
in the survival of a higher proportion of larger, older females
than males.
During the past four seasons we have compared percentage of
females in samples from 2.125- and 2.25-in. mesh within the same
month and year. The 2.25-in. mesh yielded an average of 69.2%
females. compared with 54.4% from the 2.125-in. mesh (Table 12,
part 2). Use of 2.25-in. mesh in the gill net fishery would
result in a significant increase in roe content.
Weights and lengths for 1576 herring collected from October
1986 to March 1987 were used to generate the following equations
using natural logarithm transformations:
For unripe melee In W = -12.46 + 3.26 In L r .= .98, n = 38
For unripe females In W = -12.78 + 3.33 In L r = .99, n = 281
For ripe males In W = -12.52 + 3.28 In L r = .98, n = 646
For ripe females

TABLE 12. Percentage by Number of Female Herring by Gill Net Meeh Size from Sen Francieco Bay.
part 1. variable-mesh gill net
nesh 1981- 1982- 1983- 1984- 1985- 1986- 1982 mize (in3 1983 1284 1 1986 1 987 1' m-ex.
ltexcludes October 1986 nanple z/insufficient sample aize
part 2. 2.125-in.commercia1 and 2.25-in.DFG meeh
Month and year 2.125 in 2L2L.A !?
Dec 1984 Dec 1985 Dec 1986 Jan 1984 Jan 1985 Jan 1986 Jan 1987 Feb 1986 Mean

For all ripe herring In W = -12.84 + 3.34 In L r = .98, n = 1257
A plot of these untransformed data points for all ripe fish
shows the expected curvilinear relationship between length and
weight (Figure 9). Estimated weights at length for ripe males,
for ripe females, and for all ripe fish are presented in
Appendix F.
Last season, the calculated weight/length regression for 991
ripe herring was:
In W = -12.82 + 3.34 In L r = .99
An overall test between the two regressions for all ripe herring
was not significant at the 95% level of significance (F = 4.86, p
= 0.008, d.f. = 2265). All estimated weights for the 1986-87
season are within 2% above that of the previous season and
continue t o indicate good growth.
L~??2, t .h at Ag-!E
Mean BL at age has been fairly similar during the past three
seasons except for the 1982 year class which has shown above
average growth (Table 13). As 2-yr olds, this year class had
poor growth (along with 3- to 6-yr-old fish) during the El ~ i E o
event of the 1983-84 season. Mean BL for the 1982 year class as
5-yr olds is 5-6 m m higher than that of 5-yr olds from the
previous two seasons. Herring aged ae 9-yr olde were too few to
. include in the mean weight and length table.
Weight& .-.. Mean weight at age for 5- to 7-yr-old herring exceeded that
of the previous two seasons (Table 13) while mean weights for

Mrn -4 o' aJ .-I 3 I LI s aJ u A M 0 C U

TABLE 13. Wean Length and Weight of San Francisco Bay Herring by Season, 1983-84 t o 1986-87.
Age Mean wt. (g) ( v r ) 1986-&!L - . - . 198.5-86 1984-5 1983-84

other year claeaea were average and more similar to past seaaons. . ."+ 3.
The above average growth of the 1982 year class particularly
stand8 out. Differences between weight at age during the past
three seasons and the 1983-84 season are dramatic. Weights at
age in 1983-84 were 17 to 29% less than corresponding ones of the
following three seasons (Table 13).
4!t~_se..-.C_o_n~osit_I.on_.
Pairs of otoliths were aged for 1485 herring from stratified
random samples from variable-mesh gill nets, midwater trawl, and
purse seine and lampara net samples (Table 14). Differences in
mean BL at age between these data and Table 13 are due to the
pooling of data in Table 14 into 2-mm intervals and the exclusion
of spent or partially spent fish in Table 13.
Three random samples were aged from the commercial gill net
fishery from schools 3, 4, and 6 (Table 15). The higher mean BL
for 3-yr olds results from the use of 2.125-in. mesh which
selects only the largest fish of this year class. The lower mean
BL for 5-yr olds results from the difference between random
samples here and the stratified random samples in Table 14. The
fact that mean BL for 4-yr olds is fairly similar for both types
of sampling is a result of the mean BL inherent in 2.125-in.
mesh; the entire size range of 4-yr old8 is well represented in
2.125-in. mesh.
An additional 137 large herring were selected for aging
(Appendix G) for use in construction of an age-length key.
Variable-mesh Gill Net Samples2- Samples for age composition
were obtained for all schools except 9, 12, and 15 (Table 16, part
1). This wae the first season in which a sample of the first

TABLE 14. Number of Pacific Herring at Age by Body Length (2-mn Intervale) from All San Francisco Bay Samples (Excluding Conrercial Gill Net), October 1986 to Harch 1987.
Size interval Age (yr) (nn ) 2 3 4 5 6 7 8 9 130-139 6 140-149 39
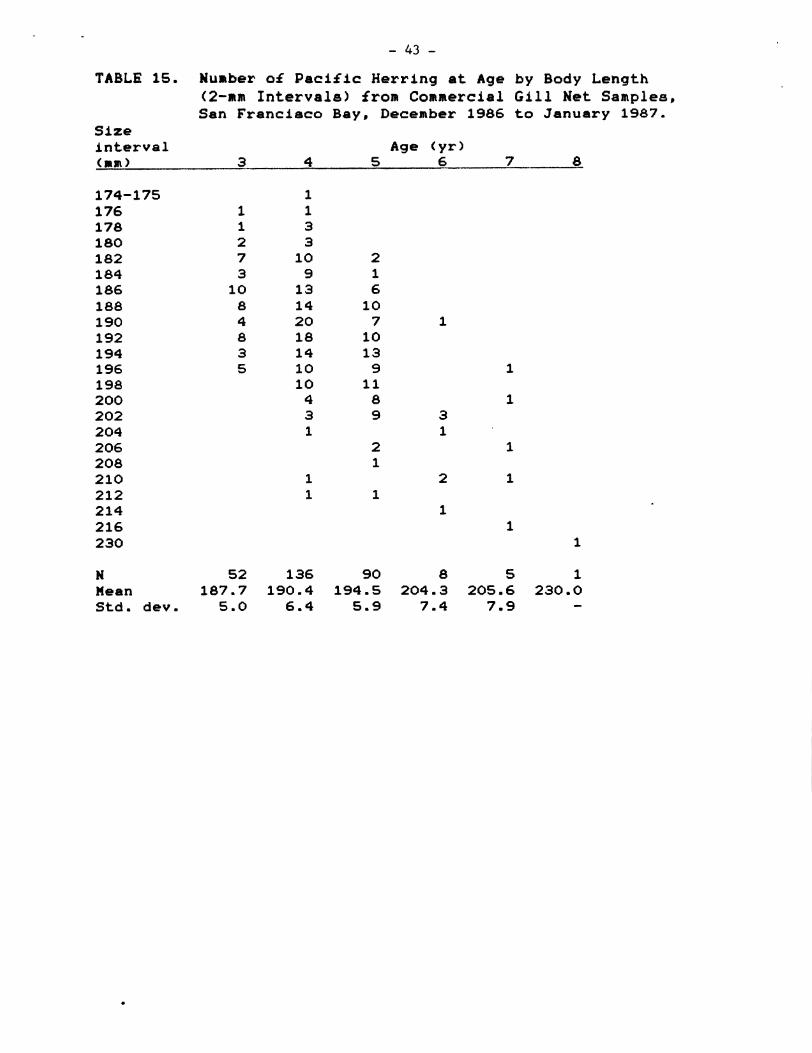
TABLE 15. Number o f Pacific Herring at Age by Body Length (2-mm Intervale) from Commercial Gill Net Samples, San Francisco Bay, December 1986 to January 1987.
Size interval Age (yr) (mn) 3 4 5 6 7 8
N 52 136 90 8 5 1 Mean 187.7 190.4 194.5 204.3 205.6 230.0 Std. dev. 5.0 6.4 5.9 7.4 7.9 -

TABLE 16. Percentage (by Number) Age Composition of Pacific Herring Samples, Combined by Aeeigned School Number, Baeed on Otolith Aging and Subsequent Age Aeeignments by Length. from San Francleco Bay, October 1986 to March 1987.
part 1. from School
2 ?sY!Lker---.-- 1 2 2
8 - 3 - - -
4 4 5 13 6 7
variable-mesh gill net eamplee Age (yr)
3 - 4 5 6 7 8 ---- 11 20 22 14 18 12 32 34 18 5 7 4 3 6 3 2 18- - 5 - 1; - - -
40 43 11 2 31 4 2 13 1 30 40 22 1 T*
part 2. School ngEber-.-
3 4 5
- 6 - ~
7 8 10 11 13 14 15
part 3. School
15 24 29 32 35 35
from
2 .--"- 8
nidwater trawl eamplee, Age(yr)
5 6 7 ---- ------- 18 2 2
from roundhaul samples Agetyr)
17
- - 1 2- 131
T* 147 156 21 0 2 2 55
Number
Number .aaei!zn d
564 1
- - 77 - 1 37 160
Number aeeiqned ---- .. - - . - .- . .
64 165 45 894 170 891 75 336 167 105 153
Number
part 4. from commercial gill net samplee. School A g e l y r ) Number Number number 3 4--- 5 6 7 s-.--- a s d a eis!Ed 3,4,6 17 47 31 3 2 T* 292 15
*T trace amount, lees than 0.05 percent

spawning echoal (late October) was obtained and age composition
was very different from all succeeding schools. Forty-five
percent of this school consisted of herring 6 yr and older.
However, the 3-ton spawn escapement estimate does not contribute
much to the total biomass and age composition for the spawning
eeason. The usual trend can be seen of an increasing percentage
of 2-yr-old fish as the season progressed, while 4- and 5-yr-old
fish became less frequent in later schools. Herring 6 yr and
older comprised lees than 10% by number of all schools sampled
after mid-November. The weak 1981 year class (6-yr olds) is
poorly represented beginning with school 2.
Midwat2.r Trawl Sampl~s.., Age class composition data showed
the same general trend as gill net sample data (Table 16, part
2). However, trawl samples yielded a higher percentage of'2-yr-
old fish and a lower percentage of herring 5 yr and older than
gill net samplee. The last school of the season, for which no
spawn could be found, contained fewer younger fish than the
previous 8chools. This was contrary to the overall trend of
dominance of younger fish in schools later in the season.
Herring 6 yr and older comprised no more than 4% by number of any
school sampled.
Puree Seine and Lampara Net Samples. Roundhaul samples were
confined to the latter half of the spawning season (January to
March) and showed a more uniform age composition (Table 16, part
3). A slight increase in 2-yr old8 and a corresponding decrease
in 4-yr olds did occur from January to February (schools 8 to
141, while the age composition of school 15 did not conform to
the general trend. Herring 6 yr and older coxtprieed no more than
4% by number of roundhaul eamples.
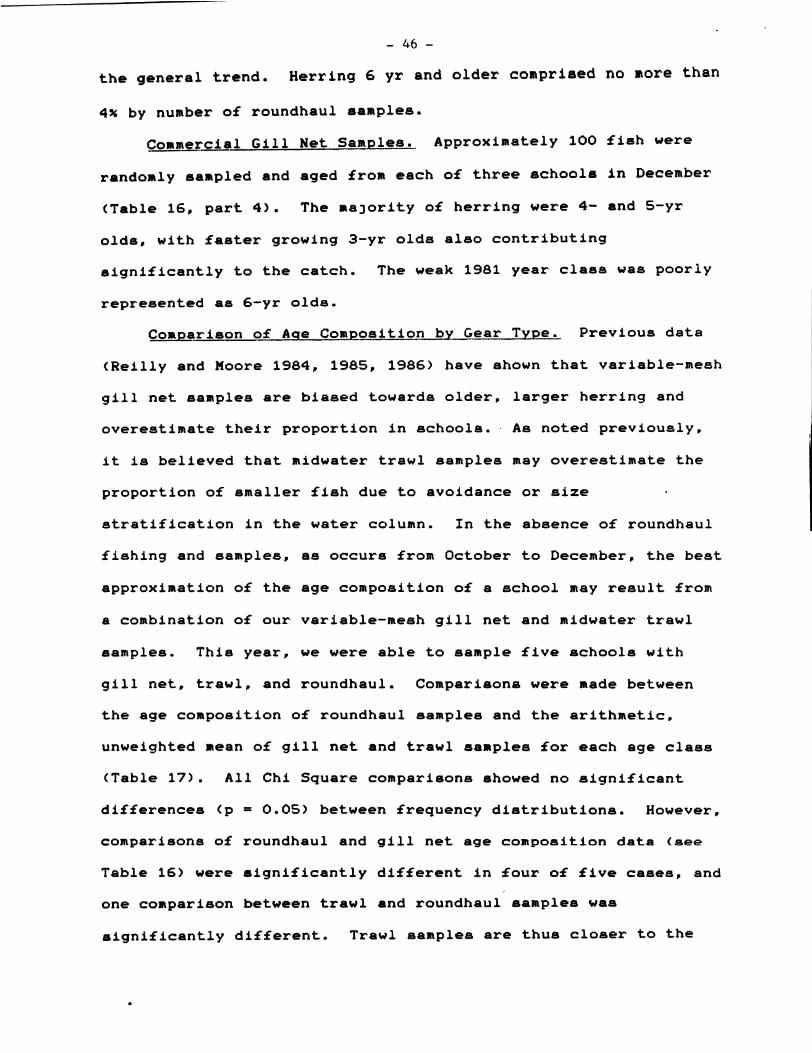
C o n m e r ~ a l Gill Net Sam~les. Approxinately 100 fish were
randomly sampled and aged fron each of three schoole in December
(Table 16, part 4 ) . The majority of herring were 4- and 5-yr
olds, with faster growing 3-yr old8 also contributing
significantly to the catch. The weak 1981 year class was poorly
represented as 6-yr olde.
Corparieon of Aqe Conposition by Gear T v ~ e . Previous data
(Reilly and Moore 1984, 1985, 1986) have shown that variable-mesh
gill net samples are biased towards older, larger herring and
overestimate their proportion in schools. . As noted previously,
it is believed that midwater trawl samples may overestimate the
proportion of smaller fish due to avoidance or size
stratification in the water column. In the absence of roundhaul
fishing and samplee, as occurs fron October to December, the best
approximation of the age compoeition of a echo01 may result from
a combination of our variable-mesh gill net and midwater trawl
samples. This year, we were able to eample five schools with
gill net, trawl, and roundhaul. Conparisone were made between
the age composition of roundhaul samples and the arithmetic,
unweighted mean of gill net and trawl ranples for each age claes
(Table 17). All Chi Square comparisons ehowed no significant
differences (p = 0.05) between frequency distributions. However,
comparisons of roundhaul and gill net age compoeition data (see
Table 16) were rignificantly different in four of five cases, and
one comparison between trawl and roundhaul eamplee was
rignificantly different. Trawl eanplee are thus closer to the

TABLE 17. Corparieon of Percentage Age Compoeition Data from Roundhaul Samplee and Combination of Variable-mesh Gill Net and Hidwater Trawl Samples, San Francisco Bay, January to February, 1987.
School Gear Age ( yr Chi Square number type 2 3 4 5 6-9 roba ability value
8 RH 33 32 22 9 4 0.53 GN-MT 32 30 22 14 3
10 RH 36 35 17 9 3 GN-MT 34 36 19 10 1
11 RH 48 33 14 4 1 0.21 GN-MT 43 33 16 8 0
13 RH 47 33 14 5 1 GN-MT 44 31 14 9 2
14 RH 42 35 15 7 1 0.43 GN-MT 48 27 15 8 2

unbiased roundhaul sample8 than are gill net aamplee.
T,ota1-&seCo~~0~i&.i0,g,-f OX-S~_B,)?!-Q~E~ ..-,- SSeeaso-n.,- The 1982 t h r oua h
1985 year claaees contributed 97% by number and 95% by weight to
the total 1986-87 spawning biomass in Sen Francieco Bay (Table
18). Good recruitment has occurred during the past four seasons.
The weak 1981 year class ie beginning to cycle out of the
fishery, while mortality factors and the strong showing of
younger fish have resulted in the poor representation of herring
7 yr and older.
C_a_t.chofYOYHE~_r11n~9.a_nnd..2ecec~.uA-ttw.n4..
Bay-Delta Project data have been examined during the past 4
yr to determine if a relationship exists between average catch
per tow of YOY herring during the spring in San Francisco Bay and
the magnitude of subsequent recruitment to the spawning grounds
as 2-yr olds. Average catch per tow increased substantially from
1983 to 1985 and in 1986 was similar to that of 1985 (Table 19).
Recruitment was calculated from percentage by number of 2-yr olds
in each school, catch plus spawn escapement estimates (Spratt
1985, 1986, 1987a), and mean weight-at-age (Table 13, Reilly and
Moore 1986). Estimated recruitment has only varied by 15% during
the past three seasons and does not reflect the magnitude or
trend in YOY catches in the bay.
Tidee, Barometric Pressure, Rainfall and Spawning
From October 1986 to March 1987 there were nine tidal cycles
in which the highest tide (+5.5 ft. or greater) during a 24-hr
period occurred at night (sunset to sunrise) (Figure 10). Five
spawns occurred on four of these cycles within the season. If the

TABLE 18. Total Percentage Age Composition for 1983-84 through 1986-87 Spawning Seasons in San Francisco Oay .i'
part 1. percent by number
based on spawn escapement-plus-catch biomase estimates Age(yr1
Seaeon---.- 2 3 .-.-..- 4 5 -." 6 ..-....--... - 7 ..--- as9 .--.- 1986-87 29.2 33.6 23.1 11.2 1.6 1.1 0.2 1985-86 32.5 32.1 25.3 5.3 3.2 1.5 0.1 1984-85 38.7 43.9 5.7 4.8 5.4 1.4 0.1 1983-84 56.6 11.9 15.8 12.6 2.9 0.2 0.0
based on hydroacoustic biomass estimates Age(yr1
part 2. percent by weight
based on spawn escapement-plus-catch estimates Age(yr1
2 3 4 5 6 7 869 S.e -~so! . . . - - - - - . - - - . - - . - - . "
1986-87 19.0 31.9 27.8 16.6 2.6 1.8 0.3 1985-86 22.1 30.6 32.2 7.3 4.9 2.6 0.3 1984-85 27.8 47.5 7.0 6.7 8.4 2.3 0.3 1983-84 42.1 12.7 20.1 19.6 5.1 0.4 0.0
based on hydroacoustic biomass estimates Age(yr1
h s t a from 1983-84 to 1985-86 have been revised subsequent to publication of previous administrative reports.

TABLE 19. Monthly Average Catch per Tow of Young-of-the-Year Pacific Herring in San Francisco Bay, April to June, 1983 to 1986Y and Recruitment Estimates 1985 to 1987.
Year k P ! 3 L98P i.SSs L9.M
Number Catch Number Catch Number Catch Number Catch of per of per of per of Per
??onthh ...- ~ o u . s . . t o w t o w s ~ t ~ w Wtoowaaaa ttox ...._w._w _t.o_wwss --,tow
April 67 152.9 50 290.6 90 1364.3 87 582.8
mean 239.9 820.6 1372.5 1398.3
Recruitment of 2-yr olde (lOOOs> 185,742 162,422 168,962
lidate from Bay-Delta Project
HIGHEST TIDE AT NIGHT,
- r - RAIN 2
0.1 IN.
SPAWNS
c n u - rS
i b
FALLING BAROMETER < 30.0 IN.
- C 3
'i0' 'is' %I Y m ,'
30 T O B 1 I
Il!s Yo1 JANUARY FEBRUARY MARCH
FIGURE 10. Spawning e v e n t s , t i d e , r a i n f a l l , a n d b a r o m e t r i c p r e s s u r e d a t a f o r San F r a n c i s c o Bay,
-- O c t o b e r 1 9 8 6 - t o March 1987. W " " -*- '9
r
0 'i: lo 25 30 TT7 lmT 2 7 ' 1 2 m 5-
13
?
I) - I .
,
10 15 2b 25 30 1 1 1 1 1 l r r r r r r f
OCTOBER NOVEMBER DECEMBER
I
c.
I I I I I I ~ - ~ I I I ~ I ~ I I I -*
- 52 -
morning hours after runrise following theee cycle8 are included,
then eight of the 12 major spawns are aseociated with theee
cyclee. Of the four remaining spawns, three were associated with
morning high tides while the other occurred on an afternoon high
tide.
Average highest tide height aesociated with the 12 major
spawns was 5.9 ft. with a range of 4.8 to 6.9 ft. High tides
continue to be a major influence on the timing of spawns in San
Francisco Bay.
Periode of falling barometric preesure (Figure lo), though
numerous, appeared to have little correlation with the onset of
spawning as was seen in the 1981-82 eeason (Reilly and Moore
1983).
Total rainfall during the apawning season amounted to 10.04
in. with the majority (8.3 in.) falling in the laet half of the
eix-month season. Periods of eignificant rainfall ( 20.1 in.)
began in December and were numerous throughout the reet of the
aeaeon (Figure 10). Total rainfall was lees than normal and local
rainfall and delta outflows did little to inhibit spawning
activity as was seen in previous years (Reilly and Moore 1983,
1986). When significant rainfall did occur approximate to a
spawn, a period of high tides at night was also coincident.
DISCUSSION
Hydroacoustic biomass estimates, using the visual
integration technique, have been within 40% of the eum of the
commercial catch and spawn escapement estimates during each of
the paet five eeaeons. In general there hae been good agreement
between the largest schools detected acoustically and the largeet

apawne during a aeaaon. However, eatinatee for individual
echools occasionally have differed widely with the two methods.
For example, after January 23, the end of the largest spawn of
the season, both visual and echo integration methods yielded a
large biomass still present (school 11) in San Francisco Bay.
Spawn surveys found only small quantities of egg deposits on
January 31, date of the next spawn, and landings during the
January 24-31 period were minimal. The concept of discrete
echools may be valid as a spawn occurs, but herring from one
echool, inetead of epawning, nay break off and join an incoming
school of unripe fish, complicating the separation of echoole
acouetically. For most echools, however, temporal and epatial
separations occur and acoustic survey nethode are valid.
Because of the inherent variability in spawn escapement and
acoustic biomass estimation, and because of occasional anomalous
spawning behavior patterns, it is important to continue both
rethode of quantification to obtain the most accurate and
complete interpretation of biomass trends. On two occasions,
schools (2 and 15) were detected acoustically, samples were
obtained, but no spawn was found. Conversely, schools from
October to mid-December are more difficult to monitor
acoustically because of their relatively short residence times in
the bay prior to epawning.
The Alaeke herring fiehery is managed on a real-time baais
since the majority of spawning stocks appear on the grounde
during a rhort time period. The protracted nature of the
epawning season in San Francisco Bay, the longest on the Weet

- 54 - Coast, neceasitatee a management strategy attuned to quota
adjustments for the following maaon after the completion of all
spawns for the present season.
The need for revieion of the biomass estimate from echo
Integration data reeultr from the lack of information on the
acoustical properties of herring specifically from San Francisco
Bay. Since the average length of herring from San Francirco Bay
ie lees than that of Washington, the target etrength value ueed
by Lemberg (1978) may not have been appropriate for biomass
estimates here. A calibration survey is planned for next eeaeon
which hopefully will obtain target etrength values for individual
herring. Since results from echo integration are dependent on
ecaling parameters, a simple multiplicative factor nay be applied
without the need to re-integrate data tapes.
The possibility also exists that daytime deneities of
herring schools in San Francisco Bay are so high as to cause an
acoustic shadowing effect resulting in underestimation of
biomass. The narrow pulse width and high frequency of the echo
rounder were relected to minimize this effect. A night survey is
planned for next seaeon to compare estimates of the same school
in the daytime.
During the procees of echo integration, the operator must
manually "track" the bottom to avoid integrating the relatively
large bottom echo. This nay reeult in either an overestimate in
bionaea, if the botton echo ie frequently integrated, or an
undereetinate if herring close to the bottom are excluded. A e
the skill of the operator irprovee, any bias from this effect
will be minimized.

The 1986-87 herring epawning population in San Francisco Bay
is composed primarily of four recently recruited year classes of
average to above average strength. Results from Bay-Delta
Project trawling in 1986 indicate that recruitment of 2-yr olde
for next season's fishery also may be normal or better. Length-
weight and age-weight relationships are average to above average.
One of the most consistent results during the 6 yr of this study
has been the increase in percentage of females with increased
gill net mesh size. Fishermen could use mesh larger than 2.125
in.and increase the roe content of landed fish.
The gradual switch from 2.25- to 2.125-in.aesh, which began
in the January 1983 gill net fishery, has caused fishing
mortality to increase for 3- and 4-yr old-herring. This may be a
partial cause of the shift of the age class structure to fewer
herring aged 6 yr and older. The proportion dropped from 45 to
54% of the gill net catch (Spratt 1981) during the first two
seasons of the fishery sampled (1977-78, 1978-79) to 7% this
season (Spratt 1987b). Other contributing factors in the present
age class structure are the weakness of the 1981 year class (6-yr
olds) and mortality to the 1980 and older year classes during the
El ~ i z o event.
The need to continue sampling -with both variable-mesh gill
net and midwater trawl is apparent from a comparison with
unbiased roundhaul samples. A better approximation of age class
structure results from combining samples from our two types of
research gear. This also improves the estimation of mean length
and sex ratio for those schools not sampled with roundhaul nets.

- 56 -
Theee values are ueed in the calculation of apawn eecapement
eattimatee.

- 57 -
LITERATURE CITED
Hay, D. E., K. D. Cook, studies of Pacific 4 ) : 191-212.
and C. V. Gissing. 1986. Experimental herring gillnets. Fisheries Research 4(3-
Lenberg, Norm A. 1978. Hydroacoustic assessment of Puget Sound herring, 1972-1978. Washington Dept. Fish., Tech. Rep. No. 41: 1-43.
Reilly, Paul N. and Thomas 0. Moore. 1982. Pacific herring, Cl.upea, h a r e ~ 9 . x pallas,&,., studies in San Francisco Bay, December 1981 to March 1982. Calif. Dept. Fish and Game, Mar. Resources Admin. Rep. No. 82-8: 1-43.
----- . 1983. Pacific herring, Clupea h-arenqus pa&xa,s,i, studies in San Francisco Bay, Monterey Bay, and the Gulf of the Farallones, July 1982 to March 1983. Calif. Dept. Fish and Game, Mar. Resources Admin. Rep. No. 83-5: 1-49.
----- 1984. Pacific herring, Cl.u=aa harrersQuu!. ~ a l l a - a&,. studies in San Francisco Bay, Monterey Bay, and the Gulf of the Farallones May 1983 to March 1984. Calif. Dept. Fish and Game, Mar. Resources Admin. Rep. No. 84-3: 1-67.
----- . 1985. Pacific herring, C_lupupea h_a~e-n>uua.. paUa-s&,,, studies in San Francisco Bay and the Gulf of the Farallonee, June 1984 to March 1985. Calif. Dept. Fish and Game, Mar. Resources Admin. Rep. No. 85-4: 1-73.
----- 1986. Pacific herring, Cl._u~ea haren.~u.s ~-.-l.la-eA., studies in San Francisco Bay, central and northern California, and Washington March 1985 to May 1986. Calif. Dept. Fish and Game. Mar. Resources Admin. Rep. No. 86-6: 1-88.
Spratt, Jerome D. 1981. Status of the Pacific herring, CLupe-a bren4u.s.. pallasi, resources in California 1972 to 1980. Calif. Dept. Fish and Game Fish Bull. 171: 1-107.
----- . 1985. Biomass estimates of Pacific herring, C.l-p,pp_a- h - a - r ~ g u s pallasi , in California from the 1984-85 spawning ground surveys. Calif. Dept. Fish and Game, Mar. Resources Admin. Rep. No. 85-2: 1-27.
----- . 1986. Biomass estimates of Pacific herring, C&uupea. h~,reng,.~s pallas&, in California from the 1985-86 spawning ground surveys. Calif. Dept. Fish and Game, Mar. Resources Admin. Rep. No. 86-3: 1-28.
----- . 1987a. Biomass estimates of har-e_!!iue mla.%L in California surveys. Calif. Dept. Fish and No. 87-12:l-29.
Pacific herring, C! ,e -a , , from the 1986-87 spawning ground Game, Mar. Resources Admin. Rep.

Literature cited (cont'd)
. 1978b. Biological characteristics of the catch from the 1986-87 Pacific herring, Clupea harengus pal.lasi, roe fishery in California. Calif. Dept. Fish and Game, Mar. Resources Admin. Rep. No. 87-13:l-

APPENDIX A . Summary of Adult Herring Samplee from San Francieco Bay, October 1986 to March 1987.
Sample Number Number Assigned n x b e r Date Location Gear measured a-d echo01 num-ber-
Oct 27 Oct 29 Nov 17 Nov 19 Nov 20 Dec 1 Dec 1 Dec 1 Dec 1 Dec 2 Dec 3 Dec 3 Dec 8 Dec 9 Dec 10 Dec 12 Dec 12 Dec 15 Dec 15 Dec 16 Dec 16 Dec 16 Dec 24 Dec 27 Dec 27 Dec 27 Dec 30 Dec 30 Jan 4 Jan 4 Jan 5 Jan 5 Jan 5 Jan 7 Jan 9 Jan 9 Jan 12 Jan 12 Jan 13 Jan 13 Jan 14 Jan 14 Jan 19 Jan 19 Jan 20 Jan 21 Jan 21 Jan 21 Jan 21
KC KC PP BELV BELV SB SB SB SB SB SB SB SB SF YBI RAC BELV SB SB YBI YBI YBI RAC YBI YBI YBI SF SF BELV SF TIB TIB BELV TIB A 1 A1 SB SB PP PP SB HP ALC SB SB SF SF SF SF
GN GN GN GN GN MT MT GN CGN CGN CGN MT CGN GN GN MT GN CGN CGN MT MT MT MT MT MT GN MT MT GN MT CGN RH GN CGN GN GN MT GN MT RH CGN C G ~ RH CGN CGN RH RH RH GN

APPENDIX A . (cont'd)
Sample Number Number Aseigned number Date Location Gear meaeured aged echool number
Jan 21 Jan 23 Jan 23 Jan 26 Jan 26 Jan 28 Jan 28 Jan 28 Jan 30 Jan 3 0 Feb 2 Feb 2 Feb 3 Fetr 3 Feb 6 Feb 6 Feb 9 Feb 10 Feb 10 Feb 10 Feb 12 Feb 16 Feb 16 Feb 16 Feb 18 Feb 19 Feb 20 Feb 20 Feb 24 Feb 25 Mar 2 Mar 10 Mar 10 Mar 11 Mar 11 Mar 12 Mar 13
SB SB ALC SAUS YBI SAUS SAUS SAUS SB SAUS SAUS SAUS HR SAUS SF SF SAUS TIB TIB TIB SB A1 A1 HP ALC ALC PP A1 TIB HP PP SAUS SAUS SAUS SAUS SAUS PP
Mar 16 ~ % ! - - - - - PP MT 127 4 15
Legend: AI-Angel Ieland; ALC-Alcatraz; BELV-Belvedere Cove; HP-Huntere Point; HR-Harding Rock Buoy; PP-Peninsula Point; RAC-Raccoon Strait; SAUS-Sauealito to Pt. Cavallo; SB-South Sen Francieco Bay between Oakland- Bay Bridge and Huntere Point; SF-San Francieco between Oakland-Bay Bridge and Golden Gate Bridge; TIB- Tiburon; YBI-Yerba Buena Ieland.
Legend: CGN-commercial gill net, 2.125-in.meeh GN-5-panel gill net, mesh eizee 1.5, 1.75, 2.0, 2.25,

- 61 - APPENDIX A. (cant'd)
2 .5 in. MT- 12- by 12-ft (mouth opening) midwater trawl RH- cormcrcial purse seine or lampara net
&one of three parts of sample.

APPENDIX B. Number of Pacific Herring by Body Length 12-mm Intervale) from Variable-meah Gill Net Samples in San Francisco Bay, October 28, 1986 to February 25, 1987.
Body length Sample number (mm) --.. 454 455 456 457 458 461 467 468 470- 479 130-139 140-149 150-151 152 154 156 158 160 162 164 166 168 170 172 174 176 178 180 182 184 186 188 190 192 194 196 198 200 202 204 206 208 210 212 214 216 218 220 222 224 226 228 230 232
N Mean

APPENDIX B. (cont'd) 3
Body length Sample number (nut) 482 486 488 489 491 502 503 510 516 522
Mean 183.1 184.4 184.9 179.6 179.6 175.3 181.9 178.8 177.0 177.9

APENDIX B. (cont'd)
N Mean

APPENDIX C. Number of Pacific Herring by Body Length (2-sn~ Intexvaiaj from Midwater T r a w l Samples i n San Francibco Bay, December 1, 1986 to March 16, 1987.
Body length Sample number 473- (mm) --. -----.------------ 459 460 465 469 473 474 47% 475 476 4zT
144 146 148 150 152 154 156 158 160 162 164 166 168 170 172 174 176 178 180 182 184 186 188 190 192 194 196 198 200 202 204 206 208 210 212 214 216 218 220 222 224 230
N Mean
APPENDIX C. (cont'd)
Body length Sample number (nm) -- 4.78 48_0 481 483 490 492 505 517 518 524 130-139 140-141 142 144 146 148 150 152 154 156 158 160 162 164 166 168 170 172 174 176 178 180 182 184 186 188 190 192 194 196 198 200 202 204 206 208 210 212 216 220 2* N Mean

APPENDIX C. (cont'd)
Body length Sample number (mm) -.- 533 5 3 9 540 130-139 1 1 140-141 142 1 144 1 146 1 148 1 150 152 1 154 1 156 3 158 4 160 7 162 6 164 9 166 9 168 7 170 9 172 5 174 3 176 7 178 1 180 4 182 8 184 3 186 2 188 2 190 8 192 3 194 1 196 4 198 5 200 2 202 1 204 1 206 3 208 210 1 212 1 2& L. N 29 127 Mean 183.4 176.0

APPENDIX D. Number of Pacific Herring by Body Length (2-mm Intervale) from Puree Seine and Lampara Net Sample8 in San Francisco Bay, January 5 to March 12, 1987.
Body length Sample number (mm) - - 485 493 496 499 500 50s 504 506 507 508
142 144 146 148 150 152 154 156 158 160 162 164 166 168 170 172 174 176 178 180 182 184 186 188 190 192 194 196 198 200 202 204 206 208 210 212 214 216 220 226 N Mean

APPENDIX D (cont'd)
Body length Sample number .<-?!m? -.-..----- 509 - ----....-.---.-.-.--. 511 512 51-3 s.$-4 5.2-5-. 5.1 9 52 i 5 2 3 130-139 2 2
520 1 1
140-141 2 2 1 1 1 142 144 146 148 150 152 154 156 158 160 162 164 166 168 170 172 174 176 178 180 282 284 186 188 190 192 194 196 198 200 202 204 206 208 210 212 214 216 218 N Mean

APPENDIX D.(cont'd)
Body length Sample number (mm) 526 527 528 529 534 535 536 . . - . ". ---.--" ...--..,,--. --.-.. . - . . . . . . - - .- 538 537 . . . . . .
3 5 1 3
142 144 146 148 150 152 154 156 158 160 162 164 166 168 170 172 174 176 178 180 182 184 186 188 190 192 194 196 198 200 202 204 206 208 210 212 214 216 N Mean

- 71 - - - APPENDIX E. Number of Pacific Herring by Body Length (2-ma Intervals)
from Commercial Gill Net Samples in San Francirco Bay, December 1, 1986 to January 20, 1987.
I
164-165 166 168 170 172 174 176 178 180 182 184 186 188 190 192 194 196 198 200 202 204 206 208 210 212 214 216 218 220 222 224 226 228 230 N Mean

APPENDIX E. (Cont'd)
Body length Sample number (mm) -- 497 498 168-169 1 170 172 174 176 178 180 182 184 186 188 190 192 194 196 198 200 202 204 206 208 210 212 214 216 218 N Mean

APPENDIX F. Estimated Weight at Length for Pacific Herring from San Francisco Bay,
Body lenuth (mm) Mg&es Fe.ma1ee Both.
Body lenuth(mrn) Malee Females Bat-h

APPENDIX G. Number of Pacific Herring at Age by Body Length ( 2 - m m Intervale) for Selected Fieh from San Francisco Bay, December 1986 to February 1987.


